West Jefferson, NC Map & Demographics
West Jefferson Map
West Jefferson Overview
$23,043
PER CAPITA INCOME
$74,750
AVG FAMILY INCOME
$41,036
AVG HOUSEHOLD INCOME
8.0%
WAGE / INCOME GAP [ % ]
92.0¢/ $1
WAGE / INCOME GAP [ $ ]
0.47
INEQUALITY / GINI INDEX
1,508
TOTAL POPULATION
622
MALE POPULATION
886
FEMALE POPULATION
70.20
MALES / 100 FEMALES
142.44
FEMALES / 100 MALES
43.4
MEDIAN AGE
3.8
AVG FAMILY SIZE
2.6
AVG HOUSEHOLD SIZE
756
LABOR FORCE [ PEOPLE ]
58.8%
PERCENT IN LABOR FORCE
22.3%
UNEMPLOYMENT RATE
West Jefferson Zip Codes
West Jefferson Area Codes
Income in West Jefferson
Income Overview in West Jefferson
Per Capita Income in West Jefferson is $23,043, while median incomes of families and households are $74,750 and $41,036 respectively.
| Characteristic | Number | Measure |
| Per Capita Income | 1,508 | $23,043 |
| Median Family Income | 296 | $74,750 |
| Mean Family Income | 296 | $82,350 |
| Median Household Income | 539 | $41,036 |
| Mean Household Income | 539 | $58,136 |
| Income Deficit | 296 | $0 |
| Wage / Income Gap (%) | 1,508 | 8.04% |
| Wage / Income Gap ($) | 1,508 | 91.96¢ per $1 |
| Gini / Inequality Index | 1,508 | 0.47 |
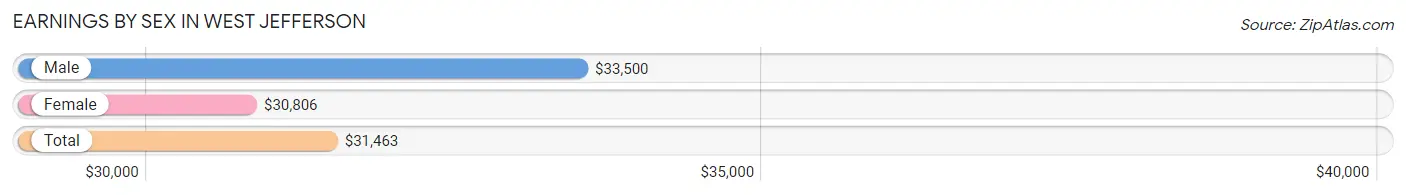
Earnings by Sex in West Jefferson
Average Earnings in West Jefferson are $31,463, $33,500 for men and $30,806 for women, a difference of 8.0%.
| Sex | Number | Average Earnings |
| Male | 286 (44.6%) | $33,500 |
| Female | 355 (55.4%) | $30,806 |
| Total | 641 (100.0%) | $31,463 |
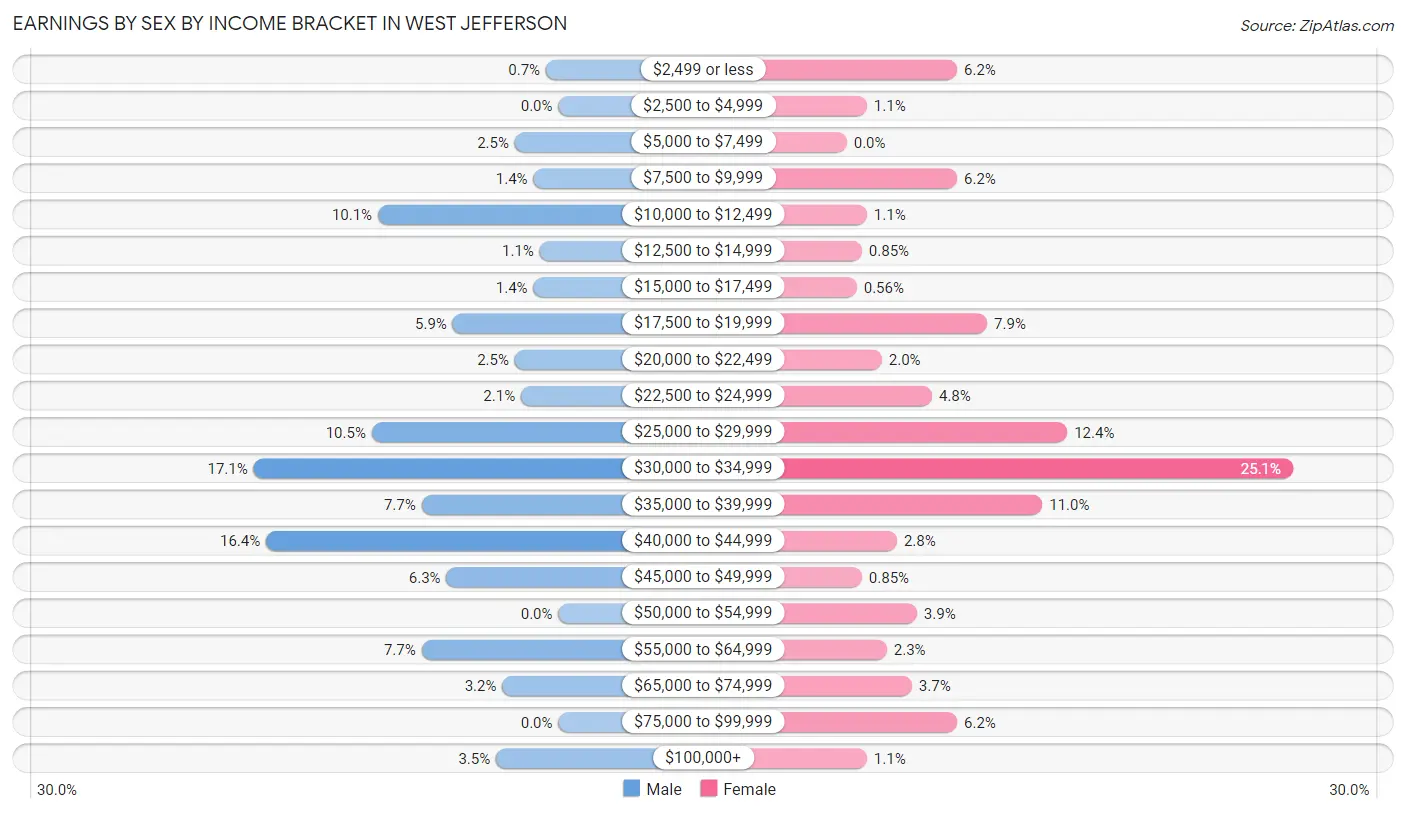
Earnings by Sex by Income Bracket in West Jefferson
The most common earnings brackets in West Jefferson are $30,000 to $34,999 for men (49 | 17.1%) and $30,000 to $34,999 for women (89 | 25.1%).
| Income | Male | Female |
| $2,499 or less | 2 (0.7%) | 22 (6.2%) |
| $2,500 to $4,999 | 0 (0.0%) | 4 (1.1%) |
| $5,000 to $7,499 | 7 (2.5%) | 0 (0.0%) |
| $7,500 to $9,999 | 4 (1.4%) | 22 (6.2%) |
| $10,000 to $12,499 | 29 (10.1%) | 4 (1.1%) |
| $12,500 to $14,999 | 3 (1.1%) | 3 (0.9%) |
| $15,000 to $17,499 | 4 (1.4%) | 2 (0.6%) |
| $17,500 to $19,999 | 17 (5.9%) | 28 (7.9%) |
| $20,000 to $22,499 | 7 (2.5%) | 7 (2.0%) |
| $22,500 to $24,999 | 6 (2.1%) | 17 (4.8%) |
| $25,000 to $29,999 | 30 (10.5%) | 44 (12.4%) |
| $30,000 to $34,999 | 49 (17.1%) | 89 (25.1%) |
| $35,000 to $39,999 | 22 (7.7%) | 39 (11.0%) |
| $40,000 to $44,999 | 47 (16.4%) | 10 (2.8%) |
| $45,000 to $49,999 | 18 (6.3%) | 3 (0.9%) |
| $50,000 to $54,999 | 0 (0.0%) | 14 (3.9%) |
| $55,000 to $64,999 | 22 (7.7%) | 8 (2.2%) |
| $65,000 to $74,999 | 9 (3.2%) | 13 (3.7%) |
| $75,000 to $99,999 | 0 (0.0%) | 22 (6.2%) |
| $100,000+ | 10 (3.5%) | 4 (1.1%) |
| Total | 286 (100.0%) | 355 (100.0%) |
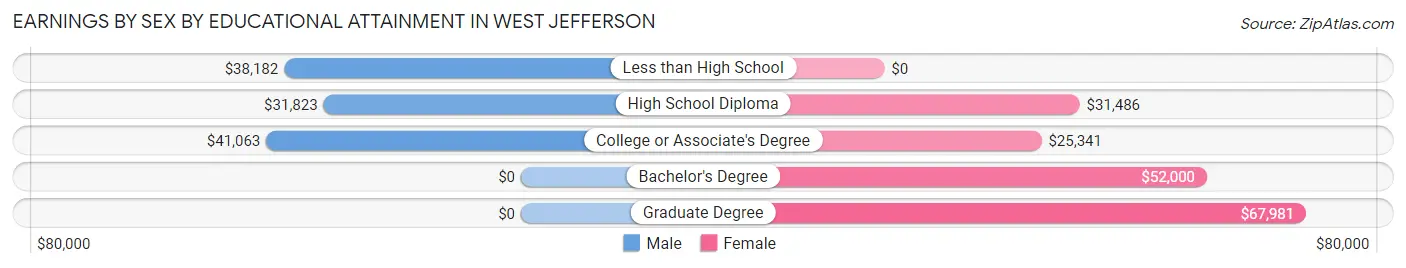
Earnings by Sex by Educational Attainment in West Jefferson
Average earnings in West Jefferson are $36,023 for men and $31,069 for women, a difference of 13.8%. Men with an educational attainment of college or associate's degree enjoy the highest average annual earnings of $41,063, while those with high school diploma education earn the least with $31,823. Women with an educational attainment of graduate degree earn the most with the average annual earnings of $67,981, while those with college or associate's degree education have the smallest earnings of $25,341.
| Educational Attainment | Male Income | Female Income |
| Less than High School | $38,182 | $0 |
| High School Diploma | $31,823 | $31,486 |
| College or Associate's Degree | $41,063 | $25,341 |
| Bachelor's Degree | - | - |
| Graduate Degree | - | - |
| Total | $36,023 | $31,069 |
Family Income in West Jefferson
Family Income Brackets in West Jefferson
According to the West Jefferson family income data, there are 71 families falling into the $100,000 to $149,999 income range, which is the most common income bracket and makes up 24.0% of all families. Conversely, the $10,000 to $14,999 income bracket is the least frequent group with only 4 families (1.3%) belonging to this category.
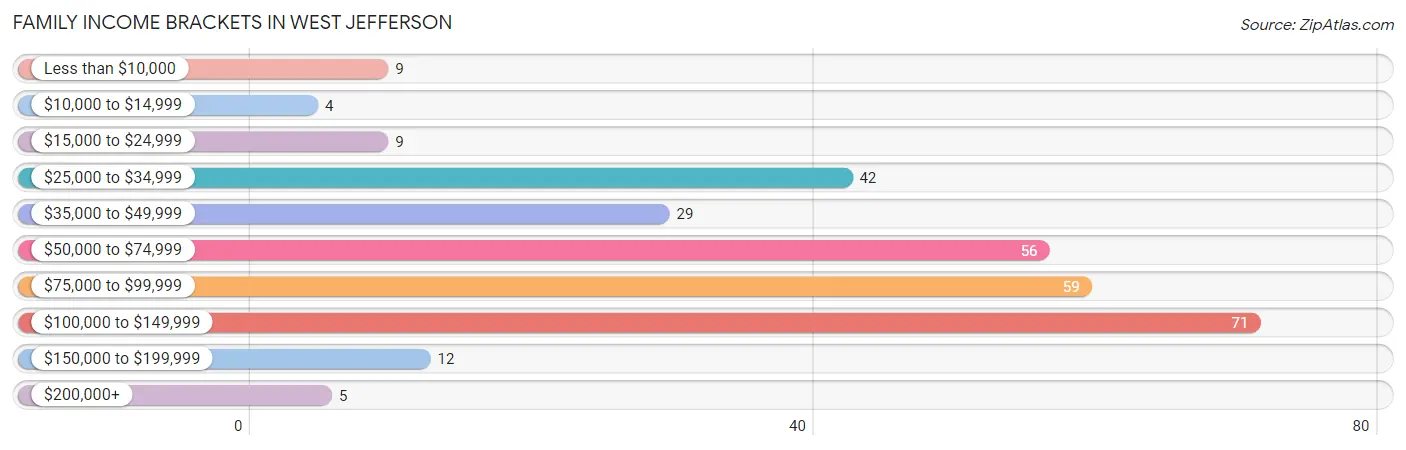
| Income Bracket | # Families | % Families |
| Less than $10,000 | 9 | 3.0% |
| $10,000 to $14,999 | 4 | 1.4% |
| $15,000 to $24,999 | 9 | 3.0% |
| $25,000 to $34,999 | 42 | 14.2% |
| $35,000 to $49,999 | 29 | 9.8% |
| $50,000 to $74,999 | 56 | 18.9% |
| $75,000 to $99,999 | 59 | 19.9% |
| $100,000 to $149,999 | 71 | 24.0% |
| $150,000 to $199,999 | 12 | 4.1% |
| $200,000+ | 5 | 1.7% |
Family Income by Famaliy Size in West Jefferson
5-person families (24 | 8.1%) account for the highest median family income in West Jefferson with $115,385 per family, while 2-person families (132 | 44.6%) have the highest median income of $31,500 per family member.
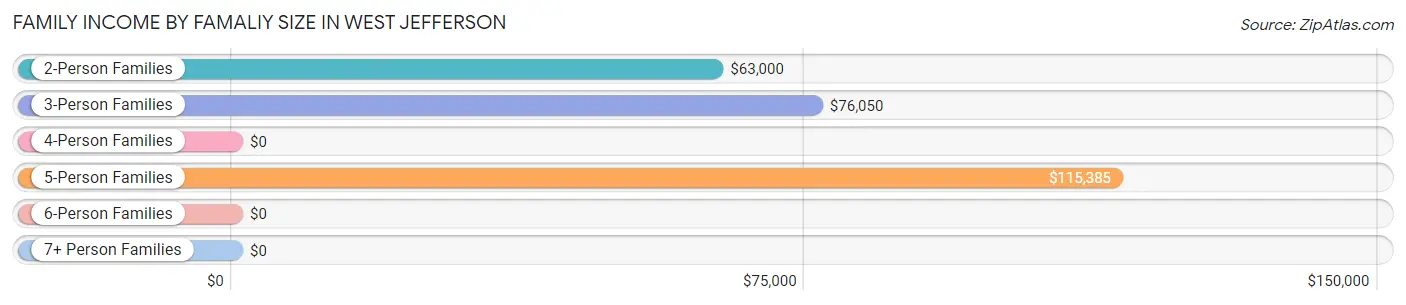
| Income Bracket | # Families | Median Income |
| 2-Person Families | 132 (44.6%) | $63,000 |
| 3-Person Families | 109 (36.8%) | $76,050 |
| 4-Person Families | 25 (8.5%) | $0 |
| 5-Person Families | 24 (8.1%) | $115,385 |
| 6-Person Families | 0 (0.0%) | $0 |
| 7+ Person Families | 6 (2.0%) | $0 |
| Total | 296 (100.0%) | $74,750 |
Family Income by Number of Earners in West Jefferson
The median family income in West Jefferson is $74,750, with families comprising 3+ earners (40) having the highest median family income of $143,000, while families with no earners (58) have the lowest median family income of $34,318, accounting for 13.5% and 19.6% of families, respectively.
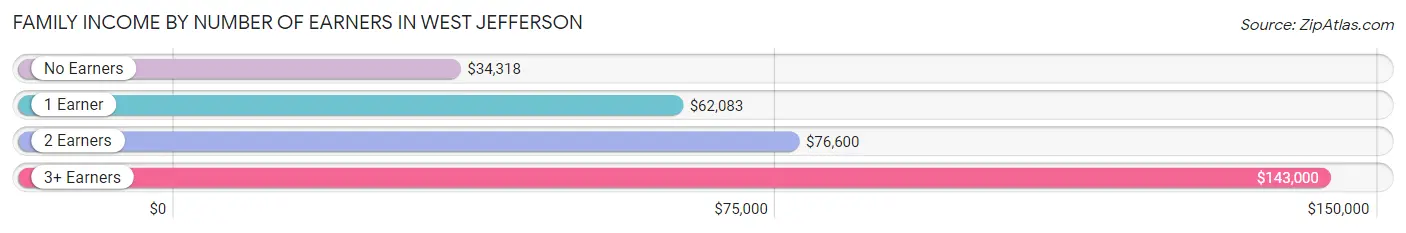
| Number of Earners | # Families | Median Income |
| No Earners | 58 (19.6%) | $34,318 |
| 1 Earner | 90 (30.4%) | $62,083 |
| 2 Earners | 108 (36.5%) | $76,600 |
| 3+ Earners | 40 (13.5%) | $143,000 |
| Total | 296 (100.0%) | $74,750 |
Household Income in West Jefferson
Household Income Brackets in West Jefferson
With 82 households falling in the category, the $15,000 to $24,999 income range is the most frequent in West Jefferson, accounting for 15.2% of all households. In contrast, only 5 households (0.9%) fall into the $200,000+ income bracket, making it the least populous group.
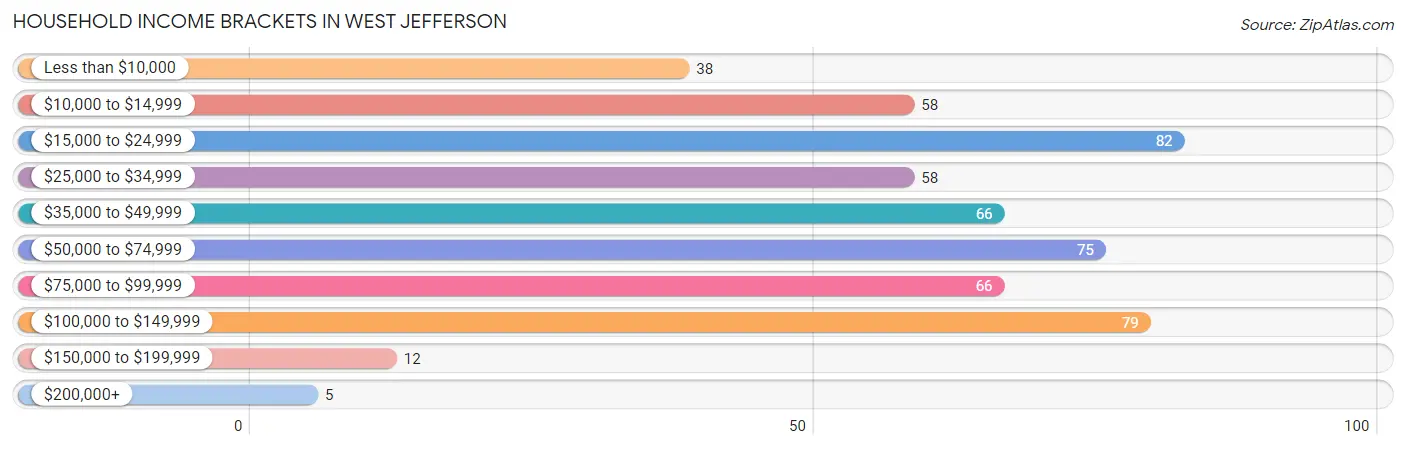
| Income Bracket | # Households | % Households |
| Less than $10,000 | 38 | 7.1% |
| $10,000 to $14,999 | 58 | 10.8% |
| $15,000 to $24,999 | 82 | 15.2% |
| $25,000 to $34,999 | 58 | 10.8% |
| $35,000 to $49,999 | 66 | 12.2% |
| $50,000 to $74,999 | 75 | 13.9% |
| $75,000 to $99,999 | 66 | 12.2% |
| $100,000 to $149,999 | 79 | 14.7% |
| $150,000 to $199,999 | 12 | 2.2% |
| $200,000+ | 5 | 0.9% |
Household Income by Householder Age in West Jefferson
The median household income in West Jefferson is $41,036, with the highest median household income of $75,054 found in the 45 to 64 years age bracket for the primary householder. A total of 183 households (34.0%) fall into this category. Meanwhile, the 15 to 24 years age bracket for the primary householder has the lowest median household income of $0, with 7 households (1.3%) in this group.
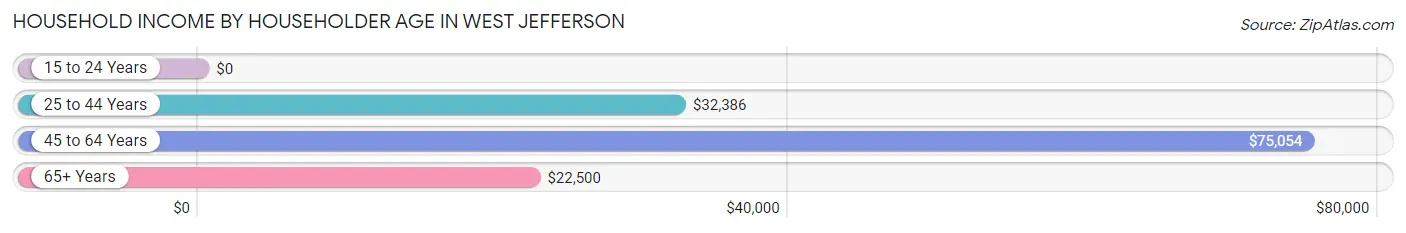
| Income Bracket | # Households | Median Income |
| 15 to 24 Years | 7 (1.3%) | $0 |
| 25 to 44 Years | 155 (28.8%) | $32,386 |
| 45 to 64 Years | 183 (34.0%) | $75,054 |
| 65+ Years | 194 (36.0%) | $22,500 |
| Total | 539 (100.0%) | $41,036 |
Poverty in West Jefferson
Income Below Poverty by Sex and Age in West Jefferson
With 14.1% poverty level for males and 19.4% for females among the residents of West Jefferson, 5 year old males and 5 year old females are the most vulnerable to poverty, with 5 males (100.0%) and 24 females (58.5%) in their respective age groups living below the poverty level.
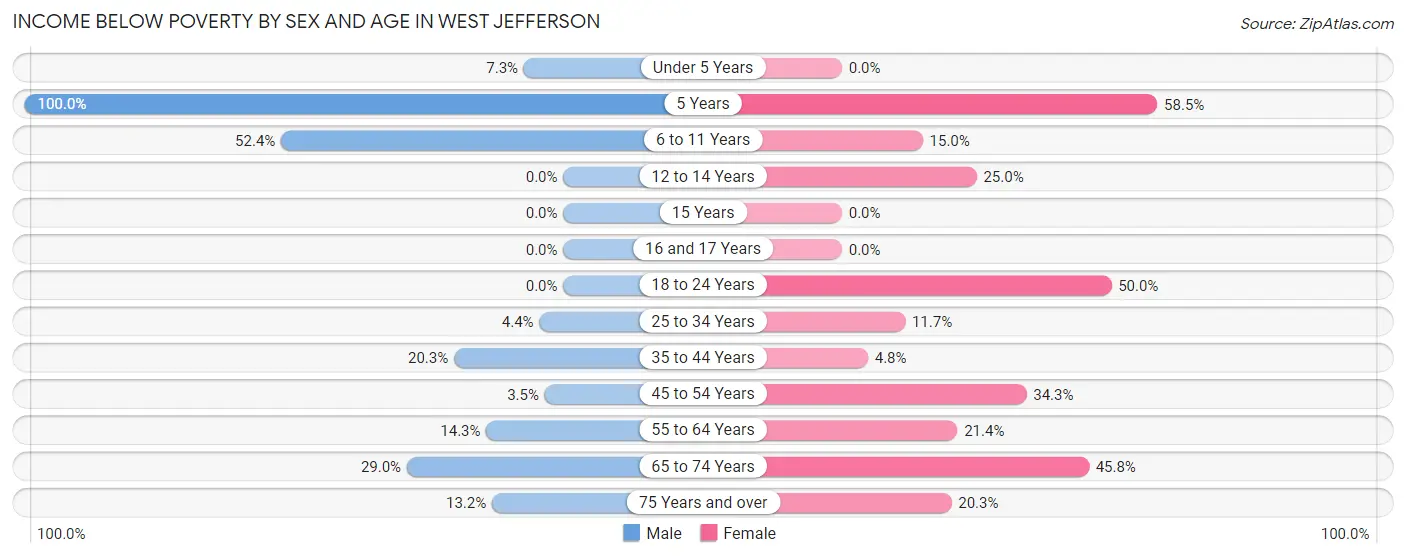
| Age Bracket | Male | Female |
| Under 5 Years | 3 (7.3%) | 0 (0.0%) |
| 5 Years | 5 (100.0%) | 24 (58.5%) |
| 6 to 11 Years | 22 (52.4%) | 6 (15.0%) |
| 12 to 14 Years | 0 (0.0%) | 3 (25.0%) |
| 15 Years | 0 (0.0%) | 0 (0.0%) |
| 16 and 17 Years | 0 (0.0%) | 0 (0.0%) |
| 18 to 24 Years | 0 (0.0%) | 7 (50.0%) |
| 25 to 34 Years | 2 (4.4%) | 23 (11.7%) |
| 35 to 44 Years | 14 (20.3%) | 8 (4.8%) |
| 45 to 54 Years | 4 (3.5%) | 25 (34.3%) |
| 55 to 64 Years | 9 (14.3%) | 18 (21.4%) |
| 65 to 74 Years | 18 (29.0%) | 22 (45.8%) |
| 75 Years and over | 9 (13.2%) | 25 (20.3%) |
| Total | 86 (14.1%) | 161 (19.4%) |
Income Above Poverty by Sex and Age in West Jefferson
According to the poverty statistics in West Jefferson, males aged 12 to 14 years and females aged under 5 years are the age groups that are most secure financially, with 100.0% of males and 100.0% of females in these age groups living above the poverty line.
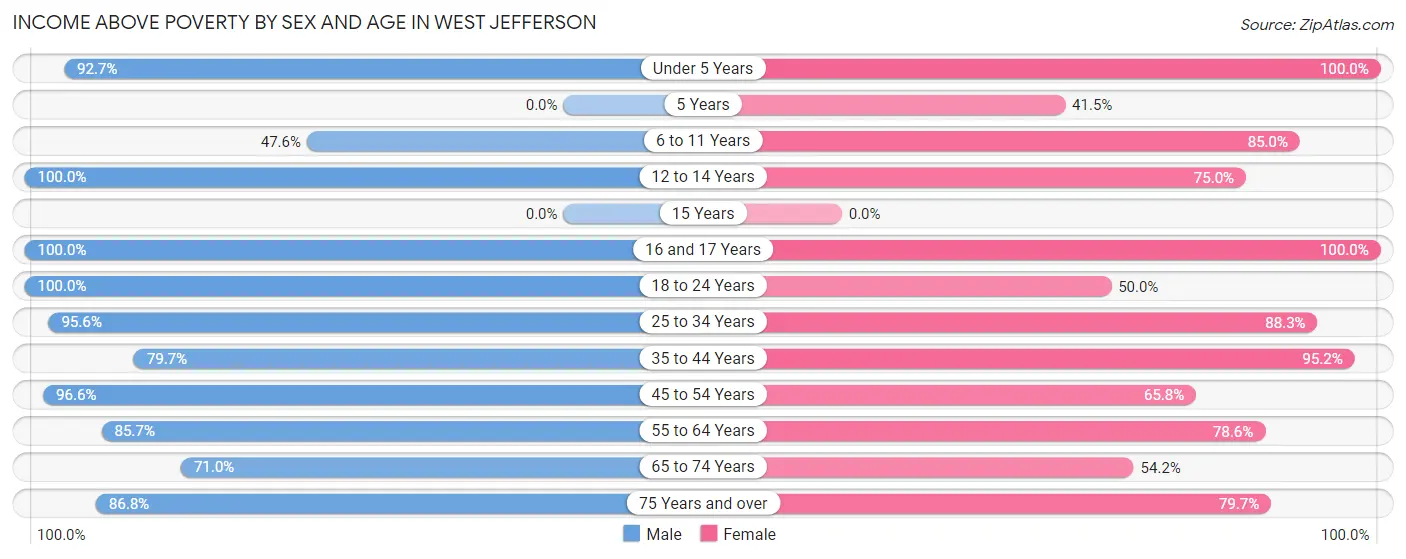
| Age Bracket | Male | Female |
| Under 5 Years | 38 (92.7%) | 14 (100.0%) |
| 5 Years | 0 (0.0%) | 17 (41.5%) |
| 6 to 11 Years | 20 (47.6%) | 34 (85.0%) |
| 12 to 14 Years | 24 (100.0%) | 9 (75.0%) |
| 15 Years | 0 (0.0%) | 0 (0.0%) |
| 16 and 17 Years | 13 (100.0%) | 21 (100.0%) |
| 18 to 24 Years | 63 (100.0%) | 7 (50.0%) |
| 25 to 34 Years | 43 (95.6%) | 173 (88.3%) |
| 35 to 44 Years | 55 (79.7%) | 158 (95.2%) |
| 45 to 54 Years | 112 (96.6%) | 48 (65.7%) |
| 55 to 64 Years | 54 (85.7%) | 66 (78.6%) |
| 65 to 74 Years | 44 (71.0%) | 26 (54.2%) |
| 75 Years and over | 59 (86.8%) | 98 (79.7%) |
| Total | 525 (85.9%) | 671 (80.6%) |
Income Below Poverty Among Married-Couple Families in West Jefferson
The poverty statistics for married-couple families in West Jefferson show that 6.2% or 15 of the total 240 families live below the poverty line. Families with 1 or 2 children have the highest poverty rate of 21.4%, comprising of 15 families. On the other hand, families with no children have the lowest poverty rate of 0.0%, which includes 0 families.
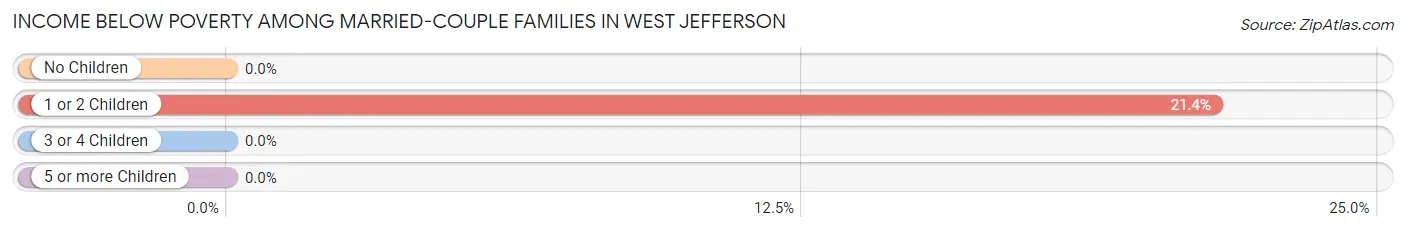
| Children | Above Poverty | Below Poverty |
| No Children | 150 (100.0%) | 0 (0.0%) |
| 1 or 2 Children | 55 (78.6%) | 15 (21.4%) |
| 3 or 4 Children | 20 (100.0%) | 0 (0.0%) |
| 5 or more Children | 0 (0.0%) | 0 (0.0%) |
| Total | 225 (93.8%) | 15 (6.2%) |
Income Below Poverty Among Single-Parent Households in West Jefferson
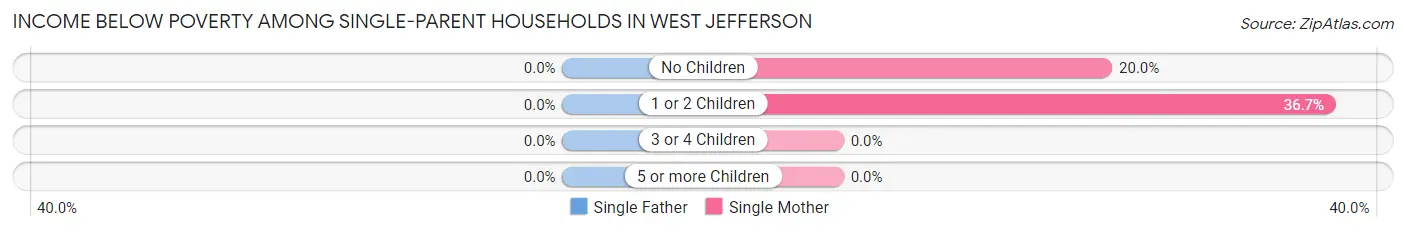
| Children | Single Father | Single Mother |
| No Children | 0 (0.0%) | 4 (20.0%) |
| 1 or 2 Children | 0 (0.0%) | 11 (36.7%) |
| 3 or 4 Children | 0 (0.0%) | 0 (0.0%) |
| 5 or more Children | 0 (0.0%) | 0 (0.0%) |
| Total | 0 (0.0%) | 15 (30.0%) |
Income Below Poverty Among Married-Couple vs Single-Parent Households in West Jefferson
The poverty data for West Jefferson shows that 15 of the married-couple family households (6.2%) and 15 of the single-parent households (26.8%) are living below the poverty level. Within the married-couple family households, those with 1 or 2 children have the highest poverty rate, with 15 households (21.4%) falling below the poverty line. Among the single-parent households, those with 1 or 2 children have the highest poverty rate, with 11 household (36.7%) living below poverty.
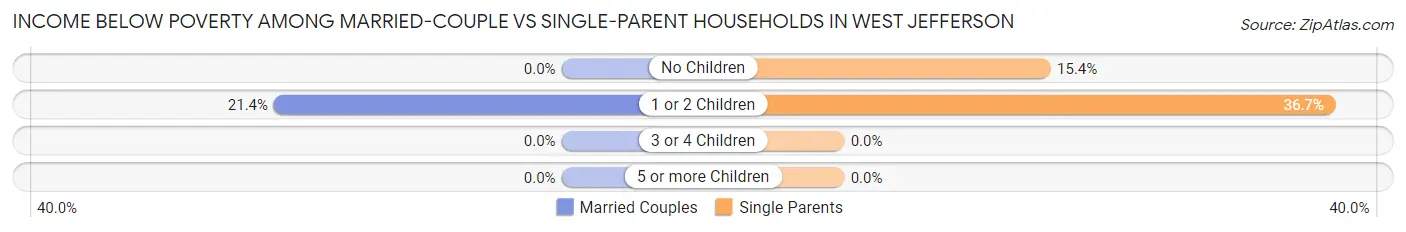
| Children | Married-Couple Families | Single-Parent Households |
| No Children | 0 (0.0%) | 4 (15.4%) |
| 1 or 2 Children | 15 (21.4%) | 11 (36.7%) |
| 3 or 4 Children | 0 (0.0%) | 0 (0.0%) |
| 5 or more Children | 0 (0.0%) | 0 (0.0%) |
| Total | 15 (6.2%) | 15 (26.8%) |
Race in West Jefferson
The most populous races in West Jefferson are White / Caucasian (1,253 | 83.1%), Black / African American (137 | 9.1%), and Two or more Races (90 | 6.0%).
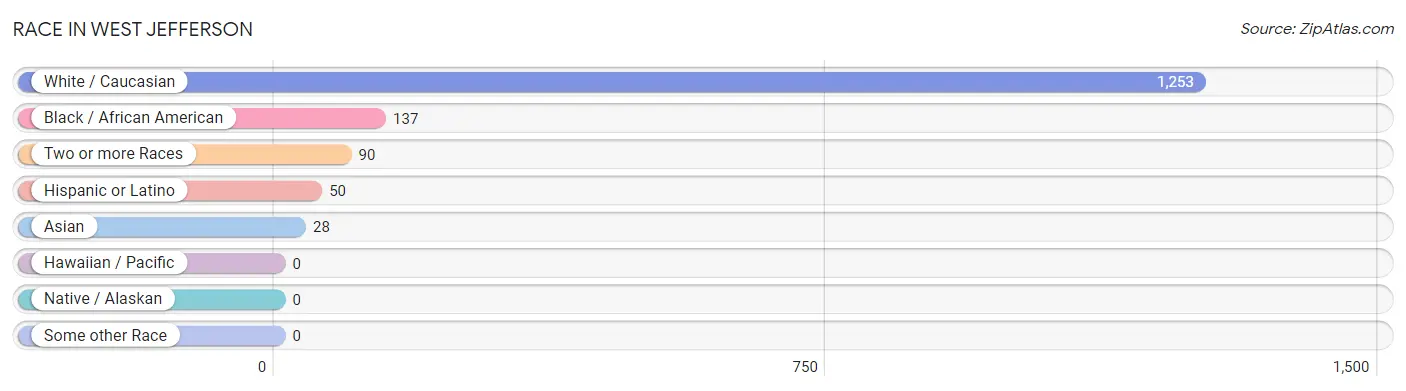
| Race | # Population | % Population |
| Asian | 28 | 1.9% |
| Black / African American | 137 | 9.1% |
| Hawaiian / Pacific | 0 | 0.0% |
| Hispanic or Latino | 50 | 3.3% |
| Native / Alaskan | 0 | 0.0% |
| White / Caucasian | 1,253 | 83.1% |
| Two or more Races | 90 | 6.0% |
| Some other Race | 0 | 0.0% |
| Total | 1,508 | 100.0% |
Ancestry in West Jefferson
The most populous ancestries reported in West Jefferson are American (601 | 39.9%), English (245 | 16.3%), Irish (180 | 11.9%), German (167 | 11.1%), and Mexican (39 | 2.6%), together accounting for 81.7% of all West Jefferson residents.
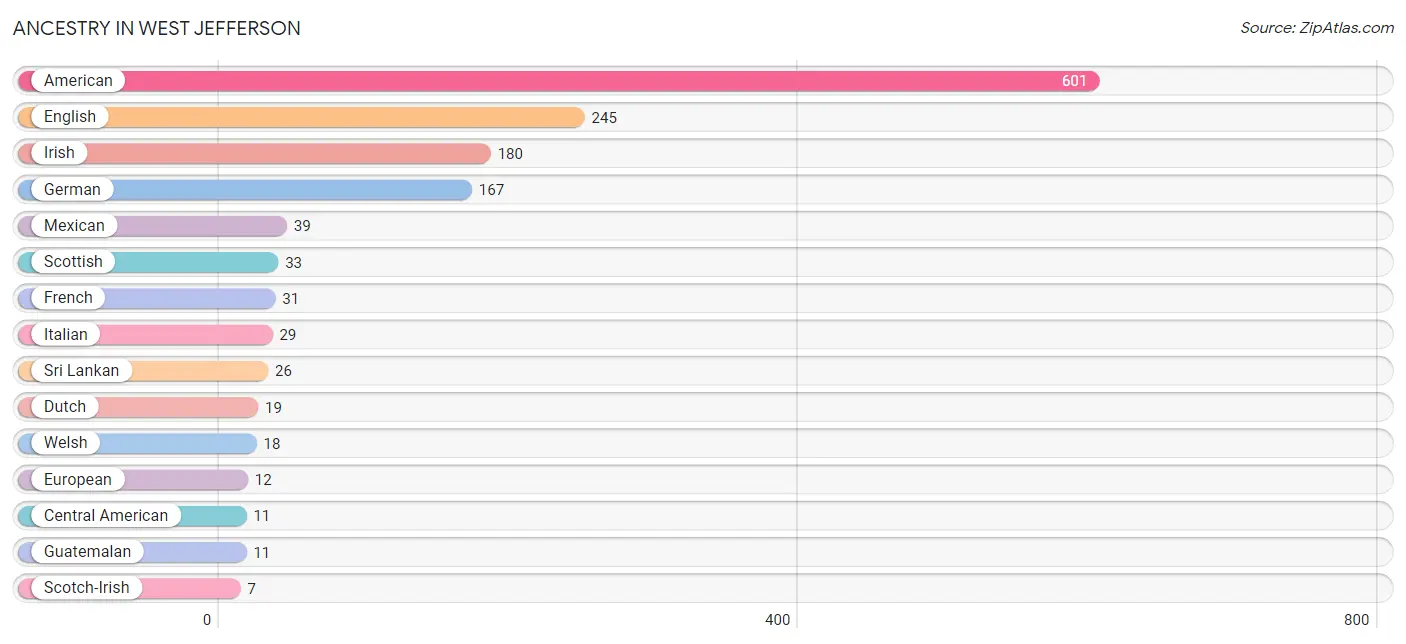
| Ancestry | # Population | % Population |
| American | 601 | 39.9% |
| Central American | 11 | 0.7% |
| Danish | 5 | 0.3% |
| Dutch | 19 | 1.3% |
| English | 245 | 16.3% |
| European | 12 | 0.8% |
| Finnish | 4 | 0.3% |
| French | 31 | 2.1% |
| German | 167 | 11.1% |
| Greek | 6 | 0.4% |
| Guatemalan | 11 | 0.7% |
| Irish | 180 | 11.9% |
| Italian | 29 | 1.9% |
| Korean | 5 | 0.3% |
| Mexican | 39 | 2.6% |
| Polish | 5 | 0.3% |
| Scandinavian | 4 | 0.3% |
| Scotch-Irish | 7 | 0.5% |
| Scottish | 33 | 2.2% |
| Sri Lankan | 26 | 1.7% |
| Welsh | 18 | 1.2% | View All 21 Rows |
Immigrants in West Jefferson
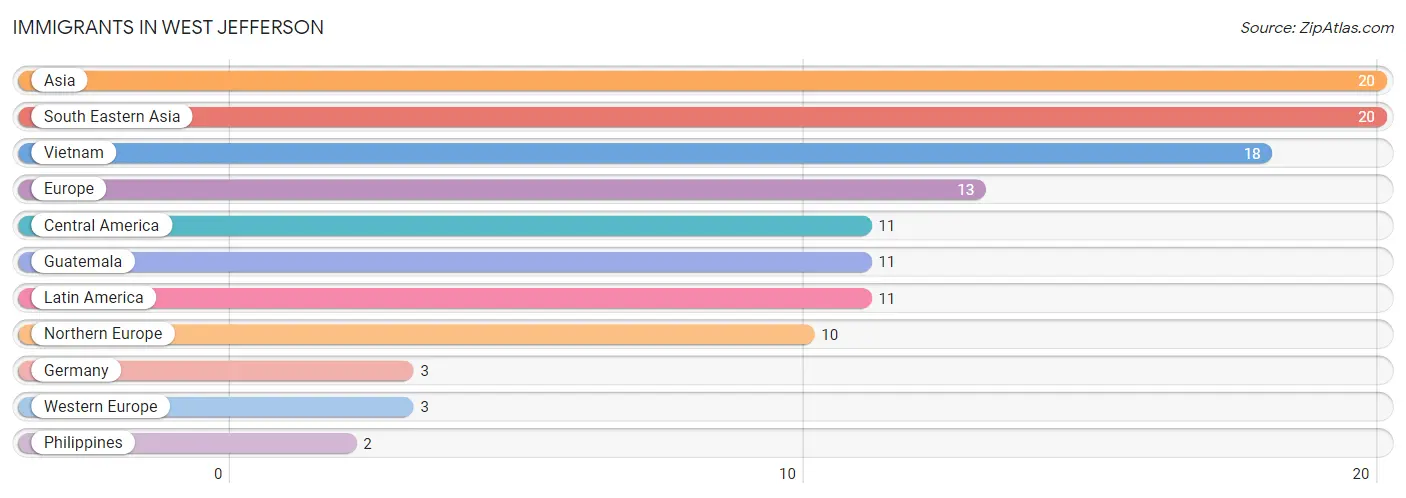
The most numerous immigrant groups reported in West Jefferson came from Asia (20 | 1.3%), South Eastern Asia (20 | 1.3%), Vietnam (18 | 1.2%), Europe (13 | 0.9%), and Central America (11 | 0.7%), together accounting for 5.4% of all West Jefferson residents.
| Immigration Origin | # Population | % Population |
| Asia | 20 | 1.3% |
| Central America | 11 | 0.7% |
| Europe | 13 | 0.9% |
| Germany | 3 | 0.2% |
| Guatemala | 11 | 0.7% |
| Latin America | 11 | 0.7% |
| Northern Europe | 10 | 0.7% |
| Philippines | 2 | 0.1% |
| South Eastern Asia | 20 | 1.3% |
| Vietnam | 18 | 1.2% |
| Western Europe | 3 | 0.2% | View All 11 Rows |
Sex and Age in West Jefferson
Sex and Age in West Jefferson
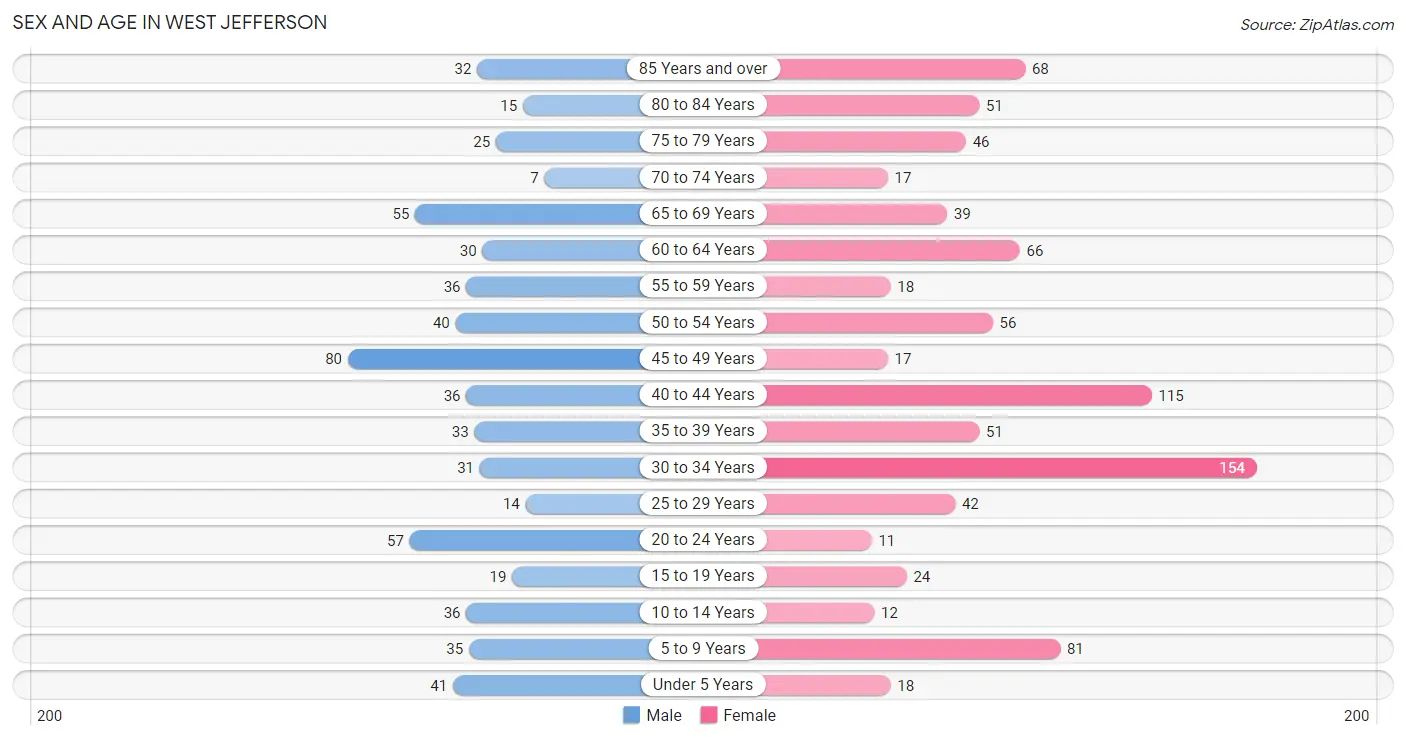
The most populous age groups in West Jefferson are 45 to 49 Years (80 | 12.9%) for men and 30 to 34 Years (154 | 17.4%) for women.
| Age Bracket | Male | Female |
| Under 5 Years | 41 (6.6%) | 18 (2.0%) |
| 5 to 9 Years | 35 (5.6%) | 81 (9.1%) |
| 10 to 14 Years | 36 (5.8%) | 12 (1.3%) |
| 15 to 19 Years | 19 (3.0%) | 24 (2.7%) |
| 20 to 24 Years | 57 (9.2%) | 11 (1.2%) |
| 25 to 29 Years | 14 (2.2%) | 42 (4.7%) |
| 30 to 34 Years | 31 (5.0%) | 154 (17.4%) |
| 35 to 39 Years | 33 (5.3%) | 51 (5.8%) |
| 40 to 44 Years | 36 (5.8%) | 115 (13.0%) |
| 45 to 49 Years | 80 (12.9%) | 17 (1.9%) |
| 50 to 54 Years | 40 (6.4%) | 56 (6.3%) |
| 55 to 59 Years | 36 (5.8%) | 18 (2.0%) |
| 60 to 64 Years | 30 (4.8%) | 66 (7.4%) |
| 65 to 69 Years | 55 (8.8%) | 39 (4.4%) |
| 70 to 74 Years | 7 (1.1%) | 17 (1.9%) |
| 75 to 79 Years | 25 (4.0%) | 46 (5.2%) |
| 80 to 84 Years | 15 (2.4%) | 51 (5.8%) |
| 85 Years and over | 32 (5.1%) | 68 (7.7%) |
| Total | 622 (100.0%) | 886 (100.0%) |
Families and Households in West Jefferson
Median Family Size in West Jefferson
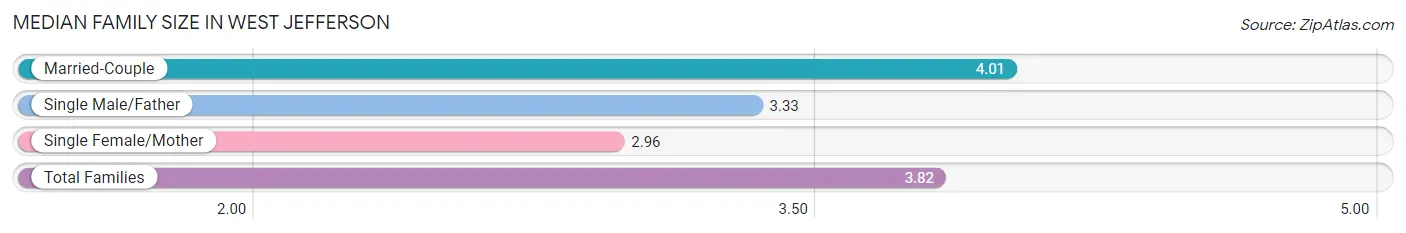
The median family size in West Jefferson is 3.82 persons per family, with married-couple families (240 | 81.1%) accounting for the largest median family size of 4.01 persons per family. On the other hand, single female/mother families (50 | 16.9%) represent the smallest median family size with 2.96 persons per family.
| Family Type | # Families | Family Size |
| Married-Couple | 240 (81.1%) | 4.01 |
| Single Male/Father | 6 (2.0%) | 3.33 |
| Single Female/Mother | 50 (16.9%) | 2.96 |
| Total Families | 296 (100.0%) | 3.82 |
Median Household Size in West Jefferson
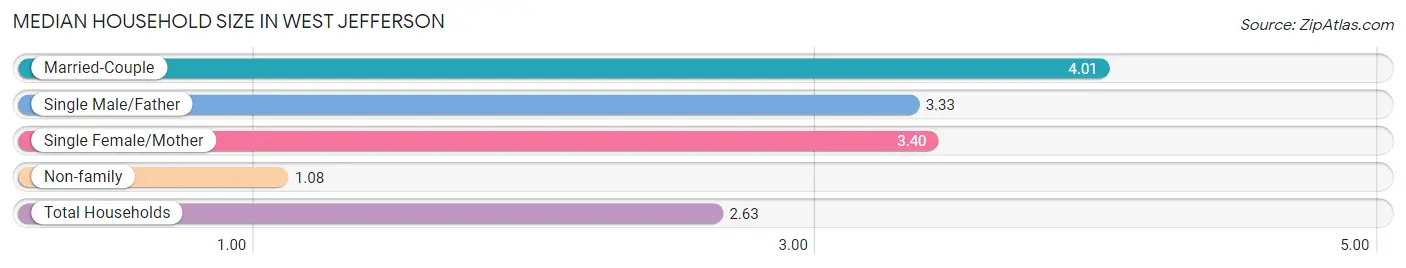
The median household size in West Jefferson is 2.63 persons per household, with married-couple households (240 | 44.5%) accounting for the largest median household size of 4.01 persons per household. non-family households (243 | 45.1%) represent the smallest median household size with 1.08 persons per household.
| Household Type | # Households | Household Size |
| Married-Couple | 240 (44.5%) | 4.01 |
| Single Male/Father | 6 (1.1%) | 3.33 |
| Single Female/Mother | 50 (9.3%) | 3.40 |
| Non-family | 243 (45.1%) | 1.08 |
| Total Households | 539 (100.0%) | 2.63 |
Household Size by Marriage Status in West Jefferson
Out of a total of 539 households in West Jefferson, 296 (54.9%) are family households, while 243 (45.1%) are nonfamily households. The most numerous type of family households are 2-person households, comprising 128, and the most common type of nonfamily households are 1-person households, comprising 227.
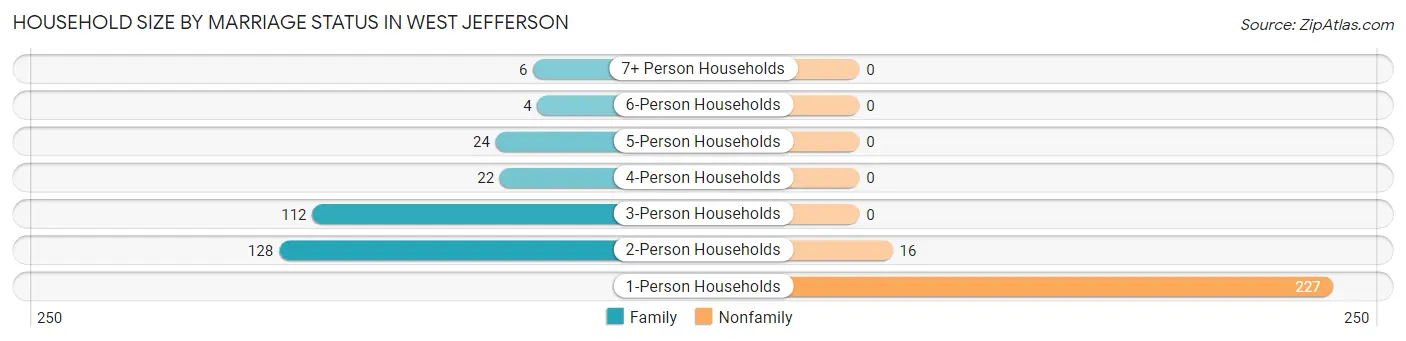
| Household Size | Family Households | Nonfamily Households |
| 1-Person Households | - | 227 (42.1%) |
| 2-Person Households | 128 (23.7%) | 16 (3.0%) |
| 3-Person Households | 112 (20.8%) | 0 (0.0%) |
| 4-Person Households | 22 (4.1%) | 0 (0.0%) |
| 5-Person Households | 24 (4.4%) | 0 (0.0%) |
| 6-Person Households | 4 (0.7%) | 0 (0.0%) |
| 7+ Person Households | 6 (1.1%) | 0 (0.0%) |
| Total | 296 (54.9%) | 243 (45.1%) |
Female Fertility in West Jefferson
Fertility by Age in West Jefferson
Average fertility rate in West Jefferson is 16.0 births per 1,000 women. Women in the age bracket of 20 to 34 years have the highest fertility rate with 34.0 births per 1,000 women. Women in the age bracket of 20 to 34 years acount for 100.0% of all women with births.
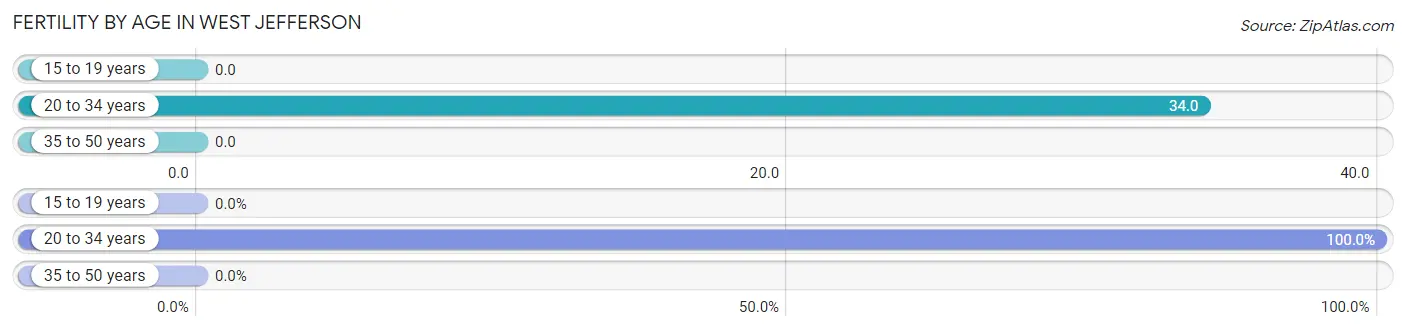
| Age Bracket | Women with Births | Births / 1,000 Women |
| 15 to 19 years | 0 (0.0%) | 0.0 |
| 20 to 34 years | 7 (100.0%) | 34.0 |
| 35 to 50 years | 0 (0.0%) | 0.0 |
| Total | 7 (100.0%) | 16.0 |
Fertility by Age by Marriage Status in West Jefferson
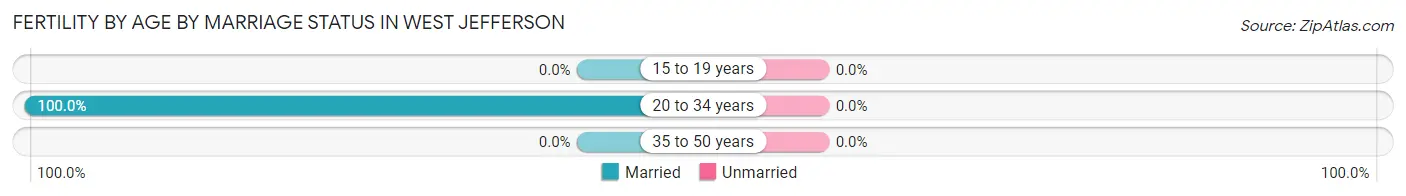
| Age Bracket | Married | Unmarried |
| 15 to 19 years | 0 (0.0%) | 0 (0.0%) |
| 20 to 34 years | 7 (100.0%) | 0 (0.0%) |
| 35 to 50 years | 0 (0.0%) | 0 (0.0%) |
| Total | 7 (100.0%) | 0 (0.0%) |
Fertility by Education in West Jefferson
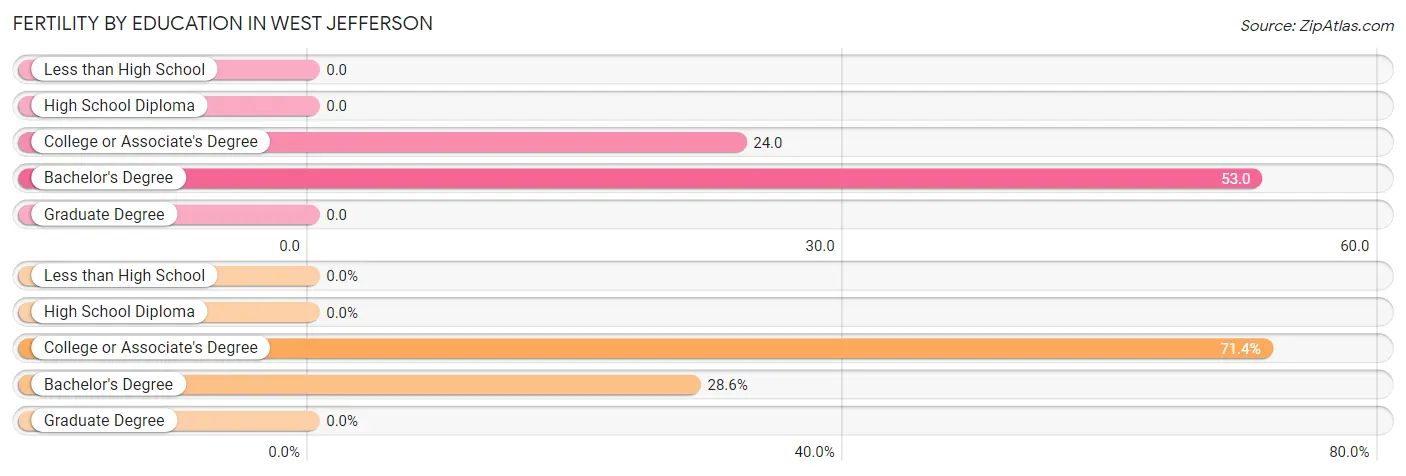
| Educational Attainment | Women with Births | Births / 1,000 Women |
| Less than High School | 0 (0.0%) | 0.0 |
| High School Diploma | 0 (0.0%) | 0.0 |
| College or Associate's Degree | 5 (71.4%) | 24.0 |
| Bachelor's Degree | 2 (28.6%) | 53.0 |
| Graduate Degree | 0 (0.0%) | 0.0 |
| Total | 7 (100.0%) | 16.0 |
Fertility by Education by Marriage Status in West Jefferson
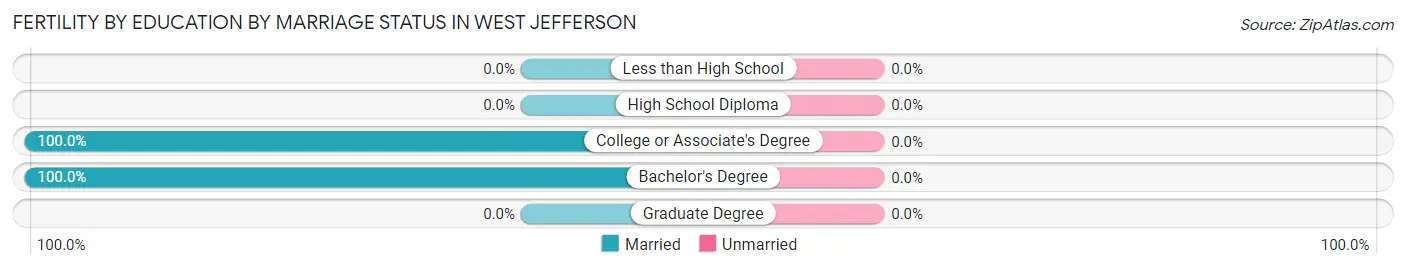
| Educational Attainment | Married | Unmarried |
| Less than High School | 0 (0.0%) | 0 (0.0%) |
| High School Diploma | 0 (0.0%) | 0 (0.0%) |
| College or Associate's Degree | 5 (100.0%) | 0 (0.0%) |
| Bachelor's Degree | 2 (100.0%) | 0 (0.0%) |
| Graduate Degree | 0 (0.0%) | 0 (0.0%) |
| Total | 7 (100.0%) | 0 (0.0%) |
Employment Characteristics in West Jefferson
Employment by Class of Employer in West Jefferson
Among the 580 employed individuals in West Jefferson, private company employees (340 | 58.6%), not-for-profit organizations (94 | 16.2%), and self-employed (not incorporated) (36 | 6.2%) make up the most common classes of employment.
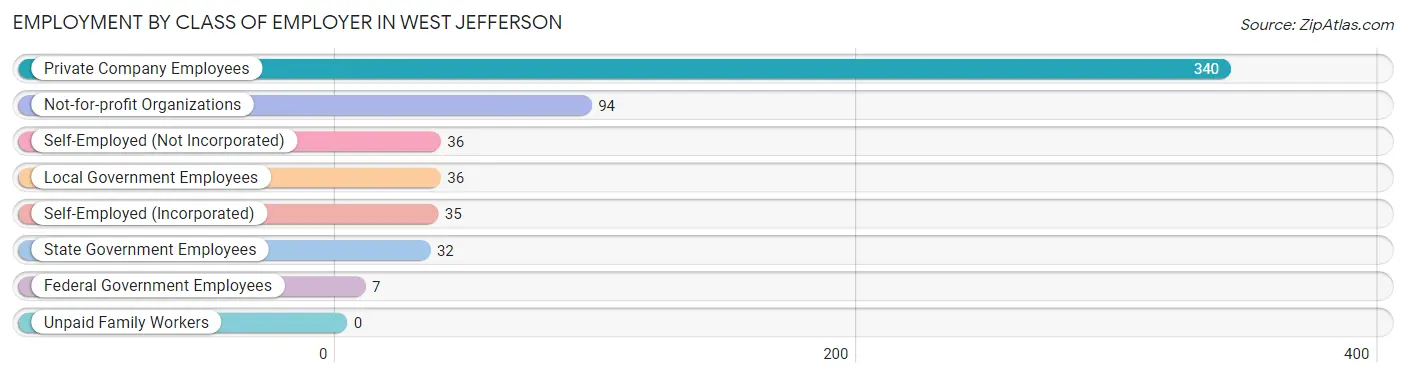
| Employer Class | # Employees | % Employees |
| Private Company Employees | 340 | 58.6% |
| Self-Employed (Incorporated) | 35 | 6.0% |
| Self-Employed (Not Incorporated) | 36 | 6.2% |
| Not-for-profit Organizations | 94 | 16.2% |
| Local Government Employees | 36 | 6.2% |
| State Government Employees | 32 | 5.5% |
| Federal Government Employees | 7 | 1.2% |
| Unpaid Family Workers | 0 | 0.0% |
| Total | 580 | 100.0% |
Employment Status by Age in West Jefferson
According to the labor force statistics for West Jefferson, out of the total population over 16 years of age (1,285), 58.8% or 756 individuals are in the labor force, with 22.3% or 169 of them unemployed. The age group with the highest labor force participation rate is 25 to 29 years, with 92.9% or 52 individuals in the labor force. Within the labor force, the 30 to 34 years age range has the highest percentage of unemployed individuals, with 81.5% or 132 of them being unemployed.
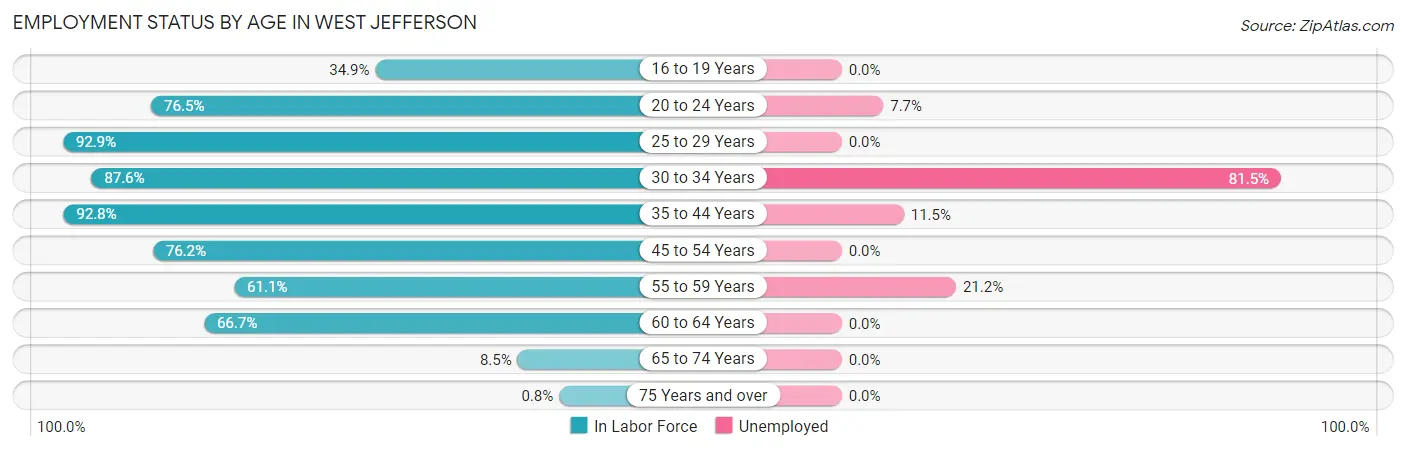
| Age Bracket | In Labor Force | Unemployed |
| 16 to 19 Years | 15 (34.9%) | 0 (0.0%) |
| 20 to 24 Years | 52 (76.5%) | 4 (7.7%) |
| 25 to 29 Years | 52 (92.9%) | 0 (0.0%) |
| 30 to 34 Years | 162 (87.6%) | 132 (81.5%) |
| 35 to 44 Years | 218 (92.8%) | 25 (11.5%) |
| 45 to 54 Years | 147 (76.2%) | 0 (0.0%) |
| 55 to 59 Years | 33 (61.1%) | 7 (21.2%) |
| 60 to 64 Years | 64 (66.7%) | 0 (0.0%) |
| 65 to 74 Years | 10 (8.5%) | 0 (0.0%) |
| 75 Years and over | 2 (0.8%) | 0 (0.0%) |
| Total | 756 (58.8%) | 169 (22.3%) |
Employment Status by Educational Attainment in West Jefferson
According to labor force statistics for West Jefferson, 82.5% of individuals (676) out of the total population between 25 and 64 years of age (819) are in the labor force, with 24.3% or 164 of them being unemployed. The group with the highest labor force participation rate are those with the educational attainment of college / associate degree, with 85.4% or 268 individuals in the labor force. Within the labor force, individuals with college / associate degree education have the highest percentage of unemployment, with 47.8% or 128 of them being unemployed.
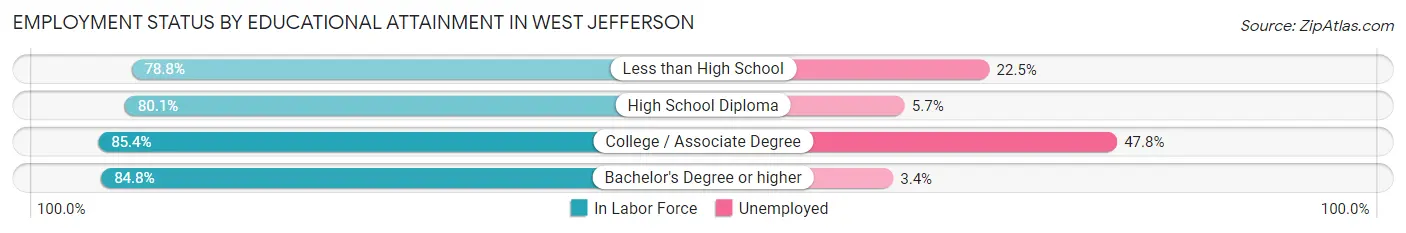
| Educational Attainment | In Labor Force | Unemployed |
| Less than High School | 89 (78.8%) | 25 (22.5%) |
| High School Diploma | 230 (80.1%) | 16 (5.7%) |
| College / Associate Degree | 268 (85.4%) | 150 (47.8%) |
| Bachelor's Degree or higher | 89 (84.8%) | 4 (3.4%) |
| Total | 676 (82.5%) | 199 (24.3%) |
Employment Occupations by Sex in West Jefferson
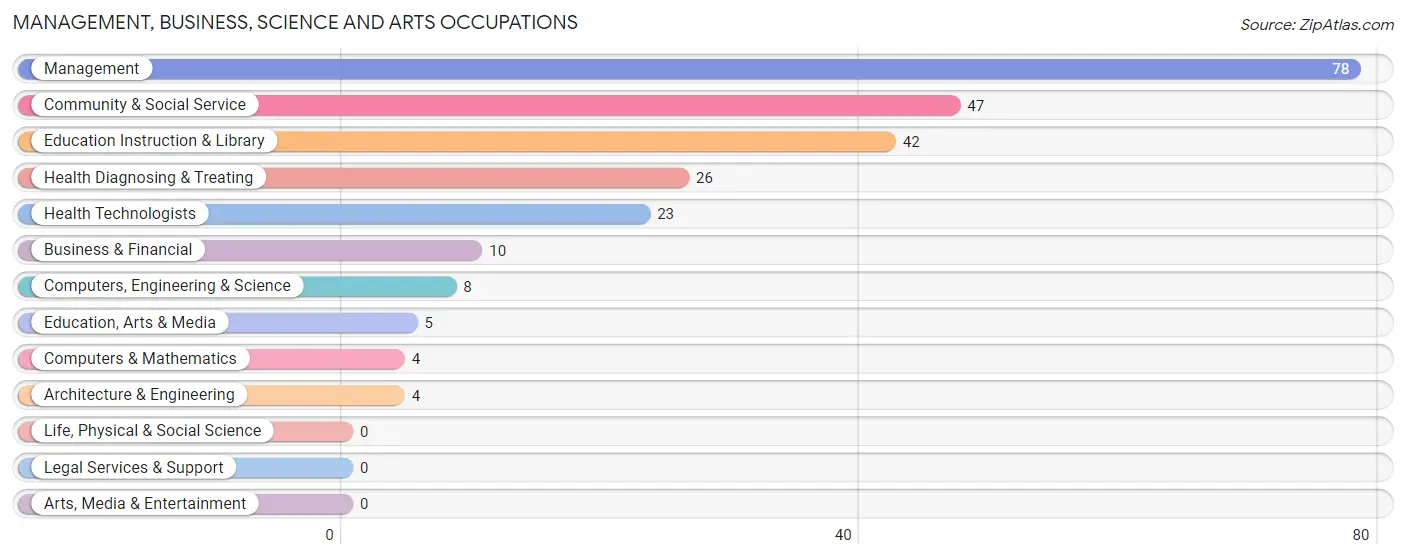
Management, Business, Science and Arts Occupations
The most common Management, Business, Science and Arts occupations in West Jefferson are Management (78 | 13.3%), Community & Social Service (47 | 8.0%), Education Instruction & Library (42 | 7.2%), Health Diagnosing & Treating (26 | 4.4%), and Health Technologists (23 | 3.9%).
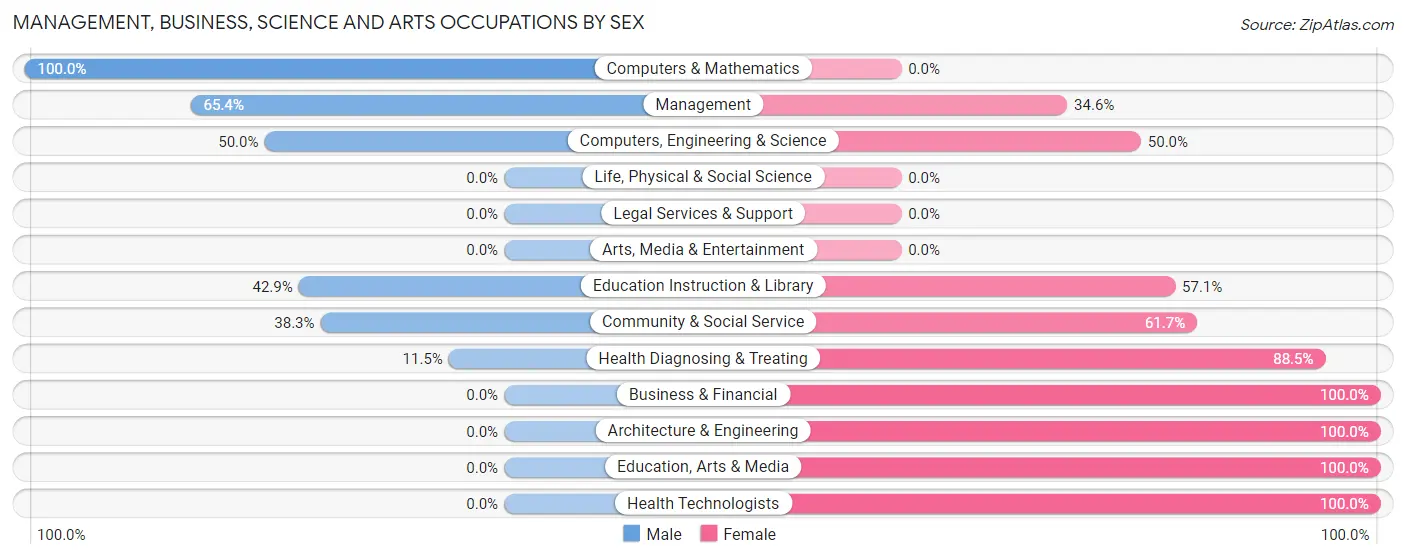
Management, Business, Science and Arts Occupations by Sex
Within the Management, Business, Science and Arts occupations in West Jefferson, the most male-oriented occupations are Computers & Mathematics (100.0%), Management (65.4%), and Computers, Engineering & Science (50.0%), while the most female-oriented occupations are Business & Financial (100.0%), Architecture & Engineering (100.0%), and Education, Arts & Media (100.0%).
| Occupation | Male | Female |
| Management | 51 (65.4%) | 27 (34.6%) |
| Business & Financial | 0 (0.0%) | 10 (100.0%) |
| Computers, Engineering & Science | 4 (50.0%) | 4 (50.0%) |
| Computers & Mathematics | 4 (100.0%) | 0 (0.0%) |
| Architecture & Engineering | 0 (0.0%) | 4 (100.0%) |
| Life, Physical & Social Science | 0 (0.0%) | 0 (0.0%) |
| Community & Social Service | 18 (38.3%) | 29 (61.7%) |
| Education, Arts & Media | 0 (0.0%) | 5 (100.0%) |
| Legal Services & Support | 0 (0.0%) | 0 (0.0%) |
| Education Instruction & Library | 18 (42.9%) | 24 (57.1%) |
| Arts, Media & Entertainment | 0 (0.0%) | 0 (0.0%) |
| Health Diagnosing & Treating | 3 (11.5%) | 23 (88.5%) |
| Health Technologists | 0 (0.0%) | 23 (100.0%) |
| Total (Category) | 76 (45.0%) | 93 (55.0%) |
| Total (Overall) | 261 (44.5%) | 326 (55.5%) |
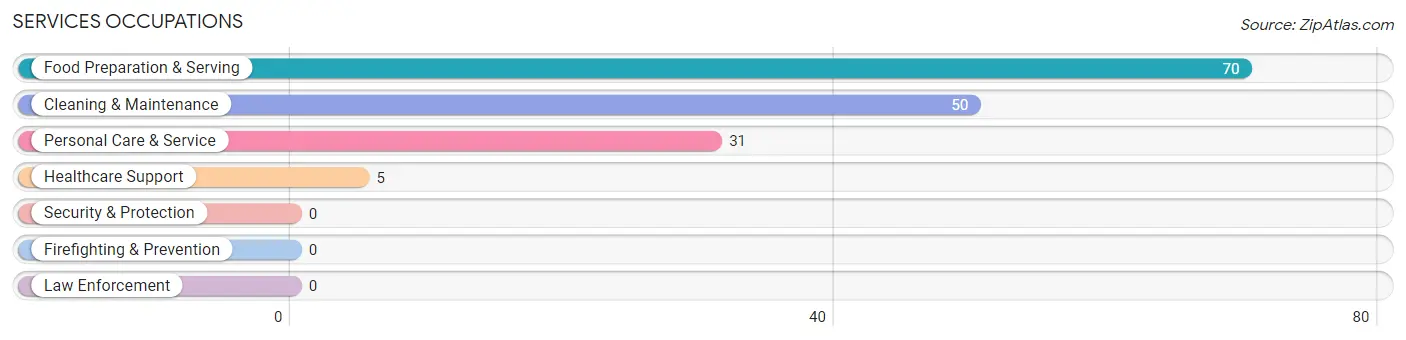
Services Occupations
The most common Services occupations in West Jefferson are Food Preparation & Serving (70 | 11.9%), Cleaning & Maintenance (50 | 8.5%), Personal Care & Service (31 | 5.3%), and Healthcare Support (5 | 0.9%).
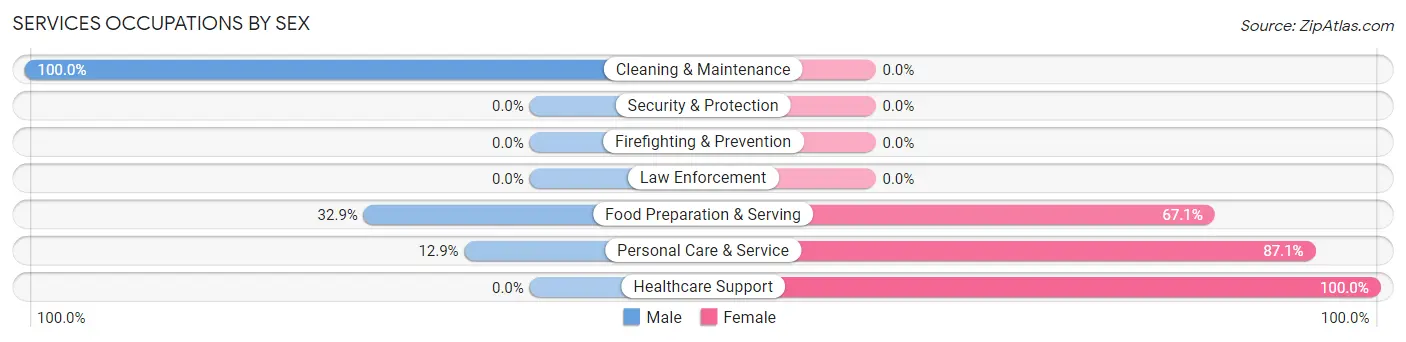
Services Occupations by Sex
Within the Services occupations in West Jefferson, the most male-oriented occupations are Cleaning & Maintenance (100.0%), Food Preparation & Serving (32.9%), and Personal Care & Service (12.9%), while the most female-oriented occupations are Healthcare Support (100.0%), Personal Care & Service (87.1%), and Food Preparation & Serving (67.1%).
| Occupation | Male | Female |
| Healthcare Support | 0 (0.0%) | 5 (100.0%) |
| Security & Protection | 0 (0.0%) | 0 (0.0%) |
| Firefighting & Prevention | 0 (0.0%) | 0 (0.0%) |
| Law Enforcement | 0 (0.0%) | 0 (0.0%) |
| Food Preparation & Serving | 23 (32.9%) | 47 (67.1%) |
| Cleaning & Maintenance | 50 (100.0%) | 0 (0.0%) |
| Personal Care & Service | 4 (12.9%) | 27 (87.1%) |
| Total (Category) | 77 (49.4%) | 79 (50.6%) |
| Total (Overall) | 261 (44.5%) | 326 (55.5%) |
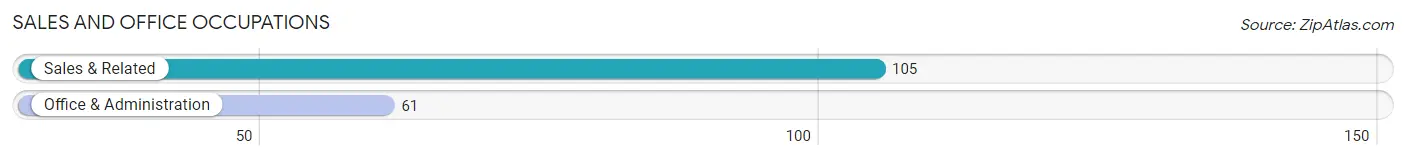
Sales and Office Occupations
The most common Sales and Office occupations in West Jefferson are Sales & Related (105 | 17.9%), and Office & Administration (61 | 10.4%).
Sales and Office Occupations by Sex
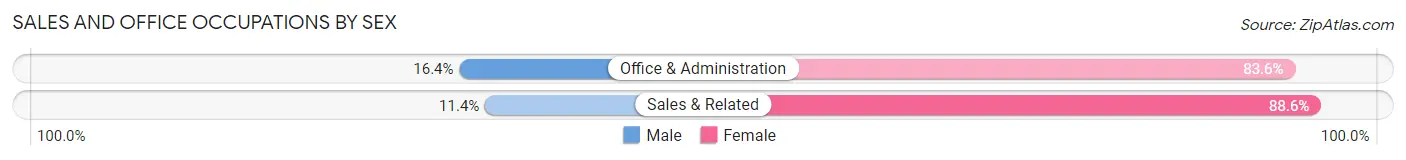
| Occupation | Male | Female |
| Sales & Related | 12 (11.4%) | 93 (88.6%) |
| Office & Administration | 10 (16.4%) | 51 (83.6%) |
| Total (Category) | 22 (13.3%) | 144 (86.8%) |
| Total (Overall) | 261 (44.5%) | 326 (55.5%) |
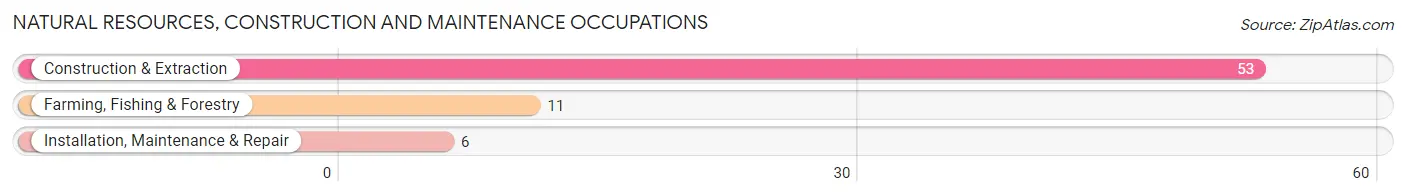
Natural Resources, Construction and Maintenance Occupations
The most common Natural Resources, Construction and Maintenance occupations in West Jefferson are Construction & Extraction (53 | 9.0%), Farming, Fishing & Forestry (11 | 1.9%), and Installation, Maintenance & Repair (6 | 1.0%).
Natural Resources, Construction and Maintenance Occupations by Sex
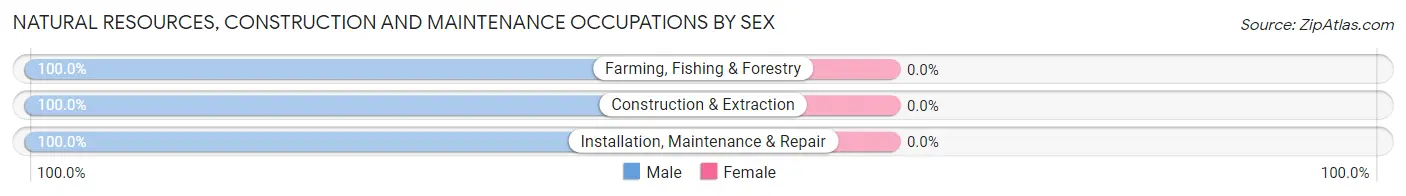
| Occupation | Male | Female |
| Farming, Fishing & Forestry | 11 (100.0%) | 0 (0.0%) |
| Construction & Extraction | 53 (100.0%) | 0 (0.0%) |
| Installation, Maintenance & Repair | 6 (100.0%) | 0 (0.0%) |
| Total (Category) | 70 (100.0%) | 0 (0.0%) |
| Total (Overall) | 261 (44.5%) | 326 (55.5%) |
Production, Transportation and Moving Occupations
The most common Production, Transportation and Moving occupations in West Jefferson are Production (13 | 2.2%), and Transportation (13 | 2.2%).
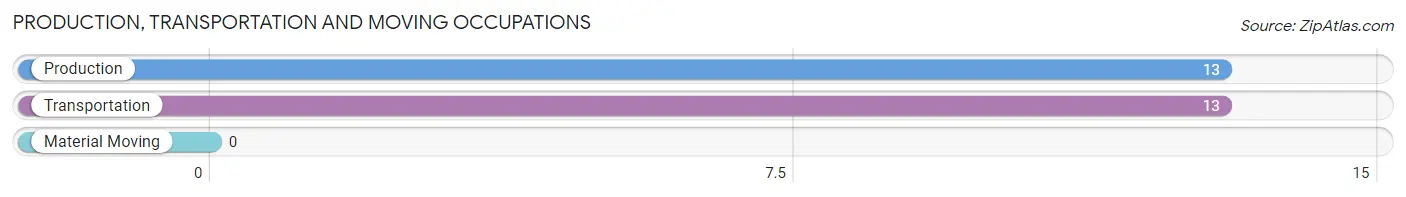
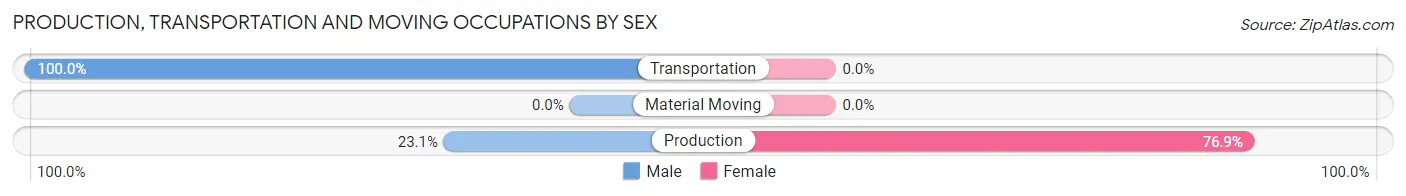
Production, Transportation and Moving Occupations by Sex
| Occupation | Male | Female |
| Production | 3 (23.1%) | 10 (76.9%) |
| Transportation | 13 (100.0%) | 0 (0.0%) |
| Material Moving | 0 (0.0%) | 0 (0.0%) |
| Total (Category) | 16 (61.5%) | 10 (38.5%) |
| Total (Overall) | 261 (44.5%) | 326 (55.5%) |
Employment Industries by Sex in West Jefferson
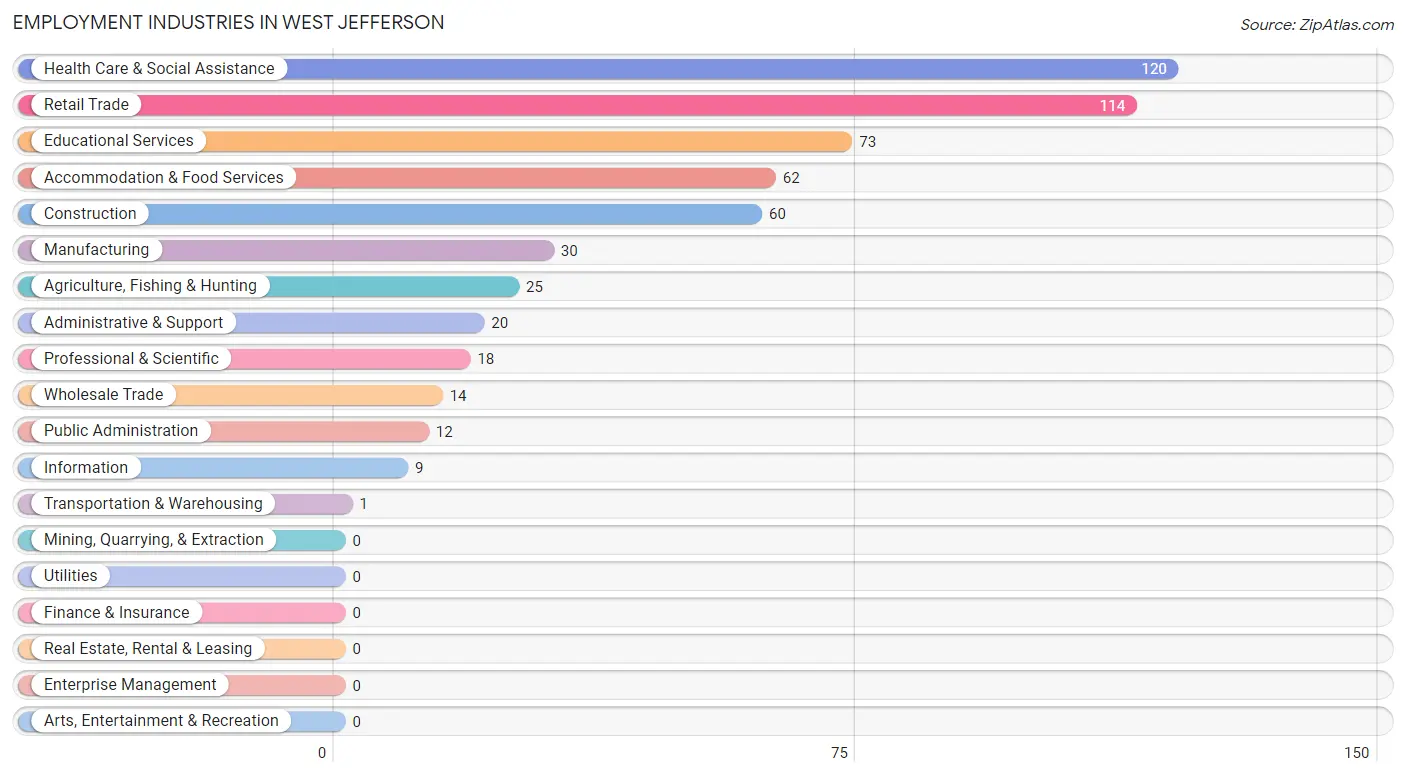
Employment Industries in West Jefferson
The major employment industries in West Jefferson include Health Care & Social Assistance (120 | 20.4%), Retail Trade (114 | 19.4%), Educational Services (73 | 12.4%), Accommodation & Food Services (62 | 10.6%), and Construction (60 | 10.2%).
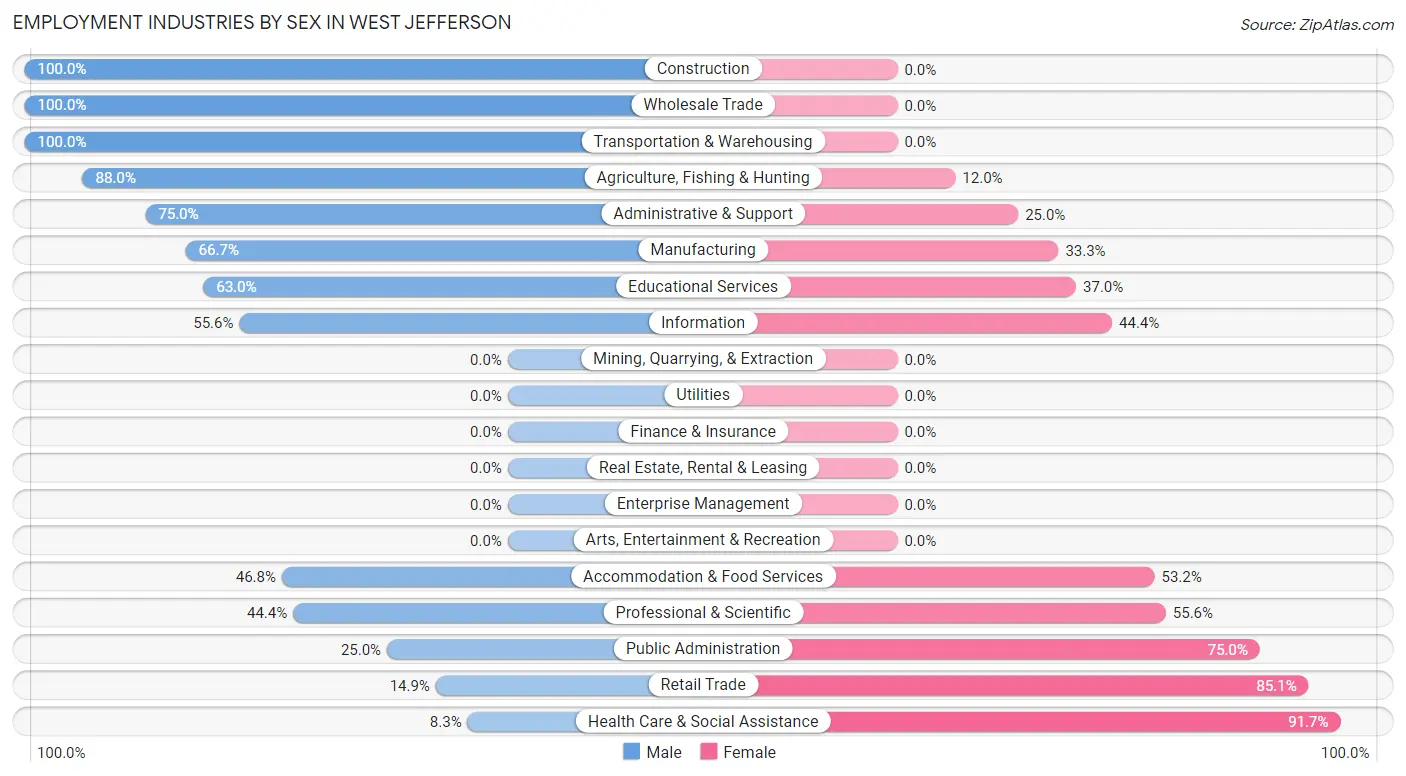
Employment Industries by Sex in West Jefferson
The West Jefferson industries that see more men than women are Construction (100.0%), Wholesale Trade (100.0%), and Transportation & Warehousing (100.0%), whereas the industries that tend to have a higher number of women are Health Care & Social Assistance (91.7%), Retail Trade (85.1%), and Public Administration (75.0%).
| Industry | Male | Female |
| Agriculture, Fishing & Hunting | 22 (88.0%) | 3 (12.0%) |
| Mining, Quarrying, & Extraction | 0 (0.0%) | 0 (0.0%) |
| Construction | 60 (100.0%) | 0 (0.0%) |
| Manufacturing | 20 (66.7%) | 10 (33.3%) |
| Wholesale Trade | 14 (100.0%) | 0 (0.0%) |
| Retail Trade | 17 (14.9%) | 97 (85.1%) |
| Transportation & Warehousing | 1 (100.0%) | 0 (0.0%) |
| Utilities | 0 (0.0%) | 0 (0.0%) |
| Information | 5 (55.6%) | 4 (44.4%) |
| Finance & Insurance | 0 (0.0%) | 0 (0.0%) |
| Real Estate, Rental & Leasing | 0 (0.0%) | 0 (0.0%) |
| Professional & Scientific | 8 (44.4%) | 10 (55.6%) |
| Enterprise Management | 0 (0.0%) | 0 (0.0%) |
| Administrative & Support | 15 (75.0%) | 5 (25.0%) |
| Educational Services | 46 (63.0%) | 27 (37.0%) |
| Health Care & Social Assistance | 10 (8.3%) | 110 (91.7%) |
| Arts, Entertainment & Recreation | 0 (0.0%) | 0 (0.0%) |
| Accommodation & Food Services | 29 (46.8%) | 33 (53.2%) |
| Public Administration | 3 (25.0%) | 9 (75.0%) |
| Total | 261 (44.5%) | 326 (55.5%) |
Education in West Jefferson
School Enrollment in West Jefferson
The most common levels of schooling among the 253 students in West Jefferson are kindergarten (59 | 23.3%), elementary school (52 | 20.5%), and high school (47 | 18.6%).
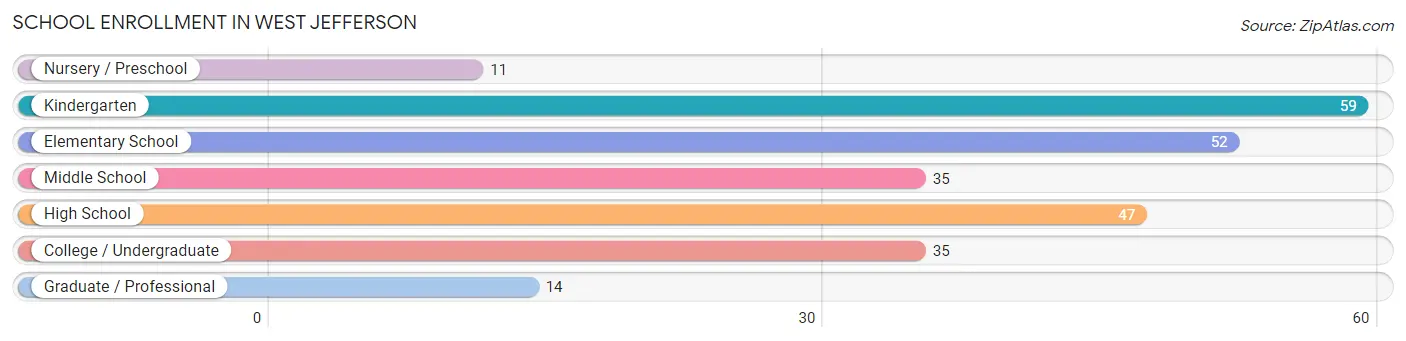
| School Level | # Students | % Students |
| Nursery / Preschool | 11 | 4.3% |
| Kindergarten | 59 | 23.3% |
| Elementary School | 52 | 20.5% |
| Middle School | 35 | 13.8% |
| High School | 47 | 18.6% |
| College / Undergraduate | 35 | 13.8% |
| Graduate / Professional | 14 | 5.5% |
| Total | 253 | 100.0% |
School Enrollment by Age by Funding Source in West Jefferson
Out of a total of 253 students who are enrolled in schools in West Jefferson, 21 (8.3%) attend a private institution, while the remaining 232 (91.7%) are enrolled in public schools. The age group of 20 to 24 year olds has the highest likelihood of being enrolled in private schools, with 6 (37.5% in the age bracket) enrolled. Conversely, the age group of 3 to 4 year olds has the lowest likelihood of being enrolled in a private school, with 11 (100.0% in the age bracket) attending a public institution.
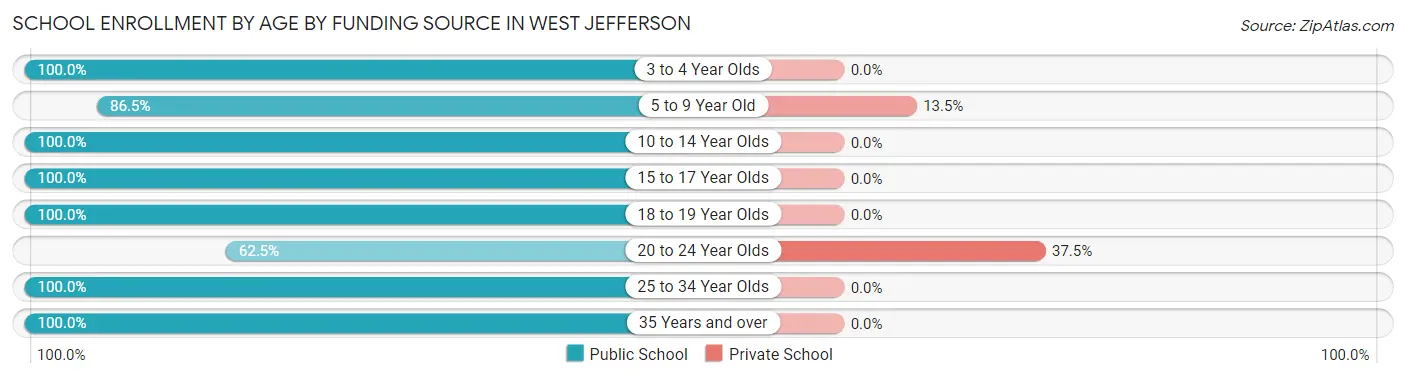
| Age Bracket | Public School | Private School |
| 3 to 4 Year Olds | 11 (100.0%) | 0 (0.0%) |
| 5 to 9 Year Old | 96 (86.5%) | 15 (13.5%) |
| 10 to 14 Year Olds | 48 (100.0%) | 0 (0.0%) |
| 15 to 17 Year Olds | 34 (100.0%) | 0 (0.0%) |
| 18 to 19 Year Olds | 6 (100.0%) | 0 (0.0%) |
| 20 to 24 Year Olds | 10 (62.5%) | 6 (37.5%) |
| 25 to 34 Year Olds | 3 (100.0%) | 0 (0.0%) |
| 35 Years and over | 24 (100.0%) | 0 (0.0%) |
| Total | 232 (91.7%) | 21 (8.3%) |
Educational Attainment by Field of Study in West Jefferson
Education (40 | 21.9%), business (29 | 15.9%), computers & mathematics (17 | 9.3%), arts & humanities (16 | 8.7%), and literature & languages (15 | 8.2%) are the most common fields of study among 183 individuals in West Jefferson who have obtained a bachelor's degree or higher.
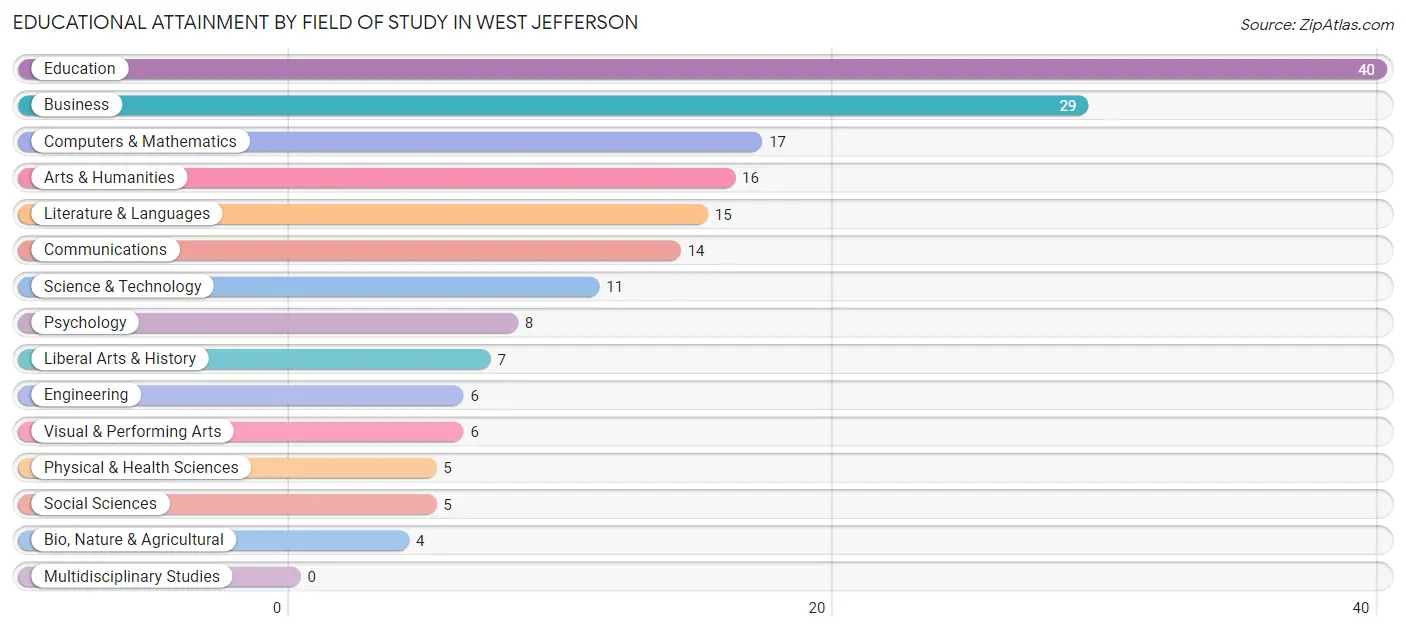
| Field of Study | # Graduates | % Graduates |
| Computers & Mathematics | 17 | 9.3% |
| Bio, Nature & Agricultural | 4 | 2.2% |
| Physical & Health Sciences | 5 | 2.7% |
| Psychology | 8 | 4.4% |
| Social Sciences | 5 | 2.7% |
| Engineering | 6 | 3.3% |
| Multidisciplinary Studies | 0 | 0.0% |
| Science & Technology | 11 | 6.0% |
| Business | 29 | 15.9% |
| Education | 40 | 21.9% |
| Literature & Languages | 15 | 8.2% |
| Liberal Arts & History | 7 | 3.8% |
| Visual & Performing Arts | 6 | 3.3% |
| Communications | 14 | 7.6% |
| Arts & Humanities | 16 | 8.7% |
| Total | 183 | 100.0% |
Transportation & Commute in West Jefferson
Vehicle Availability by Sex in West Jefferson
The most prevalent vehicle ownership categories in West Jefferson are males with 3 vehicles (91, accounting for 35.4%) and females with 3 vehicles (161, making up 28.2%).
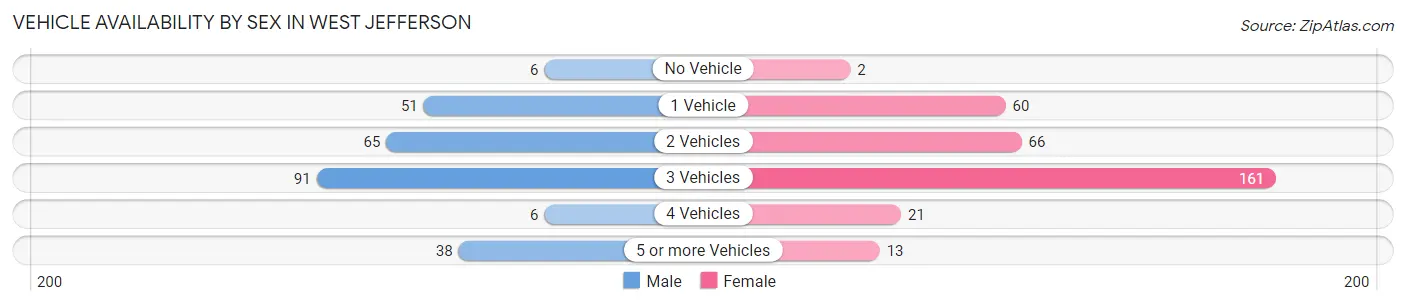
| Vehicles Available | Male | Female |
| No Vehicle | 6 (2.3%) | 2 (0.6%) |
| 1 Vehicle | 51 (19.8%) | 60 (18.6%) |
| 2 Vehicles | 65 (25.3%) | 66 (20.4%) |
| 3 Vehicles | 91 (35.4%) | 161 (49.8%) |
| 4 Vehicles | 6 (2.3%) | 21 (6.5%) |
| 5 or more Vehicles | 38 (14.8%) | 13 (4.0%) |
| Total | 257 (100.0%) | 323 (100.0%) |
Commute Time in West Jefferson
The most frequently occuring commute durations in West Jefferson are 10 to 14 minutes (242 commuters, 43.8%), 15 to 19 minutes (119 commuters, 21.6%), and 5 to 9 minutes (65 commuters, 11.8%).
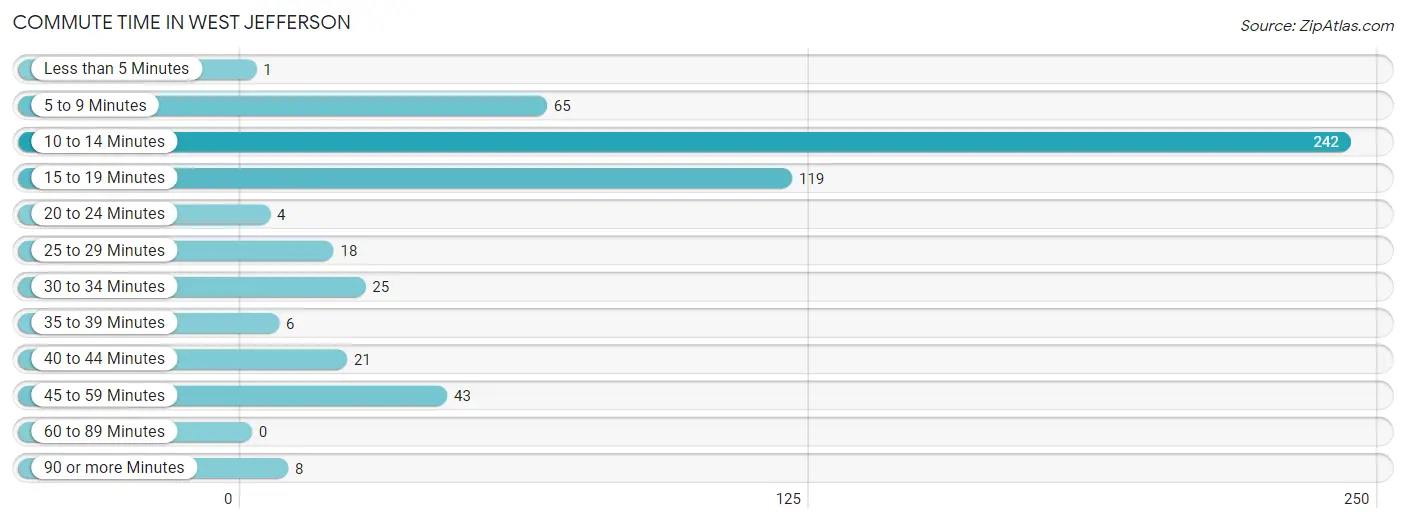
| Commute Time | # Commuters | % Commuters |
| Less than 5 Minutes | 1 | 0.2% |
| 5 to 9 Minutes | 65 | 11.8% |
| 10 to 14 Minutes | 242 | 43.8% |
| 15 to 19 Minutes | 119 | 21.6% |
| 20 to 24 Minutes | 4 | 0.7% |
| 25 to 29 Minutes | 18 | 3.3% |
| 30 to 34 Minutes | 25 | 4.5% |
| 35 to 39 Minutes | 6 | 1.1% |
| 40 to 44 Minutes | 21 | 3.8% |
| 45 to 59 Minutes | 43 | 7.8% |
| 60 to 89 Minutes | 0 | 0.0% |
| 90 or more Minutes | 8 | 1.5% |
Commute Time by Sex in West Jefferson
The most common commute times in West Jefferson are 10 to 14 minutes (100 commuters, 41.3%) for males and 10 to 14 minutes (142 commuters, 45.8%) for females.
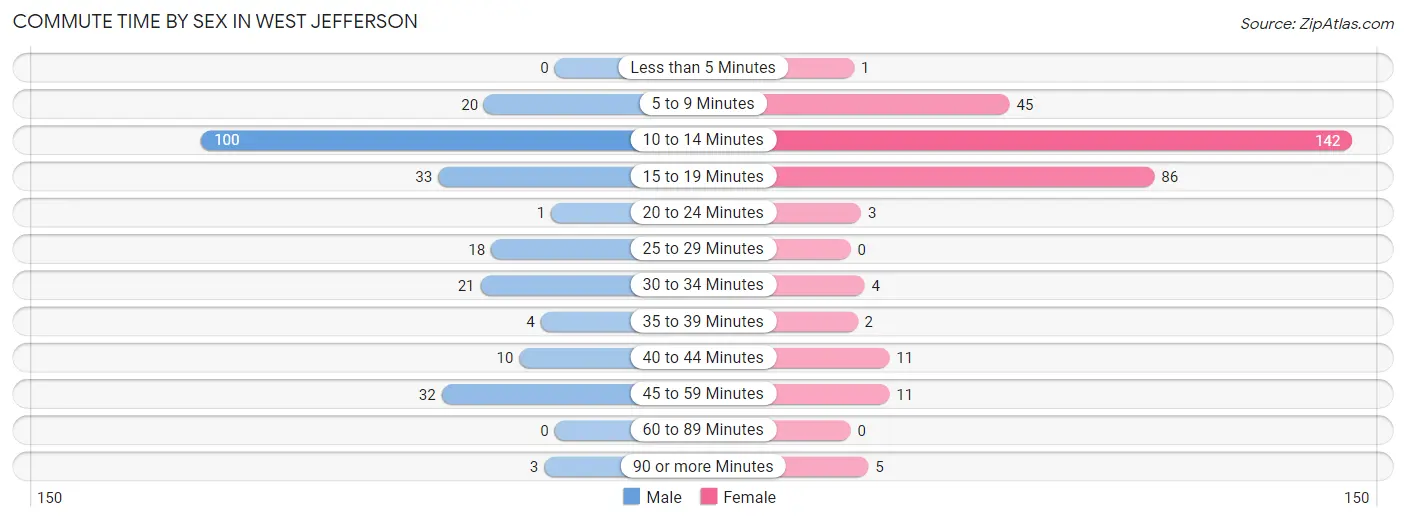
| Commute Time | Male | Female |
| Less than 5 Minutes | 0 (0.0%) | 1 (0.3%) |
| 5 to 9 Minutes | 20 (8.3%) | 45 (14.5%) |
| 10 to 14 Minutes | 100 (41.3%) | 142 (45.8%) |
| 15 to 19 Minutes | 33 (13.6%) | 86 (27.7%) |
| 20 to 24 Minutes | 1 (0.4%) | 3 (1.0%) |
| 25 to 29 Minutes | 18 (7.4%) | 0 (0.0%) |
| 30 to 34 Minutes | 21 (8.7%) | 4 (1.3%) |
| 35 to 39 Minutes | 4 (1.7%) | 2 (0.6%) |
| 40 to 44 Minutes | 10 (4.1%) | 11 (3.5%) |
| 45 to 59 Minutes | 32 (13.2%) | 11 (3.5%) |
| 60 to 89 Minutes | 0 (0.0%) | 0 (0.0%) |
| 90 or more Minutes | 3 (1.2%) | 5 (1.6%) |
Time of Departure to Work by Sex in West Jefferson
The most frequent times of departure to work in West Jefferson are 12:00 PM to 3:59 PM (56, 23.1%) for males and 12:00 AM to 4:59 AM (81, 26.1%) for females.
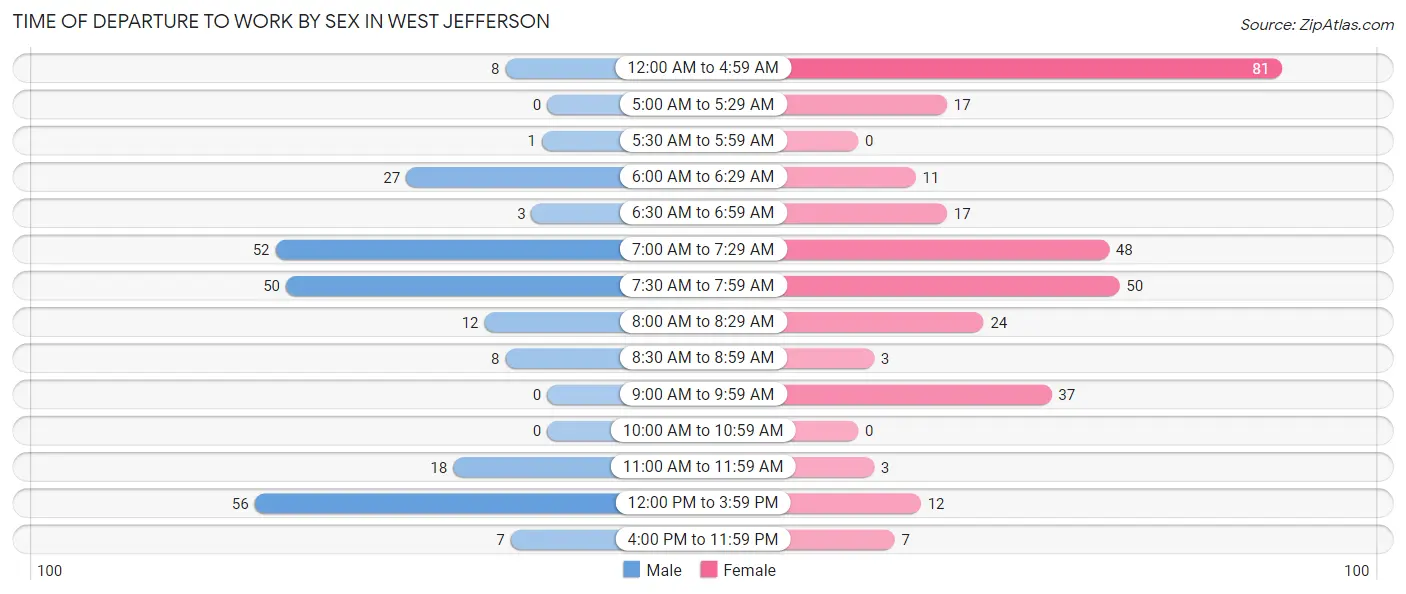
| Time of Departure | Male | Female |
| 12:00 AM to 4:59 AM | 8 (3.3%) | 81 (26.1%) |
| 5:00 AM to 5:29 AM | 0 (0.0%) | 17 (5.5%) |
| 5:30 AM to 5:59 AM | 1 (0.4%) | 0 (0.0%) |
| 6:00 AM to 6:29 AM | 27 (11.2%) | 11 (3.5%) |
| 6:30 AM to 6:59 AM | 3 (1.2%) | 17 (5.5%) |
| 7:00 AM to 7:29 AM | 52 (21.5%) | 48 (15.5%) |
| 7:30 AM to 7:59 AM | 50 (20.7%) | 50 (16.1%) |
| 8:00 AM to 8:29 AM | 12 (5.0%) | 24 (7.7%) |
| 8:30 AM to 8:59 AM | 8 (3.3%) | 3 (1.0%) |
| 9:00 AM to 9:59 AM | 0 (0.0%) | 37 (11.9%) |
| 10:00 AM to 10:59 AM | 0 (0.0%) | 0 (0.0%) |
| 11:00 AM to 11:59 AM | 18 (7.4%) | 3 (1.0%) |
| 12:00 PM to 3:59 PM | 56 (23.1%) | 12 (3.9%) |
| 4:00 PM to 11:59 PM | 7 (2.9%) | 7 (2.3%) |
| Total | 242 (100.0%) | 310 (100.0%) |
Housing Occupancy in West Jefferson
Occupancy by Ownership in West Jefferson
Of the total 539 dwellings in West Jefferson, owner-occupied units account for 297 (55.1%), while renter-occupied units make up 242 (44.9%).
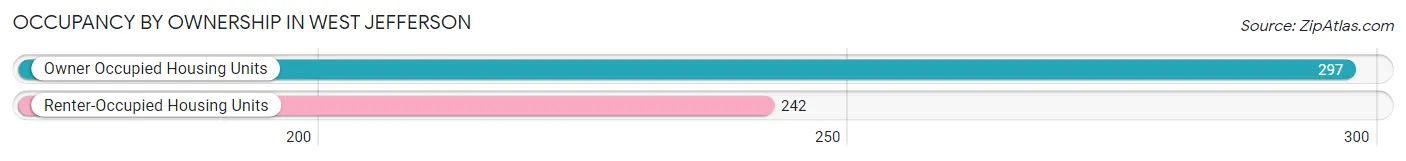
| Occupancy | # Housing Units | % Housing Units |
| Owner Occupied Housing Units | 297 | 55.1% |
| Renter-Occupied Housing Units | 242 | 44.9% |
| Total Occupied Housing Units | 539 | 100.0% |
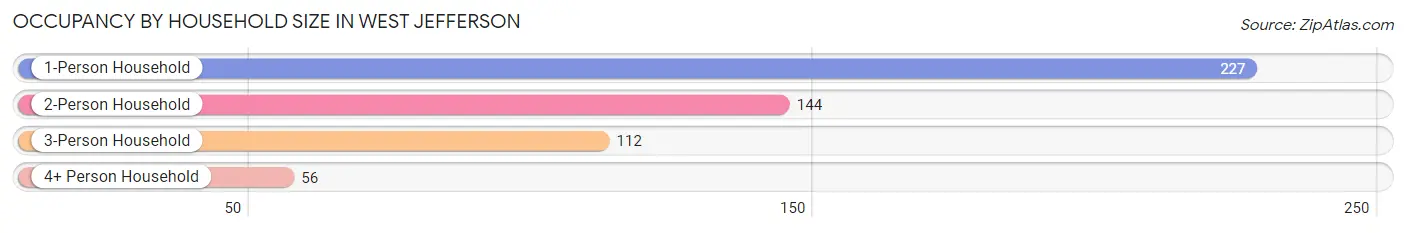
Occupancy by Household Size in West Jefferson
| Household Size | # Housing Units | % Housing Units |
| 1-Person Household | 227 | 42.1% |
| 2-Person Household | 144 | 26.7% |
| 3-Person Household | 112 | 20.8% |
| 4+ Person Household | 56 | 10.4% |
| Total Housing Units | 539 | 100.0% |
Occupancy by Ownership by Household Size in West Jefferson
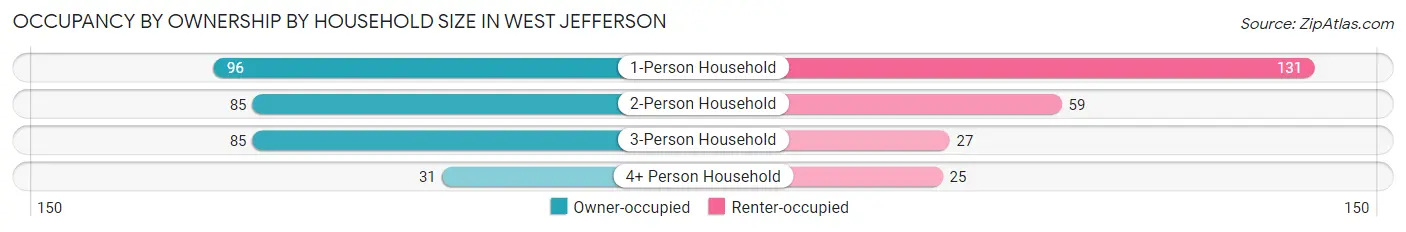
| Household Size | Owner-occupied | Renter-occupied |
| 1-Person Household | 96 (42.3%) | 131 (57.7%) |
| 2-Person Household | 85 (59.0%) | 59 (41.0%) |
| 3-Person Household | 85 (75.9%) | 27 (24.1%) |
| 4+ Person Household | 31 (55.4%) | 25 (44.6%) |
| Total Housing Units | 297 (55.1%) | 242 (44.9%) |
Occupancy by Educational Attainment in West Jefferson
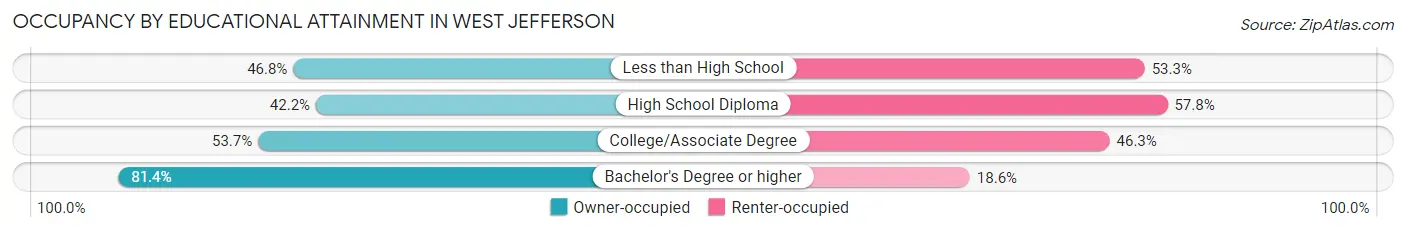
| Household Size | Owner-occupied | Renter-occupied |
| Less than High School | 36 (46.8%) | 41 (53.2%) |
| High School Diploma | 68 (42.2%) | 93 (57.8%) |
| College/Associate Degree | 101 (53.7%) | 87 (46.3%) |
| Bachelor's Degree or higher | 92 (81.4%) | 21 (18.6%) |
Occupancy by Age of Householder in West Jefferson
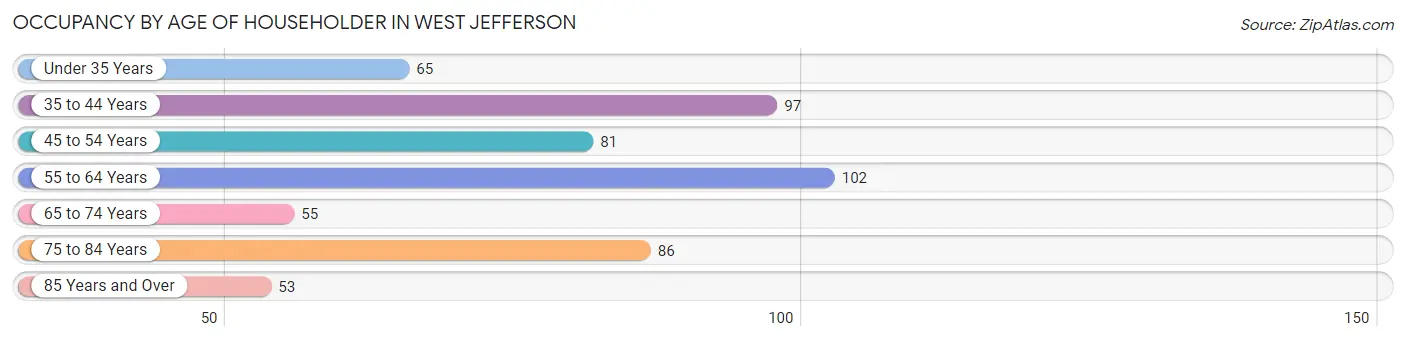
| Age Bracket | # Households | % Households |
| Under 35 Years | 65 | 12.1% |
| 35 to 44 Years | 97 | 18.0% |
| 45 to 54 Years | 81 | 15.0% |
| 55 to 64 Years | 102 | 18.9% |
| 65 to 74 Years | 55 | 10.2% |
| 75 to 84 Years | 86 | 16.0% |
| 85 Years and Over | 53 | 9.8% |
| Total | 539 | 100.0% |
Housing Finances in West Jefferson
Median Income by Occupancy in West Jefferson
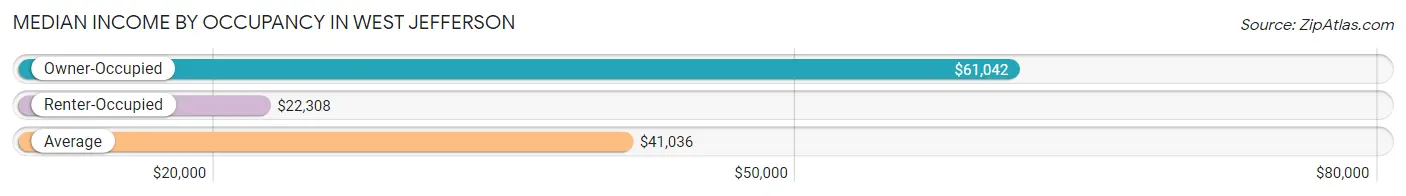
| Occupancy Type | # Households | Median Income |
| Owner-Occupied | 297 (55.1%) | $61,042 |
| Renter-Occupied | 242 (44.9%) | $22,308 |
| Average | 539 (100.0%) | $41,036 |
Occupancy by Householder Income Bracket in West Jefferson
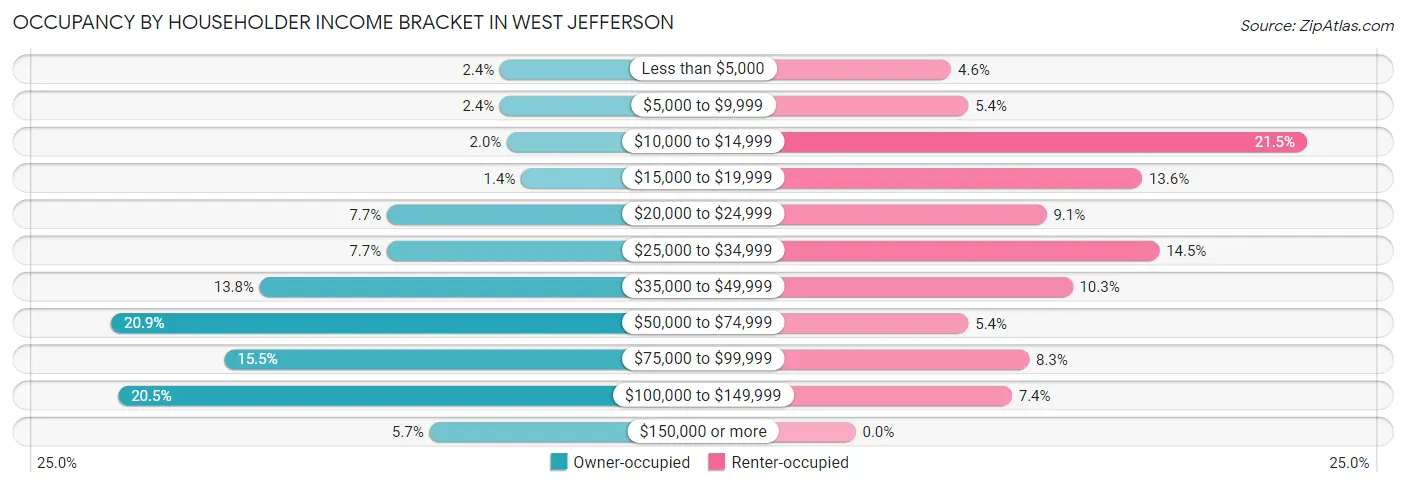
| Income Bracket | Owner-occupied | Renter-occupied |
| Less than $5,000 | 7 (2.4%) | 11 (4.5%) |
| $5,000 to $9,999 | 7 (2.4%) | 13 (5.4%) |
| $10,000 to $14,999 | 6 (2.0%) | 52 (21.5%) |
| $15,000 to $19,999 | 4 (1.3%) | 33 (13.6%) |
| $20,000 to $24,999 | 23 (7.7%) | 22 (9.1%) |
| $25,000 to $34,999 | 23 (7.7%) | 35 (14.5%) |
| $35,000 to $49,999 | 41 (13.8%) | 25 (10.3%) |
| $50,000 to $74,999 | 62 (20.9%) | 13 (5.4%) |
| $75,000 to $99,999 | 46 (15.5%) | 20 (8.3%) |
| $100,000 to $149,999 | 61 (20.5%) | 18 (7.4%) |
| $150,000 or more | 17 (5.7%) | 0 (0.0%) |
| Total | 297 (100.0%) | 242 (100.0%) |
Monthly Housing Cost Tiers in West Jefferson
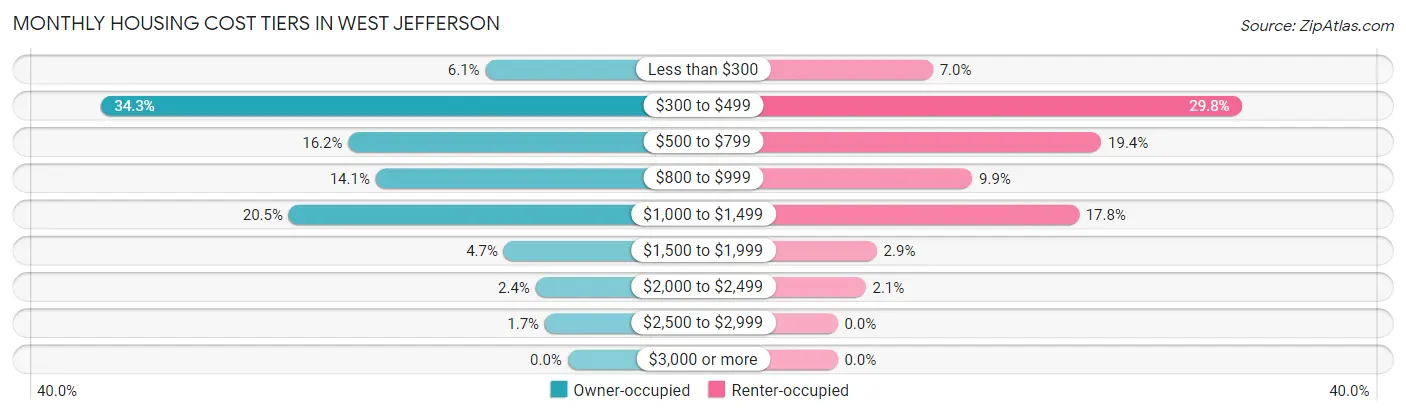
| Monthly Cost | Owner-occupied | Renter-occupied |
| Less than $300 | 18 (6.1%) | 17 (7.0%) |
| $300 to $499 | 102 (34.3%) | 72 (29.7%) |
| $500 to $799 | 48 (16.2%) | 47 (19.4%) |
| $800 to $999 | 42 (14.1%) | 24 (9.9%) |
| $1,000 to $1,499 | 61 (20.5%) | 43 (17.8%) |
| $1,500 to $1,999 | 14 (4.7%) | 7 (2.9%) |
| $2,000 to $2,499 | 7 (2.4%) | 5 (2.1%) |
| $2,500 to $2,999 | 5 (1.7%) | 0 (0.0%) |
| $3,000 or more | 0 (0.0%) | 0 (0.0%) |
| Total | 297 (100.0%) | 242 (100.0%) |
Physical Housing Characteristics in West Jefferson
Housing Structures in West Jefferson
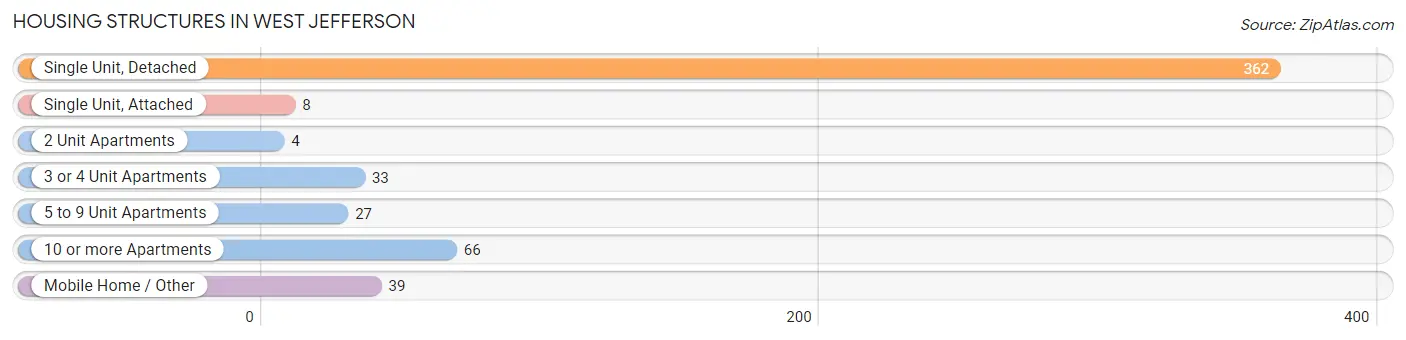
| Structure Type | # Housing Units | % Housing Units |
| Single Unit, Detached | 362 | 67.2% |
| Single Unit, Attached | 8 | 1.5% |
| 2 Unit Apartments | 4 | 0.7% |
| 3 or 4 Unit Apartments | 33 | 6.1% |
| 5 to 9 Unit Apartments | 27 | 5.0% |
| 10 or more Apartments | 66 | 12.2% |
| Mobile Home / Other | 39 | 7.2% |
| Total | 539 | 100.0% |
Housing Structures by Occupancy in West Jefferson
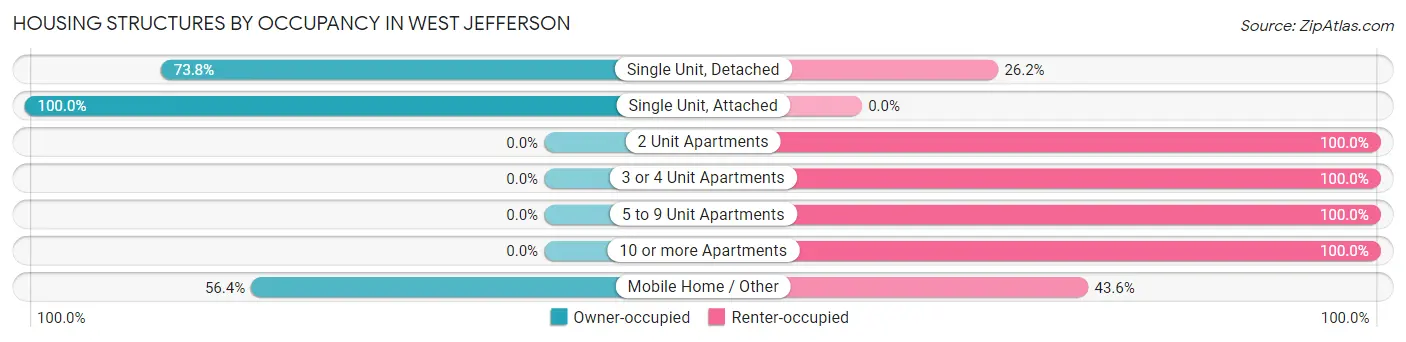
| Structure Type | Owner-occupied | Renter-occupied |
| Single Unit, Detached | 267 (73.8%) | 95 (26.2%) |
| Single Unit, Attached | 8 (100.0%) | 0 (0.0%) |
| 2 Unit Apartments | 0 (0.0%) | 4 (100.0%) |
| 3 or 4 Unit Apartments | 0 (0.0%) | 33 (100.0%) |
| 5 to 9 Unit Apartments | 0 (0.0%) | 27 (100.0%) |
| 10 or more Apartments | 0 (0.0%) | 66 (100.0%) |
| Mobile Home / Other | 22 (56.4%) | 17 (43.6%) |
| Total | 297 (55.1%) | 242 (44.9%) |
Housing Structures by Number of Rooms in West Jefferson
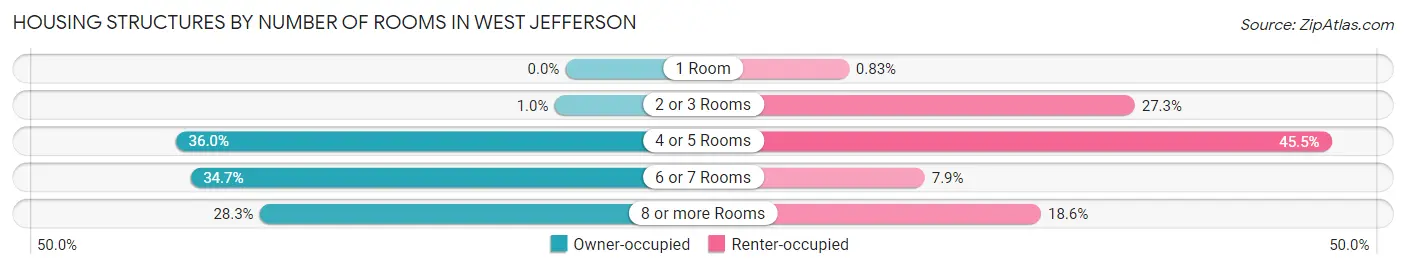
| Number of Rooms | Owner-occupied | Renter-occupied |
| 1 Room | 0 (0.0%) | 2 (0.8%) |
| 2 or 3 Rooms | 3 (1.0%) | 66 (27.3%) |
| 4 or 5 Rooms | 107 (36.0%) | 110 (45.5%) |
| 6 or 7 Rooms | 103 (34.7%) | 19 (7.9%) |
| 8 or more Rooms | 84 (28.3%) | 45 (18.6%) |
| Total | 297 (100.0%) | 242 (100.0%) |
Housing Structure by Heating Type in West Jefferson
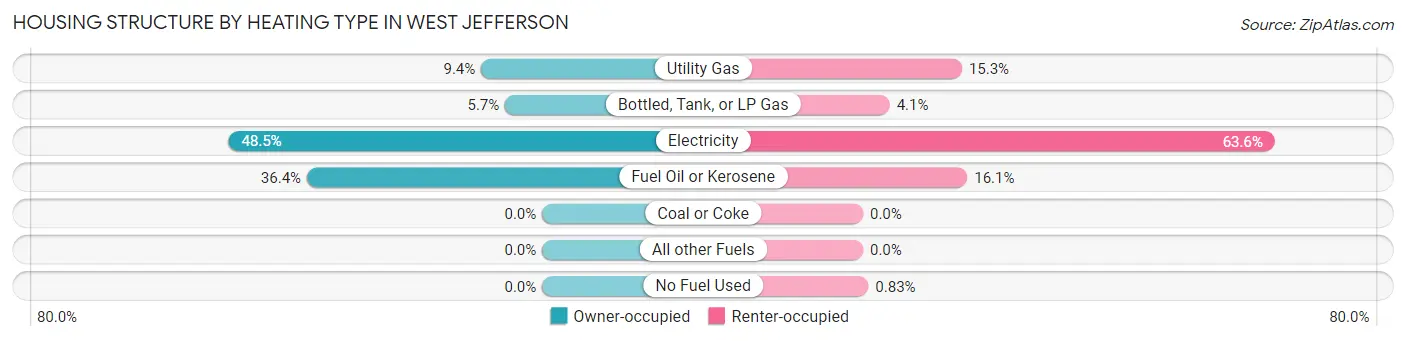
| Heating Type | Owner-occupied | Renter-occupied |
| Utility Gas | 28 (9.4%) | 37 (15.3%) |
| Bottled, Tank, or LP Gas | 17 (5.7%) | 10 (4.1%) |
| Electricity | 144 (48.5%) | 154 (63.6%) |
| Fuel Oil or Kerosene | 108 (36.4%) | 39 (16.1%) |
| Coal or Coke | 0 (0.0%) | 0 (0.0%) |
| All other Fuels | 0 (0.0%) | 0 (0.0%) |
| No Fuel Used | 0 (0.0%) | 2 (0.8%) |
| Total | 297 (100.0%) | 242 (100.0%) |
Household Vehicle Usage in West Jefferson
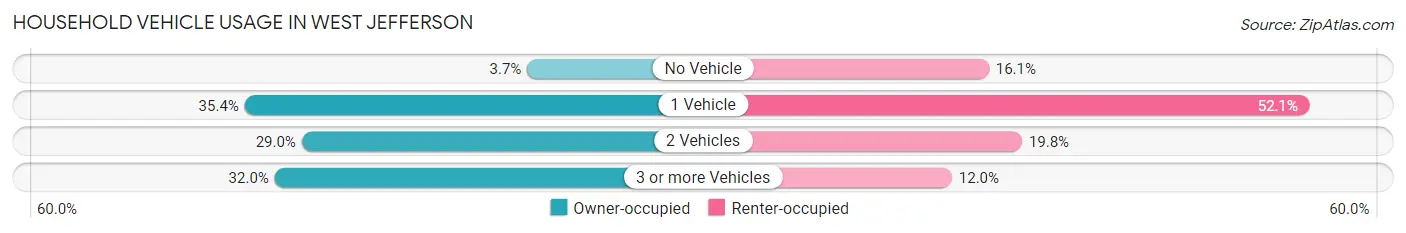
| Vehicles per Household | Owner-occupied | Renter-occupied |
| No Vehicle | 11 (3.7%) | 39 (16.1%) |
| 1 Vehicle | 105 (35.3%) | 126 (52.1%) |
| 2 Vehicles | 86 (29.0%) | 48 (19.8%) |
| 3 or more Vehicles | 95 (32.0%) | 29 (12.0%) |
| Total | 297 (100.0%) | 242 (100.0%) |
Real Estate & Mortgages in West Jefferson
Real Estate and Mortgage Overview in West Jefferson
| Characteristic | Without Mortgage | With Mortgage |
| Housing Units | 175 | 122 |
| Median Property Value | $188,700 | $196,900 |
| Median Household Income | $55,179 | $9 |
| Monthly Housing Costs | $397 | $0 |
| Real Estate Taxes | $963 | $0 |
Property Value by Mortgage Status in West Jefferson
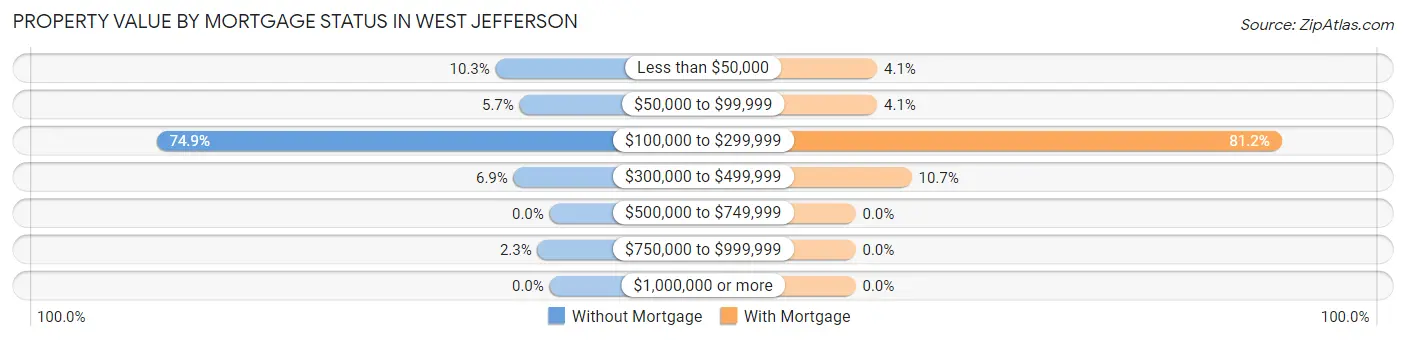
| Property Value | Without Mortgage | With Mortgage |
| Less than $50,000 | 18 (10.3%) | 5 (4.1%) |
| $50,000 to $99,999 | 10 (5.7%) | 5 (4.1%) |
| $100,000 to $299,999 | 131 (74.9%) | 99 (81.1%) |
| $300,000 to $499,999 | 12 (6.9%) | 13 (10.7%) |
| $500,000 to $749,999 | 0 (0.0%) | 0 (0.0%) |
| $750,000 to $999,999 | 4 (2.3%) | 0 (0.0%) |
| $1,000,000 or more | 0 (0.0%) | 0 (0.0%) |
| Total | 175 (100.0%) | 122 (100.0%) |
Household Income by Mortgage Status in West Jefferson
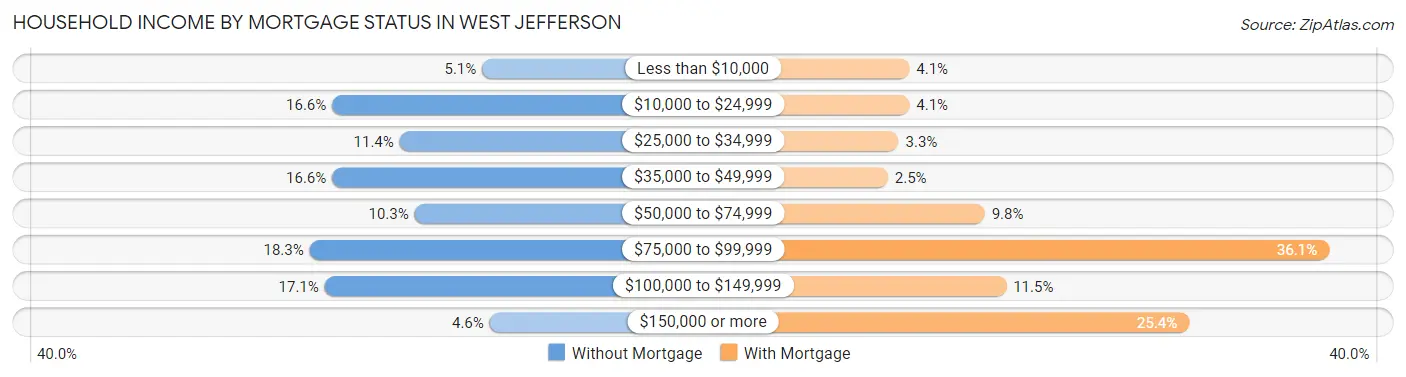
| Household Income | Without Mortgage | With Mortgage |
| Less than $10,000 | 9 (5.1%) | 5 (4.1%) |
| $10,000 to $24,999 | 29 (16.6%) | 5 (4.1%) |
| $25,000 to $34,999 | 20 (11.4%) | 4 (3.3%) |
| $35,000 to $49,999 | 29 (16.6%) | 3 (2.5%) |
| $50,000 to $74,999 | 18 (10.3%) | 12 (9.8%) |
| $75,000 to $99,999 | 32 (18.3%) | 44 (36.1%) |
| $100,000 to $149,999 | 30 (17.1%) | 14 (11.5%) |
| $150,000 or more | 8 (4.6%) | 31 (25.4%) |
| Total | 175 (100.0%) | 122 (100.0%) |
Property Value to Household Income Ratio in West Jefferson
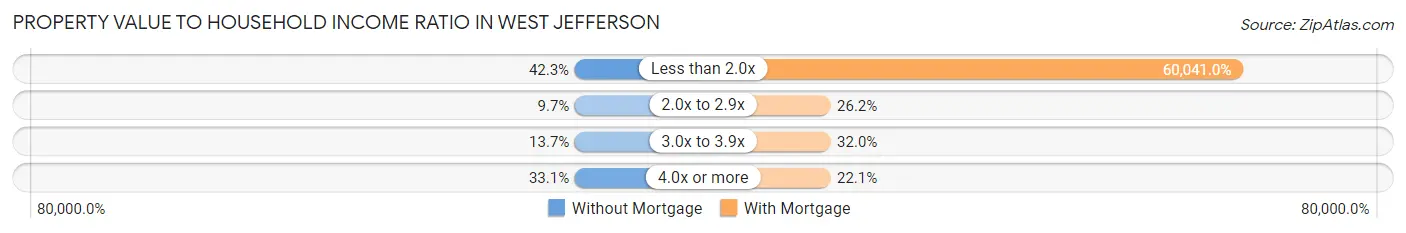
| Value-to-Income Ratio | Without Mortgage | With Mortgage |
| Less than 2.0x | 74 (42.3%) | 73,250 (60,041.0%) |
| 2.0x to 2.9x | 17 (9.7%) | 32 (26.2%) |
| 3.0x to 3.9x | 24 (13.7%) | 39 (32.0%) |
| 4.0x or more | 58 (33.1%) | 27 (22.1%) |
| Total | 175 (100.0%) | 122 (100.0%) |
Real Estate Taxes by Mortgage Status in West Jefferson
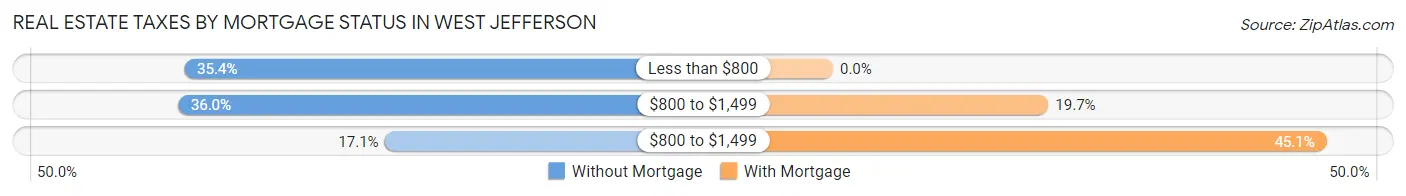
| Property Taxes | Without Mortgage | With Mortgage |
| Less than $800 | 62 (35.4%) | 0 (0.0%) |
| $800 to $1,499 | 63 (36.0%) | 24 (19.7%) |
| $800 to $1,499 | 30 (17.1%) | 55 (45.1%) |
| Total | 175 (100.0%) | 122 (100.0%) |
Health & Disability in West Jefferson
Health Insurance Coverage by Age in West Jefferson
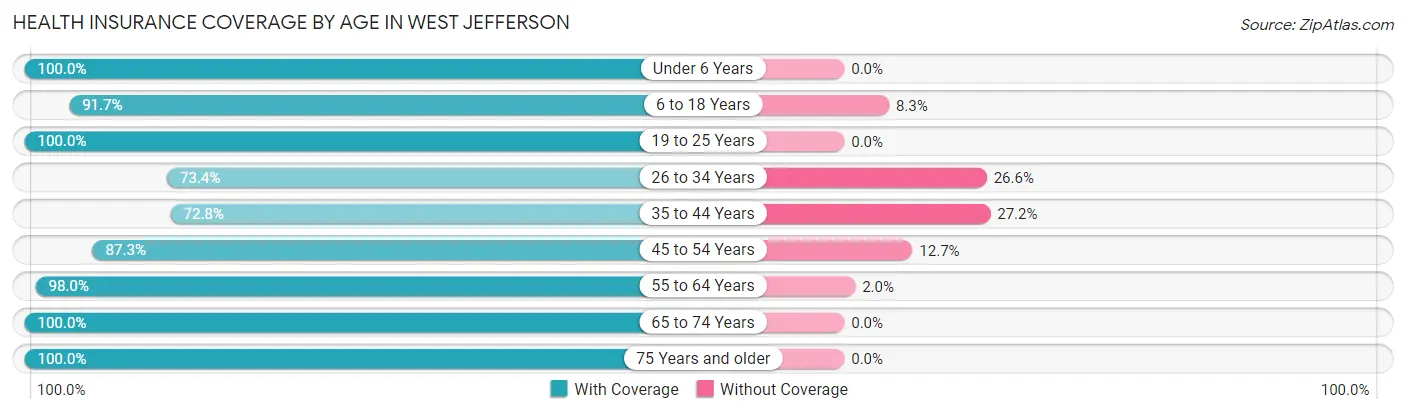
| Age Bracket | With Coverage | Without Coverage |
| Under 6 Years | 105 (100.0%) | 0 (0.0%) |
| 6 to 18 Years | 143 (91.7%) | 13 (8.3%) |
| 19 to 25 Years | 73 (100.0%) | 0 (0.0%) |
| 26 to 34 Years | 177 (73.4%) | 64 (26.6%) |
| 35 to 44 Years | 171 (72.8%) | 64 (27.2%) |
| 45 to 54 Years | 165 (87.3%) | 24 (12.7%) |
| 55 to 64 Years | 144 (98.0%) | 3 (2.0%) |
| 65 to 74 Years | 110 (100.0%) | 0 (0.0%) |
| 75 Years and older | 191 (100.0%) | 0 (0.0%) |
| Total | 1,279 (88.4%) | 168 (11.6%) |
Health Insurance Coverage by Citizenship Status in West Jefferson
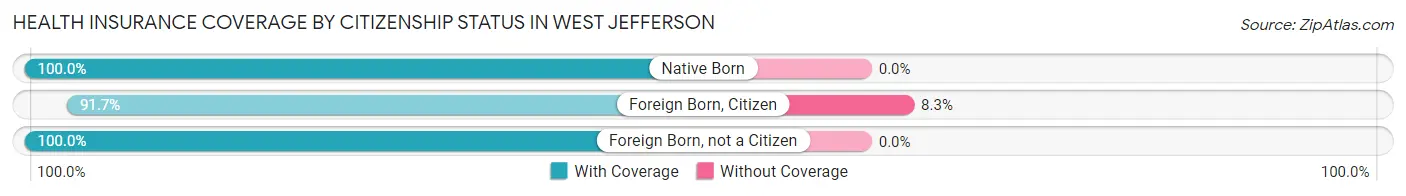
| Citizenship Status | With Coverage | Without Coverage |
| Native Born | 105 (100.0%) | 0 (0.0%) |
| Foreign Born, Citizen | 143 (91.7%) | 13 (8.3%) |
| Foreign Born, not a Citizen | 73 (100.0%) | 0 (0.0%) |
Health Insurance Coverage by Household Income in West Jefferson
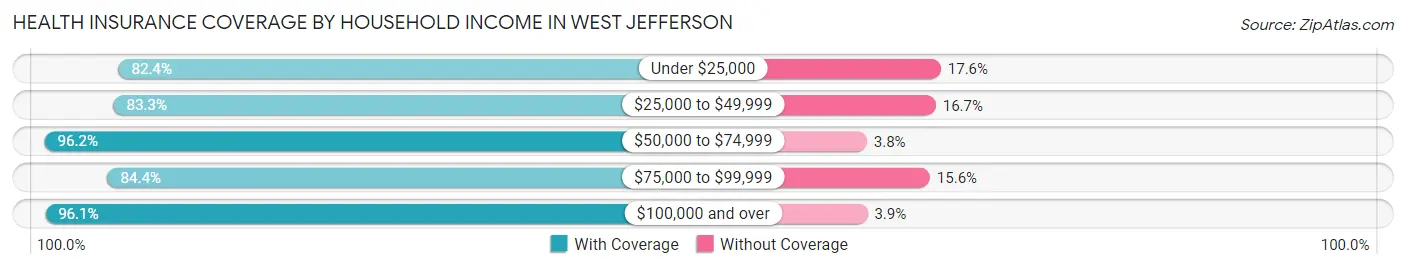
| Household Income | With Coverage | Without Coverage |
| Under $25,000 | 173 (82.4%) | 37 (17.6%) |
| $25,000 to $49,999 | 365 (83.3%) | 73 (16.7%) |
| $50,000 to $74,999 | 205 (96.2%) | 8 (3.8%) |
| $75,000 to $99,999 | 206 (84.4%) | 38 (15.6%) |
| $100,000 and over | 298 (96.1%) | 12 (3.9%) |
Public vs Private Health Insurance Coverage by Age in West Jefferson
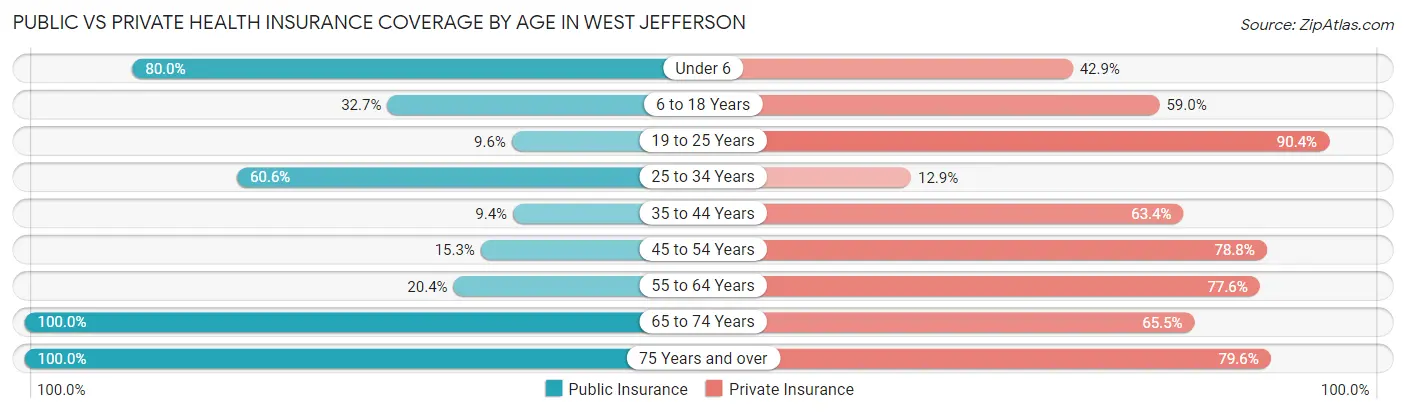
| Age Bracket | Public Insurance | Private Insurance |
| Under 6 | 84 (80.0%) | 45 (42.9%) |
| 6 to 18 Years | 51 (32.7%) | 92 (59.0%) |
| 19 to 25 Years | 7 (9.6%) | 66 (90.4%) |
| 25 to 34 Years | 146 (60.6%) | 31 (12.9%) |
| 35 to 44 Years | 22 (9.4%) | 149 (63.4%) |
| 45 to 54 Years | 29 (15.3%) | 149 (78.8%) |
| 55 to 64 Years | 30 (20.4%) | 114 (77.5%) |
| 65 to 74 Years | 110 (100.0%) | 72 (65.4%) |
| 75 Years and over | 191 (100.0%) | 152 (79.6%) |
| Total | 670 (46.3%) | 870 (60.1%) |
Disability Status by Sex by Age in West Jefferson
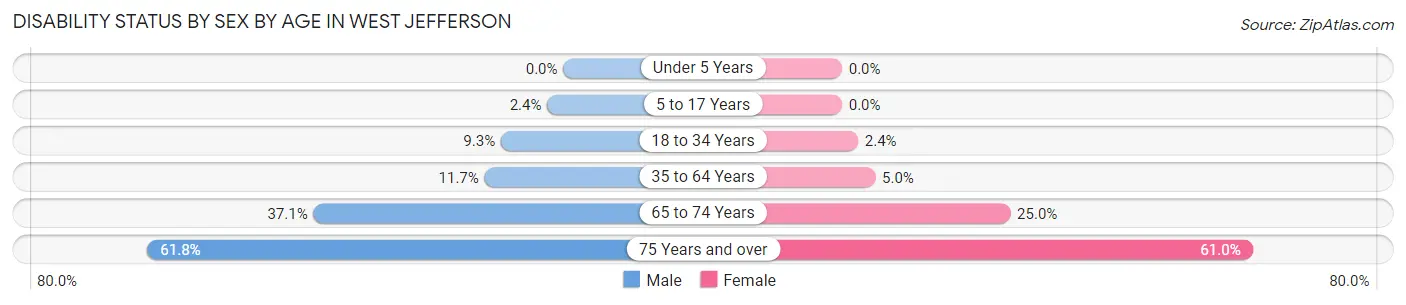
| Age Bracket | Male | Female |
| Under 5 Years | 0 (0.0%) | 0 (0.0%) |
| 5 to 17 Years | 2 (2.4%) | 0 (0.0%) |
| 18 to 34 Years | 10 (9.3%) | 5 (2.4%) |
| 35 to 64 Years | 29 (11.7%) | 16 (5.0%) |
| 65 to 74 Years | 23 (37.1%) | 12 (25.0%) |
| 75 Years and over | 42 (61.8%) | 75 (61.0%) |
Disability Class by Sex by Age in West Jefferson
Disability Class: Hearing Difficulty
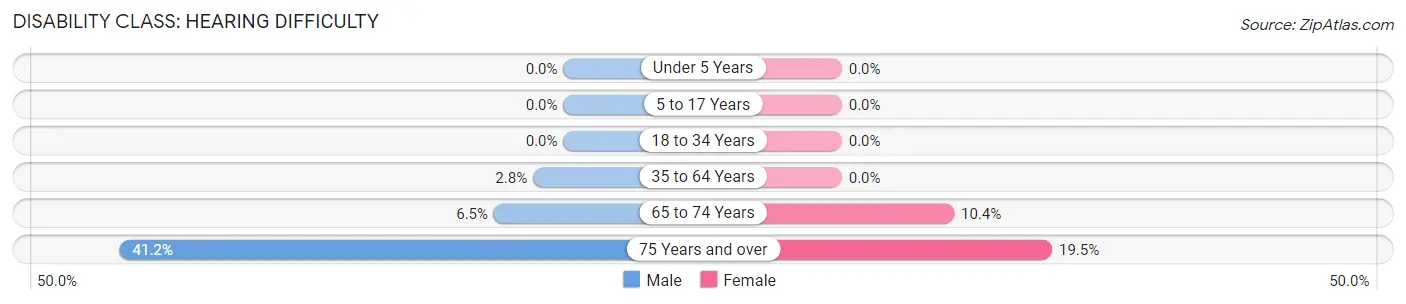
| Age Bracket | Male | Female |
| Under 5 Years | 0 (0.0%) | 0 (0.0%) |
| 5 to 17 Years | 0 (0.0%) | 0 (0.0%) |
| 18 to 34 Years | 0 (0.0%) | 0 (0.0%) |
| 35 to 64 Years | 7 (2.8%) | 0 (0.0%) |
| 65 to 74 Years | 4 (6.5%) | 5 (10.4%) |
| 75 Years and over | 28 (41.2%) | 24 (19.5%) |
Disability Class: Vision Difficulty
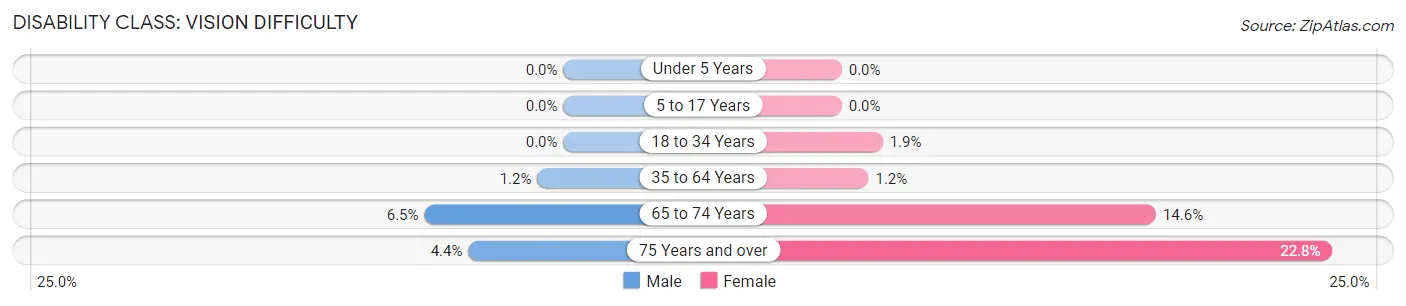
| Age Bracket | Male | Female |
| Under 5 Years | 0 (0.0%) | 0 (0.0%) |
| 5 to 17 Years | 0 (0.0%) | 0 (0.0%) |
| 18 to 34 Years | 0 (0.0%) | 4 (1.9%) |
| 35 to 64 Years | 3 (1.2%) | 4 (1.2%) |
| 65 to 74 Years | 4 (6.5%) | 7 (14.6%) |
| 75 Years and over | 3 (4.4%) | 28 (22.8%) |
Disability Class: Cognitive Difficulty
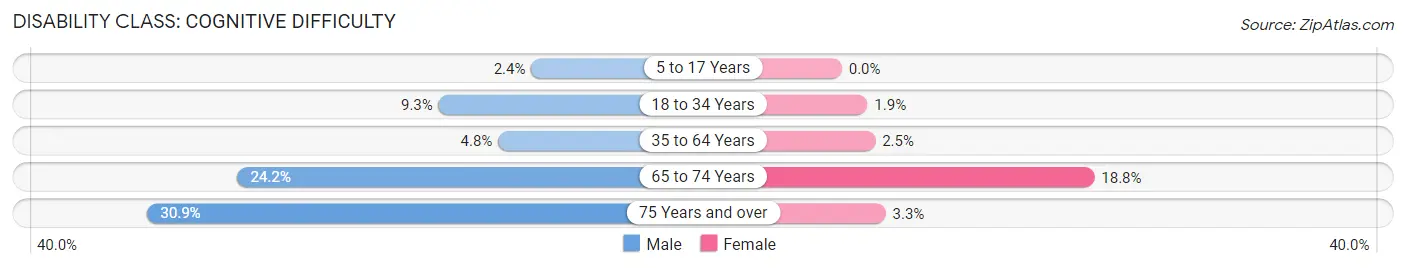
| Age Bracket | Male | Female |
| 5 to 17 Years | 2 (2.4%) | 0 (0.0%) |
| 18 to 34 Years | 10 (9.3%) | 4 (1.9%) |
| 35 to 64 Years | 12 (4.8%) | 8 (2.5%) |
| 65 to 74 Years | 15 (24.2%) | 9 (18.8%) |
| 75 Years and over | 21 (30.9%) | 4 (3.3%) |
Disability Class: Ambulatory Difficulty
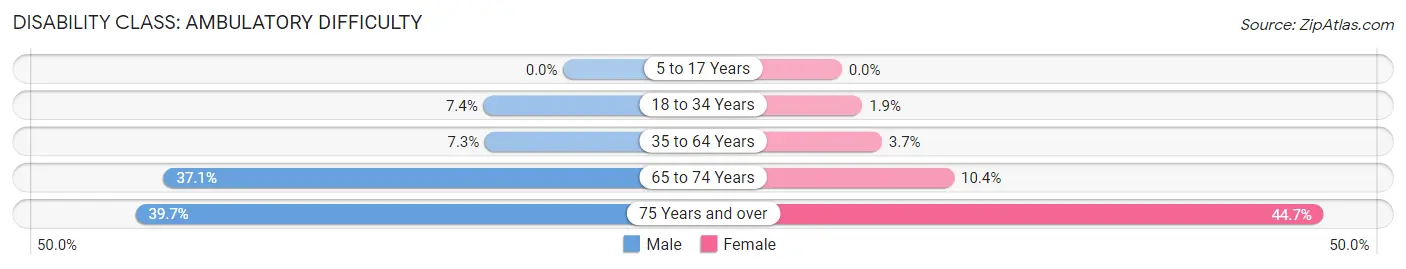
| Age Bracket | Male | Female |
| 5 to 17 Years | 0 (0.0%) | 0 (0.0%) |
| 18 to 34 Years | 8 (7.4%) | 4 (1.9%) |
| 35 to 64 Years | 18 (7.3%) | 12 (3.7%) |
| 65 to 74 Years | 23 (37.1%) | 5 (10.4%) |
| 75 Years and over | 27 (39.7%) | 55 (44.7%) |
Disability Class: Self-Care Difficulty
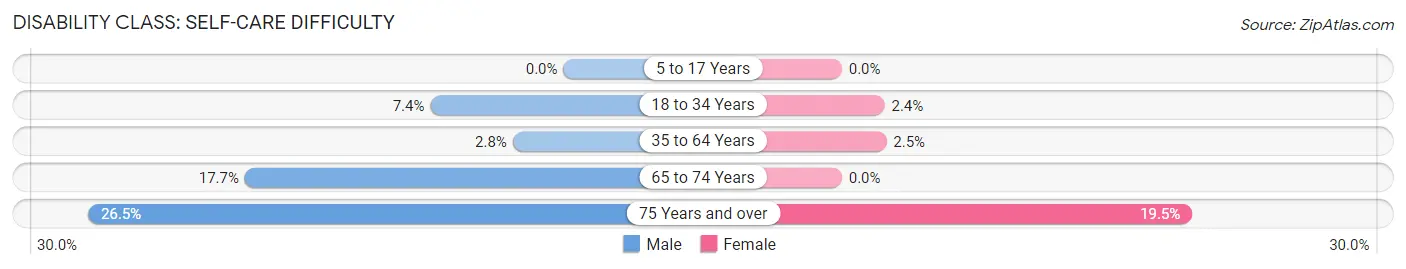
| Age Bracket | Male | Female |
| 5 to 17 Years | 0 (0.0%) | 0 (0.0%) |
| 18 to 34 Years | 8 (7.4%) | 5 (2.4%) |
| 35 to 64 Years | 7 (2.8%) | 8 (2.5%) |
| 65 to 74 Years | 11 (17.7%) | 0 (0.0%) |
| 75 Years and over | 18 (26.5%) | 24 (19.5%) |
Technology Access in West Jefferson
Computing Device Access in West Jefferson
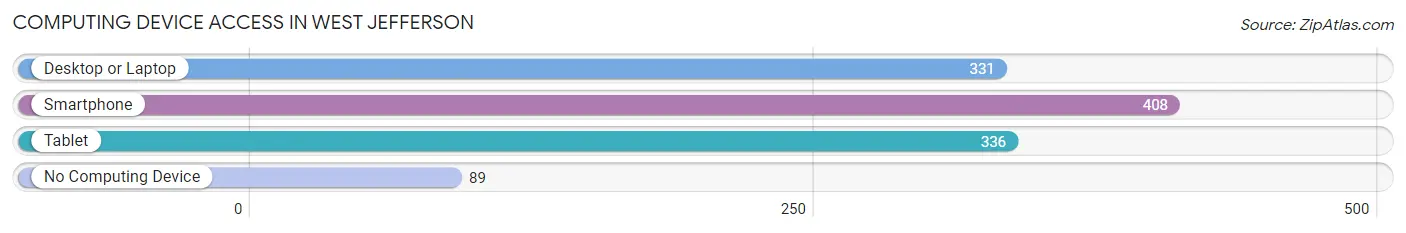
| Device Type | # Households | % Households |
| Desktop or Laptop | 331 | 61.4% |
| Smartphone | 408 | 75.7% |
| Tablet | 336 | 62.3% |
| No Computing Device | 89 | 16.5% |
| Total | 539 | 100.0% |
Internet Access in West Jefferson
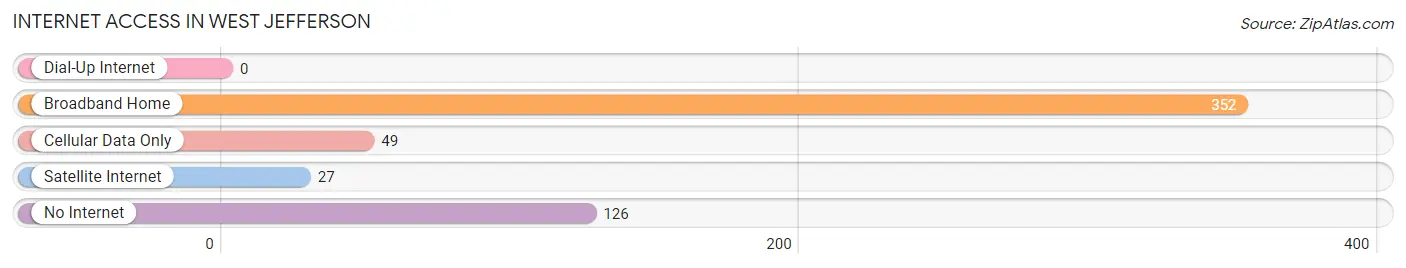
| Internet Type | # Households | % Households |
| Dial-Up Internet | 0 | 0.0% |
| Broadband Home | 352 | 65.3% |
| Cellular Data Only | 49 | 9.1% |
| Satellite Internet | 27 | 5.0% |
| No Internet | 126 | 23.4% |
| Total | 539 | 100.0% |
West Jefferson Summary
West Jefferson, North Carolina is a small town located in the Blue Ridge Mountains of Ashe County. It is situated at the intersection of US 221 and NC 194, and is the county seat of Ashe County. The town has a population of 1,845 as of the 2010 census, and is part of the Boone, North Carolina Metropolitan Statistical Area.
History
West Jefferson was founded in 1799 by a group of settlers from Wilkes County, North Carolina. The town was originally known as “Jefferson”, but the name was changed to “West Jefferson” in 1802 to distinguish it from the nearby town of Jefferson, North Carolina. The town was incorporated in 1891.
The town was an important stop on the stagecoach route between Abingdon, Virginia and Asheville, North Carolina. The stagecoach route was used by many settlers traveling to the western part of the state.
The town was also an important stop on the Norfolk and Western Railroad, which ran from Norfolk, Virginia to Asheville, North Carolina. The railroad was used to transport goods and passengers to and from the area.
Geography
West Jefferson is located in the Blue Ridge Mountains of Ashe County, North Carolina. The town is situated at the intersection of US 221 and NC 194. The town is located at an elevation of 2,000 feet above sea level.
The town is surrounded by the Blue Ridge Mountains, which provide a beautiful backdrop for the town. The town is also located near the New River, which is a popular destination for fishing, canoeing, and kayaking.
Economy
West Jefferson’s economy is largely based on tourism. The town is a popular destination for outdoor activities such as hiking, fishing, and camping. The town is also home to several antique stores, art galleries, and restaurants.
The town is also home to several manufacturing companies, including a furniture manufacturer, a textile mill, and a plastics manufacturer.
Demographics
As of the 2010 census, West Jefferson had a population of 1,845. The racial makeup of the town was 95.3% White, 1.2% African American, 0.3% Native American, 0.7% Asian, 0.1% Pacific Islander, 0.9% from other races, and 1.7% from two or more races. Hispanic or Latino of any race were 2.2% of the population.
The median income for a household in the town was $30,938, and the median income for a family was $37,917. The per capita income for the town was $17,845. About 15.2% of families and 18.2% of the population were below the poverty line, including 25.2% of those under age 18 and 11.2% of those age 65 or over.
West Jefferson is a small town with a rich history and a vibrant economy. The town is a popular destination for outdoor activities, and is home to several manufacturing companies. The town has a diverse population, with a median income that is slightly below the national average.
Common Questions
What is Per Capita Income in West Jefferson?
Per Capita income in West Jefferson is $23,043.
What is the Median Family Income in West Jefferson?
Median Family Income in West Jefferson is $74,750.
What is the Median Household income in West Jefferson?
Median Household Income in West Jefferson is $41,036.
What is Income or Wage Gap in West Jefferson?
Income or Wage Gap in West Jefferson is 8.0%.
Women in West Jefferson earn 92.0 cents for every dollar earned by a man.
What is Inequality or Gini Index in West Jefferson?
Inequality or Gini Index in West Jefferson is 0.47.
What is the Total Population of West Jefferson?
Total Population of West Jefferson is 1,508.
What is the Total Male Population of West Jefferson?
Total Male Population of West Jefferson is 622.
What is the Total Female Population of West Jefferson?
Total Female Population of West Jefferson is 886.
What is the Ratio of Males per 100 Females in West Jefferson?
There are 70.20 Males per 100 Females in West Jefferson.
What is the Ratio of Females per 100 Males in West Jefferson?
There are 142.44 Females per 100 Males in West Jefferson.
What is the Median Population Age in West Jefferson?
Median Population Age in West Jefferson is 43.4 Years.
What is the Average Family Size in West Jefferson
Average Family Size in West Jefferson is 3.8 People.
What is the Average Household Size in West Jefferson
Average Household Size in West Jefferson is 2.6 People.
How Large is the Labor Force in West Jefferson?
There are 756 People in the Labor Forcein in West Jefferson.
What is the Percentage of People in the Labor Force in West Jefferson?
58.8% of People are in the Labor Force in West Jefferson.
What is the Unemployment Rate in West Jefferson?
Unemployment Rate in West Jefferson is 22.3%.