Weaverville, NC Map & Demographics
Weaverville Map
Weaverville Overview
$41,549
PER CAPITA INCOME
$90,781
AVG FAMILY INCOME
$76,310
AVG HOUSEHOLD INCOME
7.3%
WAGE / INCOME GAP [ % ]
92.7¢/ $1
WAGE / INCOME GAP [ $ ]
0.37
INEQUALITY / GINI INDEX
4,559
TOTAL POPULATION
2,049
MALE POPULATION
2,510
FEMALE POPULATION
81.63
MALES / 100 FEMALES
122.50
FEMALES / 100 MALES
53.5
MEDIAN AGE
2.7
AVG FAMILY SIZE
2.3
AVG HOUSEHOLD SIZE
2,442
LABOR FORCE [ PEOPLE ]
61.1%
PERCENT IN LABOR FORCE
1.3%
UNEMPLOYMENT RATE
Weaverville Zip Codes
Weaverville Area Codes
Income in Weaverville
Income Overview in Weaverville
Per Capita Income in Weaverville is $41,549, while median incomes of families and households are $90,781 and $76,310 respectively.
| Characteristic | Number | Measure |
| Per Capita Income | 4,559 | $41,549 |
| Median Family Income | 1,302 | $90,781 |
| Mean Family Income | 1,302 | $108,648 |
| Median Household Income | 1,962 | $76,310 |
| Mean Household Income | 1,962 | $94,845 |
| Income Deficit | 1,302 | $0 |
| Wage / Income Gap (%) | 4,559 | 7.26% |
| Wage / Income Gap ($) | 4,559 | 92.74¢ per $1 |
| Gini / Inequality Index | 4,559 | 0.37 |
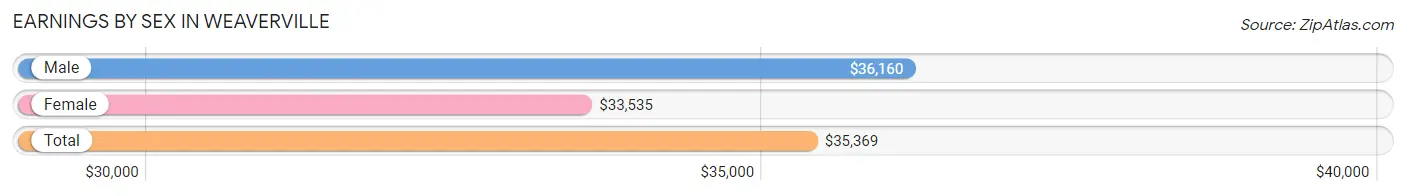
Earnings by Sex in Weaverville
Average Earnings in Weaverville are $35,369, $36,160 for men and $33,535 for women, a difference of 7.3%.
| Sex | Number | Average Earnings |
| Male | 1,342 (51.2%) | $36,160 |
| Female | 1,279 (48.8%) | $33,535 |
| Total | 2,621 (100.0%) | $35,369 |
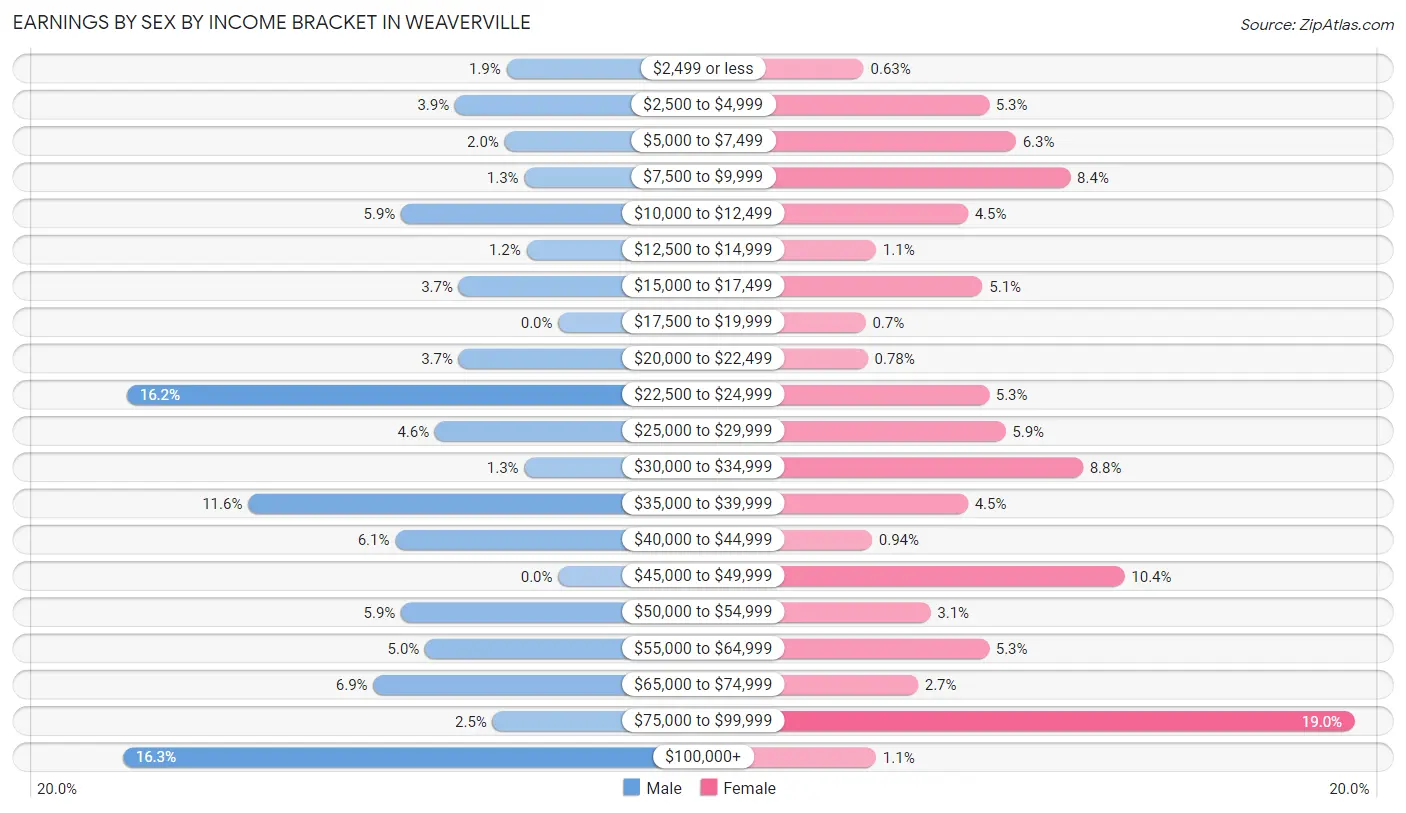
Earnings by Sex by Income Bracket in Weaverville
The most common earnings brackets in Weaverville are $100,000+ for men (219 | 16.3%) and $75,000 to $99,999 for women (243 | 19.0%).
| Income | Male | Female |
| $2,499 or less | 26 (1.9%) | 8 (0.6%) |
| $2,500 to $4,999 | 52 (3.9%) | 68 (5.3%) |
| $5,000 to $7,499 | 27 (2.0%) | 81 (6.3%) |
| $7,500 to $9,999 | 17 (1.3%) | 107 (8.4%) |
| $10,000 to $12,499 | 79 (5.9%) | 58 (4.5%) |
| $12,500 to $14,999 | 16 (1.2%) | 14 (1.1%) |
| $15,000 to $17,499 | 50 (3.7%) | 65 (5.1%) |
| $17,500 to $19,999 | 0 (0.0%) | 9 (0.7%) |
| $20,000 to $22,499 | 50 (3.7%) | 10 (0.8%) |
| $22,500 to $24,999 | 217 (16.2%) | 68 (5.3%) |
| $25,000 to $29,999 | 62 (4.6%) | 76 (5.9%) |
| $30,000 to $34,999 | 17 (1.3%) | 113 (8.8%) |
| $35,000 to $39,999 | 156 (11.6%) | 58 (4.5%) |
| $40,000 to $44,999 | 82 (6.1%) | 12 (0.9%) |
| $45,000 to $49,999 | 0 (0.0%) | 133 (10.4%) |
| $50,000 to $54,999 | 79 (5.9%) | 40 (3.1%) |
| $55,000 to $64,999 | 67 (5.0%) | 68 (5.3%) |
| $65,000 to $74,999 | 93 (6.9%) | 34 (2.7%) |
| $75,000 to $99,999 | 33 (2.5%) | 243 (19.0%) |
| $100,000+ | 219 (16.3%) | 14 (1.1%) |
| Total | 1,342 (100.0%) | 1,279 (100.0%) |
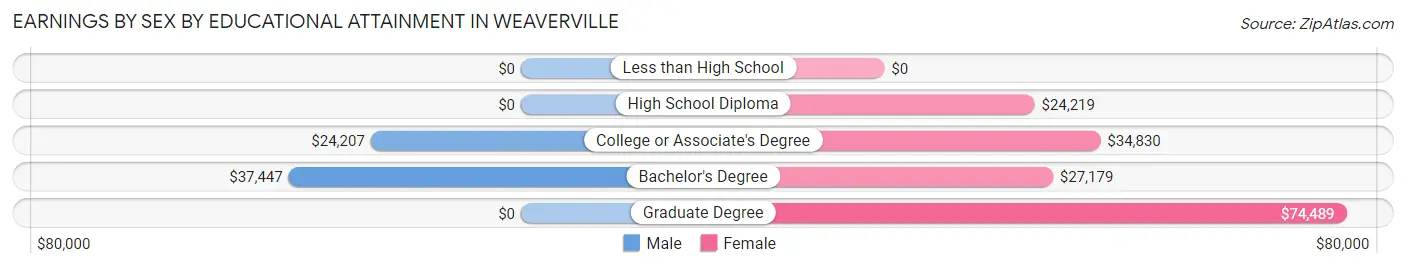
Earnings by Sex by Educational Attainment in Weaverville
Average earnings in Weaverville are $36,563 for men and $34,214 for women, a difference of 6.4%. Men with an educational attainment of bachelor's degree enjoy the highest average annual earnings of $37,447, while those with college or associate's degree education earn the least with $24,207. Women with an educational attainment of graduate degree earn the most with the average annual earnings of $74,489, while those with high school diploma education have the smallest earnings of $24,219.
| Educational Attainment | Male Income | Female Income |
| Less than High School | - | - |
| High School Diploma | - | - |
| College or Associate's Degree | $24,207 | $34,830 |
| Bachelor's Degree | $37,447 | $27,179 |
| Graduate Degree | - | - |
| Total | $36,563 | $34,214 |
Family Income in Weaverville
Family Income Brackets in Weaverville
According to the Weaverville family income data, there are 428 families falling into the $50,000 to $74,999 income range, which is the most common income bracket and makes up 32.9% of all families. Conversely, the less than $10,000 income bracket is the least frequent group with only 12 families (0.9%) belonging to this category.
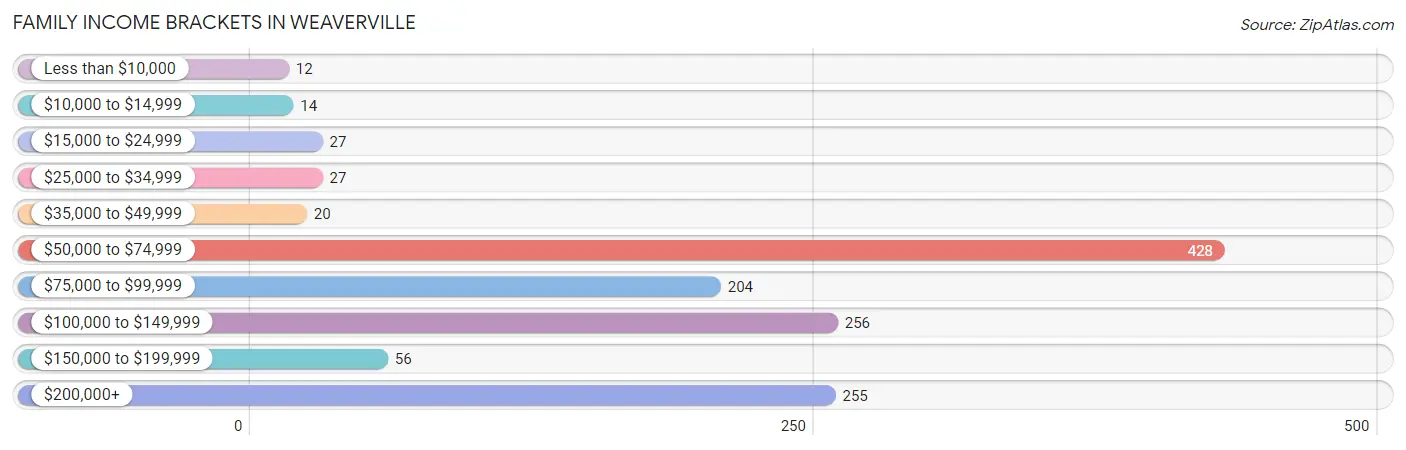
| Income Bracket | # Families | % Families |
| Less than $10,000 | 12 | 0.9% |
| $10,000 to $14,999 | 14 | 1.1% |
| $15,000 to $24,999 | 27 | 2.1% |
| $25,000 to $34,999 | 27 | 2.1% |
| $35,000 to $49,999 | 20 | 1.5% |
| $50,000 to $74,999 | 428 | 32.9% |
| $75,000 to $99,999 | 204 | 15.7% |
| $100,000 to $149,999 | 256 | 19.7% |
| $150,000 to $199,999 | 56 | 4.3% |
| $200,000+ | 255 | 19.6% |
Family Income by Famaliy Size in Weaverville
4-person families (208 | 16.0%) account for the highest median family income in Weaverville with $94,097 per family, while 2-person families (936 | 71.9%) have the highest median income of $42,778 per family member.
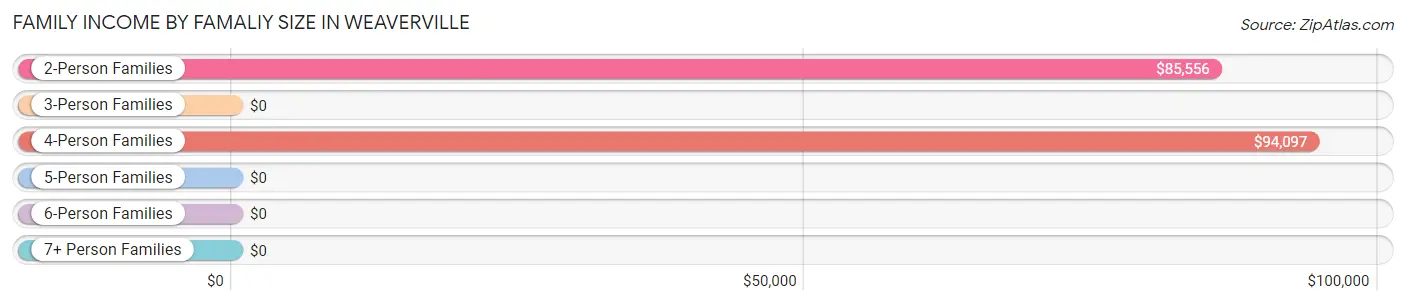
| Income Bracket | # Families | Median Income |
| 2-Person Families | 936 (71.9%) | $85,556 |
| 3-Person Families | 137 (10.5%) | $0 |
| 4-Person Families | 208 (16.0%) | $94,097 |
| 5-Person Families | 21 (1.6%) | $0 |
| 6-Person Families | 0 (0.0%) | $0 |
| 7+ Person Families | 0 (0.0%) | $0 |
| Total | 1,302 (100.0%) | $90,781 |
Family Income by Number of Earners in Weaverville
The median family income in Weaverville is $90,781, with families comprising 3+ earners (67) having the highest median family income of $124,125, while families with 1 earner (555) have the lowest median family income of $54,750, accounting for 5.1% and 42.6% of families, respectively.
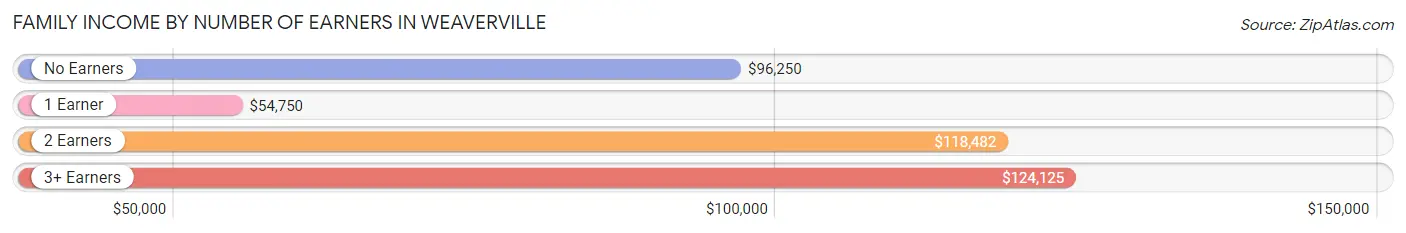
| Number of Earners | # Families | Median Income |
| No Earners | 154 (11.8%) | $96,250 |
| 1 Earner | 555 (42.6%) | $54,750 |
| 2 Earners | 526 (40.4%) | $118,482 |
| 3+ Earners | 67 (5.1%) | $124,125 |
| Total | 1,302 (100.0%) | $90,781 |
Household Income in Weaverville
Household Income Brackets in Weaverville
With 490 households falling in the category, the $50,000 to $74,999 income range is the most frequent in Weaverville, accounting for 25.0% of all households. In contrast, only 39 households (2.0%) fall into the $10,000 to $14,999 income bracket, making it the least populous group.
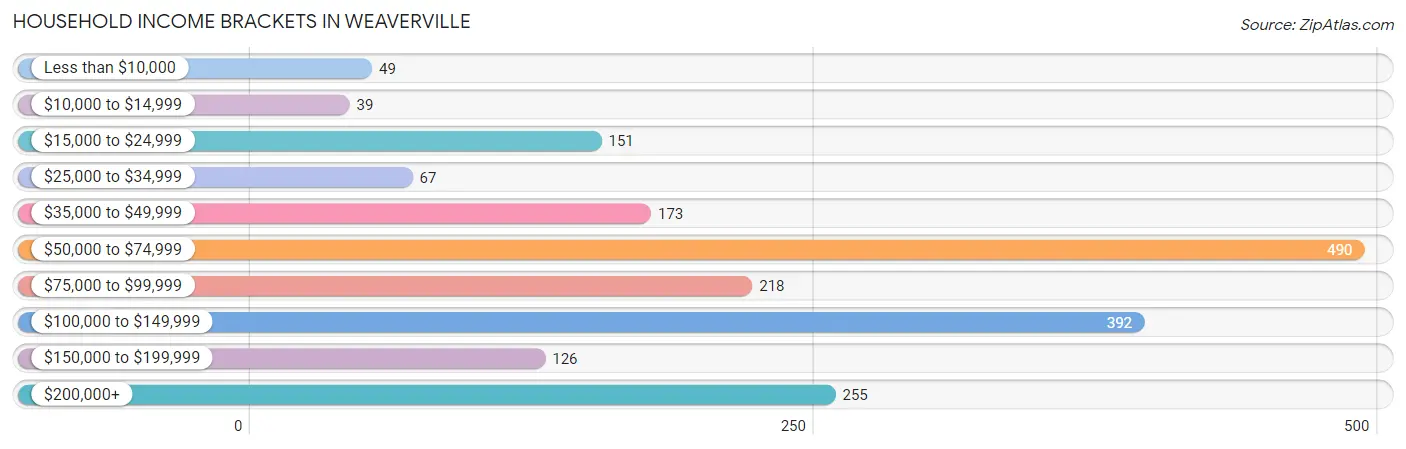
| Income Bracket | # Households | % Households |
| Less than $10,000 | 49 | 2.5% |
| $10,000 to $14,999 | 39 | 2.0% |
| $15,000 to $24,999 | 151 | 7.7% |
| $25,000 to $34,999 | 67 | 3.4% |
| $35,000 to $49,999 | 173 | 8.8% |
| $50,000 to $74,999 | 490 | 25.0% |
| $75,000 to $99,999 | 218 | 11.1% |
| $100,000 to $149,999 | 392 | 20.0% |
| $150,000 to $199,999 | 126 | 6.4% |
| $200,000+ | 255 | 13.0% |
Household Income by Householder Age in Weaverville
The median household income in Weaverville is $76,310, with the highest median household income of $85,486 found in the 65+ years age bracket for the primary householder. A total of 653 households (33.3%) fall into this category. Meanwhile, the 15 to 24 years age bracket for the primary householder has the lowest median household income of $0, with 22 households (1.1%) in this group.
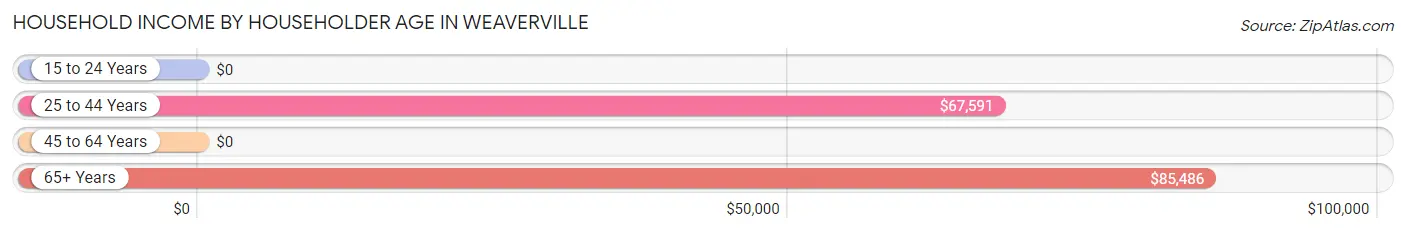
| Income Bracket | # Households | Median Income |
| 15 to 24 Years | 22 (1.1%) | $0 |
| 25 to 44 Years | 387 (19.7%) | $67,591 |
| 45 to 64 Years | 900 (45.9%) | $0 |
| 65+ Years | 653 (33.3%) | $85,486 |
| Total | 1,962 (100.0%) | $76,310 |
Poverty in Weaverville
Income Below Poverty by Sex and Age in Weaverville
With 7.5% poverty level for males and 4.3% for females among the residents of Weaverville, 12 to 14 year old males and 5 year old females are the most vulnerable to poverty, with 17 males (37.0%) and 15 females (100.0%) in their respective age groups living below the poverty level.
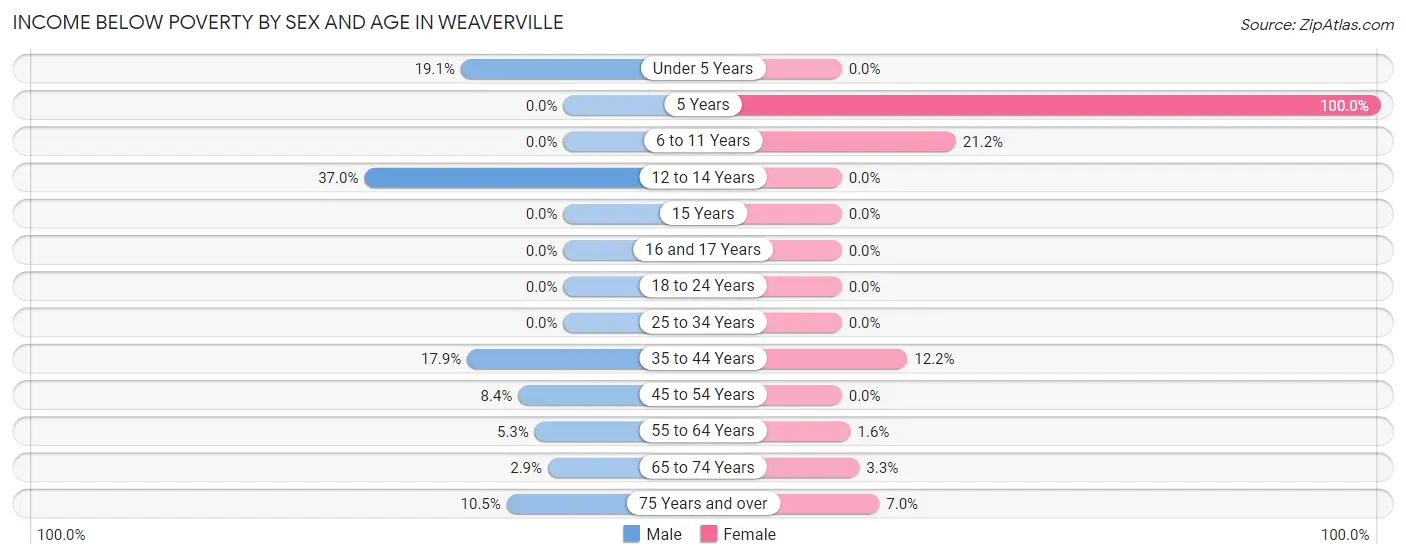
| Age Bracket | Male | Female |
| Under 5 Years | 16 (19.1%) | 0 (0.0%) |
| 5 Years | 0 (0.0%) | 15 (100.0%) |
| 6 to 11 Years | 0 (0.0%) | 18 (21.2%) |
| 12 to 14 Years | 17 (37.0%) | 0 (0.0%) |
| 15 Years | 0 (0.0%) | 0 (0.0%) |
| 16 and 17 Years | 0 (0.0%) | 0 (0.0%) |
| 18 to 24 Years | 0 (0.0%) | 0 (0.0%) |
| 25 to 34 Years | 0 (0.0%) | 0 (0.0%) |
| 35 to 44 Years | 47 (17.9%) | 32 (12.2%) |
| 45 to 54 Years | 26 (8.4%) | 0 (0.0%) |
| 55 to 64 Years | 19 (5.3%) | 10 (1.6%) |
| 65 to 74 Years | 9 (2.9%) | 12 (3.3%) |
| 75 Years and over | 18 (10.5%) | 17 (7.0%) |
| Total | 152 (7.5%) | 104 (4.3%) |
Income Above Poverty by Sex and Age in Weaverville
According to the poverty statistics in Weaverville, males aged 5 years and females aged under 5 years are the age groups that are most secure financially, with 100.0% of males and 100.0% of females in these age groups living above the poverty line.
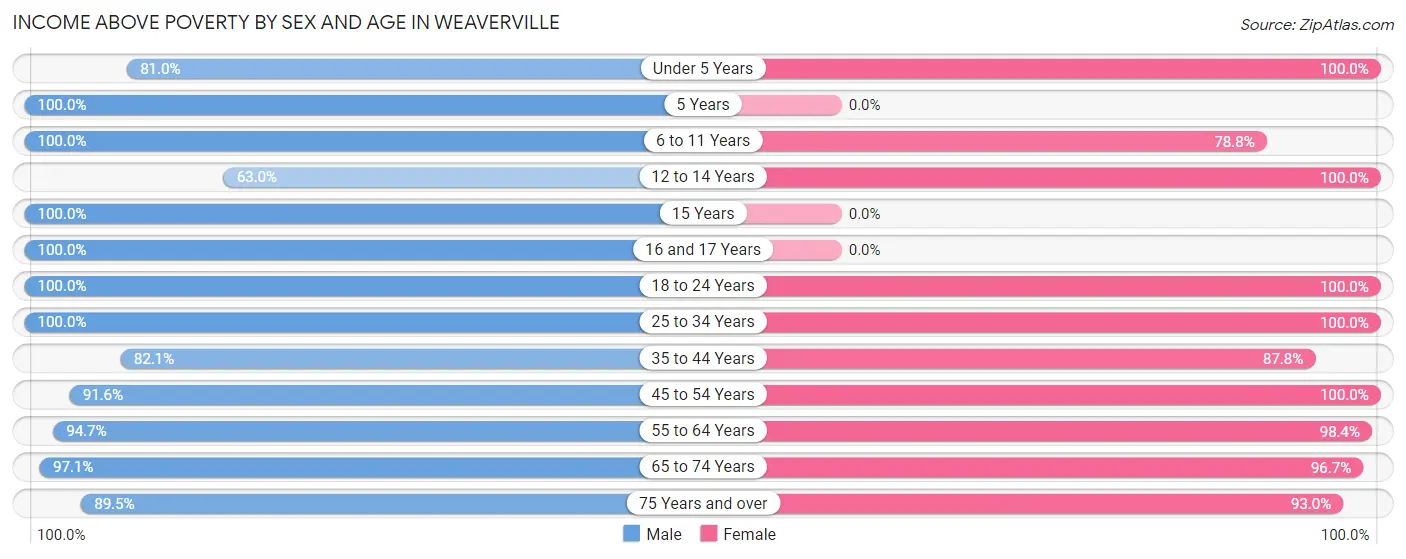
| Age Bracket | Male | Female |
| Under 5 Years | 68 (80.9%) | 120 (100.0%) |
| 5 Years | 13 (100.0%) | 0 (0.0%) |
| 6 to 11 Years | 56 (100.0%) | 67 (78.8%) |
| 12 to 14 Years | 29 (63.0%) | 51 (100.0%) |
| 15 Years | 77 (100.0%) | 0 (0.0%) |
| 16 and 17 Years | 14 (100.0%) | 0 (0.0%) |
| 18 to 24 Years | 100 (100.0%) | 87 (100.0%) |
| 25 to 34 Years | 219 (100.0%) | 209 (100.0%) |
| 35 to 44 Years | 216 (82.1%) | 231 (87.8%) |
| 45 to 54 Years | 284 (91.6%) | 346 (100.0%) |
| 55 to 64 Years | 337 (94.7%) | 605 (98.4%) |
| 65 to 74 Years | 305 (97.1%) | 355 (96.7%) |
| 75 Years and over | 153 (89.5%) | 227 (93.0%) |
| Total | 1,871 (92.5%) | 2,298 (95.7%) |
Income Below Poverty Among Married-Couple Families in Weaverville
The poverty statistics for married-couple families in Weaverville show that 1.6% or 18 of the total 1,130 families live below the poverty line. Families with 1 or 2 children have the highest poverty rate of 7.9%, comprising of 18 families. On the other hand, families with no children have the lowest poverty rate of 0.0%, which includes 0 families.
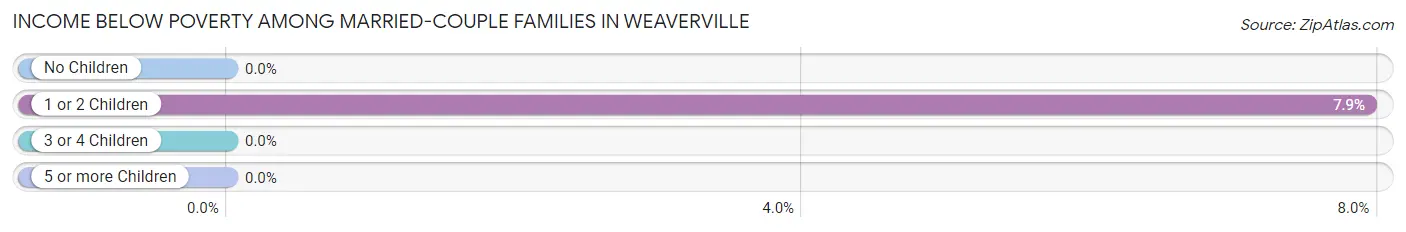
| Children | Above Poverty | Below Poverty |
| No Children | 903 (100.0%) | 0 (0.0%) |
| 1 or 2 Children | 209 (92.1%) | 18 (7.9%) |
| 3 or 4 Children | 0 (0.0%) | 0 (0.0%) |
| 5 or more Children | 0 (0.0%) | 0 (0.0%) |
| Total | 1,112 (98.4%) | 18 (1.6%) |
Income Below Poverty Among Single-Parent Households in Weaverville
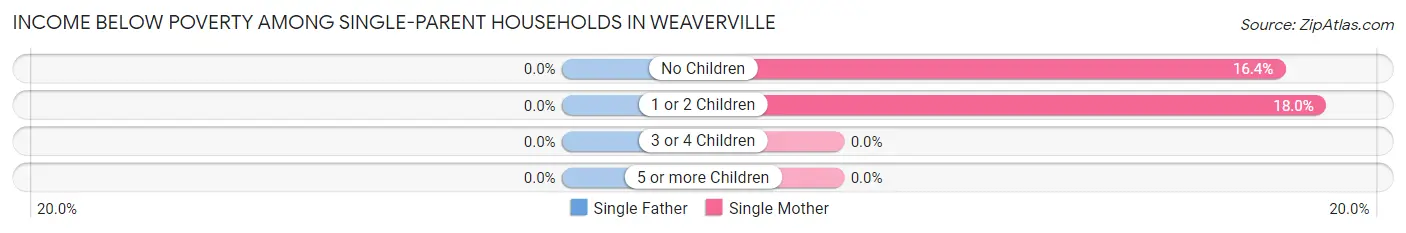
| Children | Single Father | Single Mother |
| No Children | 0 (0.0%) | 12 (16.4%) |
| 1 or 2 Children | 0 (0.0%) | 14 (17.9%) |
| 3 or 4 Children | 0 (0.0%) | 0 (0.0%) |
| 5 or more Children | 0 (0.0%) | 0 (0.0%) |
| Total | 0 (0.0%) | 26 (17.2%) |
Income Below Poverty Among Married-Couple vs Single-Parent Households in Weaverville
The poverty data for Weaverville shows that 18 of the married-couple family households (1.6%) and 26 of the single-parent households (15.1%) are living below the poverty level. Within the married-couple family households, those with 1 or 2 children have the highest poverty rate, with 18 households (7.9%) falling below the poverty line. Among the single-parent households, those with 1 or 2 children have the highest poverty rate, with 14 household (17.9%) living below poverty.
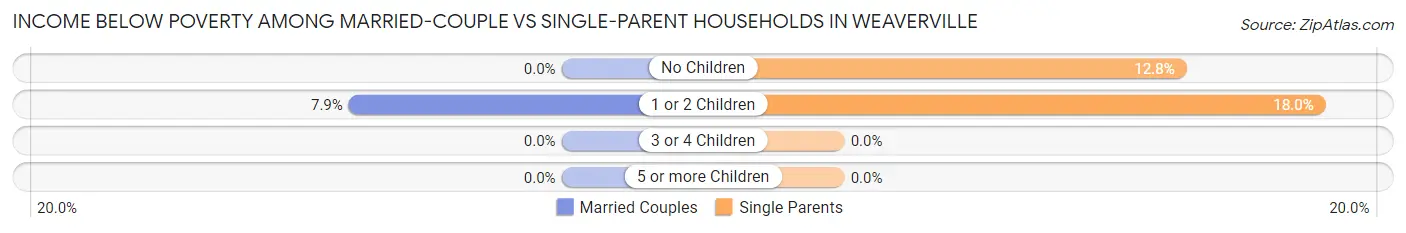
| Children | Married-Couple Families | Single-Parent Households |
| No Children | 0 (0.0%) | 12 (12.8%) |
| 1 or 2 Children | 18 (7.9%) | 14 (17.9%) |
| 3 or 4 Children | 0 (0.0%) | 0 (0.0%) |
| 5 or more Children | 0 (0.0%) | 0 (0.0%) |
| Total | 18 (1.6%) | 26 (15.1%) |
Race in Weaverville
The most populous races in Weaverville are White / Caucasian (4,288 | 94.1%), Two or more Races (147 | 3.2%), and Hispanic or Latino (74 | 1.6%).
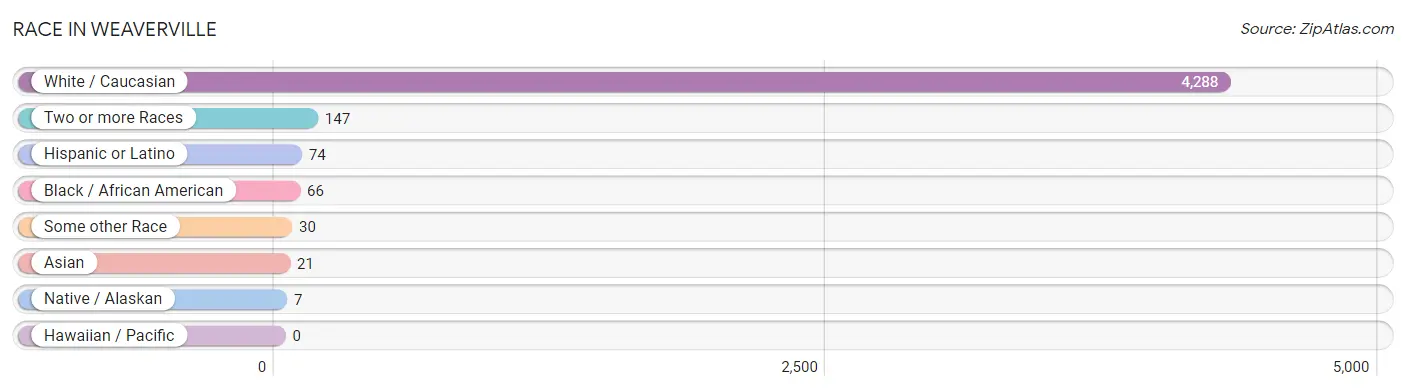
| Race | # Population | % Population |
| Asian | 21 | 0.5% |
| Black / African American | 66 | 1.5% |
| Hawaiian / Pacific | 0 | 0.0% |
| Hispanic or Latino | 74 | 1.6% |
| Native / Alaskan | 7 | 0.2% |
| White / Caucasian | 4,288 | 94.1% |
| Two or more Races | 147 | 3.2% |
| Some other Race | 30 | 0.7% |
| Total | 4,559 | 100.0% |
Ancestry in Weaverville
The most populous ancestries reported in Weaverville are English (1,216 | 26.7%), Italian (508 | 11.1%), Irish (414 | 9.1%), American (382 | 8.4%), and German (365 | 8.0%), together accounting for 63.3% of all Weaverville residents.
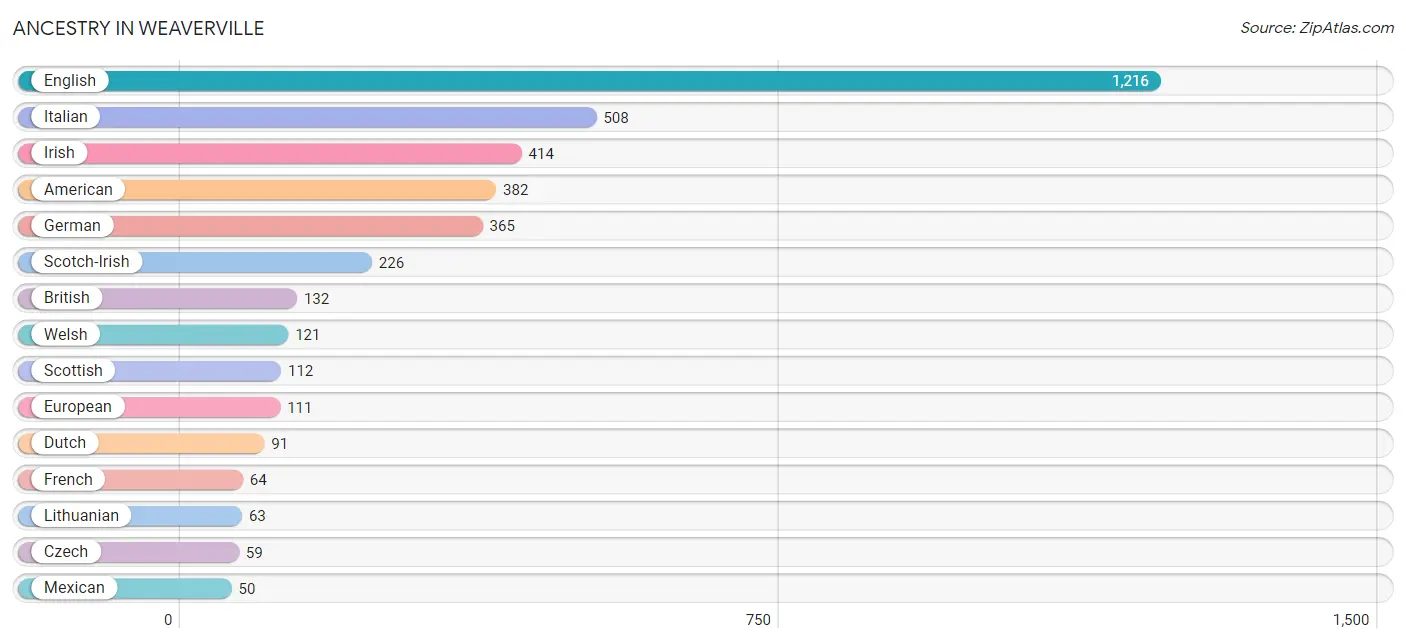
| Ancestry | # Population | % Population |
| American | 382 | 8.4% |
| Bhutanese | 20 | 0.4% |
| British | 132 | 2.9% |
| Burmese | 13 | 0.3% |
| Cajun | 17 | 0.4% |
| Cherokee | 43 | 0.9% |
| Croatian | 21 | 0.5% |
| Czech | 59 | 1.3% |
| Danish | 12 | 0.3% |
| Dutch | 91 | 2.0% |
| English | 1,216 | 26.7% |
| Ethiopian | 32 | 0.7% |
| European | 111 | 2.4% |
| French | 64 | 1.4% |
| French American Indian | 10 | 0.2% |
| French Canadian | 14 | 0.3% |
| German | 365 | 8.0% |
| Greek | 14 | 0.3% |
| Hungarian | 10 | 0.2% |
| Irish | 414 | 9.1% |
| Italian | 508 | 11.1% |
| Lithuanian | 63 | 1.4% |
| Mexican | 50 | 1.1% |
| New Zealander | 15 | 0.3% |
| Norwegian | 41 | 0.9% |
| Pennsylvania German | 9 | 0.2% |
| Polish | 13 | 0.3% |
| Puerto Rican | 18 | 0.4% |
| Russian | 21 | 0.5% |
| Scotch-Irish | 226 | 5.0% |
| Scottish | 112 | 2.5% |
| Spanish | 6 | 0.1% |
| Subsaharan African | 32 | 0.7% |
| Thai | 8 | 0.2% |
| Turkish | 46 | 1.0% |
| Ukrainian | 9 | 0.2% |
| Welsh | 121 | 2.6% | View All 37 Rows |
Immigrants in Weaverville
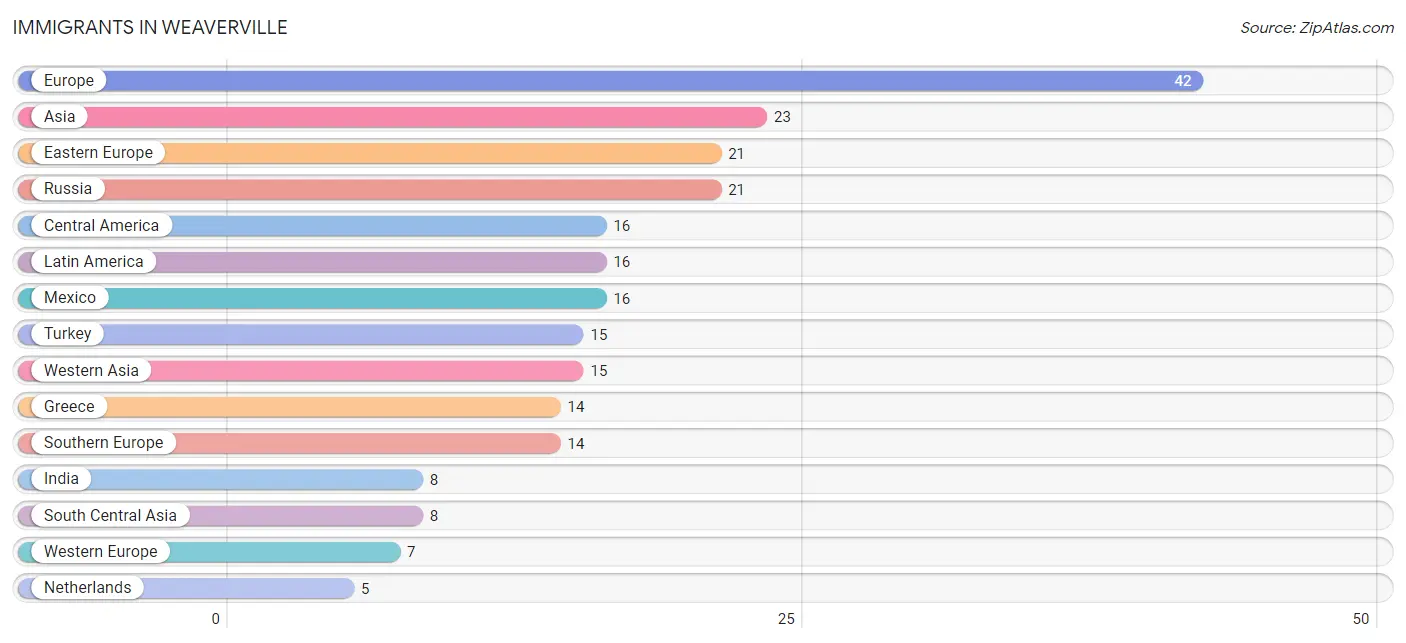
The most numerous immigrant groups reported in Weaverville came from Europe (42 | 0.9%), Asia (23 | 0.5%), Eastern Europe (21 | 0.5%), Russia (21 | 0.5%), and Central America (16 | 0.4%), together accounting for 2.7% of all Weaverville residents.
| Immigration Origin | # Population | % Population |
| Asia | 23 | 0.5% |
| Belgium | 2 | 0.0% |
| Central America | 16 | 0.4% |
| Eastern Europe | 21 | 0.5% |
| Europe | 42 | 0.9% |
| Greece | 14 | 0.3% |
| India | 8 | 0.2% |
| Latin America | 16 | 0.4% |
| Mexico | 16 | 0.4% |
| Netherlands | 5 | 0.1% |
| Russia | 21 | 0.5% |
| South Central Asia | 8 | 0.2% |
| Southern Europe | 14 | 0.3% |
| Turkey | 15 | 0.3% |
| Western Asia | 15 | 0.3% |
| Western Europe | 7 | 0.2% | View All 16 Rows |
Sex and Age in Weaverville
Sex and Age in Weaverville
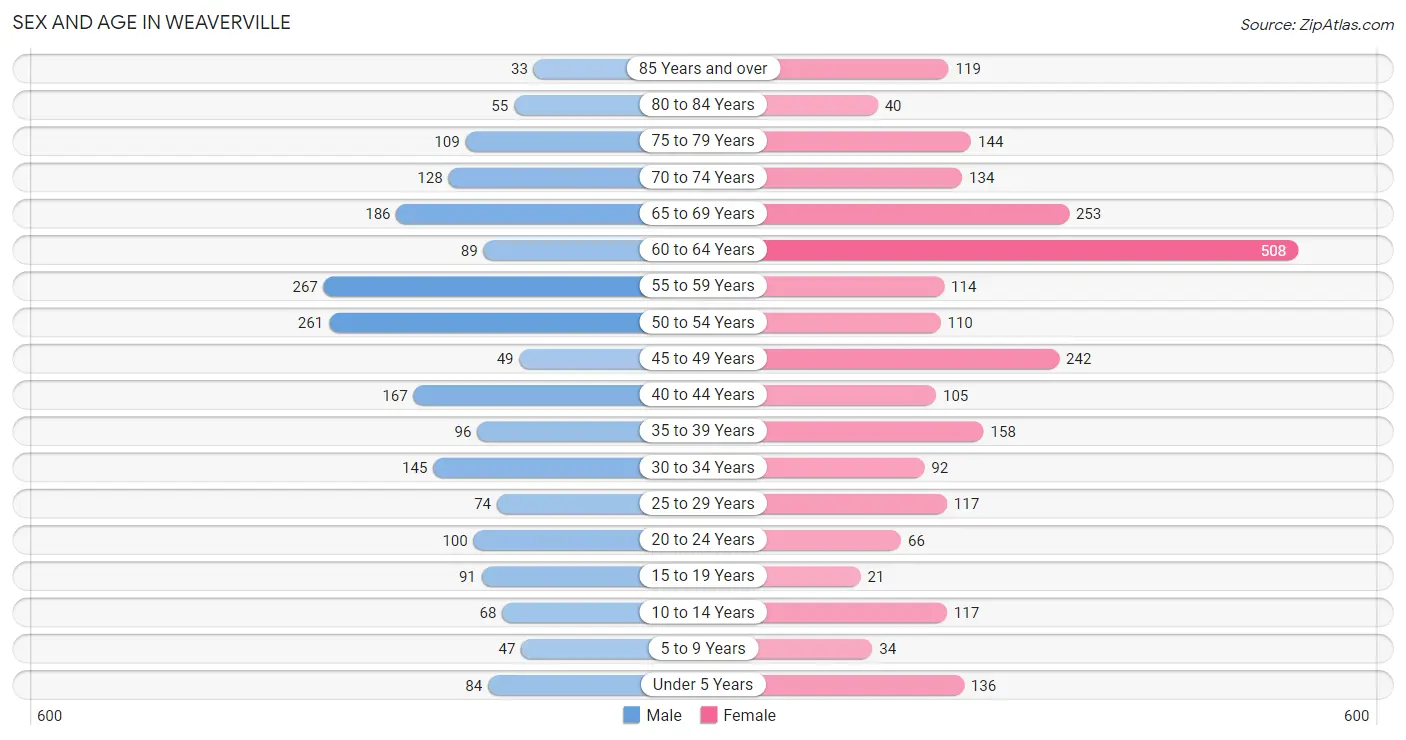
The most populous age groups in Weaverville are 55 to 59 Years (267 | 13.0%) for men and 60 to 64 Years (508 | 20.2%) for women.
| Age Bracket | Male | Female |
| Under 5 Years | 84 (4.1%) | 136 (5.4%) |
| 5 to 9 Years | 47 (2.3%) | 34 (1.3%) |
| 10 to 14 Years | 68 (3.3%) | 117 (4.7%) |
| 15 to 19 Years | 91 (4.4%) | 21 (0.8%) |
| 20 to 24 Years | 100 (4.9%) | 66 (2.6%) |
| 25 to 29 Years | 74 (3.6%) | 117 (4.7%) |
| 30 to 34 Years | 145 (7.1%) | 92 (3.7%) |
| 35 to 39 Years | 96 (4.7%) | 158 (6.3%) |
| 40 to 44 Years | 167 (8.2%) | 105 (4.2%) |
| 45 to 49 Years | 49 (2.4%) | 242 (9.6%) |
| 50 to 54 Years | 261 (12.7%) | 110 (4.4%) |
| 55 to 59 Years | 267 (13.0%) | 114 (4.5%) |
| 60 to 64 Years | 89 (4.3%) | 508 (20.2%) |
| 65 to 69 Years | 186 (9.1%) | 253 (10.1%) |
| 70 to 74 Years | 128 (6.2%) | 134 (5.3%) |
| 75 to 79 Years | 109 (5.3%) | 144 (5.7%) |
| 80 to 84 Years | 55 (2.7%) | 40 (1.6%) |
| 85 Years and over | 33 (1.6%) | 119 (4.7%) |
| Total | 2,049 (100.0%) | 2,510 (100.0%) |
Families and Households in Weaverville
Median Family Size in Weaverville
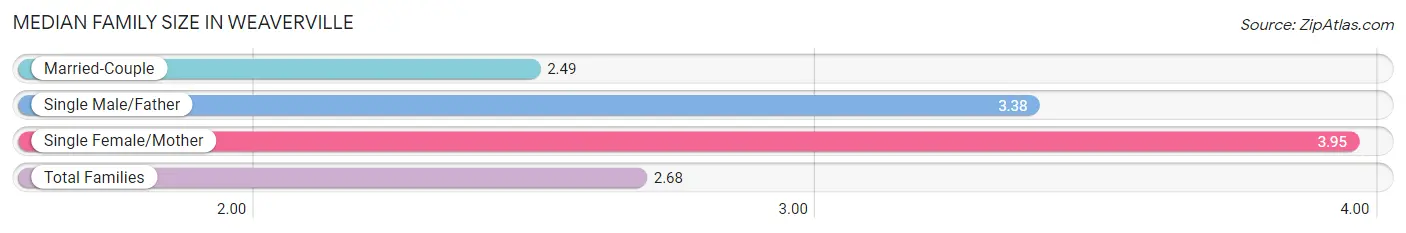
The median family size in Weaverville is 2.68 persons per family, with single female/mother families (151 | 11.6%) accounting for the largest median family size of 3.95 persons per family. On the other hand, married-couple families (1,130 | 86.8%) represent the smallest median family size with 2.49 persons per family.
| Family Type | # Families | Family Size |
| Married-Couple | 1,130 (86.8%) | 2.49 |
| Single Male/Father | 21 (1.6%) | 3.38 |
| Single Female/Mother | 151 (11.6%) | 3.95 |
| Total Families | 1,302 (100.0%) | 2.68 |
Median Household Size in Weaverville
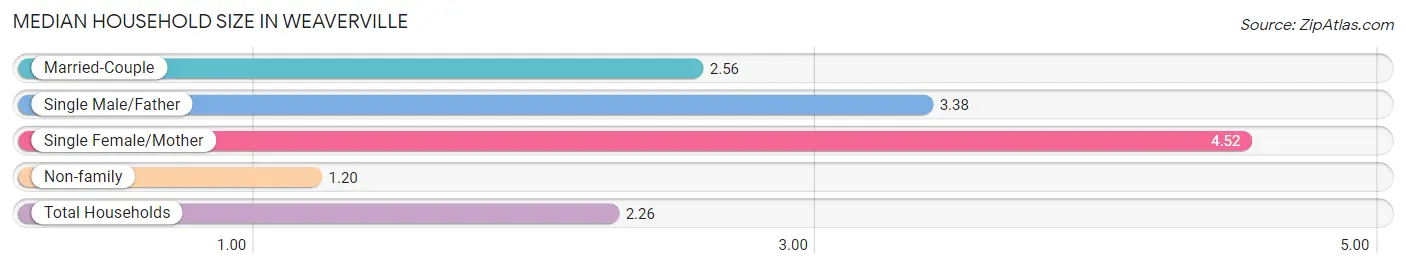
The median household size in Weaverville is 2.26 persons per household, with single female/mother households (151 | 7.7%) accounting for the largest median household size of 4.52 persons per household. non-family households (660 | 33.6%) represent the smallest median household size with 1.20 persons per household.
| Household Type | # Households | Household Size |
| Married-Couple | 1,130 (57.6%) | 2.56 |
| Single Male/Father | 21 (1.1%) | 3.38 |
| Single Female/Mother | 151 (7.7%) | 4.52 |
| Non-family | 660 (33.6%) | 1.20 |
| Total Households | 1,962 (100.0%) | 2.26 |
Household Size by Marriage Status in Weaverville
Out of a total of 1,962 households in Weaverville, 1,302 (66.4%) are family households, while 660 (33.6%) are nonfamily households. The most numerous type of family households are 2-person households, comprising 897, and the most common type of nonfamily households are 1-person households, comprising 550.
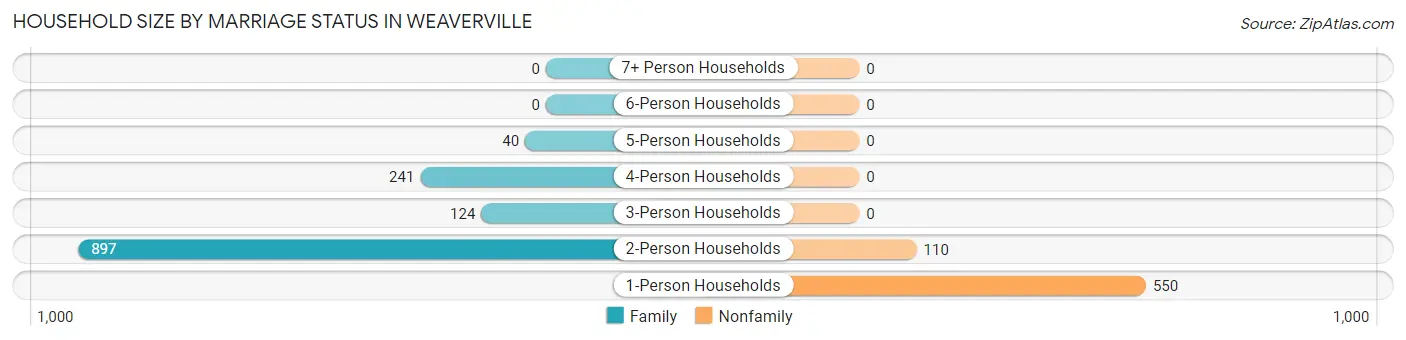
| Household Size | Family Households | Nonfamily Households |
| 1-Person Households | - | 550 (28.0%) |
| 2-Person Households | 897 (45.7%) | 110 (5.6%) |
| 3-Person Households | 124 (6.3%) | 0 (0.0%) |
| 4-Person Households | 241 (12.3%) | 0 (0.0%) |
| 5-Person Households | 40 (2.0%) | 0 (0.0%) |
| 6-Person Households | 0 (0.0%) | 0 (0.0%) |
| 7+ Person Households | 0 (0.0%) | 0 (0.0%) |
| Total | 1,302 (66.4%) | 660 (33.6%) |
Female Fertility in Weaverville
Fertility by Age in Weaverville
Average fertility rate in Weaverville is 17.0 births per 1,000 women. Women in the age bracket of 35 to 50 years have the highest fertility rate with 26.0 births per 1,000 women. Women in the age bracket of 35 to 50 years acount for 100.0% of all women with births.
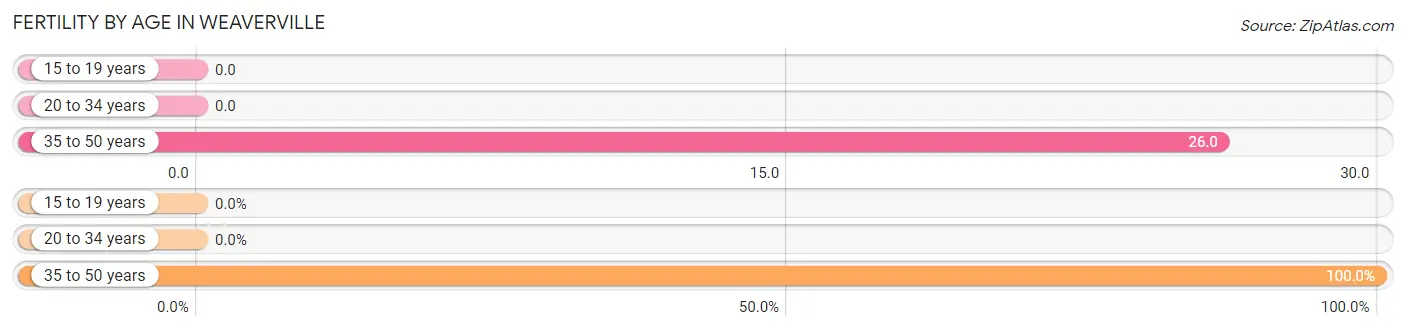
| Age Bracket | Women with Births | Births / 1,000 Women |
| 15 to 19 years | 0 (0.0%) | 0.0 |
| 20 to 34 years | 0 (0.0%) | 0.0 |
| 35 to 50 years | 14 (100.0%) | 26.0 |
| Total | 14 (100.0%) | 17.0 |
Fertility by Age by Marriage Status in Weaverville
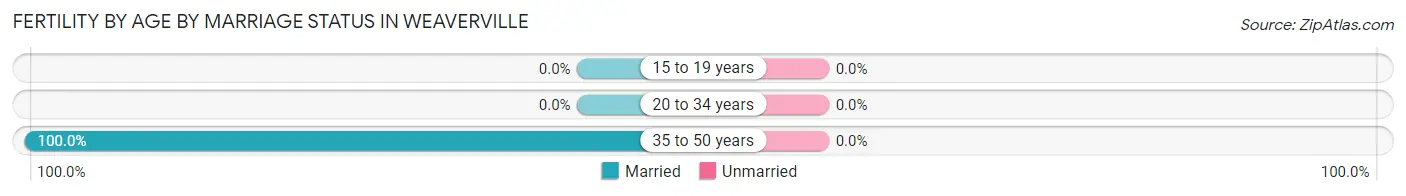
| Age Bracket | Married | Unmarried |
| 15 to 19 years | 0 (0.0%) | 0 (0.0%) |
| 20 to 34 years | 0 (0.0%) | 0 (0.0%) |
| 35 to 50 years | 14 (100.0%) | 0 (0.0%) |
| Total | 14 (100.0%) | 0 (0.0%) |
Fertility by Education in Weaverville
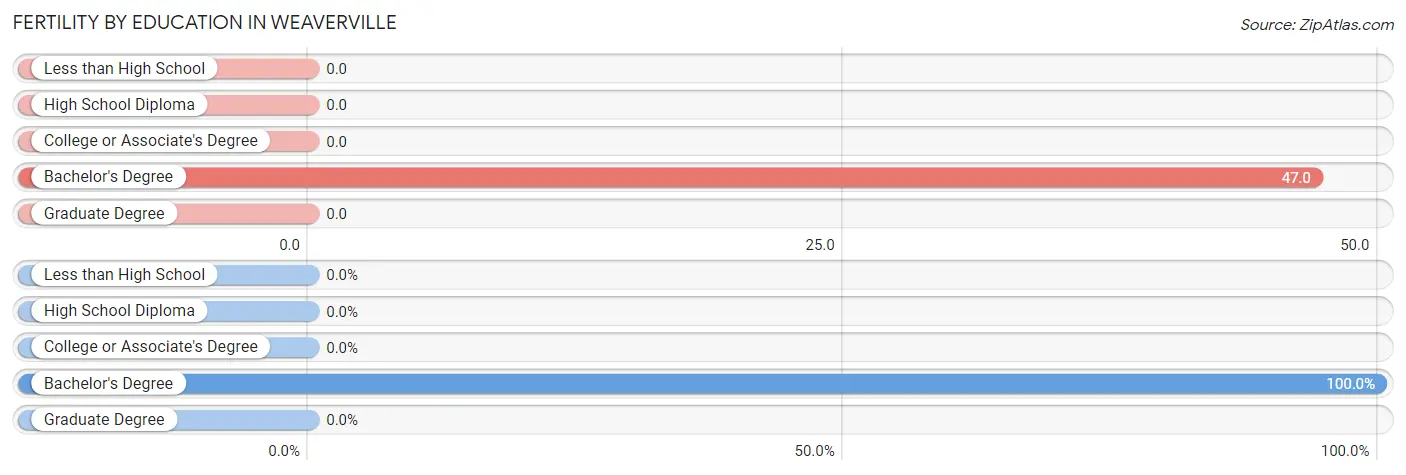
| Educational Attainment | Women with Births | Births / 1,000 Women |
| Less than High School | 0 (0.0%) | 0.0 |
| High School Diploma | 0 (0.0%) | 0.0 |
| College or Associate's Degree | 0 (0.0%) | 0.0 |
| Bachelor's Degree | 14 (100.0%) | 47.0 |
| Graduate Degree | 0 (0.0%) | 0.0 |
| Total | 14 (100.0%) | 17.0 |
Fertility by Education by Marriage Status in Weaverville
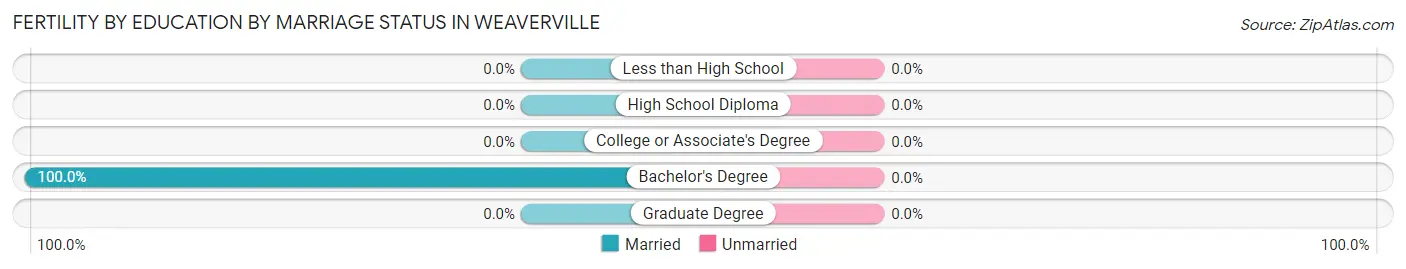
| Educational Attainment | Married | Unmarried |
| Less than High School | 0 (0.0%) | 0 (0.0%) |
| High School Diploma | 0 (0.0%) | 0 (0.0%) |
| College or Associate's Degree | 0 (0.0%) | 0 (0.0%) |
| Bachelor's Degree | 14 (100.0%) | 0 (0.0%) |
| Graduate Degree | 0 (0.0%) | 0 (0.0%) |
| Total | 14 (100.0%) | 0 (0.0%) |
Employment Characteristics in Weaverville
Employment by Class of Employer in Weaverville
Among the 2,389 employed individuals in Weaverville, private company employees (1,215 | 50.9%), self-employed (not incorporated) (536 | 22.4%), and not-for-profit organizations (298 | 12.5%) make up the most common classes of employment.
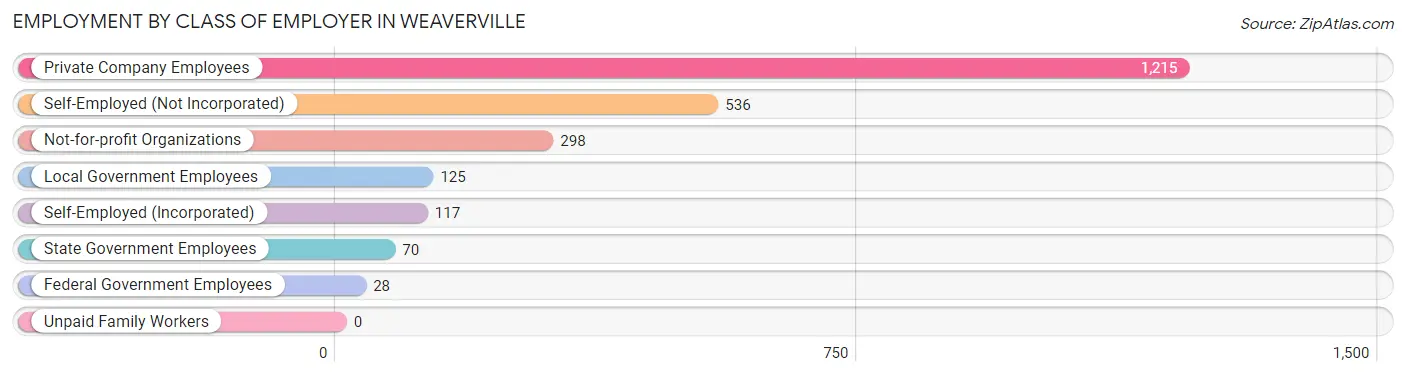
| Employer Class | # Employees | % Employees |
| Private Company Employees | 1,215 | 50.9% |
| Self-Employed (Incorporated) | 117 | 4.9% |
| Self-Employed (Not Incorporated) | 536 | 22.4% |
| Not-for-profit Organizations | 298 | 12.5% |
| Local Government Employees | 125 | 5.2% |
| State Government Employees | 70 | 2.9% |
| Federal Government Employees | 28 | 1.2% |
| Unpaid Family Workers | 0 | 0.0% |
| Total | 2,389 | 100.0% |
Employment Status by Age in Weaverville
According to the labor force statistics for Weaverville, out of the total population over 16 years of age (3,996), 61.1% or 2,442 individuals are in the labor force, with 1.3% or 32 of them unemployed. The age group with the highest labor force participation rate is 20 to 24 years, with 100.0% or 166 individuals in the labor force. Within the labor force, the 60 to 64 years age range has the highest percentage of unemployed individuals, with 13.1% or 16 of them being unemployed.
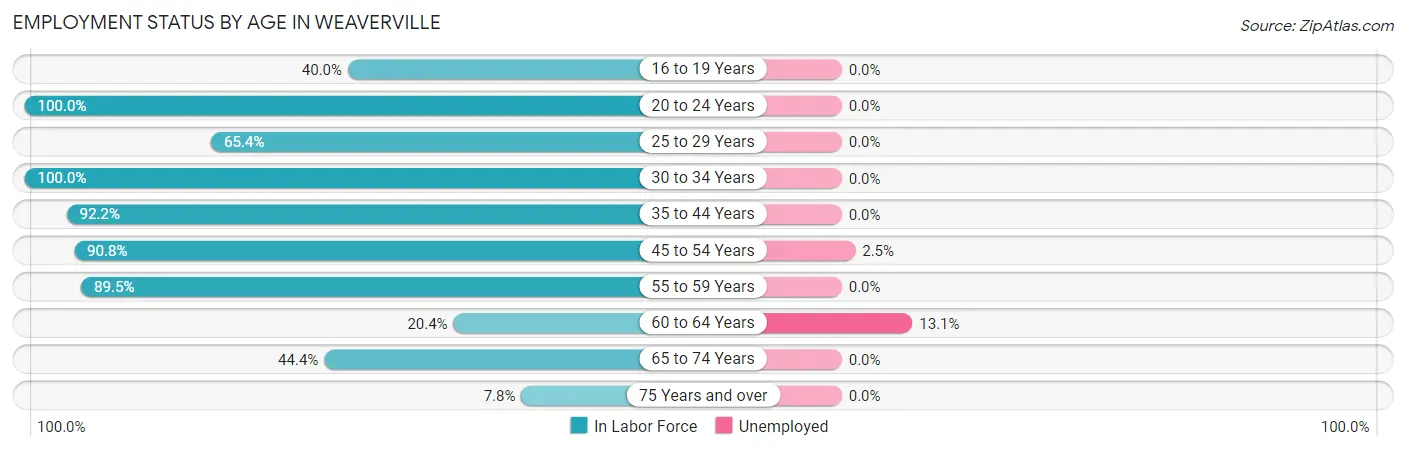
| Age Bracket | In Labor Force | Unemployed |
| 16 to 19 Years | 14 (40.0%) | 0 (0.0%) |
| 20 to 24 Years | 166 (100.0%) | 0 (0.0%) |
| 25 to 29 Years | 125 (65.4%) | 0 (0.0%) |
| 30 to 34 Years | 237 (100.0%) | 0 (0.0%) |
| 35 to 44 Years | 485 (92.2%) | 0 (0.0%) |
| 45 to 54 Years | 601 (90.8%) | 15 (2.5%) |
| 55 to 59 Years | 341 (89.5%) | 0 (0.0%) |
| 60 to 64 Years | 122 (20.4%) | 16 (13.1%) |
| 65 to 74 Years | 311 (44.4%) | 0 (0.0%) |
| 75 Years and over | 39 (7.8%) | 0 (0.0%) |
| Total | 2,442 (61.1%) | 32 (1.3%) |
Employment Status by Educational Attainment in Weaverville
According to labor force statistics for Weaverville, 73.7% of individuals (1,912) out of the total population between 25 and 64 years of age (2,594) are in the labor force, with 1.6% or 31 of them being unemployed. The group with the highest labor force participation rate are those with the educational attainment of college / associate degree, with 80.3% or 598 individuals in the labor force. Within the labor force, individuals with college / associate degree education have the highest percentage of unemployment, with 2.8% or 17 of them being unemployed.
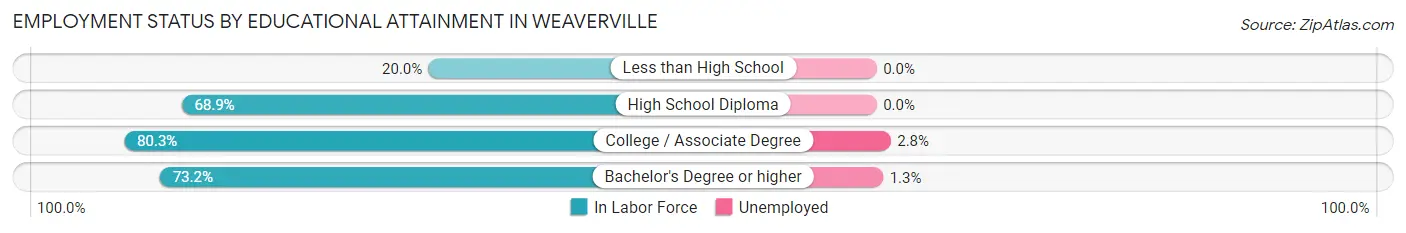
| Educational Attainment | In Labor Force | Unemployed |
| Less than High School | 12 (20.0%) | 0 (0.0%) |
| High School Diploma | 144 (68.9%) | 0 (0.0%) |
| College / Associate Degree | 598 (80.3%) | 21 (2.8%) |
| Bachelor's Degree or higher | 1,157 (73.2%) | 21 (1.3%) |
| Total | 1,912 (73.7%) | 42 (1.6%) |
Employment Occupations by Sex in Weaverville
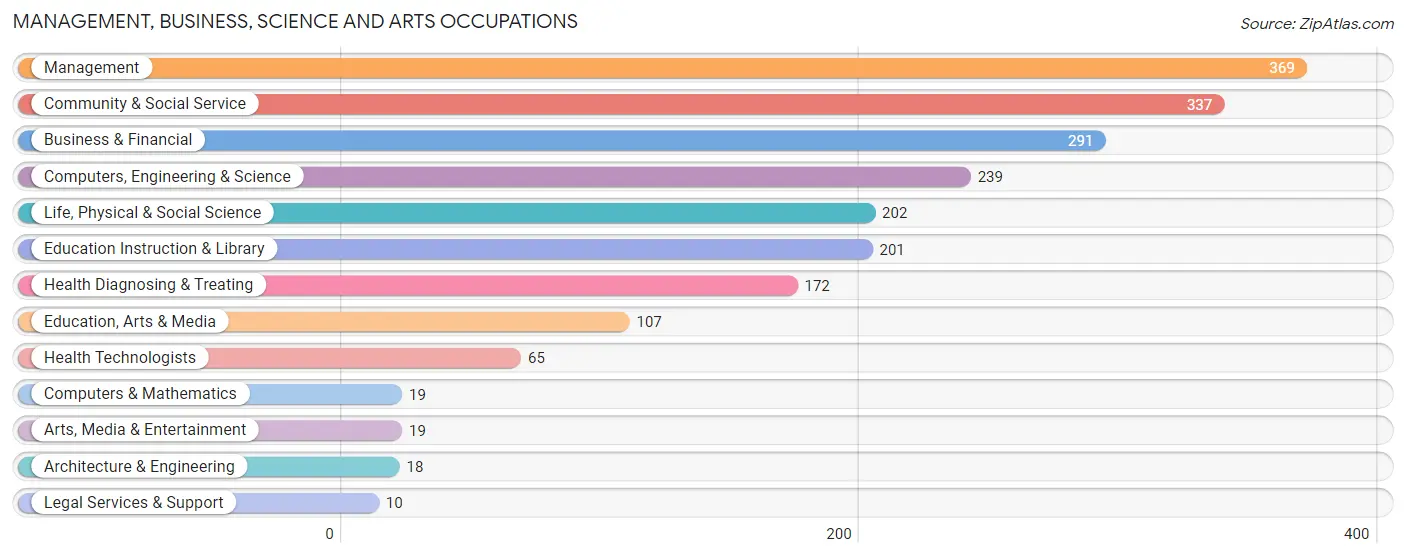
Management, Business, Science and Arts Occupations
The most common Management, Business, Science and Arts occupations in Weaverville are Management (369 | 15.4%), Community & Social Service (337 | 14.1%), Business & Financial (291 | 12.2%), Computers, Engineering & Science (239 | 10.0%), and Life, Physical & Social Science (202 | 8.5%).
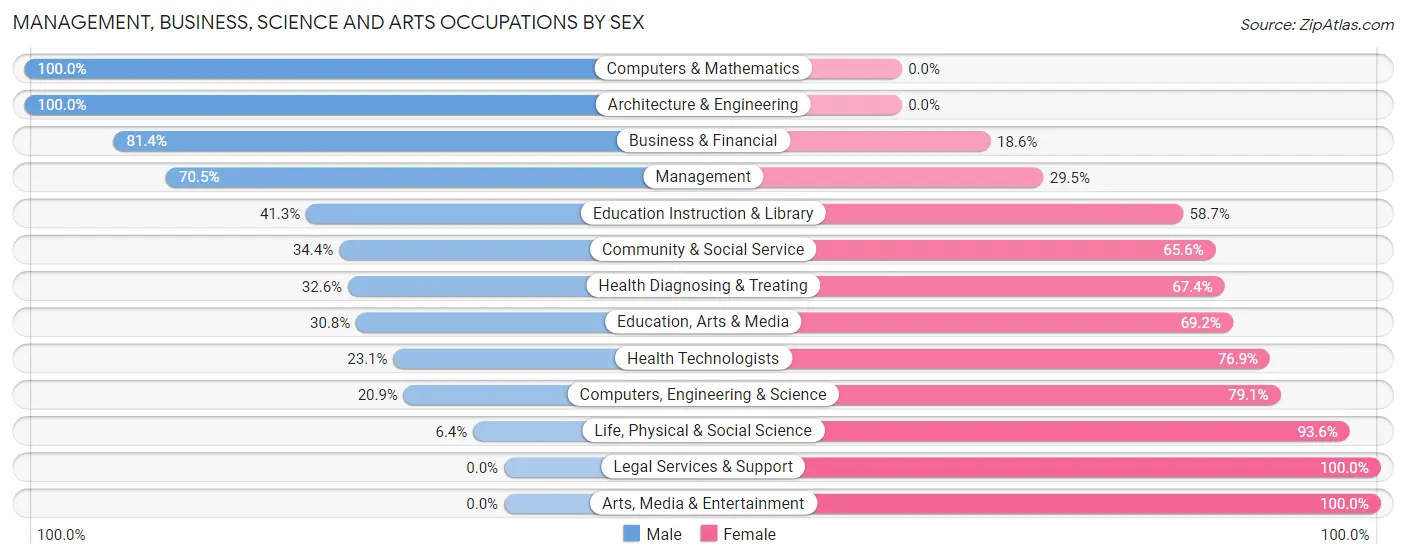
Management, Business, Science and Arts Occupations by Sex
Within the Management, Business, Science and Arts occupations in Weaverville, the most male-oriented occupations are Computers & Mathematics (100.0%), Architecture & Engineering (100.0%), and Business & Financial (81.4%), while the most female-oriented occupations are Legal Services & Support (100.0%), Arts, Media & Entertainment (100.0%), and Life, Physical & Social Science (93.6%).
| Occupation | Male | Female |
| Management | 260 (70.5%) | 109 (29.5%) |
| Business & Financial | 237 (81.4%) | 54 (18.6%) |
| Computers, Engineering & Science | 50 (20.9%) | 189 (79.1%) |
| Computers & Mathematics | 19 (100.0%) | 0 (0.0%) |
| Architecture & Engineering | 18 (100.0%) | 0 (0.0%) |
| Life, Physical & Social Science | 13 (6.4%) | 189 (93.6%) |
| Community & Social Service | 116 (34.4%) | 221 (65.6%) |
| Education, Arts & Media | 33 (30.8%) | 74 (69.2%) |
| Legal Services & Support | 0 (0.0%) | 10 (100.0%) |
| Education Instruction & Library | 83 (41.3%) | 118 (58.7%) |
| Arts, Media & Entertainment | 0 (0.0%) | 19 (100.0%) |
| Health Diagnosing & Treating | 56 (32.6%) | 116 (67.4%) |
| Health Technologists | 15 (23.1%) | 50 (76.9%) |
| Total (Category) | 719 (51.1%) | 689 (48.9%) |
| Total (Overall) | 1,263 (52.8%) | 1,127 (47.1%) |
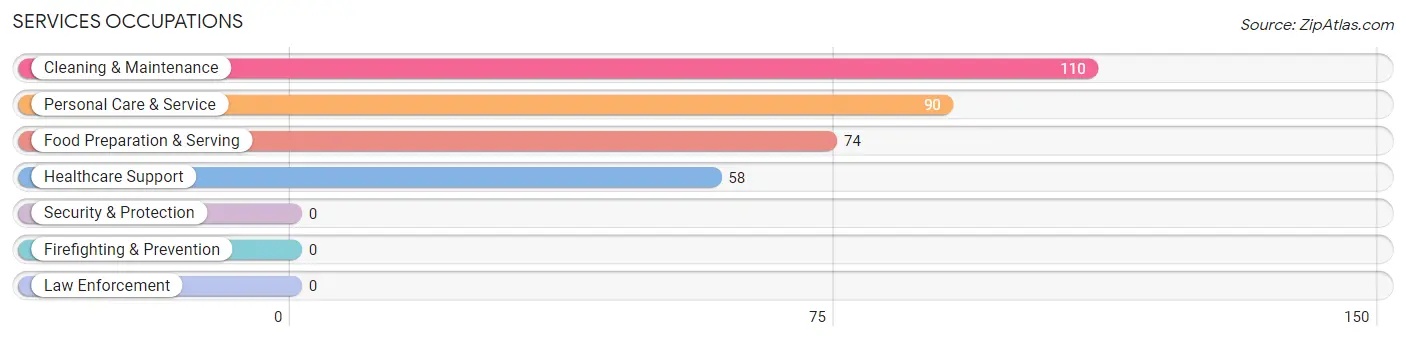
Services Occupations
The most common Services occupations in Weaverville are Cleaning & Maintenance (110 | 4.6%), Personal Care & Service (90 | 3.8%), Food Preparation & Serving (74 | 3.1%), and Healthcare Support (58 | 2.4%).
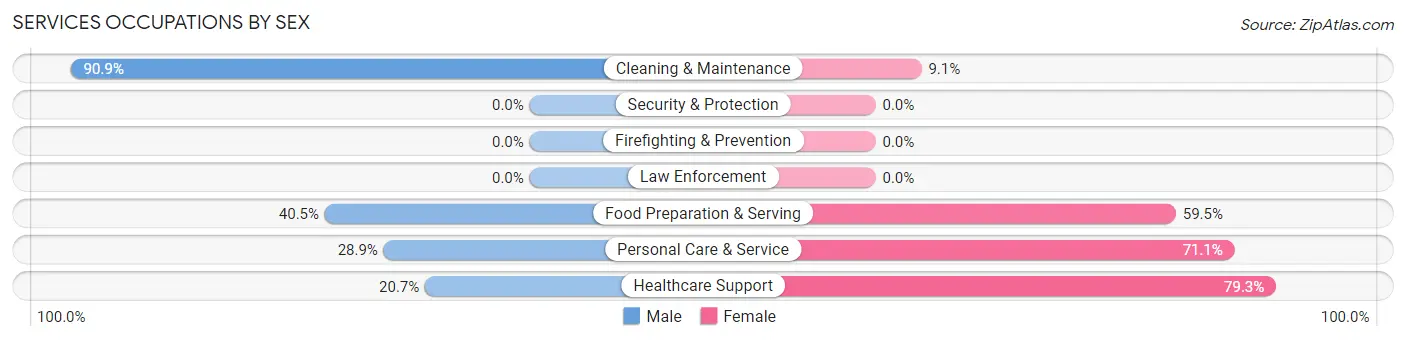
Services Occupations by Sex
Within the Services occupations in Weaverville, the most male-oriented occupations are Cleaning & Maintenance (90.9%), Food Preparation & Serving (40.5%), and Personal Care & Service (28.9%), while the most female-oriented occupations are Healthcare Support (79.3%), Personal Care & Service (71.1%), and Food Preparation & Serving (59.5%).
| Occupation | Male | Female |
| Healthcare Support | 12 (20.7%) | 46 (79.3%) |
| Security & Protection | 0 (0.0%) | 0 (0.0%) |
| Firefighting & Prevention | 0 (0.0%) | 0 (0.0%) |
| Law Enforcement | 0 (0.0%) | 0 (0.0%) |
| Food Preparation & Serving | 30 (40.5%) | 44 (59.5%) |
| Cleaning & Maintenance | 100 (90.9%) | 10 (9.1%) |
| Personal Care & Service | 26 (28.9%) | 64 (71.1%) |
| Total (Category) | 168 (50.6%) | 164 (49.4%) |
| Total (Overall) | 1,263 (52.8%) | 1,127 (47.1%) |
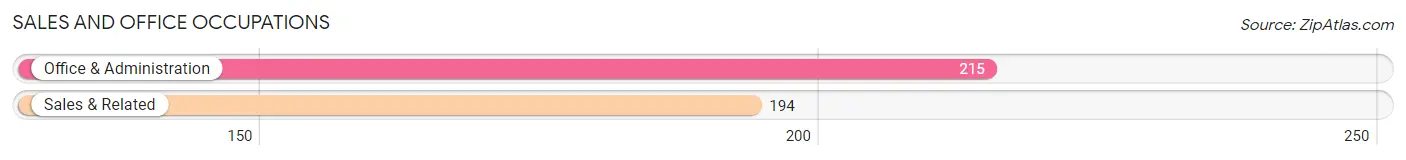
Sales and Office Occupations
The most common Sales and Office occupations in Weaverville are Office & Administration (215 | 9.0%), and Sales & Related (194 | 8.1%).
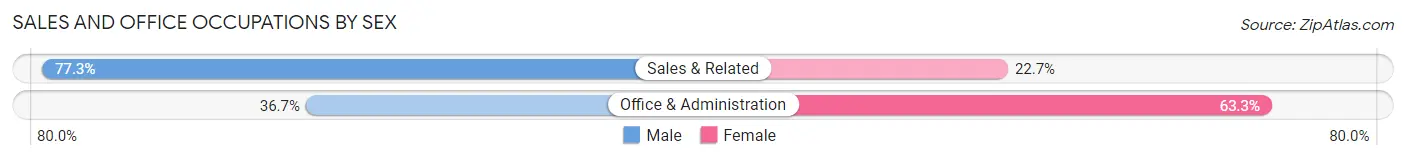
Sales and Office Occupations by Sex
| Occupation | Male | Female |
| Sales & Related | 150 (77.3%) | 44 (22.7%) |
| Office & Administration | 79 (36.7%) | 136 (63.3%) |
| Total (Category) | 229 (56.0%) | 180 (44.0%) |
| Total (Overall) | 1,263 (52.8%) | 1,127 (47.1%) |
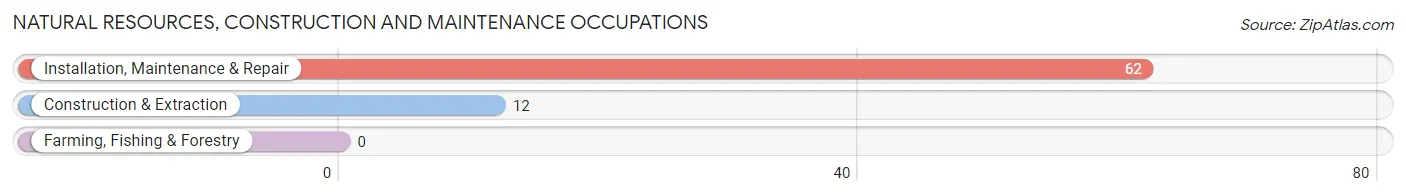
Natural Resources, Construction and Maintenance Occupations
The most common Natural Resources, Construction and Maintenance occupations in Weaverville are Installation, Maintenance & Repair (62 | 2.6%), and Construction & Extraction (12 | 0.5%).
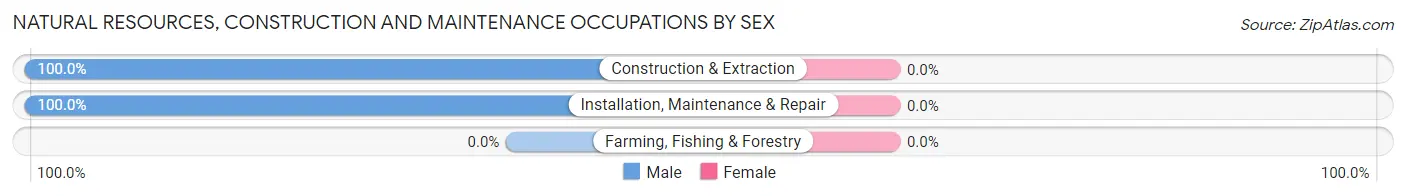
Natural Resources, Construction and Maintenance Occupations by Sex
| Occupation | Male | Female |
| Farming, Fishing & Forestry | 0 (0.0%) | 0 (0.0%) |
| Construction & Extraction | 12 (100.0%) | 0 (0.0%) |
| Installation, Maintenance & Repair | 62 (100.0%) | 0 (0.0%) |
| Total (Category) | 74 (100.0%) | 0 (0.0%) |
| Total (Overall) | 1,263 (52.8%) | 1,127 (47.1%) |
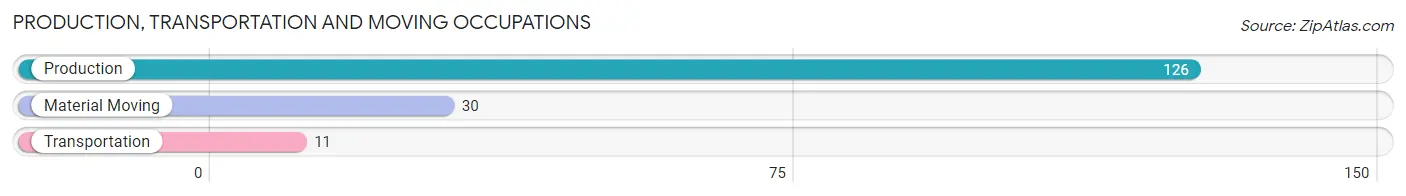
Production, Transportation and Moving Occupations
The most common Production, Transportation and Moving occupations in Weaverville are Production (126 | 5.3%), Material Moving (30 | 1.3%), and Transportation (11 | 0.5%).
Production, Transportation and Moving Occupations by Sex
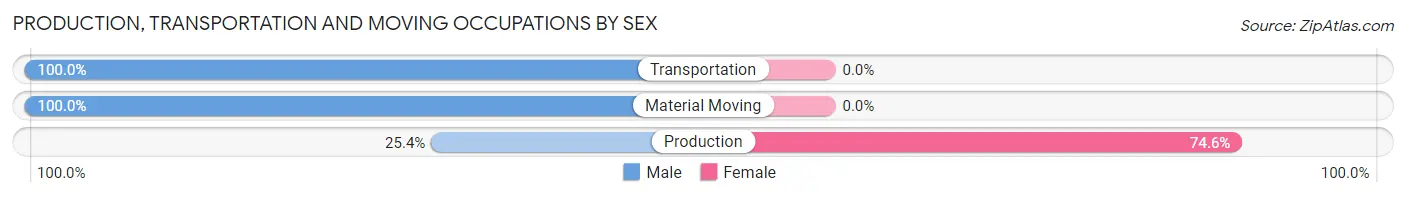
| Occupation | Male | Female |
| Production | 32 (25.4%) | 94 (74.6%) |
| Transportation | 11 (100.0%) | 0 (0.0%) |
| Material Moving | 30 (100.0%) | 0 (0.0%) |
| Total (Category) | 73 (43.7%) | 94 (56.3%) |
| Total (Overall) | 1,263 (52.8%) | 1,127 (47.1%) |
Employment Industries by Sex in Weaverville
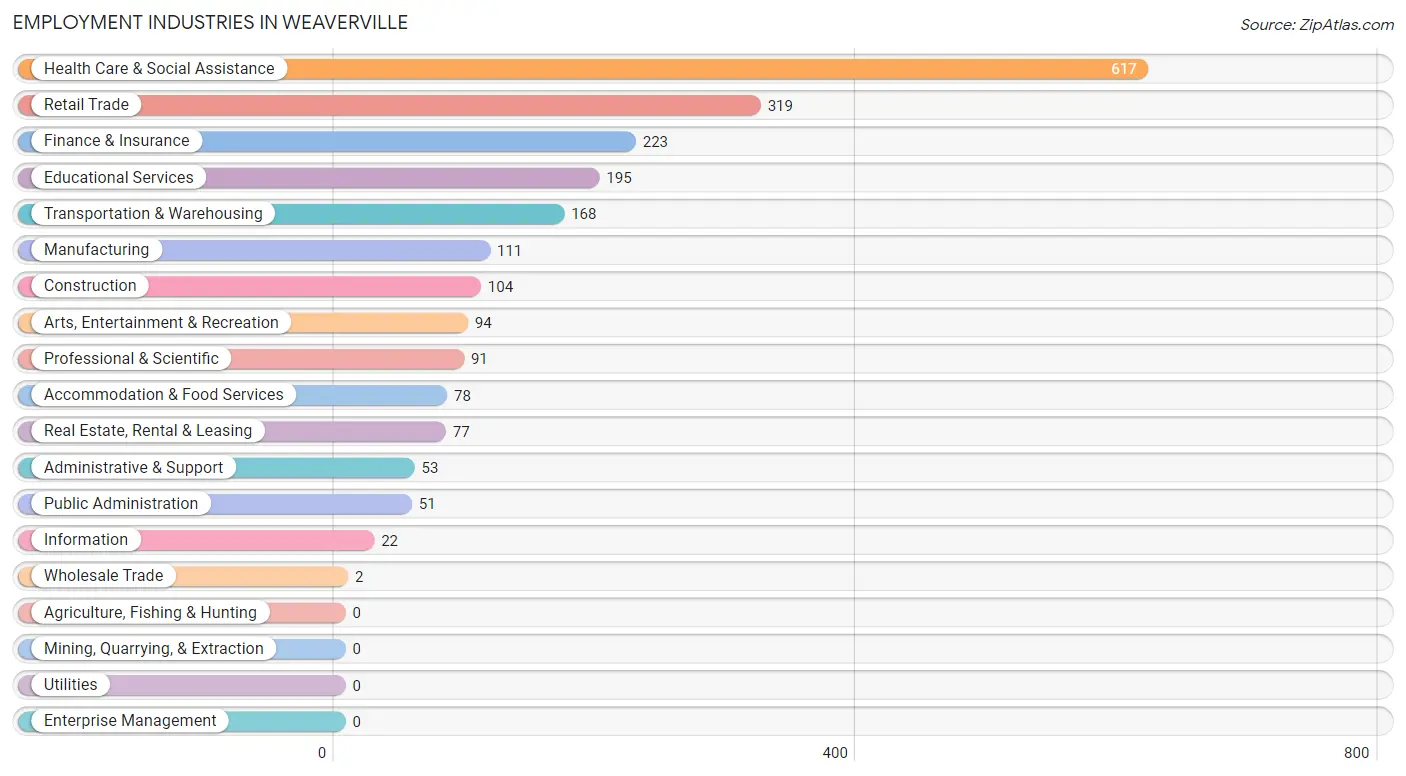
Employment Industries in Weaverville
The major employment industries in Weaverville include Health Care & Social Assistance (617 | 25.8%), Retail Trade (319 | 13.4%), Finance & Insurance (223 | 9.3%), Educational Services (195 | 8.2%), and Transportation & Warehousing (168 | 7.0%).
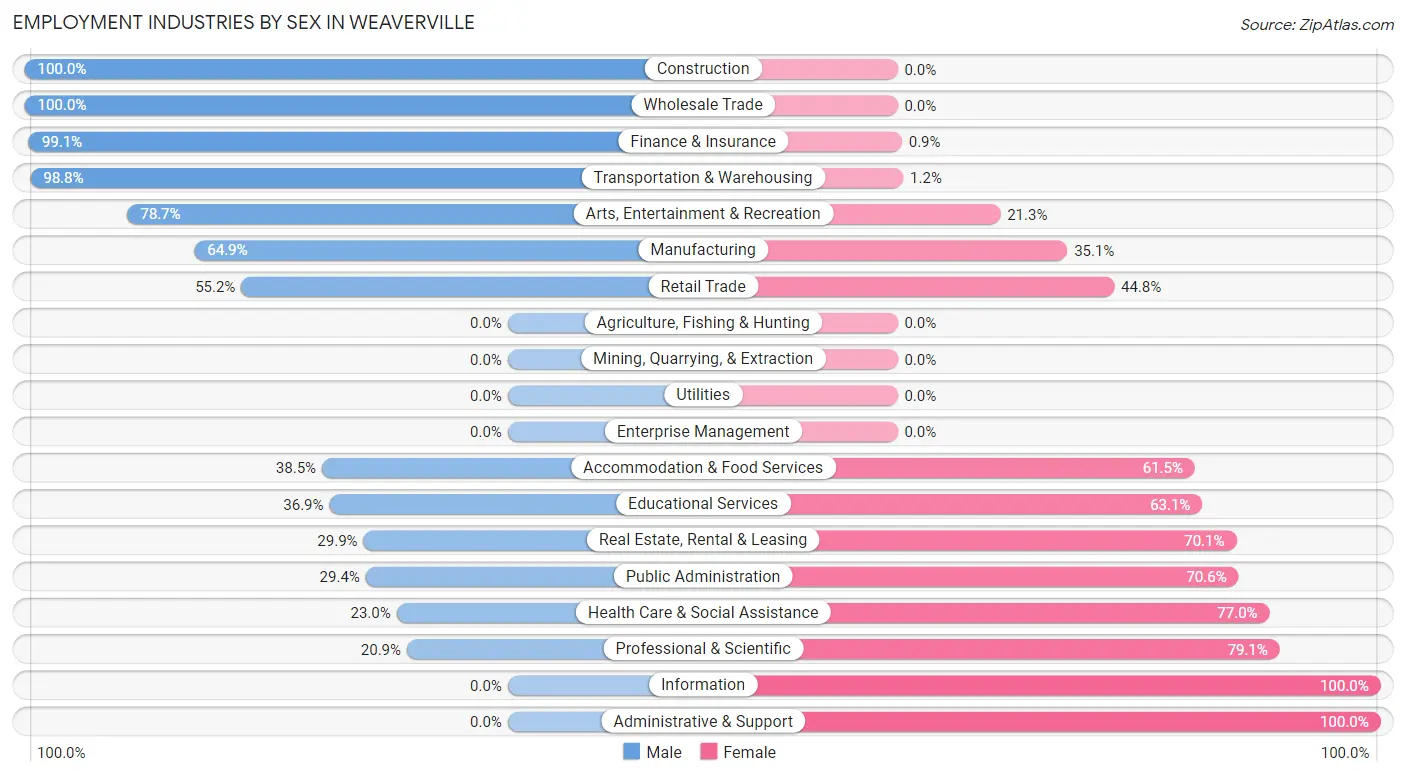
Employment Industries by Sex in Weaverville
The Weaverville industries that see more men than women are Construction (100.0%), Wholesale Trade (100.0%), and Finance & Insurance (99.1%), whereas the industries that tend to have a higher number of women are Information (100.0%), Administrative & Support (100.0%), and Professional & Scientific (79.1%).
| Industry | Male | Female |
| Agriculture, Fishing & Hunting | 0 (0.0%) | 0 (0.0%) |
| Mining, Quarrying, & Extraction | 0 (0.0%) | 0 (0.0%) |
| Construction | 104 (100.0%) | 0 (0.0%) |
| Manufacturing | 72 (64.9%) | 39 (35.1%) |
| Wholesale Trade | 2 (100.0%) | 0 (0.0%) |
| Retail Trade | 176 (55.2%) | 143 (44.8%) |
| Transportation & Warehousing | 166 (98.8%) | 2 (1.2%) |
| Utilities | 0 (0.0%) | 0 (0.0%) |
| Information | 0 (0.0%) | 22 (100.0%) |
| Finance & Insurance | 221 (99.1%) | 2 (0.9%) |
| Real Estate, Rental & Leasing | 23 (29.9%) | 54 (70.1%) |
| Professional & Scientific | 19 (20.9%) | 72 (79.1%) |
| Enterprise Management | 0 (0.0%) | 0 (0.0%) |
| Administrative & Support | 0 (0.0%) | 53 (100.0%) |
| Educational Services | 72 (36.9%) | 123 (63.1%) |
| Health Care & Social Assistance | 142 (23.0%) | 475 (77.0%) |
| Arts, Entertainment & Recreation | 74 (78.7%) | 20 (21.3%) |
| Accommodation & Food Services | 30 (38.5%) | 48 (61.5%) |
| Public Administration | 15 (29.4%) | 36 (70.6%) |
| Total | 1,263 (52.8%) | 1,127 (47.1%) |
Education in Weaverville
School Enrollment in Weaverville
The most common levels of schooling among the 477 students in Weaverville are middle school (145 | 30.4%), high school (112 | 23.5%), and elementary school (93 | 19.5%).
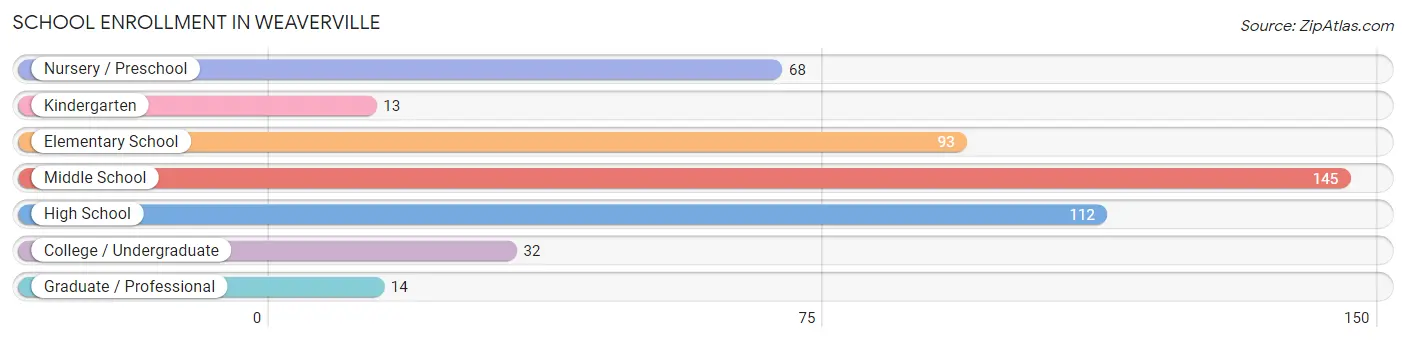
| School Level | # Students | % Students |
| Nursery / Preschool | 68 | 14.3% |
| Kindergarten | 13 | 2.7% |
| Elementary School | 93 | 19.5% |
| Middle School | 145 | 30.4% |
| High School | 112 | 23.5% |
| College / Undergraduate | 32 | 6.7% |
| Graduate / Professional | 14 | 2.9% |
| Total | 477 | 100.0% |
School Enrollment by Age by Funding Source in Weaverville
Out of a total of 477 students who are enrolled in schools in Weaverville, 50 (10.5%) attend a private institution, while the remaining 427 (89.5%) are enrolled in public schools. The age group of 5 to 9 year old has the highest likelihood of being enrolled in private schools, with 34 (42.0% in the age bracket) enrolled. Conversely, the age group of 10 to 14 year olds has the lowest likelihood of being enrolled in a private school, with 185 (100.0% in the age bracket) attending a public institution.
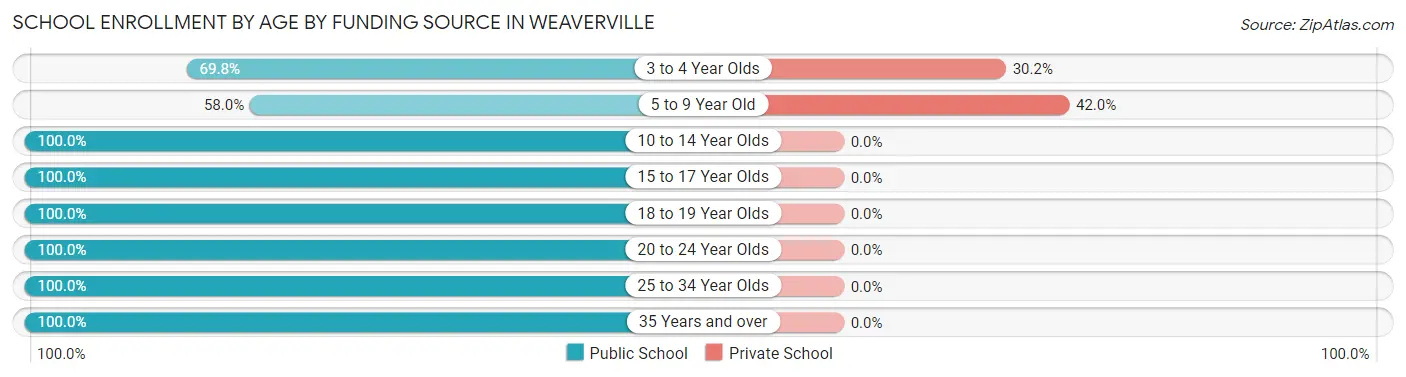
| Age Bracket | Public School | Private School |
| 3 to 4 Year Olds | 37 (69.8%) | 16 (30.2%) |
| 5 to 9 Year Old | 47 (58.0%) | 34 (42.0%) |
| 10 to 14 Year Olds | 185 (100.0%) | 0 (0.0%) |
| 15 to 17 Year Olds | 91 (100.0%) | 0 (0.0%) |
| 18 to 19 Year Olds | 21 (100.0%) | 0 (0.0%) |
| 20 to 24 Year Olds | 15 (100.0%) | 0 (0.0%) |
| 25 to 34 Year Olds | 16 (100.0%) | 0 (0.0%) |
| 35 Years and over | 15 (100.0%) | 0 (0.0%) |
| Total | 427 (89.5%) | 50 (10.5%) |
Educational Attainment by Field of Study in Weaverville
Psychology (365 | 14.1%), bio, nature & agricultural (347 | 13.4%), education (328 | 12.7%), business (321 | 12.4%), and social sciences (215 | 8.3%) are the most common fields of study among 2,590 individuals in Weaverville who have obtained a bachelor's degree or higher.
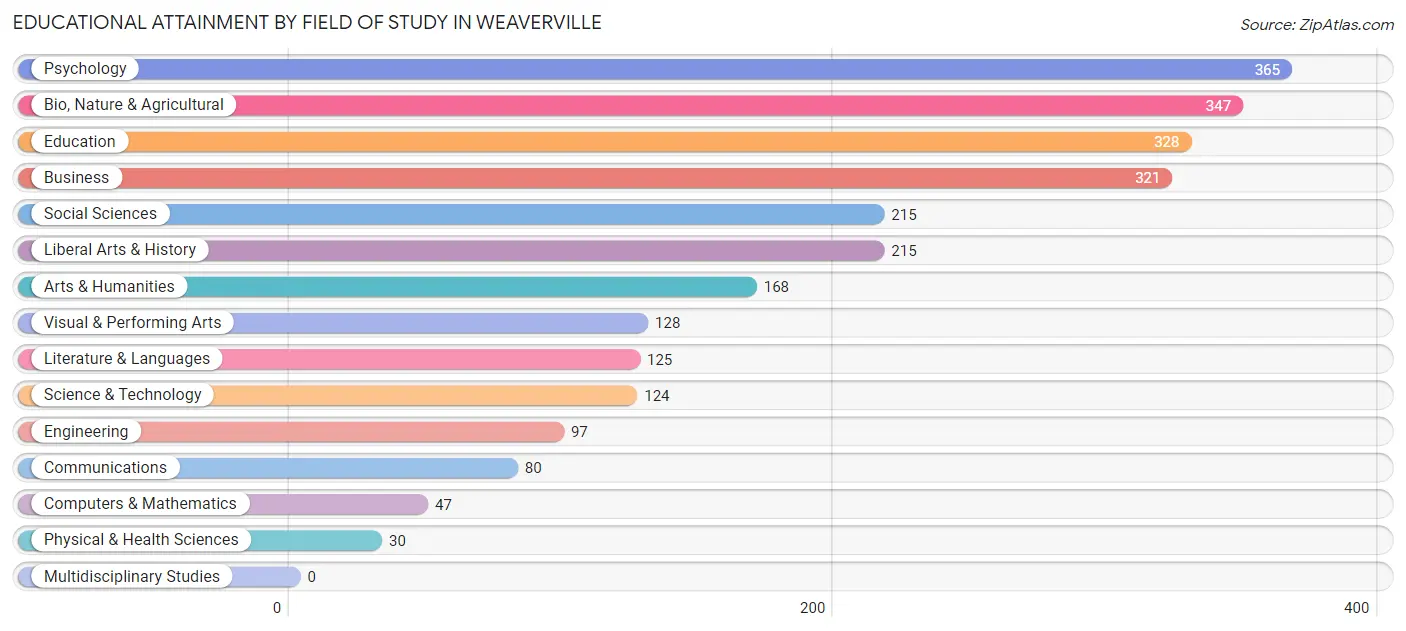
| Field of Study | # Graduates | % Graduates |
| Computers & Mathematics | 47 | 1.8% |
| Bio, Nature & Agricultural | 347 | 13.4% |
| Physical & Health Sciences | 30 | 1.2% |
| Psychology | 365 | 14.1% |
| Social Sciences | 215 | 8.3% |
| Engineering | 97 | 3.7% |
| Multidisciplinary Studies | 0 | 0.0% |
| Science & Technology | 124 | 4.8% |
| Business | 321 | 12.4% |
| Education | 328 | 12.7% |
| Literature & Languages | 125 | 4.8% |
| Liberal Arts & History | 215 | 8.3% |
| Visual & Performing Arts | 128 | 4.9% |
| Communications | 80 | 3.1% |
| Arts & Humanities | 168 | 6.5% |
| Total | 2,590 | 100.0% |
Transportation & Commute in Weaverville
Vehicle Availability by Sex in Weaverville
The most prevalent vehicle ownership categories in Weaverville are males with 2 vehicles (626, accounting for 48.8%) and females with 2 vehicles (615, making up 56.6%).
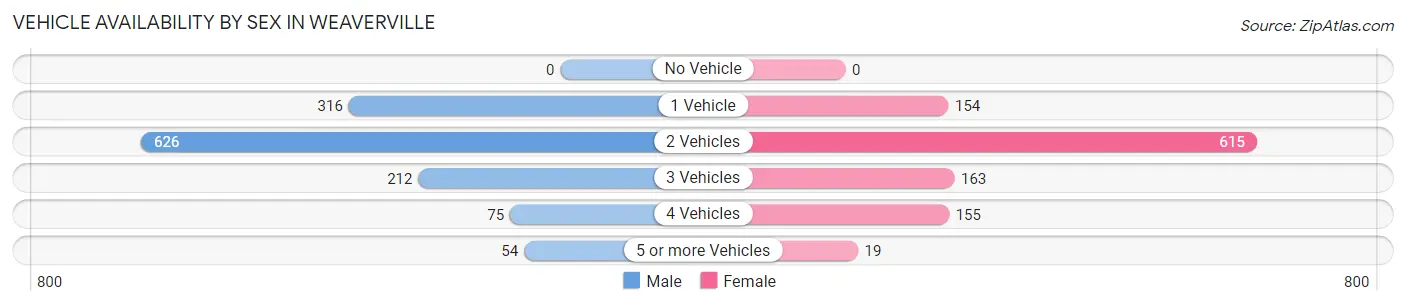
| Vehicles Available | Male | Female |
| No Vehicle | 0 (0.0%) | 0 (0.0%) |
| 1 Vehicle | 316 (24.6%) | 154 (13.9%) |
| 2 Vehicles | 626 (48.8%) | 615 (55.6%) |
| 3 Vehicles | 212 (16.5%) | 163 (14.7%) |
| 4 Vehicles | 75 (5.9%) | 155 (14.0%) |
| 5 or more Vehicles | 54 (4.2%) | 19 (1.7%) |
| Total | 1,283 (100.0%) | 1,106 (100.0%) |
Commute Time in Weaverville
The most frequently occuring commute durations in Weaverville are 10 to 14 minutes (576 commuters, 29.6%), 15 to 19 minutes (469 commuters, 24.1%), and 20 to 24 minutes (401 commuters, 20.6%).
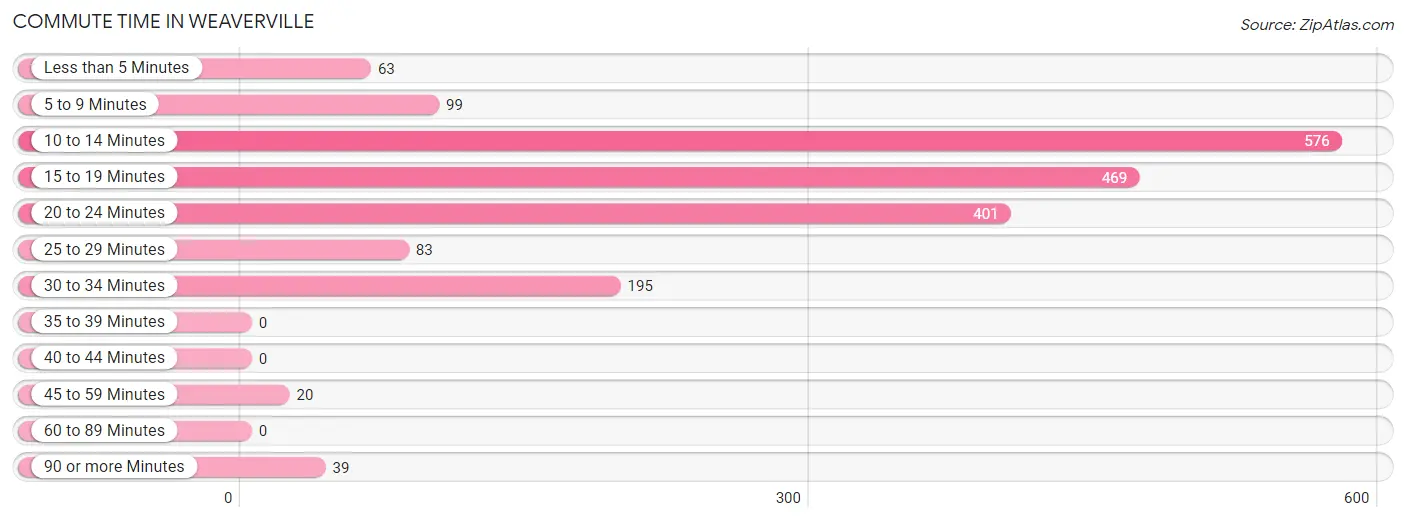
| Commute Time | # Commuters | % Commuters |
| Less than 5 Minutes | 63 | 3.2% |
| 5 to 9 Minutes | 99 | 5.1% |
| 10 to 14 Minutes | 576 | 29.6% |
| 15 to 19 Minutes | 469 | 24.1% |
| 20 to 24 Minutes | 401 | 20.6% |
| 25 to 29 Minutes | 83 | 4.3% |
| 30 to 34 Minutes | 195 | 10.0% |
| 35 to 39 Minutes | 0 | 0.0% |
| 40 to 44 Minutes | 0 | 0.0% |
| 45 to 59 Minutes | 20 | 1.0% |
| 60 to 89 Minutes | 0 | 0.0% |
| 90 or more Minutes | 39 | 2.0% |
Commute Time by Sex in Weaverville
The most common commute times in Weaverville are 10 to 14 minutes (501 commuters, 48.0%) for males and 15 to 19 minutes (404 commuters, 44.8%) for females.
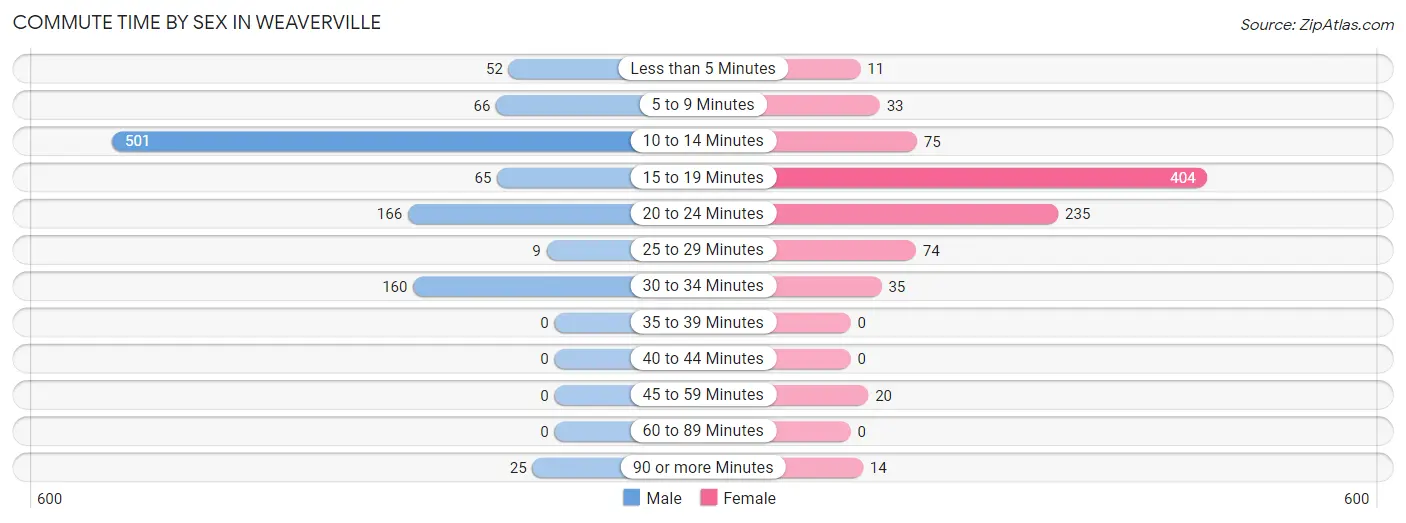
| Commute Time | Male | Female |
| Less than 5 Minutes | 52 (5.0%) | 11 (1.2%) |
| 5 to 9 Minutes | 66 (6.3%) | 33 (3.7%) |
| 10 to 14 Minutes | 501 (48.0%) | 75 (8.3%) |
| 15 to 19 Minutes | 65 (6.2%) | 404 (44.8%) |
| 20 to 24 Minutes | 166 (15.9%) | 235 (26.1%) |
| 25 to 29 Minutes | 9 (0.9%) | 74 (8.2%) |
| 30 to 34 Minutes | 160 (15.3%) | 35 (3.9%) |
| 35 to 39 Minutes | 0 (0.0%) | 0 (0.0%) |
| 40 to 44 Minutes | 0 (0.0%) | 0 (0.0%) |
| 45 to 59 Minutes | 0 (0.0%) | 20 (2.2%) |
| 60 to 89 Minutes | 0 (0.0%) | 0 (0.0%) |
| 90 or more Minutes | 25 (2.4%) | 14 (1.5%) |
Time of Departure to Work by Sex in Weaverville
The most frequent times of departure to work in Weaverville are 8:30 AM to 8:59 AM (325, 31.1%) for males and 9:00 AM to 9:59 AM (272, 30.2%) for females.
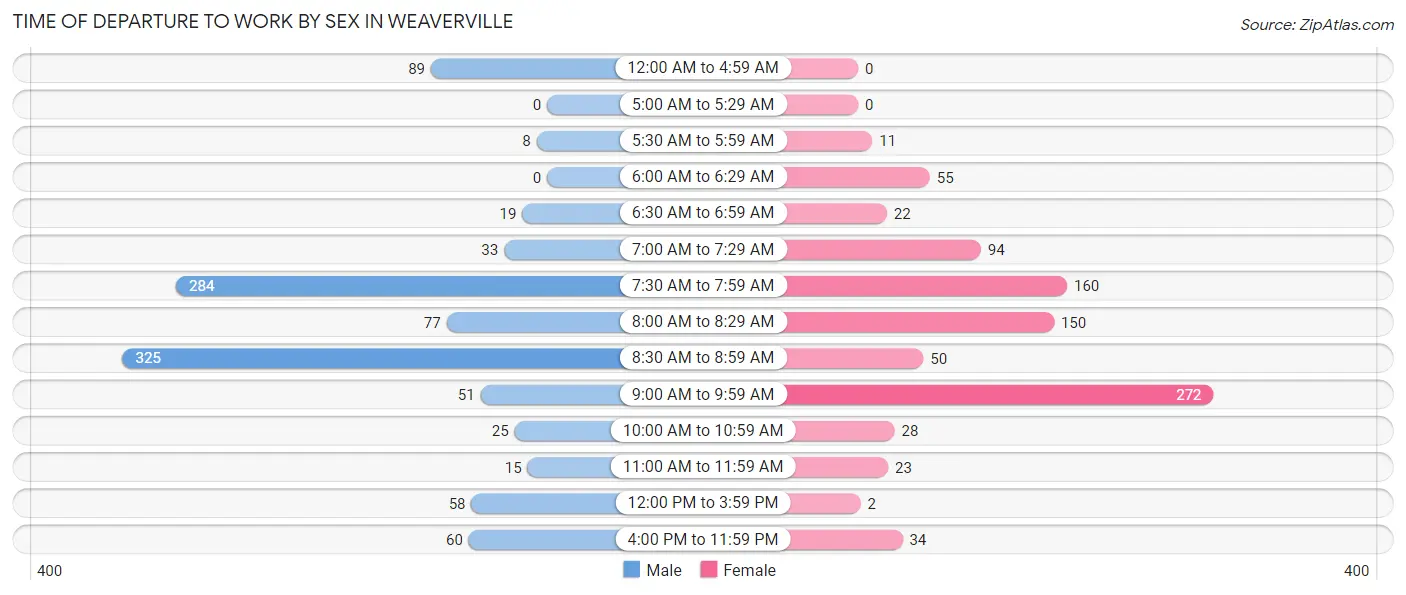
| Time of Departure | Male | Female |
| 12:00 AM to 4:59 AM | 89 (8.5%) | 0 (0.0%) |
| 5:00 AM to 5:29 AM | 0 (0.0%) | 0 (0.0%) |
| 5:30 AM to 5:59 AM | 8 (0.8%) | 11 (1.2%) |
| 6:00 AM to 6:29 AM | 0 (0.0%) | 55 (6.1%) |
| 6:30 AM to 6:59 AM | 19 (1.8%) | 22 (2.4%) |
| 7:00 AM to 7:29 AM | 33 (3.2%) | 94 (10.4%) |
| 7:30 AM to 7:59 AM | 284 (27.2%) | 160 (17.8%) |
| 8:00 AM to 8:29 AM | 77 (7.4%) | 150 (16.7%) |
| 8:30 AM to 8:59 AM | 325 (31.1%) | 50 (5.6%) |
| 9:00 AM to 9:59 AM | 51 (4.9%) | 272 (30.2%) |
| 10:00 AM to 10:59 AM | 25 (2.4%) | 28 (3.1%) |
| 11:00 AM to 11:59 AM | 15 (1.4%) | 23 (2.5%) |
| 12:00 PM to 3:59 PM | 58 (5.6%) | 2 (0.2%) |
| 4:00 PM to 11:59 PM | 60 (5.8%) | 34 (3.8%) |
| Total | 1,044 (100.0%) | 901 (100.0%) |
Housing Occupancy in Weaverville
Occupancy by Ownership in Weaverville
Of the total 1,962 dwellings in Weaverville, owner-occupied units account for 1,471 (75.0%), while renter-occupied units make up 491 (25.0%).
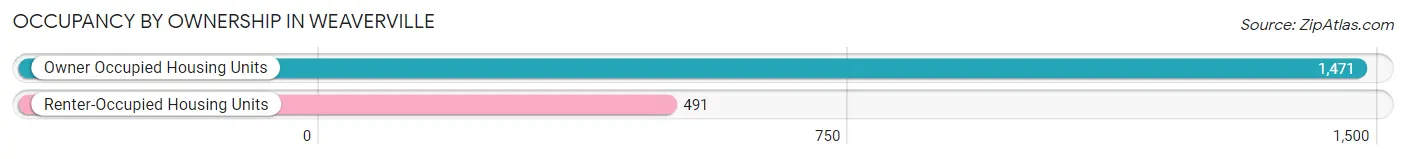
| Occupancy | # Housing Units | % Housing Units |
| Owner Occupied Housing Units | 1,471 | 75.0% |
| Renter-Occupied Housing Units | 491 | 25.0% |
| Total Occupied Housing Units | 1,962 | 100.0% |
Occupancy by Household Size in Weaverville
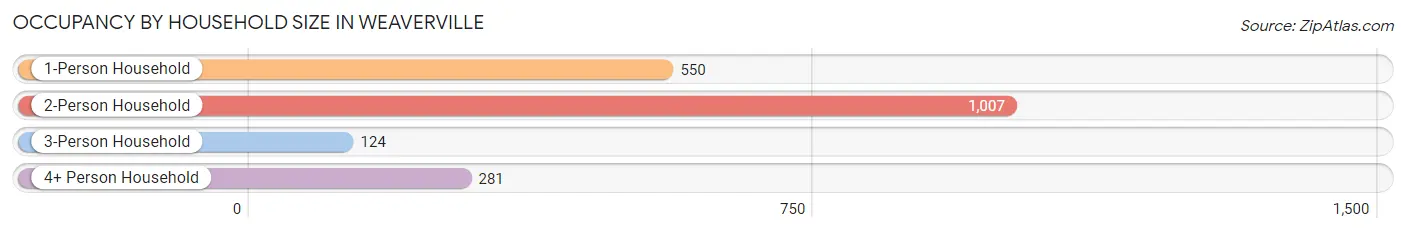
| Household Size | # Housing Units | % Housing Units |
| 1-Person Household | 550 | 28.0% |
| 2-Person Household | 1,007 | 51.3% |
| 3-Person Household | 124 | 6.3% |
| 4+ Person Household | 281 | 14.3% |
| Total Housing Units | 1,962 | 100.0% |
Occupancy by Ownership by Household Size in Weaverville
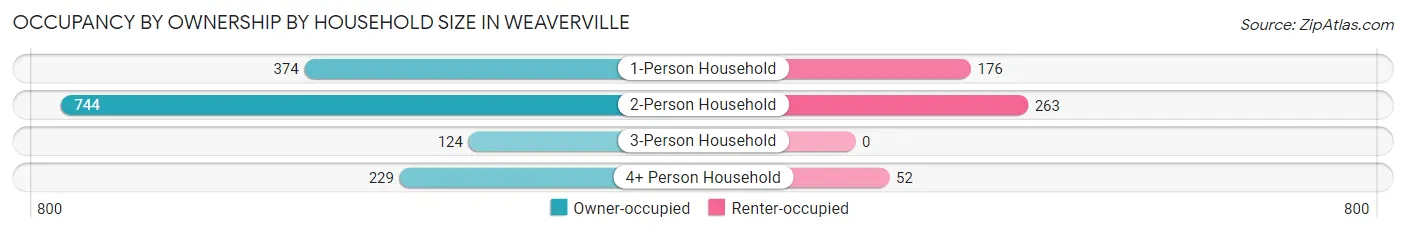
| Household Size | Owner-occupied | Renter-occupied |
| 1-Person Household | 374 (68.0%) | 176 (32.0%) |
| 2-Person Household | 744 (73.9%) | 263 (26.1%) |
| 3-Person Household | 124 (100.0%) | 0 (0.0%) |
| 4+ Person Household | 229 (81.5%) | 52 (18.5%) |
| Total Housing Units | 1,471 (75.0%) | 491 (25.0%) |
Occupancy by Educational Attainment in Weaverville
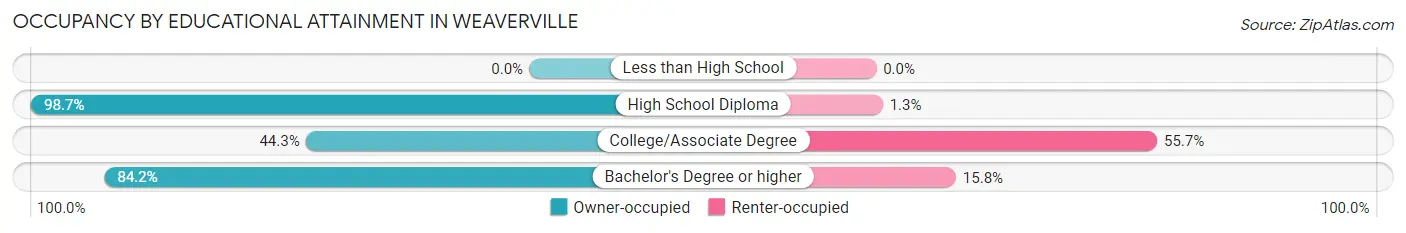
| Household Size | Owner-occupied | Renter-occupied |
| Less than High School | 0 (0.0%) | 0 (0.0%) |
| High School Diploma | 153 (98.7%) | 2 (1.3%) |
| College/Associate Degree | 226 (44.3%) | 284 (55.7%) |
| Bachelor's Degree or higher | 1,092 (84.2%) | 205 (15.8%) |
Occupancy by Age of Householder in Weaverville
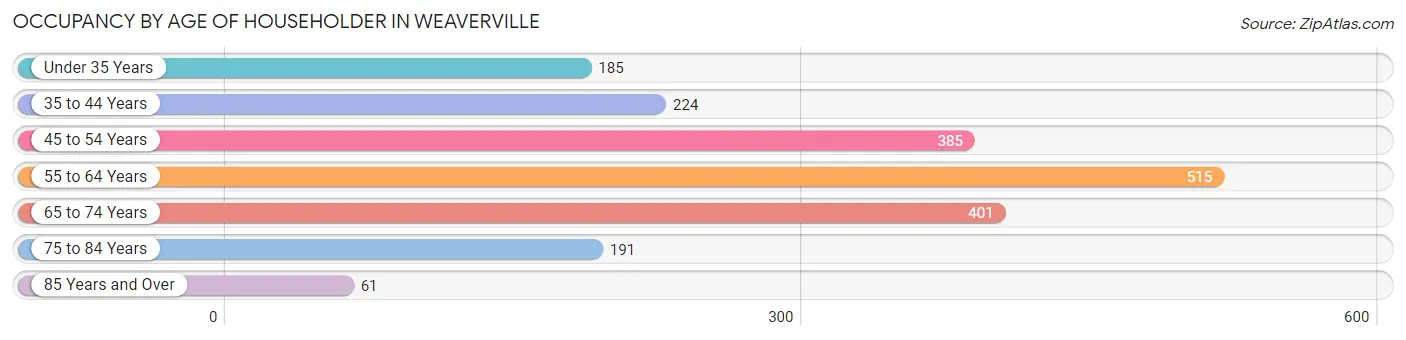
| Age Bracket | # Households | % Households |
| Under 35 Years | 185 | 9.4% |
| 35 to 44 Years | 224 | 11.4% |
| 45 to 54 Years | 385 | 19.6% |
| 55 to 64 Years | 515 | 26.3% |
| 65 to 74 Years | 401 | 20.4% |
| 75 to 84 Years | 191 | 9.7% |
| 85 Years and Over | 61 | 3.1% |
| Total | 1,962 | 100.0% |
Housing Finances in Weaverville
Median Income by Occupancy in Weaverville
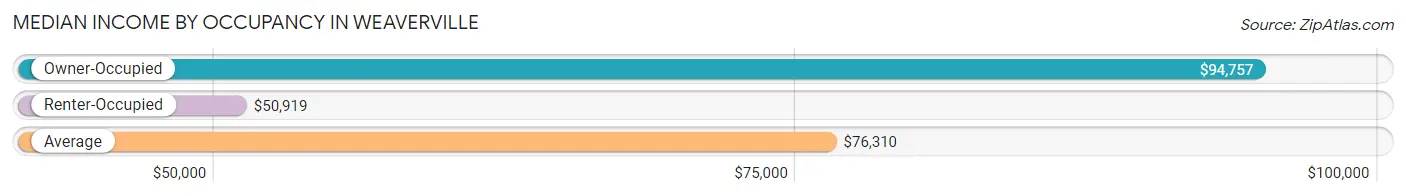
| Occupancy Type | # Households | Median Income |
| Owner-Occupied | 1,471 (75.0%) | $94,757 |
| Renter-Occupied | 491 (25.0%) | $50,919 |
| Average | 1,962 (100.0%) | $76,310 |
Occupancy by Householder Income Bracket in Weaverville
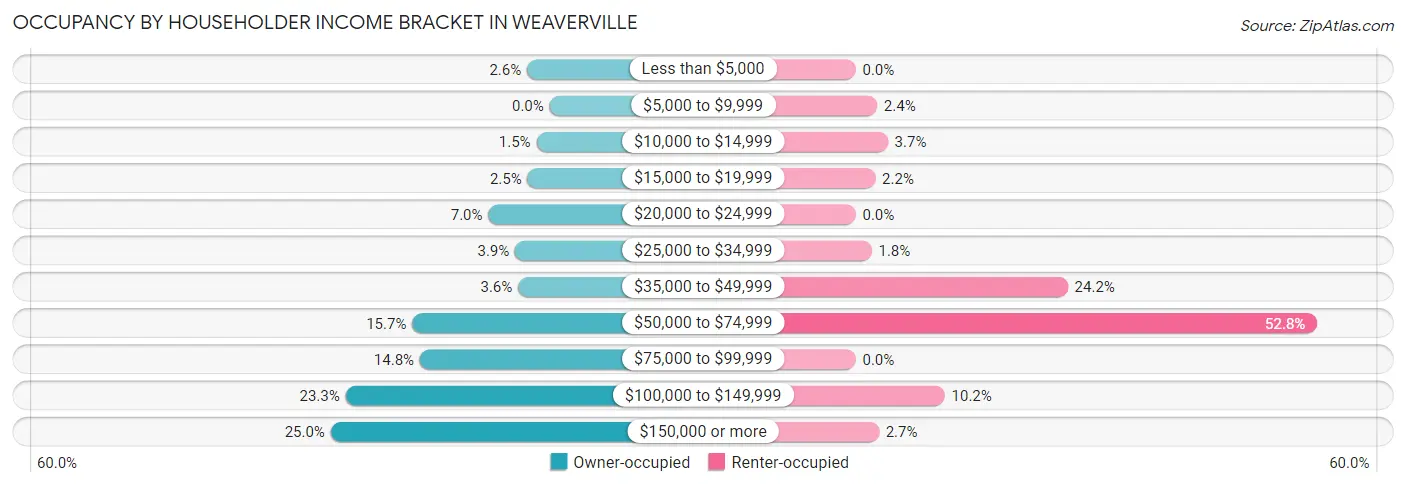
| Income Bracket | Owner-occupied | Renter-occupied |
| Less than $5,000 | 38 (2.6%) | 0 (0.0%) |
| $5,000 to $9,999 | 0 (0.0%) | 12 (2.4%) |
| $10,000 to $14,999 | 22 (1.5%) | 18 (3.7%) |
| $15,000 to $19,999 | 37 (2.5%) | 11 (2.2%) |
| $20,000 to $24,999 | 103 (7.0%) | 0 (0.0%) |
| $25,000 to $34,999 | 58 (3.9%) | 9 (1.8%) |
| $35,000 to $49,999 | 53 (3.6%) | 119 (24.2%) |
| $50,000 to $74,999 | 231 (15.7%) | 259 (52.7%) |
| $75,000 to $99,999 | 218 (14.8%) | 0 (0.0%) |
| $100,000 to $149,999 | 343 (23.3%) | 50 (10.2%) |
| $150,000 or more | 368 (25.0%) | 13 (2.6%) |
| Total | 1,471 (100.0%) | 491 (100.0%) |
Monthly Housing Cost Tiers in Weaverville
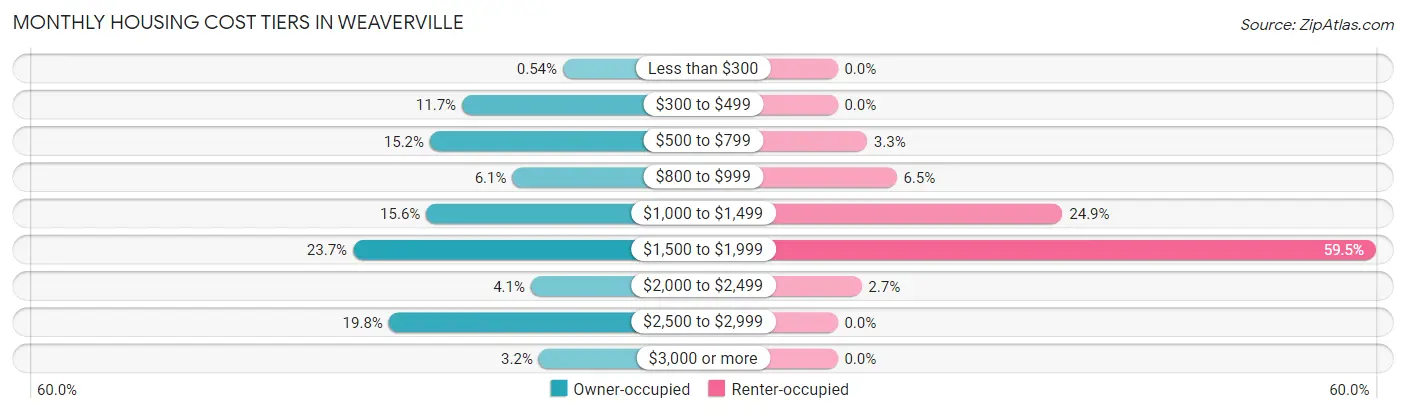
| Monthly Cost | Owner-occupied | Renter-occupied |
| Less than $300 | 8 (0.5%) | 0 (0.0%) |
| $300 to $499 | 172 (11.7%) | 0 (0.0%) |
| $500 to $799 | 224 (15.2%) | 16 (3.3%) |
| $800 to $999 | 90 (6.1%) | 32 (6.5%) |
| $1,000 to $1,499 | 230 (15.6%) | 122 (24.8%) |
| $1,500 to $1,999 | 349 (23.7%) | 292 (59.5%) |
| $2,000 to $2,499 | 60 (4.1%) | 13 (2.6%) |
| $2,500 to $2,999 | 291 (19.8%) | 0 (0.0%) |
| $3,000 or more | 47 (3.2%) | 0 (0.0%) |
| Total | 1,471 (100.0%) | 491 (100.0%) |
Physical Housing Characteristics in Weaverville
Housing Structures in Weaverville
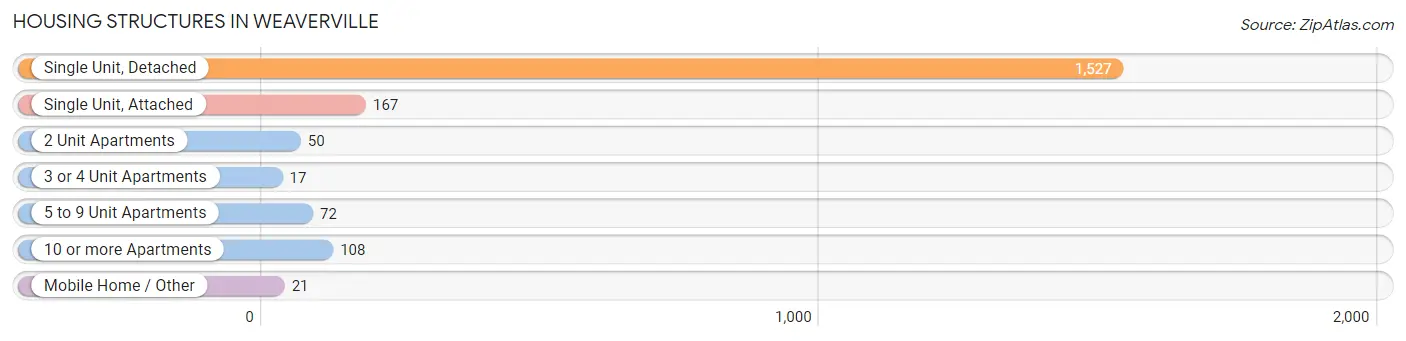
| Structure Type | # Housing Units | % Housing Units |
| Single Unit, Detached | 1,527 | 77.8% |
| Single Unit, Attached | 167 | 8.5% |
| 2 Unit Apartments | 50 | 2.5% |
| 3 or 4 Unit Apartments | 17 | 0.9% |
| 5 to 9 Unit Apartments | 72 | 3.7% |
| 10 or more Apartments | 108 | 5.5% |
| Mobile Home / Other | 21 | 1.1% |
| Total | 1,962 | 100.0% |
Housing Structures by Occupancy in Weaverville
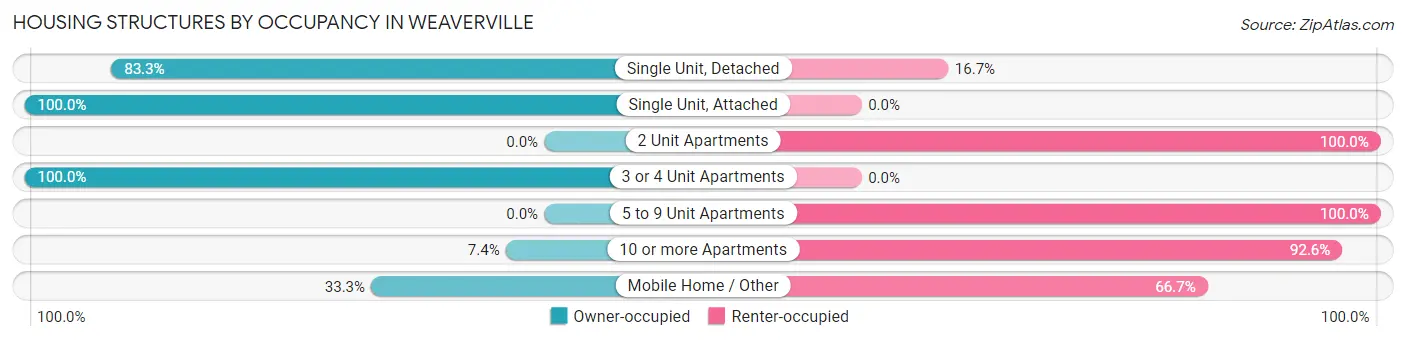
| Structure Type | Owner-occupied | Renter-occupied |
| Single Unit, Detached | 1,272 (83.3%) | 255 (16.7%) |
| Single Unit, Attached | 167 (100.0%) | 0 (0.0%) |
| 2 Unit Apartments | 0 (0.0%) | 50 (100.0%) |
| 3 or 4 Unit Apartments | 17 (100.0%) | 0 (0.0%) |
| 5 to 9 Unit Apartments | 0 (0.0%) | 72 (100.0%) |
| 10 or more Apartments | 8 (7.4%) | 100 (92.6%) |
| Mobile Home / Other | 7 (33.3%) | 14 (66.7%) |
| Total | 1,471 (75.0%) | 491 (25.0%) |
Housing Structures by Number of Rooms in Weaverville
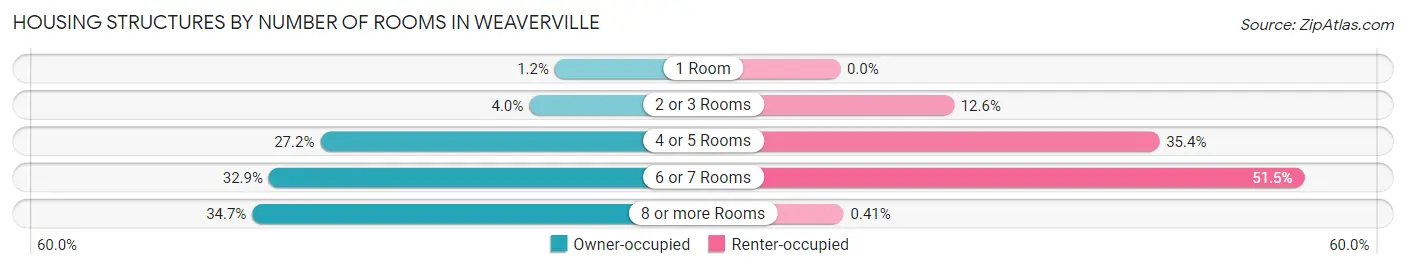
| Number of Rooms | Owner-occupied | Renter-occupied |
| 1 Room | 17 (1.2%) | 0 (0.0%) |
| 2 or 3 Rooms | 59 (4.0%) | 62 (12.6%) |
| 4 or 5 Rooms | 400 (27.2%) | 174 (35.4%) |
| 6 or 7 Rooms | 484 (32.9%) | 253 (51.5%) |
| 8 or more Rooms | 511 (34.7%) | 2 (0.4%) |
| Total | 1,471 (100.0%) | 491 (100.0%) |
Housing Structure by Heating Type in Weaverville
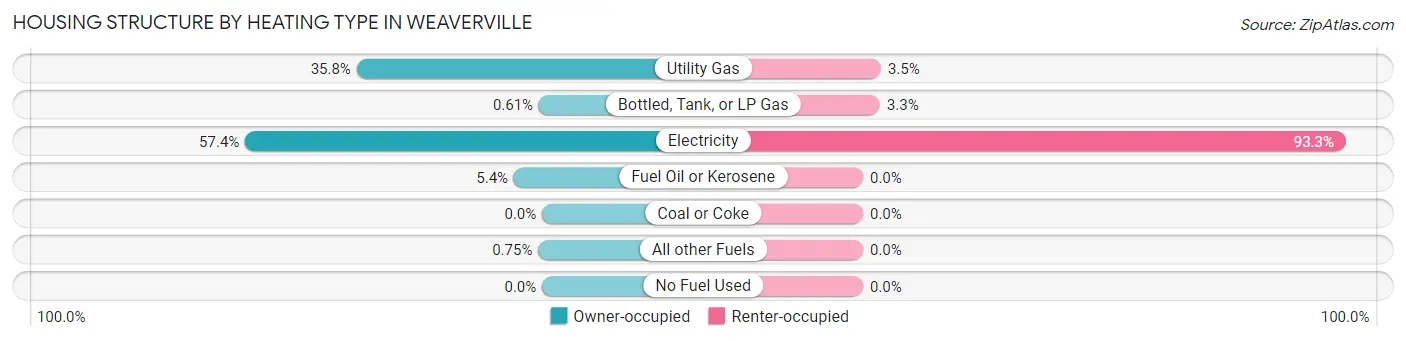
| Heating Type | Owner-occupied | Renter-occupied |
| Utility Gas | 527 (35.8%) | 17 (3.5%) |
| Bottled, Tank, or LP Gas | 9 (0.6%) | 16 (3.3%) |
| Electricity | 844 (57.4%) | 458 (93.3%) |
| Fuel Oil or Kerosene | 80 (5.4%) | 0 (0.0%) |
| Coal or Coke | 0 (0.0%) | 0 (0.0%) |
| All other Fuels | 11 (0.7%) | 0 (0.0%) |
| No Fuel Used | 0 (0.0%) | 0 (0.0%) |
| Total | 1,471 (100.0%) | 491 (100.0%) |
Household Vehicle Usage in Weaverville
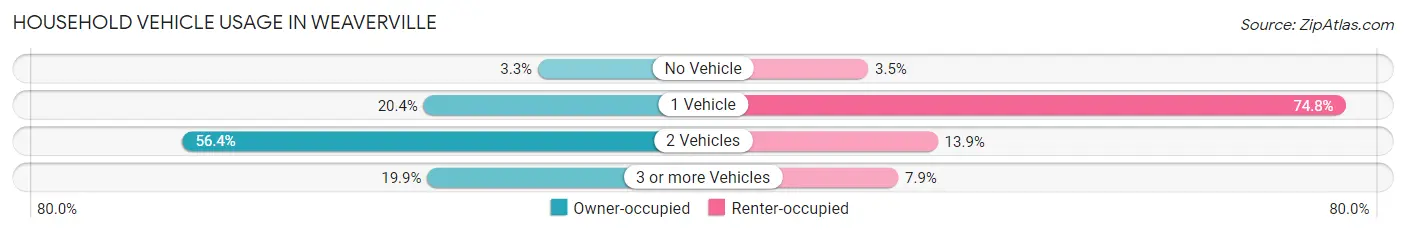
| Vehicles per Household | Owner-occupied | Renter-occupied |
| No Vehicle | 49 (3.3%) | 17 (3.5%) |
| 1 Vehicle | 300 (20.4%) | 367 (74.8%) |
| 2 Vehicles | 830 (56.4%) | 68 (13.9%) |
| 3 or more Vehicles | 292 (19.9%) | 39 (7.9%) |
| Total | 1,471 (100.0%) | 491 (100.0%) |
Real Estate & Mortgages in Weaverville
Real Estate and Mortgage Overview in Weaverville
| Characteristic | Without Mortgage | With Mortgage |
| Housing Units | 464 | 1,007 |
| Median Property Value | $388,200 | $434,700 |
| Median Household Income | $52,931 | $310 |
| Monthly Housing Costs | $558 | $47 |
| Real Estate Taxes | $2,707 | $0 |
Property Value by Mortgage Status in Weaverville
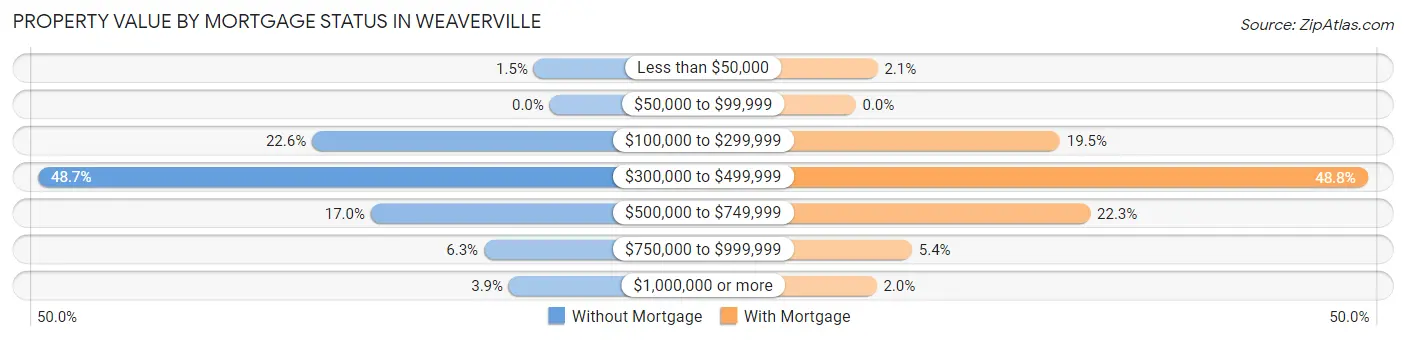
| Property Value | Without Mortgage | With Mortgage |
| Less than $50,000 | 7 (1.5%) | 21 (2.1%) |
| $50,000 to $99,999 | 0 (0.0%) | 0 (0.0%) |
| $100,000 to $299,999 | 105 (22.6%) | 196 (19.5%) |
| $300,000 to $499,999 | 226 (48.7%) | 491 (48.8%) |
| $500,000 to $749,999 | 79 (17.0%) | 225 (22.3%) |
| $750,000 to $999,999 | 29 (6.2%) | 54 (5.4%) |
| $1,000,000 or more | 18 (3.9%) | 20 (2.0%) |
| Total | 464 (100.0%) | 1,007 (100.0%) |
Household Income by Mortgage Status in Weaverville
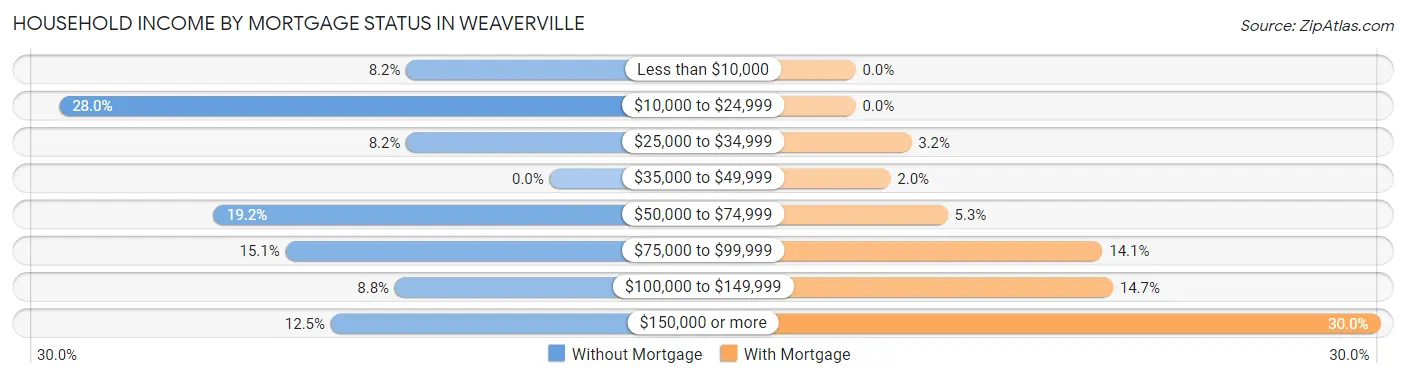
| Household Income | Without Mortgage | With Mortgage |
| Less than $10,000 | 38 (8.2%) | 0 (0.0%) |
| $10,000 to $24,999 | 130 (28.0%) | 0 (0.0%) |
| $25,000 to $34,999 | 38 (8.2%) | 32 (3.2%) |
| $35,000 to $49,999 | 0 (0.0%) | 20 (2.0%) |
| $50,000 to $74,999 | 89 (19.2%) | 53 (5.3%) |
| $75,000 to $99,999 | 70 (15.1%) | 142 (14.1%) |
| $100,000 to $149,999 | 41 (8.8%) | 148 (14.7%) |
| $150,000 or more | 58 (12.5%) | 302 (30.0%) |
| Total | 464 (100.0%) | 1,007 (100.0%) |
Property Value to Household Income Ratio in Weaverville
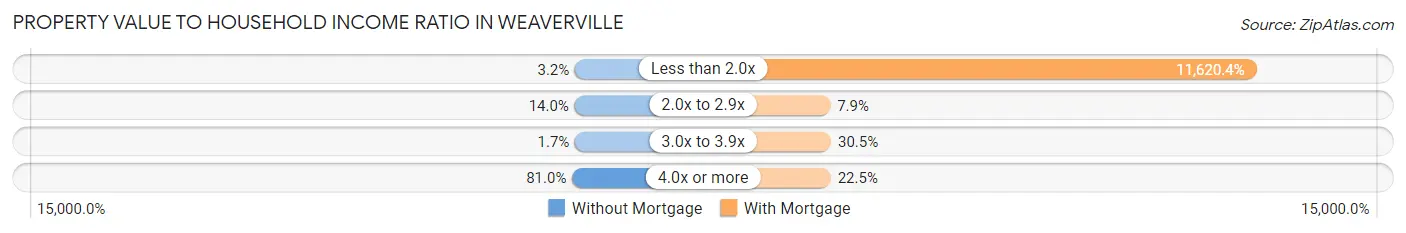
| Value-to-Income Ratio | Without Mortgage | With Mortgage |
| Less than 2.0x | 15 (3.2%) | 117,017 (11,620.4%) |
| 2.0x to 2.9x | 65 (14.0%) | 79 (7.9%) |
| 3.0x to 3.9x | 8 (1.7%) | 307 (30.5%) |
| 4.0x or more | 376 (81.0%) | 227 (22.5%) |
| Total | 464 (100.0%) | 1,007 (100.0%) |
Real Estate Taxes by Mortgage Status in Weaverville
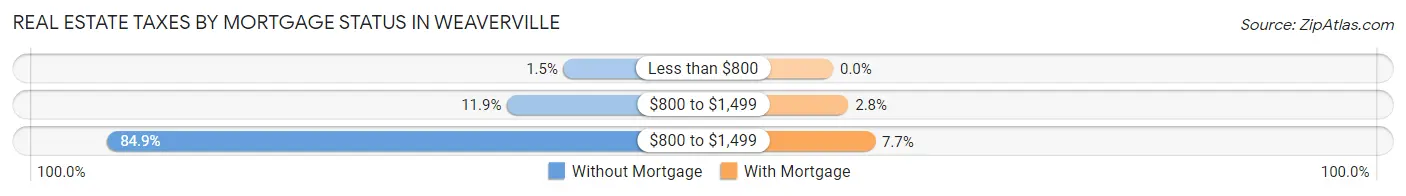
| Property Taxes | Without Mortgage | With Mortgage |
| Less than $800 | 7 (1.5%) | 0 (0.0%) |
| $800 to $1,499 | 55 (11.8%) | 28 (2.8%) |
| $800 to $1,499 | 394 (84.9%) | 77 (7.6%) |
| Total | 464 (100.0%) | 1,007 (100.0%) |
Health & Disability in Weaverville
Health Insurance Coverage by Age in Weaverville
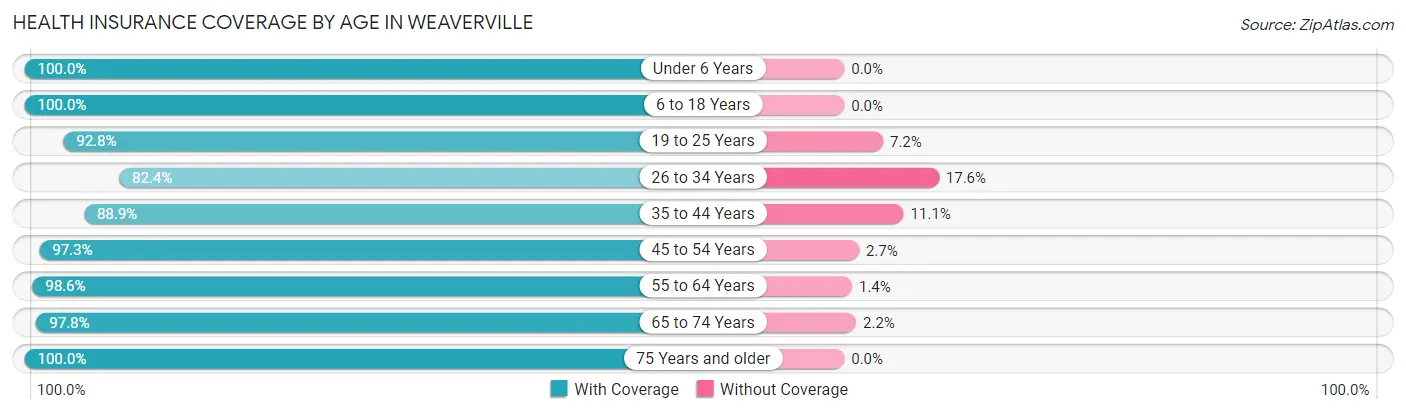
| Age Bracket | With Coverage | Without Coverage |
| Under 6 Years | 248 (100.0%) | 0 (0.0%) |
| 6 to 18 Years | 350 (100.0%) | 0 (0.0%) |
| 19 to 25 Years | 167 (92.8%) | 13 (7.2%) |
| 26 to 34 Years | 341 (82.4%) | 73 (17.6%) |
| 35 to 44 Years | 450 (88.9%) | 56 (11.1%) |
| 45 to 54 Years | 638 (97.3%) | 18 (2.7%) |
| 55 to 64 Years | 957 (98.6%) | 14 (1.4%) |
| 65 to 74 Years | 666 (97.8%) | 15 (2.2%) |
| 75 Years and older | 415 (100.0%) | 0 (0.0%) |
| Total | 4,232 (95.7%) | 189 (4.3%) |
Health Insurance Coverage by Citizenship Status in Weaverville
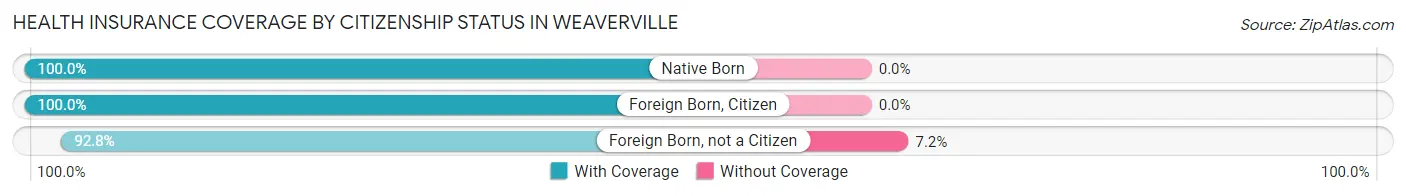
| Citizenship Status | With Coverage | Without Coverage |
| Native Born | 248 (100.0%) | 0 (0.0%) |
| Foreign Born, Citizen | 350 (100.0%) | 0 (0.0%) |
| Foreign Born, not a Citizen | 167 (92.8%) | 13 (7.2%) |
Health Insurance Coverage by Household Income in Weaverville
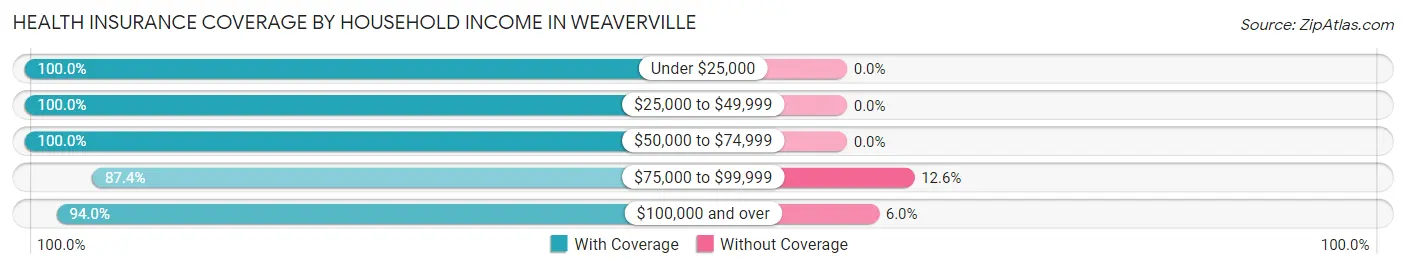
| Household Income | With Coverage | Without Coverage |
| Under $25,000 | 351 (100.0%) | 0 (0.0%) |
| $25,000 to $49,999 | 363 (100.0%) | 0 (0.0%) |
| $50,000 to $74,999 | 1,103 (100.0%) | 0 (0.0%) |
| $75,000 to $99,999 | 436 (87.4%) | 63 (12.6%) |
| $100,000 and over | 1,979 (94.0%) | 126 (6.0%) |
Public vs Private Health Insurance Coverage by Age in Weaverville
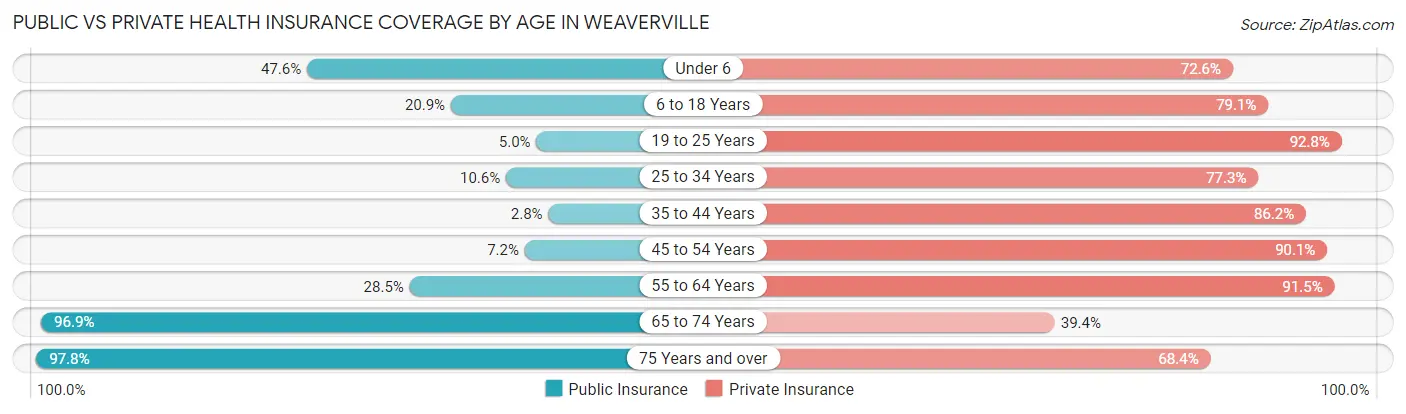
| Age Bracket | Public Insurance | Private Insurance |
| Under 6 | 118 (47.6%) | 180 (72.6%) |
| 6 to 18 Years | 73 (20.9%) | 277 (79.1%) |
| 19 to 25 Years | 9 (5.0%) | 167 (92.8%) |
| 25 to 34 Years | 44 (10.6%) | 320 (77.3%) |
| 35 to 44 Years | 14 (2.8%) | 436 (86.2%) |
| 45 to 54 Years | 47 (7.2%) | 591 (90.1%) |
| 55 to 64 Years | 277 (28.5%) | 888 (91.4%) |
| 65 to 74 Years | 660 (96.9%) | 268 (39.4%) |
| 75 Years and over | 406 (97.8%) | 284 (68.4%) |
| Total | 1,648 (37.3%) | 3,411 (77.1%) |
Disability Status by Sex by Age in Weaverville
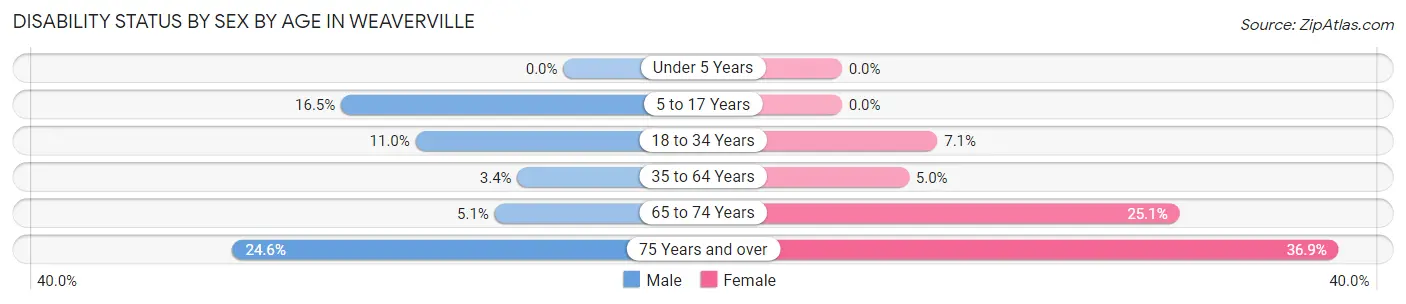
| Age Bracket | Male | Female |
| Under 5 Years | 0 (0.0%) | 0 (0.0%) |
| 5 to 17 Years | 34 (16.5%) | 0 (0.0%) |
| 18 to 34 Years | 35 (11.0%) | 21 (7.1%) |
| 35 to 64 Years | 31 (3.4%) | 61 (5.0%) |
| 65 to 74 Years | 16 (5.1%) | 92 (25.1%) |
| 75 Years and over | 42 (24.6%) | 90 (36.9%) |
Disability Class by Sex by Age in Weaverville
Disability Class: Hearing Difficulty
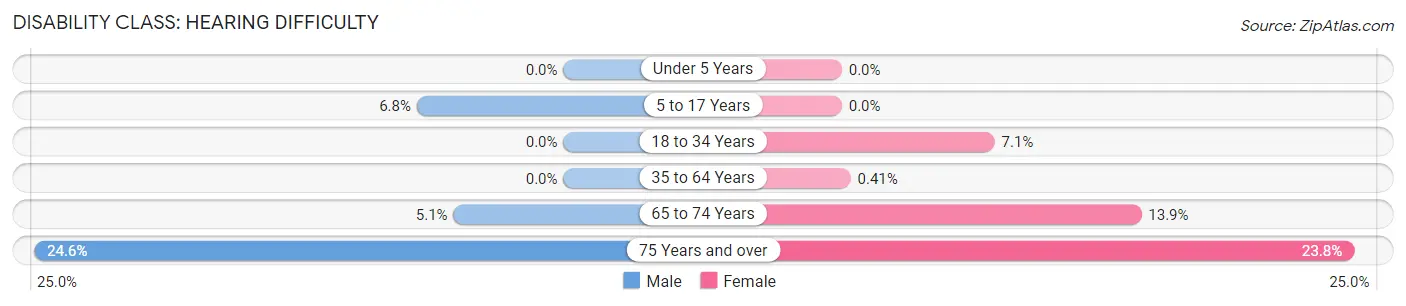
| Age Bracket | Male | Female |
| Under 5 Years | 0 (0.0%) | 0 (0.0%) |
| 5 to 17 Years | 14 (6.8%) | 0 (0.0%) |
| 18 to 34 Years | 0 (0.0%) | 21 (7.1%) |
| 35 to 64 Years | 0 (0.0%) | 5 (0.4%) |
| 65 to 74 Years | 16 (5.1%) | 51 (13.9%) |
| 75 Years and over | 42 (24.6%) | 58 (23.8%) |
Disability Class: Vision Difficulty
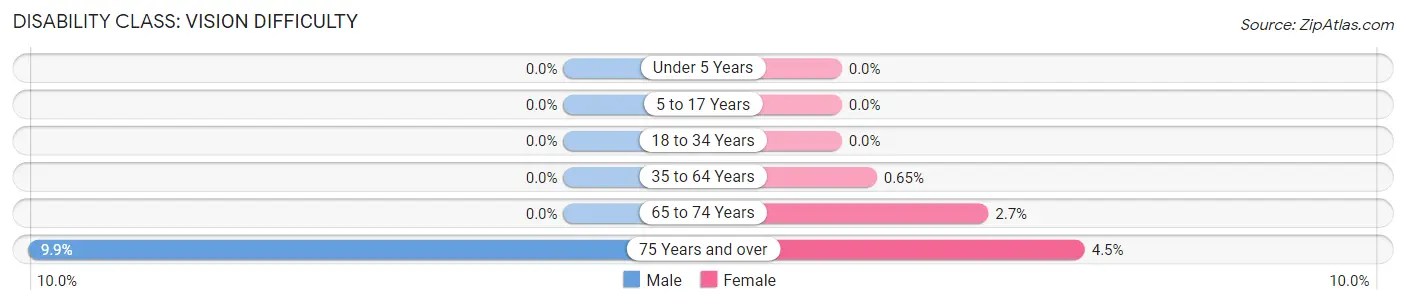
| Age Bracket | Male | Female |
| Under 5 Years | 0 (0.0%) | 0 (0.0%) |
| 5 to 17 Years | 0 (0.0%) | 0 (0.0%) |
| 18 to 34 Years | 0 (0.0%) | 0 (0.0%) |
| 35 to 64 Years | 0 (0.0%) | 8 (0.6%) |
| 65 to 74 Years | 0 (0.0%) | 10 (2.7%) |
| 75 Years and over | 17 (9.9%) | 11 (4.5%) |
Disability Class: Cognitive Difficulty
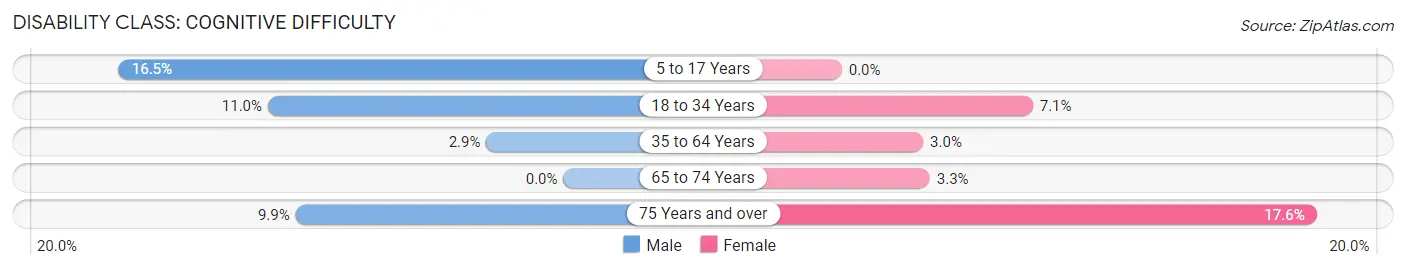
| Age Bracket | Male | Female |
| 5 to 17 Years | 34 (16.5%) | 0 (0.0%) |
| 18 to 34 Years | 35 (11.0%) | 21 (7.1%) |
| 35 to 64 Years | 26 (2.9%) | 37 (3.0%) |
| 65 to 74 Years | 0 (0.0%) | 12 (3.3%) |
| 75 Years and over | 17 (9.9%) | 43 (17.6%) |
Disability Class: Ambulatory Difficulty
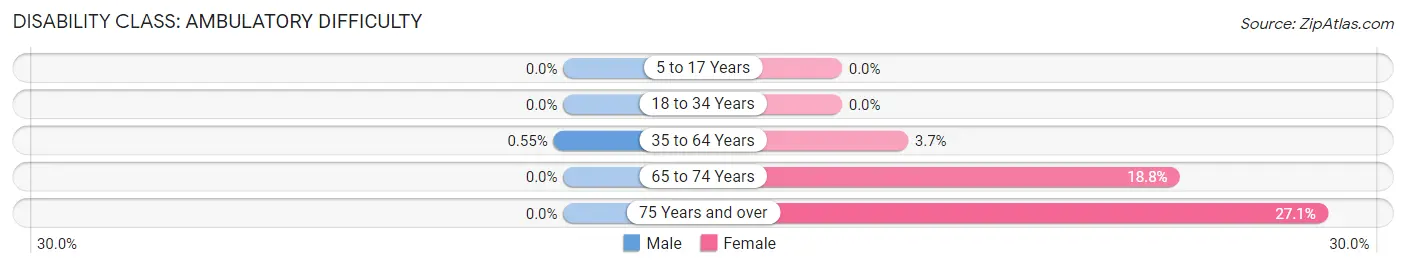
| Age Bracket | Male | Female |
| 5 to 17 Years | 0 (0.0%) | 0 (0.0%) |
| 18 to 34 Years | 0 (0.0%) | 0 (0.0%) |
| 35 to 64 Years | 5 (0.5%) | 45 (3.7%) |
| 65 to 74 Years | 0 (0.0%) | 69 (18.8%) |
| 75 Years and over | 0 (0.0%) | 66 (27.1%) |
Disability Class: Self-Care Difficulty
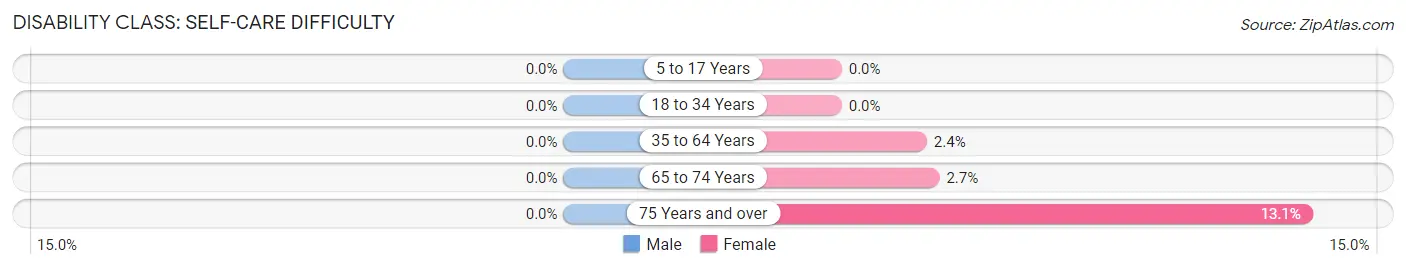
| Age Bracket | Male | Female |
| 5 to 17 Years | 0 (0.0%) | 0 (0.0%) |
| 18 to 34 Years | 0 (0.0%) | 0 (0.0%) |
| 35 to 64 Years | 0 (0.0%) | 29 (2.4%) |
| 65 to 74 Years | 0 (0.0%) | 10 (2.7%) |
| 75 Years and over | 0 (0.0%) | 32 (13.1%) |
Technology Access in Weaverville
Computing Device Access in Weaverville
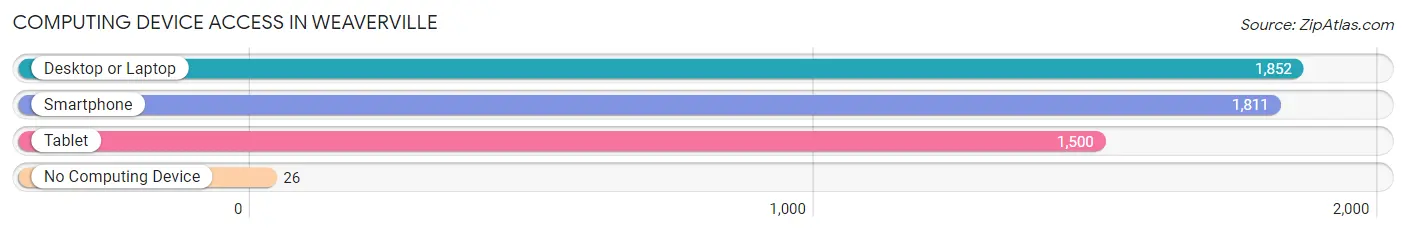
| Device Type | # Households | % Households |
| Desktop or Laptop | 1,852 | 94.4% |
| Smartphone | 1,811 | 92.3% |
| Tablet | 1,500 | 76.4% |
| No Computing Device | 26 | 1.3% |
| Total | 1,962 | 100.0% |
Internet Access in Weaverville
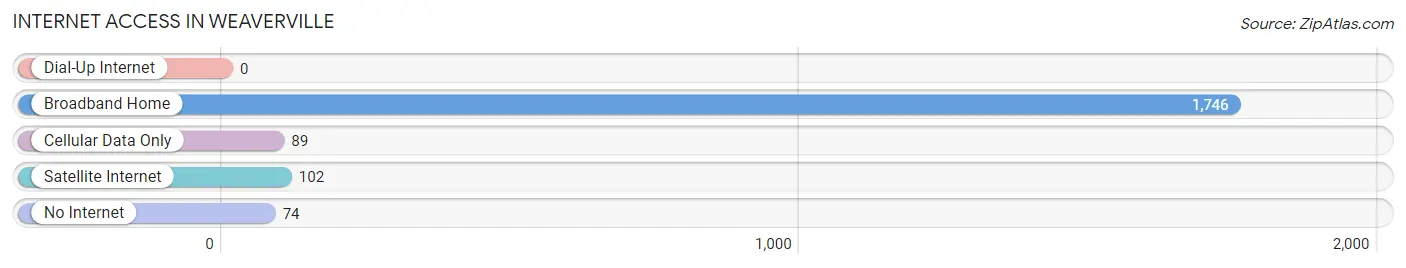
| Internet Type | # Households | % Households |
| Dial-Up Internet | 0 | 0.0% |
| Broadband Home | 1,746 | 89.0% |
| Cellular Data Only | 89 | 4.5% |
| Satellite Internet | 102 | 5.2% |
| No Internet | 74 | 3.8% |
| Total | 1,962 | 100.0% |
Weaverville Summary
Weaverville is a town located in Buncombe County, North Carolina, United States. It is part of the Asheville Metropolitan Statistical Area. The population was 3,120 at the 2010 census.
Geography
Weaverville is located at 35 41 25 North 82 31 17 West 35 690278 82 521389
According to the United States Census Bureau, the town has a total area of 2.2 square miles (5.7 km2), all of it land.
History
Weaverville was founded in 1875 by Michael Weaver, a German immigrant. He purchased the land from the Buncombe County government and began to build a small village. The town was incorporated in 1889.
The town was named after Michael Weaver, who was a prominent figure in the area. He was a successful businessman and a leader in the community. He was also a major contributor to the development of the town.
Weaverville was a small, rural town until the 1950s when it began to experience rapid growth. This growth was due to the influx of people from other parts of the country who were looking for a place to settle down.
Economy
Weaverville is a small town with a diverse economy. The town is home to a variety of businesses, including retail stores, restaurants, and professional services. The town also has a thriving tourism industry, with many visitors coming to the area to enjoy the natural beauty of the Blue Ridge Mountains.
The town is also home to several manufacturing companies, including a paper mill, a furniture factory, and a plastics plant. These companies provide jobs for many of the town's residents.
Demographics
As of the census of 2000, there were 2,845 people, 1,093 households, and 745 families residing in the town. The population density was 1,288.2 people per square mile (496.7/km2). There were 1,179 housing units at an average density of 527.2 per square mile (203.3/km2). The racial makeup of the town was 94.2% White, 2.7% African American, 0.3% Native American, 0.7% Asian, 0.1% Pacific Islander, 1.2% from other races, and 0.9% from two or more races. Hispanic or Latino of any race were 2.7% of the population.
There were 1,093 households, out of which 33.2% had children under the age of 18 living with them, 51.2% were married couples living together, 13.2% had a female householder with no husband present, and 30.7% were non-families. 25.2% of all households were made up of individuals, and 9.2% had someone living alone who was 65 years of age or older. The average household size was 2.60 and the average family size was 3.09.
In the town, the population was spread out, with 25.7% under the age of 18, 8.2% from 18 to 24, 30.2% from 25 to 44, 24.2% from 45 to 64, and 11.7% who were 65 years of age or older. The median age was 36 years. For every 100 females, there were 94.2 males. For every 100 females age 18 and over, there were 91.3 males.
The median income for a household in the town was $37,917, and the median income for a family was $45,000. Males had a median income of $30,938 versus $25,000 for females. The per capita income for the town was $18,945. About 8.2% of families and 11.2% of the population were below the poverty line, including 14.2% of those under age 18 and 8.2% of those age 65 or over.
Common Questions
What is Per Capita Income in Weaverville?
Per Capita income in Weaverville is $41,549.
What is the Median Family Income in Weaverville?
Median Family Income in Weaverville is $90,781.
What is the Median Household income in Weaverville?
Median Household Income in Weaverville is $76,310.
What is Income or Wage Gap in Weaverville?
Income or Wage Gap in Weaverville is 7.3%.
Women in Weaverville earn 92.7 cents for every dollar earned by a man.
What is Inequality or Gini Index in Weaverville?
Inequality or Gini Index in Weaverville is 0.37.
What is the Total Population of Weaverville?
Total Population of Weaverville is 4,559.
What is the Total Male Population of Weaverville?
Total Male Population of Weaverville is 2,049.
What is the Total Female Population of Weaverville?
Total Female Population of Weaverville is 2,510.
What is the Ratio of Males per 100 Females in Weaverville?
There are 81.63 Males per 100 Females in Weaverville.
What is the Ratio of Females per 100 Males in Weaverville?
There are 122.50 Females per 100 Males in Weaverville.
What is the Median Population Age in Weaverville?
Median Population Age in Weaverville is 53.5 Years.
What is the Average Family Size in Weaverville
Average Family Size in Weaverville is 2.7 People.
What is the Average Household Size in Weaverville
Average Household Size in Weaverville is 2.3 People.
How Large is the Labor Force in Weaverville?
There are 2,442 People in the Labor Forcein in Weaverville.
What is the Percentage of People in the Labor Force in Weaverville?
61.1% of People are in the Labor Force in Weaverville.
What is the Unemployment Rate in Weaverville?
Unemployment Rate in Weaverville is 1.3%.