Aurora, NC Map & Demographics
Aurora Map
Aurora Overview
$19,794
PER CAPITA INCOME
$58,750
AVG FAMILY INCOME
$43,897
AVG HOUSEHOLD INCOME
31.9%
WAGE / INCOME GAP [ % ]
68.1¢/ $1
WAGE / INCOME GAP [ $ ]
0.38
INEQUALITY / GINI INDEX
522
TOTAL POPULATION
271
MALE POPULATION
251
FEMALE POPULATION
107.97
MALES / 100 FEMALES
92.62
FEMALES / 100 MALES
39.3
MEDIAN AGE
3.5
AVG FAMILY SIZE
2.7
AVG HOUSEHOLD SIZE
251
LABOR FORCE [ PEOPLE ]
58.9%
PERCENT IN LABOR FORCE
18.3%
UNEMPLOYMENT RATE
Aurora Zip Codes
Aurora Area Codes
Income in Aurora
Income Overview in Aurora
Per Capita Income in Aurora is $19,794, while median incomes of families and households are $58,750 and $43,897 respectively.
| Characteristic | Number | Measure |
| Per Capita Income | 522 | $19,794 |
| Median Family Income | 124 | $58,750 |
| Mean Family Income | 124 | $57,451 |
| Median Household Income | 193 | $43,897 |
| Mean Household Income | 193 | $50,213 |
| Income Deficit | 124 | $0 |
| Wage / Income Gap (%) | 522 | 31.87% |
| Wage / Income Gap ($) | 522 | 68.13¢ per $1 |
| Gini / Inequality Index | 522 | 0.38 |
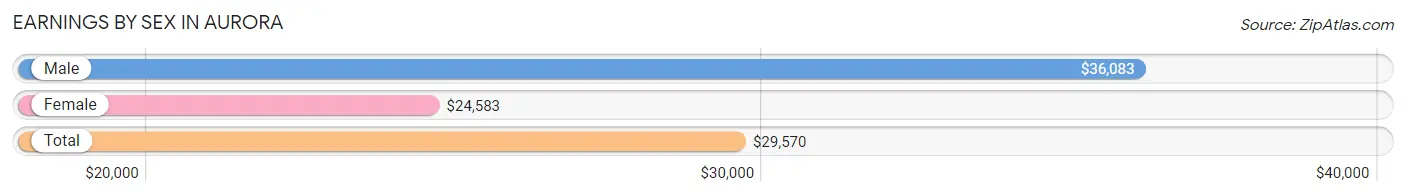
Earnings by Sex in Aurora
Average Earnings in Aurora are $29,570, $36,083 for men and $24,583 for women, a difference of 31.9%.
| Sex | Number | Average Earnings |
| Male | 105 (46.3%) | $36,083 |
| Female | 122 (53.7%) | $24,583 |
| Total | 227 (100.0%) | $29,570 |
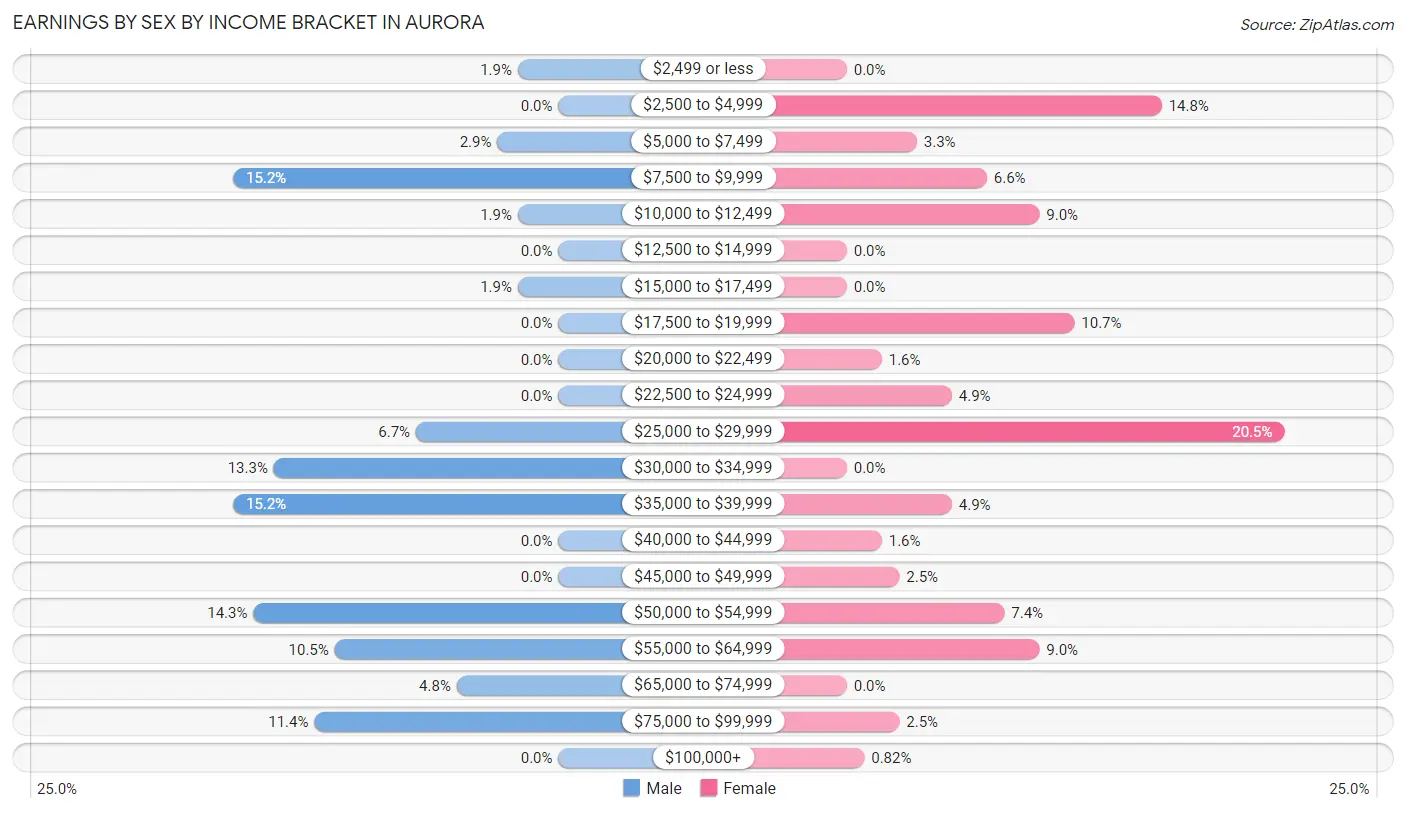
Earnings by Sex by Income Bracket in Aurora
The most common earnings brackets in Aurora are $7,500 to $9,999 for men (16 | 15.2%) and $25,000 to $29,999 for women (25 | 20.5%).
| Income | Male | Female |
| $2,499 or less | 2 (1.9%) | 0 (0.0%) |
| $2,500 to $4,999 | 0 (0.0%) | 18 (14.7%) |
| $5,000 to $7,499 | 3 (2.9%) | 4 (3.3%) |
| $7,500 to $9,999 | 16 (15.2%) | 8 (6.6%) |
| $10,000 to $12,499 | 2 (1.9%) | 11 (9.0%) |
| $12,500 to $14,999 | 0 (0.0%) | 0 (0.0%) |
| $15,000 to $17,499 | 2 (1.9%) | 0 (0.0%) |
| $17,500 to $19,999 | 0 (0.0%) | 13 (10.7%) |
| $20,000 to $22,499 | 0 (0.0%) | 2 (1.6%) |
| $22,500 to $24,999 | 0 (0.0%) | 6 (4.9%) |
| $25,000 to $29,999 | 7 (6.7%) | 25 (20.5%) |
| $30,000 to $34,999 | 14 (13.3%) | 0 (0.0%) |
| $35,000 to $39,999 | 16 (15.2%) | 6 (4.9%) |
| $40,000 to $44,999 | 0 (0.0%) | 2 (1.6%) |
| $45,000 to $49,999 | 0 (0.0%) | 3 (2.5%) |
| $50,000 to $54,999 | 15 (14.3%) | 9 (7.4%) |
| $55,000 to $64,999 | 11 (10.5%) | 11 (9.0%) |
| $65,000 to $74,999 | 5 (4.8%) | 0 (0.0%) |
| $75,000 to $99,999 | 12 (11.4%) | 3 (2.5%) |
| $100,000+ | 0 (0.0%) | 1 (0.8%) |
| Total | 105 (100.0%) | 122 (100.0%) |
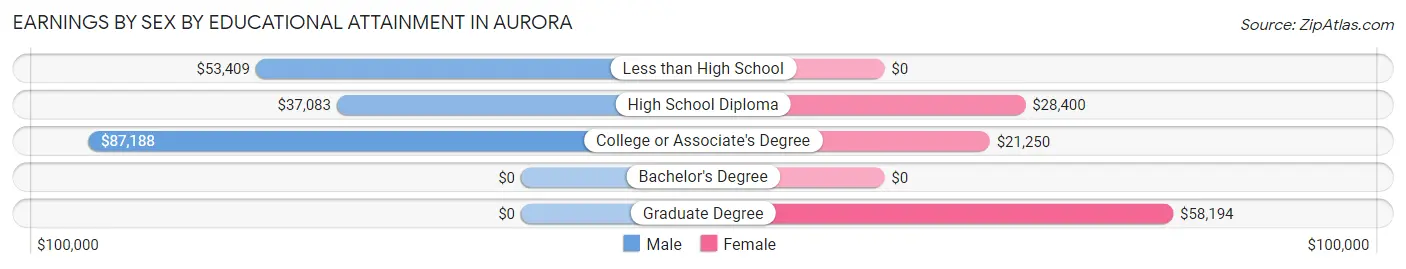
Earnings by Sex by Educational Attainment in Aurora
Average earnings in Aurora are $46,250 for men and $28,300 for women, a difference of 38.8%. Men with an educational attainment of college or associate's degree enjoy the highest average annual earnings of $87,188, while those with high school diploma education earn the least with $37,083. Women with an educational attainment of graduate degree earn the most with the average annual earnings of $58,194, while those with college or associate's degree education have the smallest earnings of $21,250.
| Educational Attainment | Male Income | Female Income |
| Less than High School | $53,409 | $0 |
| High School Diploma | $37,083 | $28,400 |
| College or Associate's Degree | $87,188 | $21,250 |
| Bachelor's Degree | - | - |
| Graduate Degree | - | - |
| Total | $46,250 | $28,300 |
Family Income in Aurora
Family Income Brackets in Aurora
According to the Aurora family income data, there are 35 families falling into the $75,000 to $99,999 income range, which is the most common income bracket and makes up 28.2% of all families.
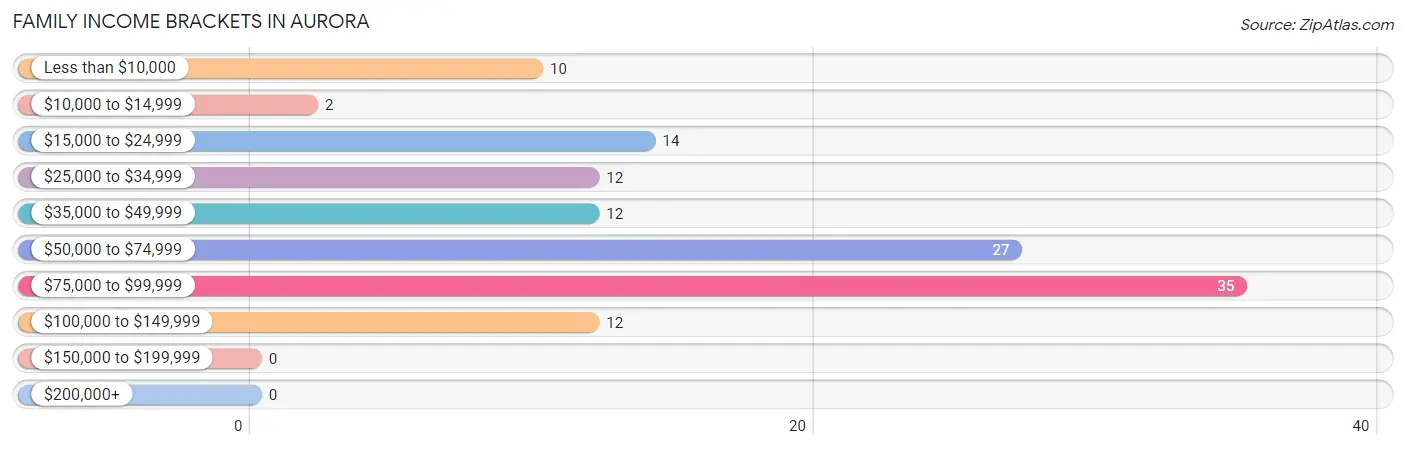
| Income Bracket | # Families | % Families |
| Less than $10,000 | 10 | 8.1% |
| $10,000 to $14,999 | 2 | 1.6% |
| $15,000 to $24,999 | 14 | 11.3% |
| $25,000 to $34,999 | 12 | 9.7% |
| $35,000 to $49,999 | 12 | 9.7% |
| $50,000 to $74,999 | 27 | 21.8% |
| $75,000 to $99,999 | 35 | 28.2% |
| $100,000 to $149,999 | 12 | 9.7% |
| $150,000 to $199,999 | 0 | 0.0% |
| $200,000+ | 0 | 0.0% |
Family Income by Famaliy Size in Aurora
4-person families (32 | 25.8%) account for the highest median family income in Aurora with $81,364 per family, while 3-person families (22 | 17.7%) have the highest median income of $24,583 per family member.
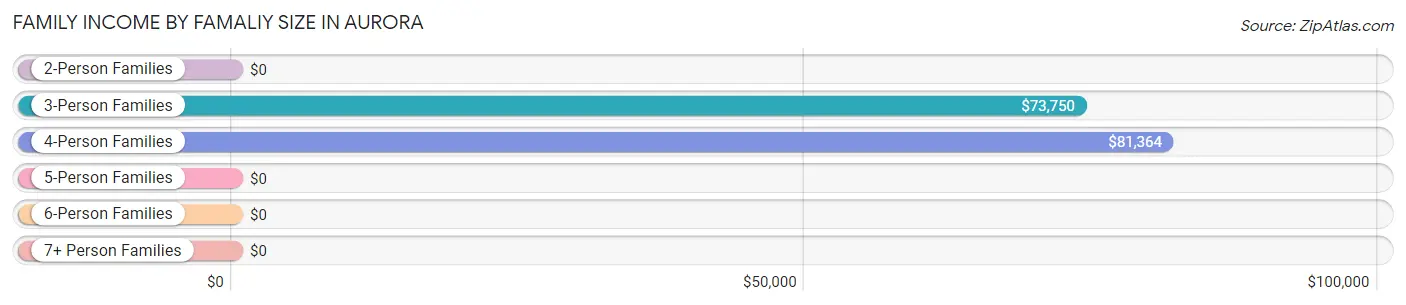
| Income Bracket | # Families | Median Income |
| 2-Person Families | 69 (55.6%) | $0 |
| 3-Person Families | 22 (17.7%) | $73,750 |
| 4-Person Families | 32 (25.8%) | $81,364 |
| 5-Person Families | 1 (0.8%) | $0 |
| 6-Person Families | 0 (0.0%) | $0 |
| 7+ Person Families | 0 (0.0%) | $0 |
| Total | 124 (100.0%) | $58,750 |
Family Income by Number of Earners in Aurora
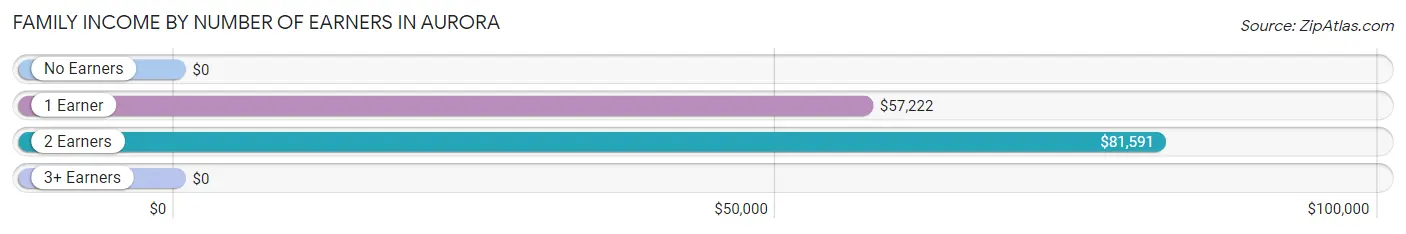
| Number of Earners | # Families | Median Income |
| No Earners | 22 (17.7%) | $0 |
| 1 Earner | 50 (40.3%) | $57,222 |
| 2 Earners | 50 (40.3%) | $81,591 |
| 3+ Earners | 2 (1.6%) | $0 |
| Total | 124 (100.0%) | $58,750 |
Household Income in Aurora
Household Income Brackets in Aurora
With 38 households falling in the category, the $75,000 to $99,999 income range is the most frequent in Aurora, accounting for 19.7% of all households.
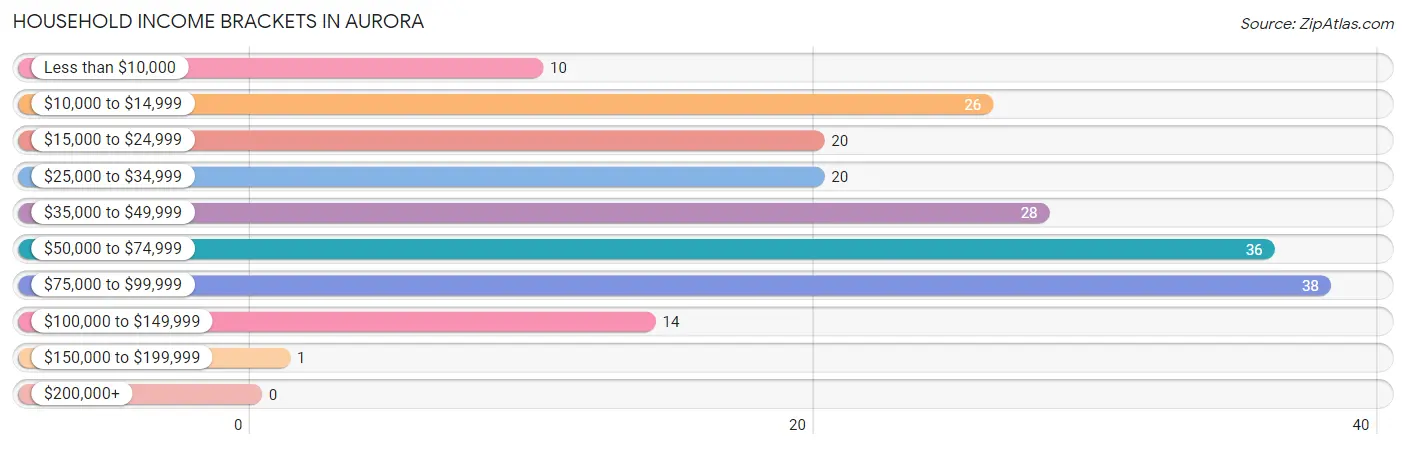
| Income Bracket | # Households | % Households |
| Less than $10,000 | 10 | 5.2% |
| $10,000 to $14,999 | 26 | 13.5% |
| $15,000 to $24,999 | 20 | 10.4% |
| $25,000 to $34,999 | 20 | 10.4% |
| $35,000 to $49,999 | 28 | 14.5% |
| $50,000 to $74,999 | 36 | 18.7% |
| $75,000 to $99,999 | 38 | 19.7% |
| $100,000 to $149,999 | 14 | 7.3% |
| $150,000 to $199,999 | 1 | 0.5% |
| $200,000+ | 0 | 0.0% |
Household Income by Householder Age in Aurora
The median household income in Aurora is $43,897, with the highest median household income of $42,941 found in the 65+ years age bracket for the primary householder. A total of 70 households (36.3%) fall into this category.
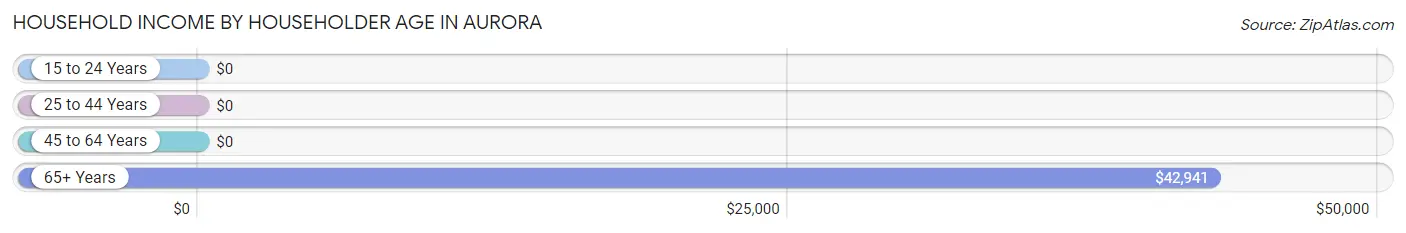
| Income Bracket | # Households | Median Income |
| 15 to 24 Years | 0 (0.0%) | $0 |
| 25 to 44 Years | 62 (32.1%) | $0 |
| 45 to 64 Years | 61 (31.6%) | $0 |
| 65+ Years | 70 (36.3%) | $42,941 |
| Total | 193 (100.0%) | $43,897 |
Poverty in Aurora
Income Below Poverty by Sex and Age in Aurora
With 25.8% poverty level for males and 19.4% for females among the residents of Aurora, under 5 year old males and 25 to 34 year old females are the most vulnerable to poverty, with 2 males (100.0%) and 9 females (33.3%) in their respective age groups living below the poverty level.
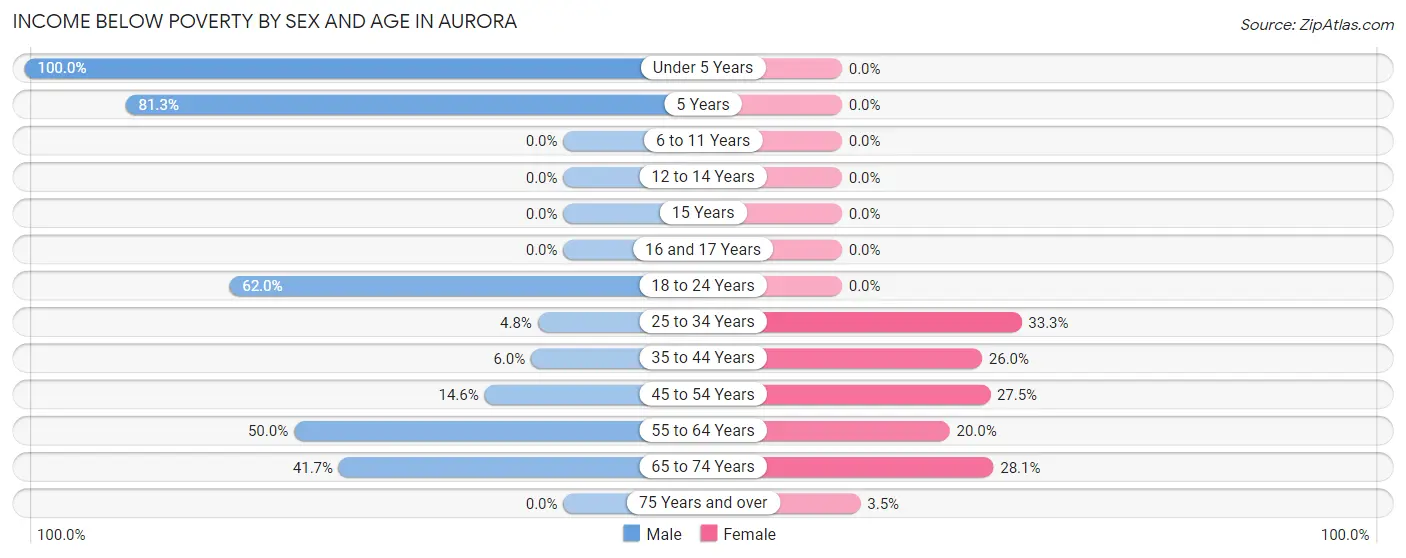
| Age Bracket | Male | Female |
| Under 5 Years | 2 (100.0%) | 0 (0.0%) |
| 5 Years | 13 (81.2%) | 0 (0.0%) |
| 6 to 11 Years | 0 (0.0%) | 0 (0.0%) |
| 12 to 14 Years | 0 (0.0%) | 0 (0.0%) |
| 15 Years | 0 (0.0%) | 0 (0.0%) |
| 16 and 17 Years | 0 (0.0%) | 0 (0.0%) |
| 18 to 24 Years | 31 (62.0%) | 0 (0.0%) |
| 25 to 34 Years | 1 (4.8%) | 9 (33.3%) |
| 35 to 44 Years | 3 (6.0%) | 13 (26.0%) |
| 45 to 54 Years | 6 (14.6%) | 11 (27.5%) |
| 55 to 64 Years | 9 (50.0%) | 5 (20.0%) |
| 65 to 74 Years | 5 (41.7%) | 9 (28.1%) |
| 75 Years and over | 0 (0.0%) | 1 (3.5%) |
| Total | 70 (25.8%) | 48 (19.4%) |
Income Above Poverty by Sex and Age in Aurora
According to the poverty statistics in Aurora, males aged 6 to 11 years and females aged under 5 years are the age groups that are most secure financially, with 100.0% of males and 100.0% of females in these age groups living above the poverty line.
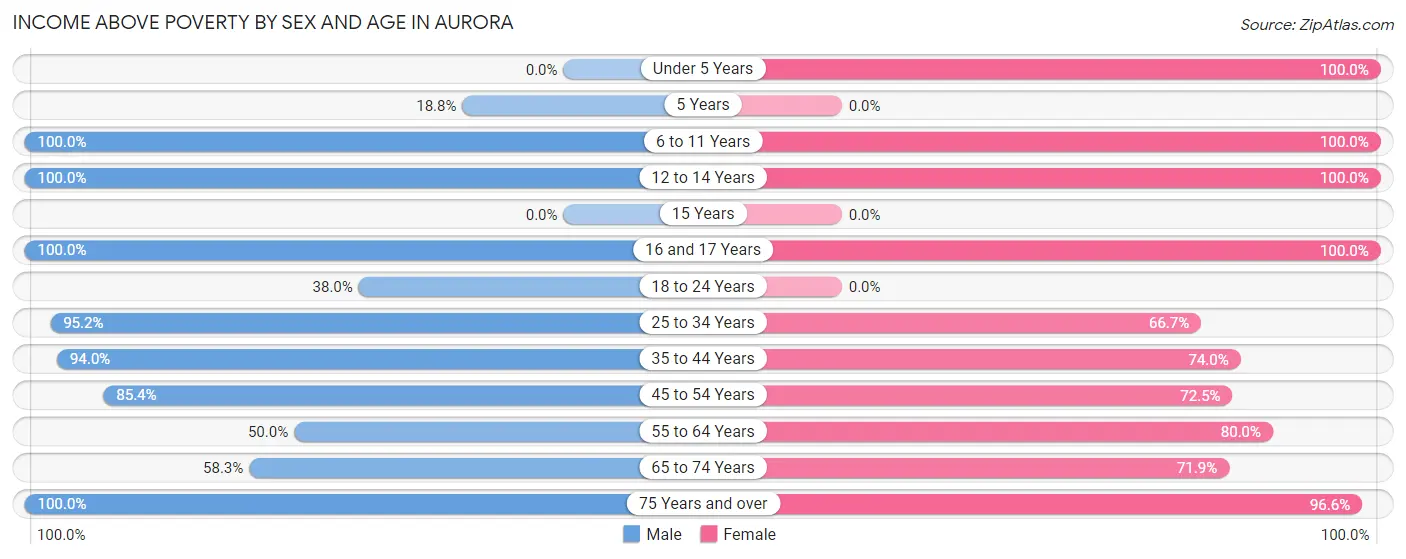
| Age Bracket | Male | Female |
| Under 5 Years | 0 (0.0%) | 22 (100.0%) |
| 5 Years | 3 (18.8%) | 0 (0.0%) |
| 6 to 11 Years | 28 (100.0%) | 2 (100.0%) |
| 12 to 14 Years | 20 (100.0%) | 2 (100.0%) |
| 15 Years | 0 (0.0%) | 0 (0.0%) |
| 16 and 17 Years | 8 (100.0%) | 18 (100.0%) |
| 18 to 24 Years | 19 (38.0%) | 0 (0.0%) |
| 25 to 34 Years | 20 (95.2%) | 18 (66.7%) |
| 35 to 44 Years | 47 (94.0%) | 37 (74.0%) |
| 45 to 54 Years | 35 (85.4%) | 29 (72.5%) |
| 55 to 64 Years | 9 (50.0%) | 20 (80.0%) |
| 65 to 74 Years | 7 (58.3%) | 23 (71.9%) |
| 75 Years and over | 5 (100.0%) | 28 (96.6%) |
| Total | 201 (74.2%) | 199 (80.6%) |
Income Below Poverty Among Married-Couple Families in Aurora
The poverty statistics for married-couple families in Aurora show that 14.3% or 8 of the total 56 families live below the poverty line. Families with 1 or 2 children have the highest poverty rate of 18.9%, comprising of 7 families. On the other hand, families with no children have the lowest poverty rate of 5.3%, which includes 1 families.
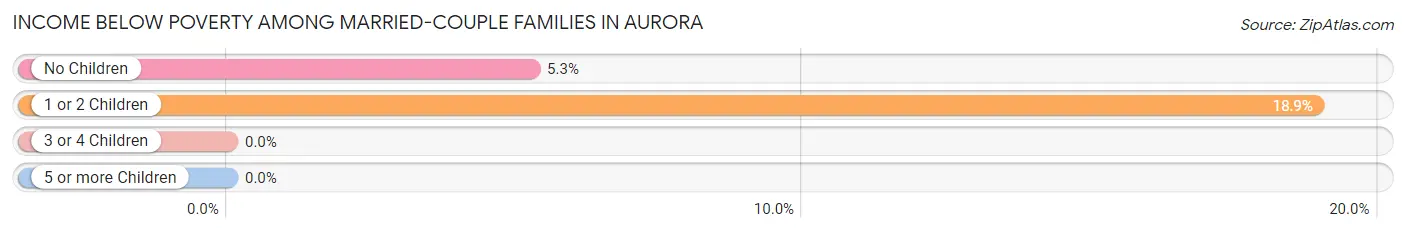
| Children | Above Poverty | Below Poverty |
| No Children | 18 (94.7%) | 1 (5.3%) |
| 1 or 2 Children | 30 (81.1%) | 7 (18.9%) |
| 3 or 4 Children | 0 (0.0%) | 0 (0.0%) |
| 5 or more Children | 0 (0.0%) | 0 (0.0%) |
| Total | 48 (85.7%) | 8 (14.3%) |
Income Below Poverty Among Single-Parent Households in Aurora
According to the poverty data in Aurora, 7.1% or 1 single-father households and 35.2% or 19 single-mother households are living below the poverty line. Among single-father households, those with no children have the highest poverty rate, with 1 households (8.3%) experiencing poverty. Likewise, among single-mother households, those with no children have the highest poverty rate, with 19 households (43.2%) falling below the poverty line.
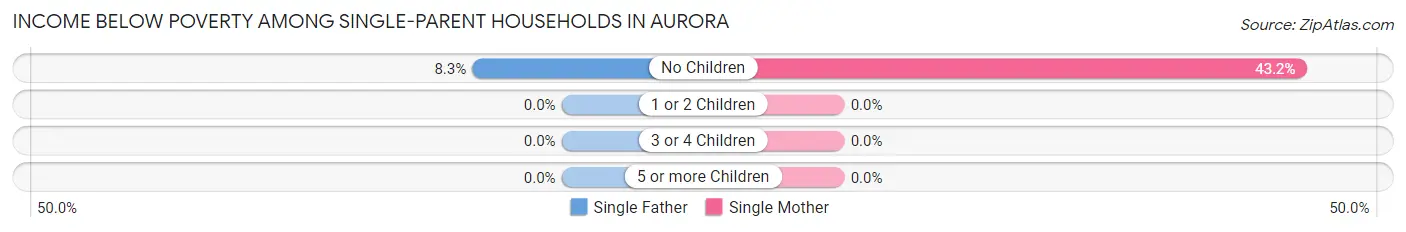
| Children | Single Father | Single Mother |
| No Children | 1 (8.3%) | 19 (43.2%) |
| 1 or 2 Children | 0 (0.0%) | 0 (0.0%) |
| 3 or 4 Children | 0 (0.0%) | 0 (0.0%) |
| 5 or more Children | 0 (0.0%) | 0 (0.0%) |
| Total | 1 (7.1%) | 19 (35.2%) |
Income Below Poverty Among Married-Couple vs Single-Parent Households in Aurora
The poverty data for Aurora shows that 8 of the married-couple family households (14.3%) and 20 of the single-parent households (29.4%) are living below the poverty level. Within the married-couple family households, those with 1 or 2 children have the highest poverty rate, with 7 households (18.9%) falling below the poverty line. Among the single-parent households, those with no children have the highest poverty rate, with 20 household (35.7%) living below poverty.
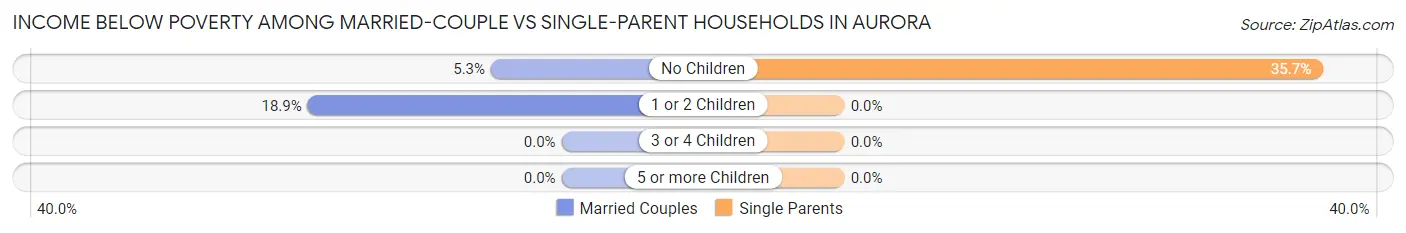
| Children | Married-Couple Families | Single-Parent Households |
| No Children | 1 (5.3%) | 20 (35.7%) |
| 1 or 2 Children | 7 (18.9%) | 0 (0.0%) |
| 3 or 4 Children | 0 (0.0%) | 0 (0.0%) |
| 5 or more Children | 0 (0.0%) | 0 (0.0%) |
| Total | 8 (14.3%) | 20 (29.4%) |
Race in Aurora
The most populous races in Aurora are White / Caucasian (247 | 47.3%), Black / African American (233 | 44.6%), and Two or more Races (42 | 8.1%).
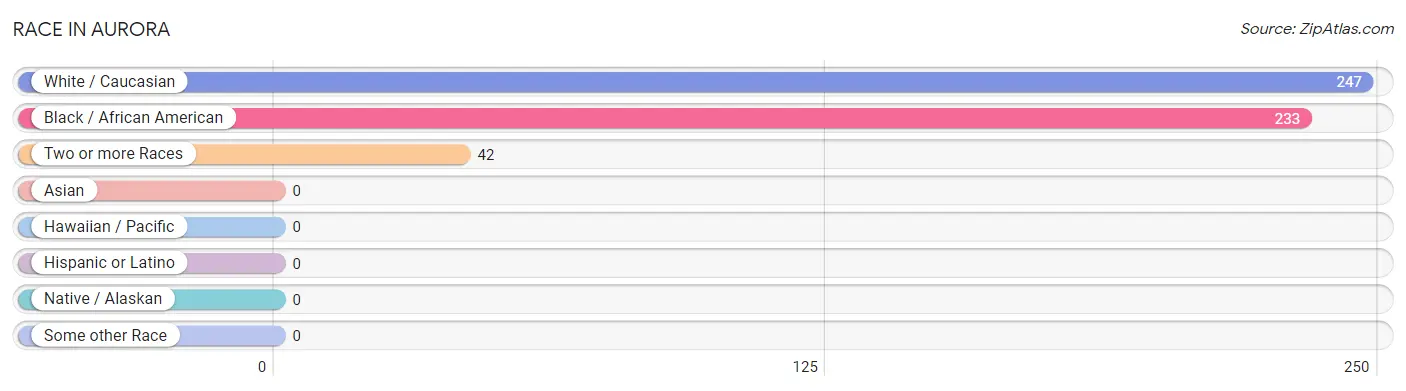
| Race | # Population | % Population |
| Asian | 0 | 0.0% |
| Black / African American | 233 | 44.6% |
| Hawaiian / Pacific | 0 | 0.0% |
| Hispanic or Latino | 0 | 0.0% |
| Native / Alaskan | 0 | 0.0% |
| White / Caucasian | 247 | 47.3% |
| Two or more Races | 42 | 8.1% |
| Some other Race | 0 | 0.0% |
| Total | 522 | 100.0% |
Ancestry in Aurora
The most populous ancestries reported in Aurora are American (92 | 17.6%), Norwegian (28 | 5.4%), Italian (14 | 2.7%), German (12 | 2.3%), and English (11 | 2.1%), together accounting for 30.1% of all Aurora residents.
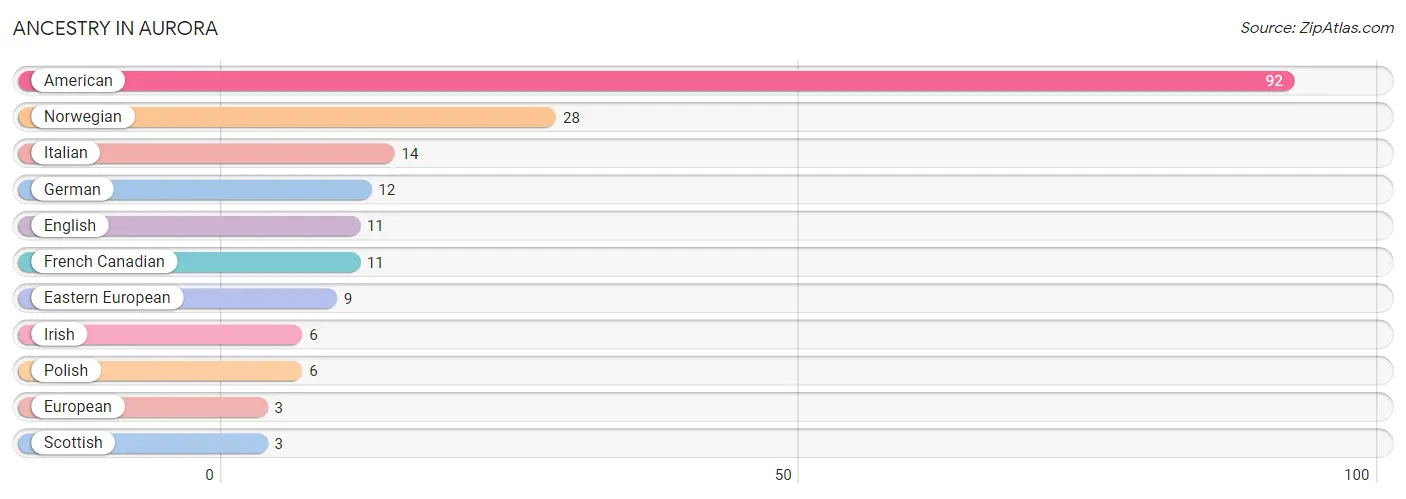
| Ancestry | # Population | % Population |
| American | 92 | 17.6% |
| Eastern European | 9 | 1.7% |
| English | 11 | 2.1% |
| European | 3 | 0.6% |
| French Canadian | 11 | 2.1% |
| German | 12 | 2.3% |
| Irish | 6 | 1.1% |
| Italian | 14 | 2.7% |
| Norwegian | 28 | 5.4% |
| Polish | 6 | 1.1% |
| Scottish | 3 | 0.6% | View All 11 Rows |
Immigrants in Aurora

| Immigration Origin | # Population | % Population | View All 0 Rows |
Sex and Age in Aurora
Sex and Age in Aurora
The most populous age groups in Aurora are 20 to 24 Years (50 | 18.4%) for men and 40 to 44 Years (32 | 12.8%) for women.
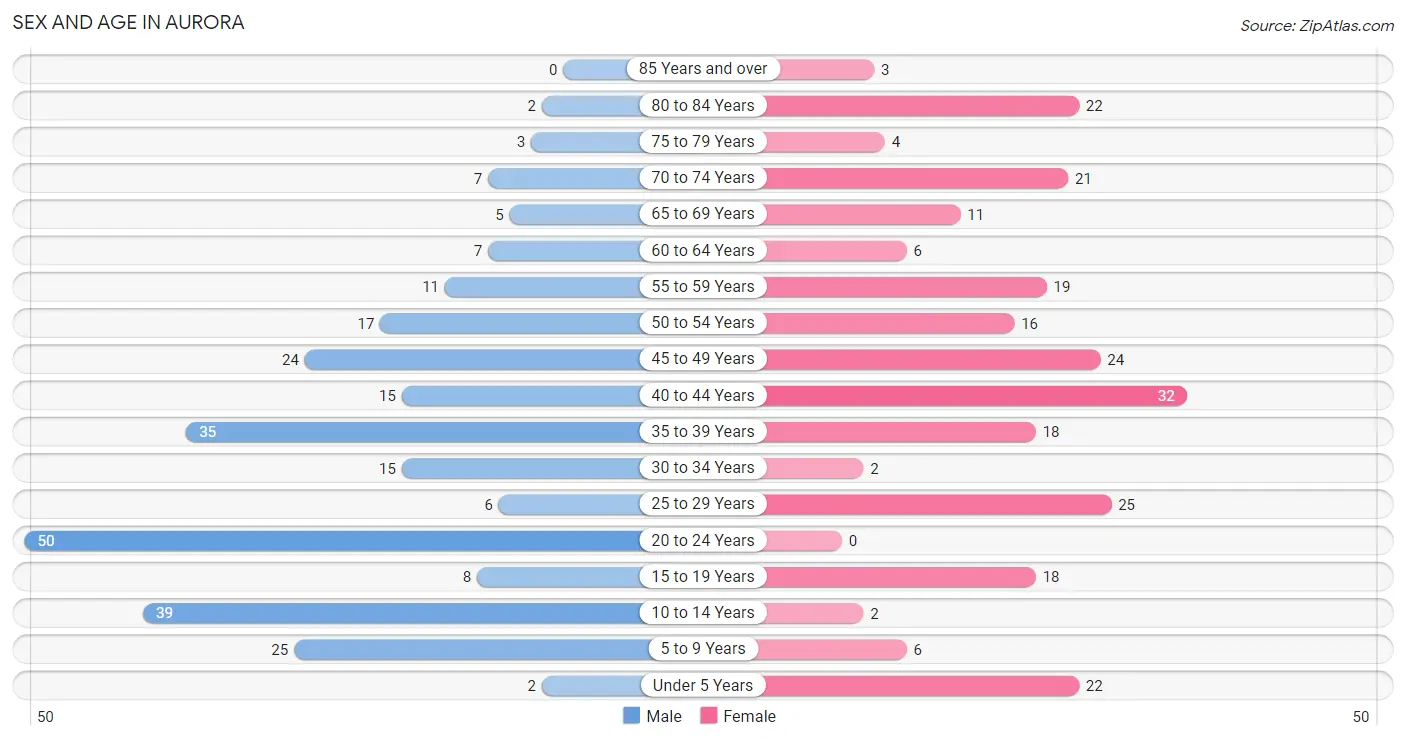
| Age Bracket | Male | Female |
| Under 5 Years | 2 (0.7%) | 22 (8.8%) |
| 5 to 9 Years | 25 (9.2%) | 6 (2.4%) |
| 10 to 14 Years | 39 (14.4%) | 2 (0.8%) |
| 15 to 19 Years | 8 (2.9%) | 18 (7.2%) |
| 20 to 24 Years | 50 (18.4%) | 0 (0.0%) |
| 25 to 29 Years | 6 (2.2%) | 25 (10.0%) |
| 30 to 34 Years | 15 (5.5%) | 2 (0.8%) |
| 35 to 39 Years | 35 (12.9%) | 18 (7.2%) |
| 40 to 44 Years | 15 (5.5%) | 32 (12.8%) |
| 45 to 49 Years | 24 (8.9%) | 24 (9.6%) |
| 50 to 54 Years | 17 (6.3%) | 16 (6.4%) |
| 55 to 59 Years | 11 (4.1%) | 19 (7.6%) |
| 60 to 64 Years | 7 (2.6%) | 6 (2.4%) |
| 65 to 69 Years | 5 (1.8%) | 11 (4.4%) |
| 70 to 74 Years | 7 (2.6%) | 21 (8.4%) |
| 75 to 79 Years | 3 (1.1%) | 4 (1.6%) |
| 80 to 84 Years | 2 (0.7%) | 22 (8.8%) |
| 85 Years and over | 0 (0.0%) | 3 (1.2%) |
| Total | 271 (100.0%) | 251 (100.0%) |
Families and Households in Aurora
Median Family Size in Aurora
The median family size in Aurora is 3.53 persons per family, with married-couple families (56 | 45.2%) accounting for the largest median family size of 4.18 persons per family. On the other hand, single male/father families (14 | 11.3%) represent the smallest median family size with 2.50 persons per family.
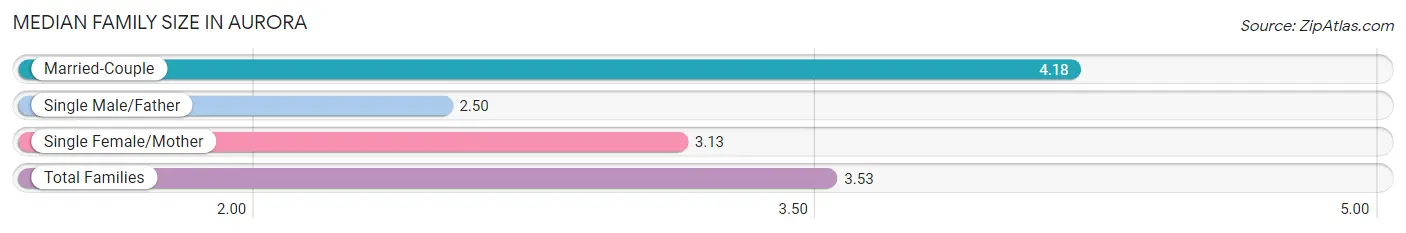
| Family Type | # Families | Family Size |
| Married-Couple | 56 (45.2%) | 4.18 |
| Single Male/Father | 14 (11.3%) | 2.50 |
| Single Female/Mother | 54 (43.5%) | 3.13 |
| Total Families | 124 (100.0%) | 3.53 |
Median Household Size in Aurora
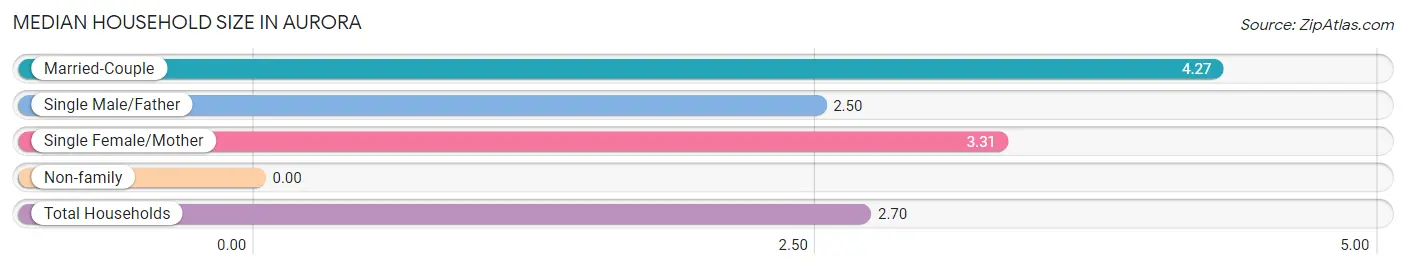
| Household Type | # Households | Household Size |
| Married-Couple | 56 (29.0%) | 4.27 |
| Single Male/Father | 14 (7.2%) | 2.50 |
| Single Female/Mother | 54 (28.0%) | 3.31 |
| Non-family | 69 (35.7%) | - |
| Total Households | 193 (100.0%) | 2.70 |
Household Size by Marriage Status in Aurora
Out of a total of 193 households in Aurora, 124 (64.2%) are family households, while 69 (35.7%) are nonfamily households. The most numerous type of family households are 2-person households, comprising 61, and the most common type of nonfamily households are 1-person households, comprising 69.
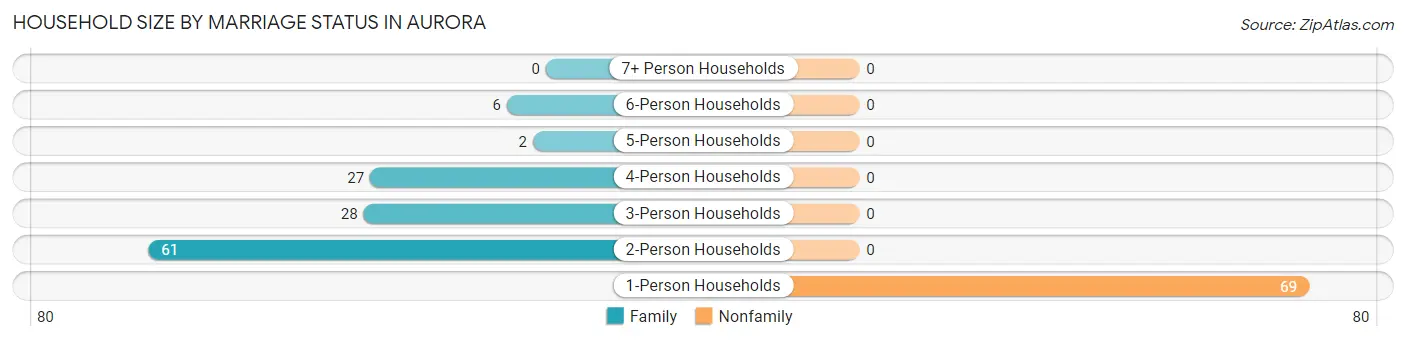
| Household Size | Family Households | Nonfamily Households |
| 1-Person Households | - | 69 (35.7%) |
| 2-Person Households | 61 (31.6%) | 0 (0.0%) |
| 3-Person Households | 28 (14.5%) | 0 (0.0%) |
| 4-Person Households | 27 (14.0%) | 0 (0.0%) |
| 5-Person Households | 2 (1.0%) | 0 (0.0%) |
| 6-Person Households | 6 (3.1%) | 0 (0.0%) |
| 7+ Person Households | 0 (0.0%) | 0 (0.0%) |
| Total | 124 (64.2%) | 69 (35.7%) |
Female Fertility in Aurora
Fertility by Age in Aurora
| Age Bracket | Women with Births | Births / 1,000 Women |
| 15 to 19 years | 0 (0.0%) | 0.0 |
| 20 to 34 years | 0 (0.0%) | 0.0 |
| 35 to 50 years | 0 (0.0%) | 0.0 |
| Total | 0 (0.0%) | 0.0 |
Fertility by Age by Marriage Status in Aurora
| Age Bracket | Married | Unmarried |
| 15 to 19 years | 0 (0.0%) | 0 (0.0%) |
| 20 to 34 years | 0 (0.0%) | 0 (0.0%) |
| 35 to 50 years | 0 (0.0%) | 0 (0.0%) |
| Total | 0 (0.0%) | 0 (0.0%) |
Fertility by Education in Aurora
| Educational Attainment | Women with Births | Births / 1,000 Women |
| Less than High School | 0 (0.0%) | 0.0 |
| High School Diploma | 0 (0.0%) | 0.0 |
| College or Associate's Degree | 0 (0.0%) | 0.0 |
| Bachelor's Degree | 0 (0.0%) | 0.0 |
| Graduate Degree | 0 (0.0%) | 0.0 |
| Total | 0 (0.0%) | 0.0 |
Fertility by Education by Marriage Status in Aurora
| Educational Attainment | Married | Unmarried |
| Less than High School | 0 (0.0%) | 0 (0.0%) |
| High School Diploma | 0 (0.0%) | 0 (0.0%) |
| College or Associate's Degree | 0 (0.0%) | 0 (0.0%) |
| Bachelor's Degree | 0 (0.0%) | 0 (0.0%) |
| Graduate Degree | 0 (0.0%) | 0 (0.0%) |
| Total | 0 (0.0%) | 0 (0.0%) |
Employment Characteristics in Aurora
Employment by Class of Employer in Aurora
Among the 205 employed individuals in Aurora, private company employees (168 | 82.0%), not-for-profit organizations (10 | 4.9%), and local government employees (9 | 4.4%) make up the most common classes of employment.
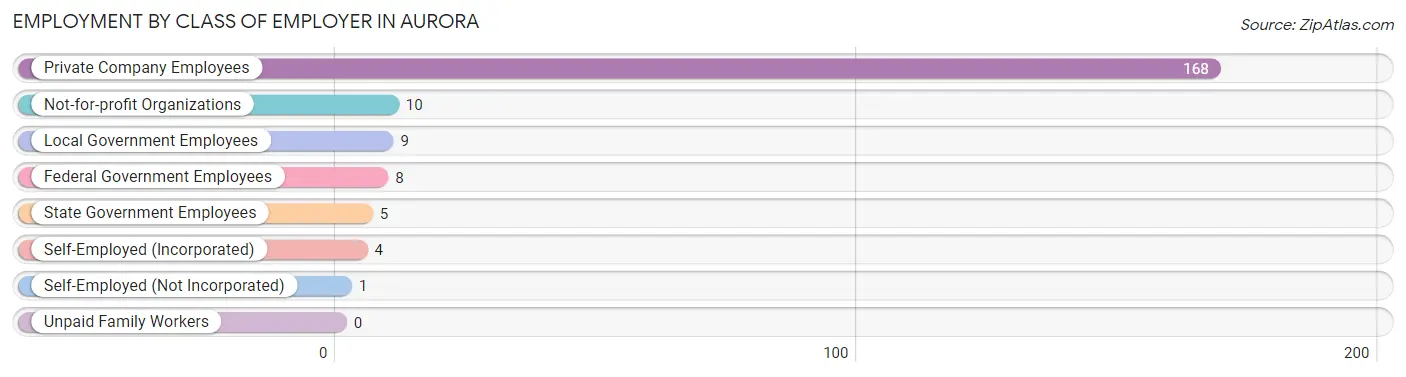
| Employer Class | # Employees | % Employees |
| Private Company Employees | 168 | 82.0% |
| Self-Employed (Incorporated) | 4 | 1.9% |
| Self-Employed (Not Incorporated) | 1 | 0.5% |
| Not-for-profit Organizations | 10 | 4.9% |
| Local Government Employees | 9 | 4.4% |
| State Government Employees | 5 | 2.4% |
| Federal Government Employees | 8 | 3.9% |
| Unpaid Family Workers | 0 | 0.0% |
| Total | 205 | 100.0% |
Employment Status by Age in Aurora
According to the labor force statistics for Aurora, out of the total population over 16 years of age (426), 58.9% or 251 individuals are in the labor force, with 18.3% or 46 of them unemployed. The age group with the highest labor force participation rate is 25 to 29 years, with 96.8% or 30 individuals in the labor force. Within the labor force, the 30 to 34 years age range has the highest percentage of unemployed individuals, with 87.5% or 14 of them being unemployed.
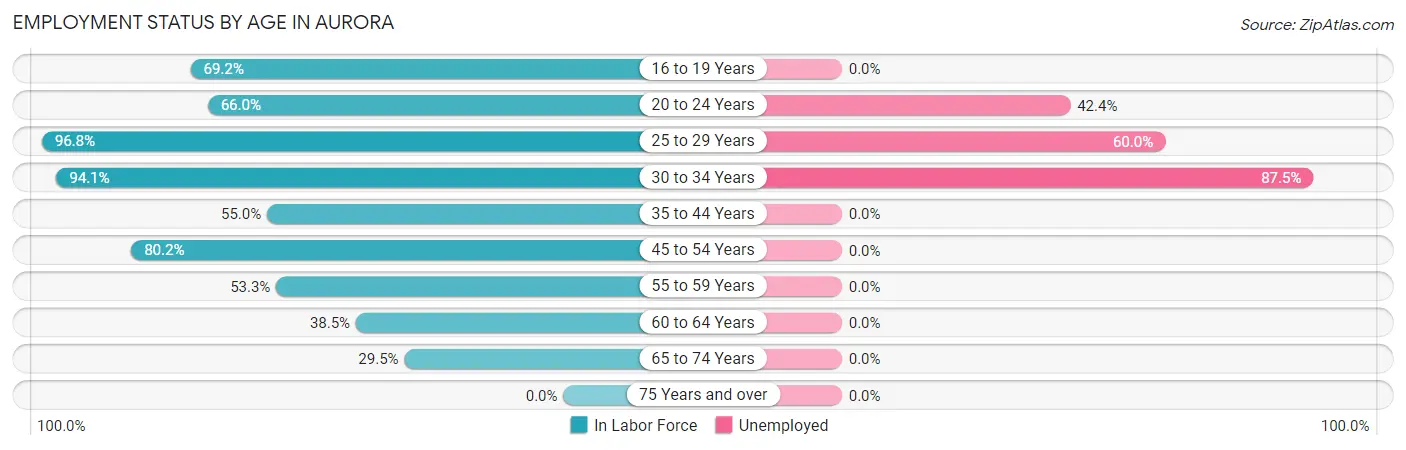
| Age Bracket | In Labor Force | Unemployed |
| 16 to 19 Years | 18 (69.2%) | 0 (0.0%) |
| 20 to 24 Years | 33 (66.0%) | 14 (42.4%) |
| 25 to 29 Years | 30 (96.8%) | 18 (60.0%) |
| 30 to 34 Years | 16 (94.1%) | 14 (87.5%) |
| 35 to 44 Years | 55 (55.0%) | 0 (0.0%) |
| 45 to 54 Years | 65 (80.2%) | 0 (0.0%) |
| 55 to 59 Years | 16 (53.3%) | 0 (0.0%) |
| 60 to 64 Years | 5 (38.5%) | 0 (0.0%) |
| 65 to 74 Years | 13 (29.5%) | 0 (0.0%) |
| 75 Years and over | 0 (0.0%) | 0 (0.0%) |
| Total | 251 (58.9%) | 46 (18.3%) |
Employment Status by Educational Attainment in Aurora
According to labor force statistics for Aurora, 68.8% of individuals (187) out of the total population between 25 and 64 years of age (272) are in the labor force, with 17.1% or 32 of them being unemployed. The group with the highest labor force participation rate are those with the educational attainment of bachelor's degree or higher, with 100.0% or 29 individuals in the labor force. Within the labor force, individuals with high school diploma education have the highest percentage of unemployment, with 29.4% or 32 of them being unemployed.
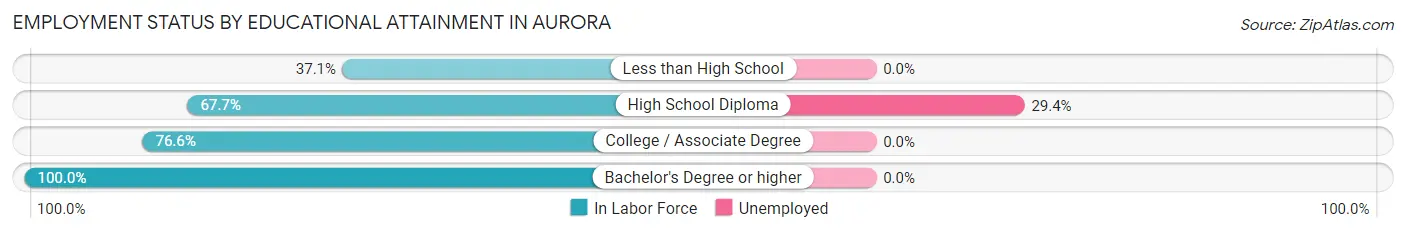
| Educational Attainment | In Labor Force | Unemployed |
| Less than High School | 13 (37.1%) | 0 (0.0%) |
| High School Diploma | 109 (67.7%) | 47 (29.4%) |
| College / Associate Degree | 36 (76.6%) | 0 (0.0%) |
| Bachelor's Degree or higher | 29 (100.0%) | 0 (0.0%) |
| Total | 187 (68.8%) | 47 (17.1%) |
Employment Occupations by Sex in Aurora
Management, Business, Science and Arts Occupations
The most common Management, Business, Science and Arts occupations in Aurora are Community & Social Service (20 | 9.8%), Education Instruction & Library (18 | 8.8%), Business & Financial (12 | 5.9%), Management (5 | 2.4%), and Computers, Engineering & Science (3 | 1.5%).
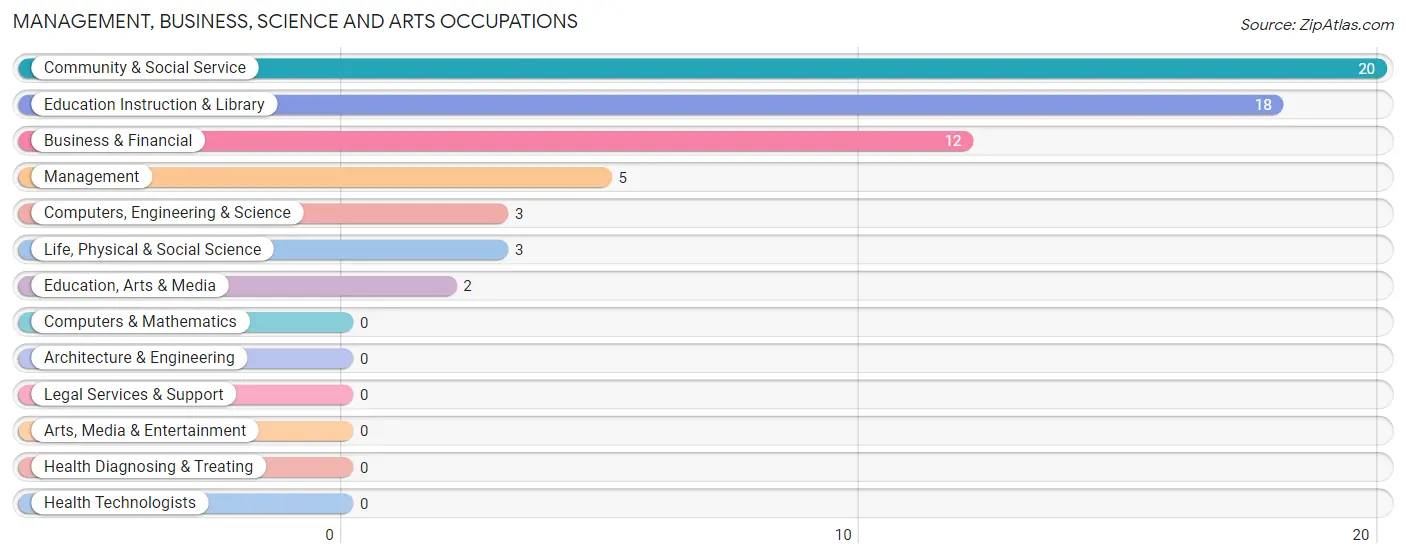
Management, Business, Science and Arts Occupations by Sex
Within the Management, Business, Science and Arts occupations in Aurora, the most male-oriented occupations are Business & Financial (100.0%), and Management (40.0%), while the most female-oriented occupations are Computers, Engineering & Science (100.0%), Life, Physical & Social Science (100.0%), and Community & Social Service (100.0%).
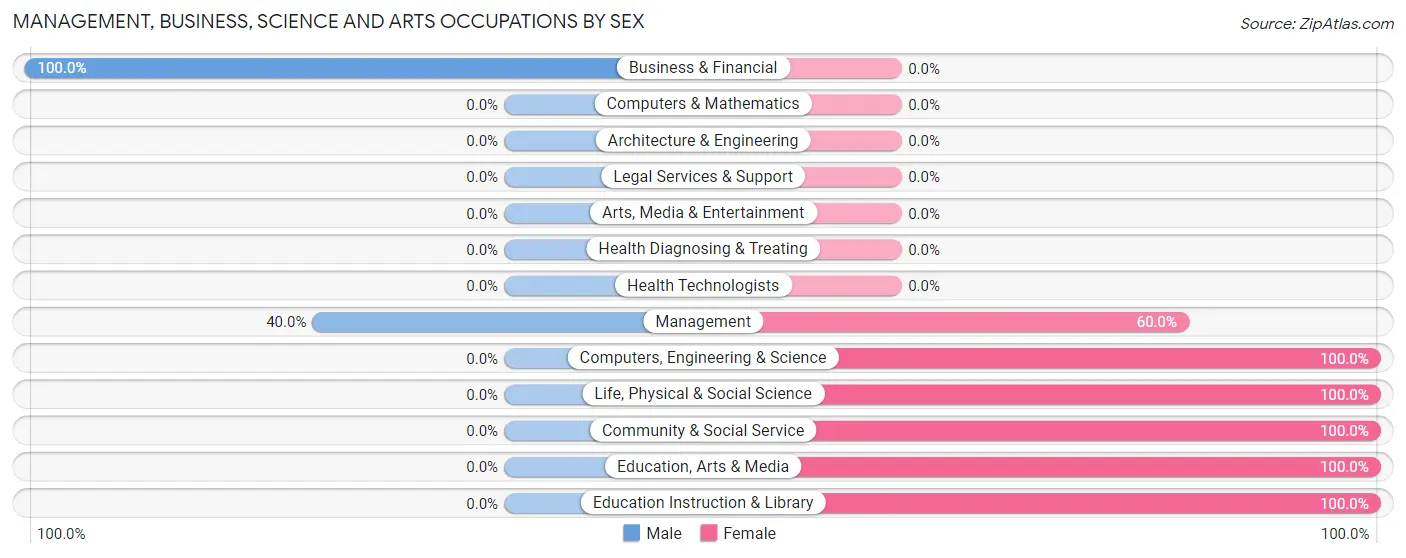
| Occupation | Male | Female |
| Management | 2 (40.0%) | 3 (60.0%) |
| Business & Financial | 12 (100.0%) | 0 (0.0%) |
| Computers, Engineering & Science | 0 (0.0%) | 3 (100.0%) |
| Computers & Mathematics | 0 (0.0%) | 0 (0.0%) |
| Architecture & Engineering | 0 (0.0%) | 0 (0.0%) |
| Life, Physical & Social Science | 0 (0.0%) | 3 (100.0%) |
| Community & Social Service | 0 (0.0%) | 20 (100.0%) |
| Education, Arts & Media | 0 (0.0%) | 2 (100.0%) |
| Legal Services & Support | 0 (0.0%) | 0 (0.0%) |
| Education Instruction & Library | 0 (0.0%) | 18 (100.0%) |
| Arts, Media & Entertainment | 0 (0.0%) | 0 (0.0%) |
| Health Diagnosing & Treating | 0 (0.0%) | 0 (0.0%) |
| Health Technologists | 0 (0.0%) | 0 (0.0%) |
| Total (Category) | 14 (35.0%) | 26 (65.0%) |
| Total (Overall) | 103 (50.2%) | 102 (49.8%) |
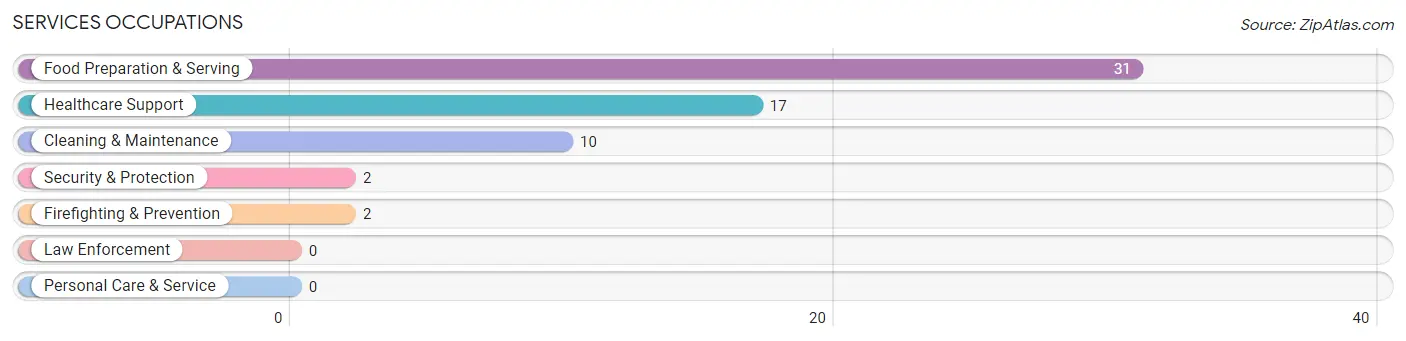
Services Occupations
The most common Services occupations in Aurora are Food Preparation & Serving (31 | 15.1%), Healthcare Support (17 | 8.3%), Cleaning & Maintenance (10 | 4.9%), Security & Protection (2 | 1.0%), and Firefighting & Prevention (2 | 1.0%).
Services Occupations by Sex
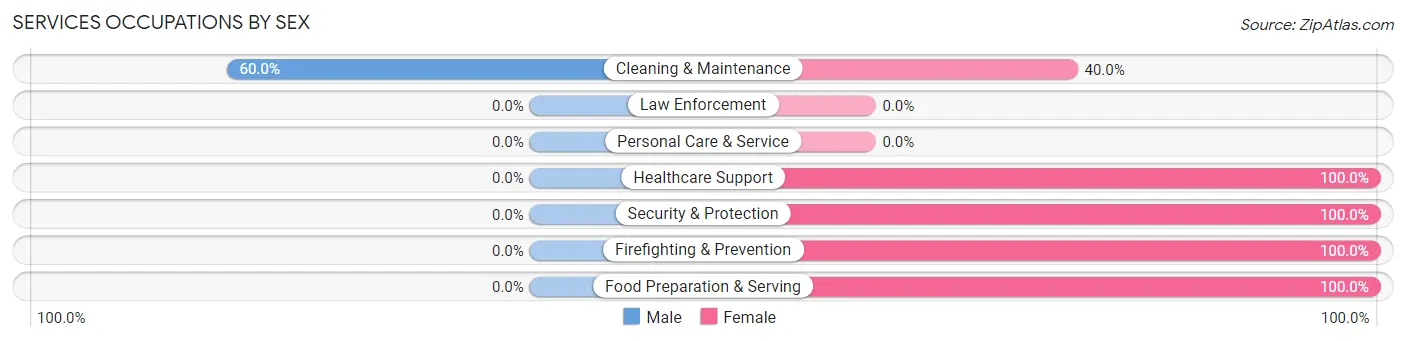
| Occupation | Male | Female |
| Healthcare Support | 0 (0.0%) | 17 (100.0%) |
| Security & Protection | 0 (0.0%) | 2 (100.0%) |
| Firefighting & Prevention | 0 (0.0%) | 2 (100.0%) |
| Law Enforcement | 0 (0.0%) | 0 (0.0%) |
| Food Preparation & Serving | 0 (0.0%) | 31 (100.0%) |
| Cleaning & Maintenance | 6 (60.0%) | 4 (40.0%) |
| Personal Care & Service | 0 (0.0%) | 0 (0.0%) |
| Total (Category) | 6 (10.0%) | 54 (90.0%) |
| Total (Overall) | 103 (50.2%) | 102 (49.8%) |
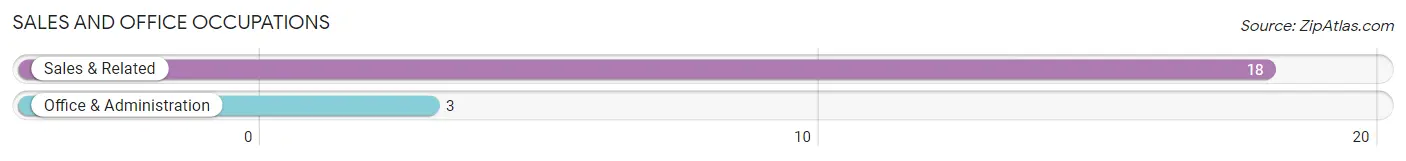
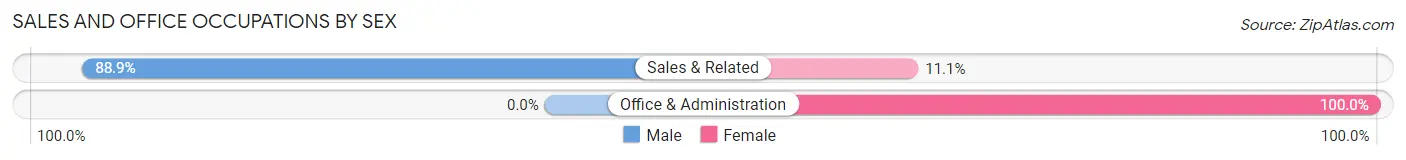
Sales and Office Occupations
The most common Sales and Office occupations in Aurora are Sales & Related (18 | 8.8%), and Office & Administration (3 | 1.5%).
Sales and Office Occupations by Sex
| Occupation | Male | Female |
| Sales & Related | 16 (88.9%) | 2 (11.1%) |
| Office & Administration | 0 (0.0%) | 3 (100.0%) |
| Total (Category) | 16 (76.2%) | 5 (23.8%) |
| Total (Overall) | 103 (50.2%) | 102 (49.8%) |
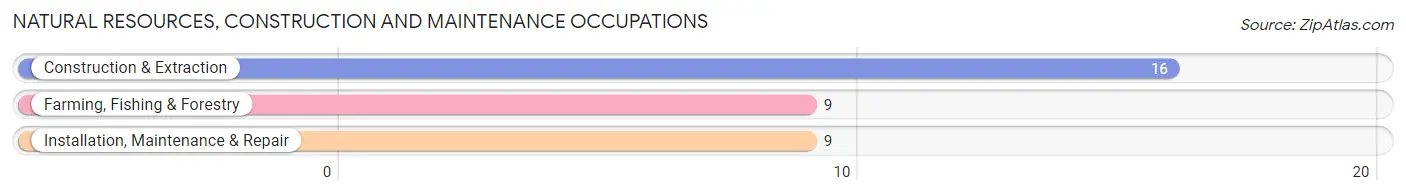
Natural Resources, Construction and Maintenance Occupations
The most common Natural Resources, Construction and Maintenance occupations in Aurora are Construction & Extraction (16 | 7.8%), Farming, Fishing & Forestry (9 | 4.4%), and Installation, Maintenance & Repair (9 | 4.4%).
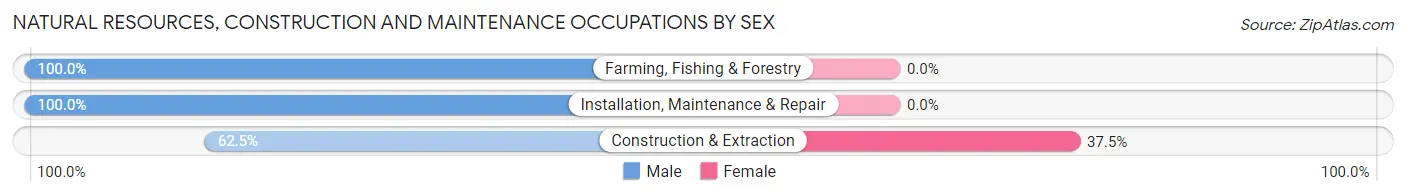
Natural Resources, Construction and Maintenance Occupations by Sex
| Occupation | Male | Female |
| Farming, Fishing & Forestry | 9 (100.0%) | 0 (0.0%) |
| Construction & Extraction | 10 (62.5%) | 6 (37.5%) |
| Installation, Maintenance & Repair | 9 (100.0%) | 0 (0.0%) |
| Total (Category) | 28 (82.4%) | 6 (17.6%) |
| Total (Overall) | 103 (50.2%) | 102 (49.8%) |
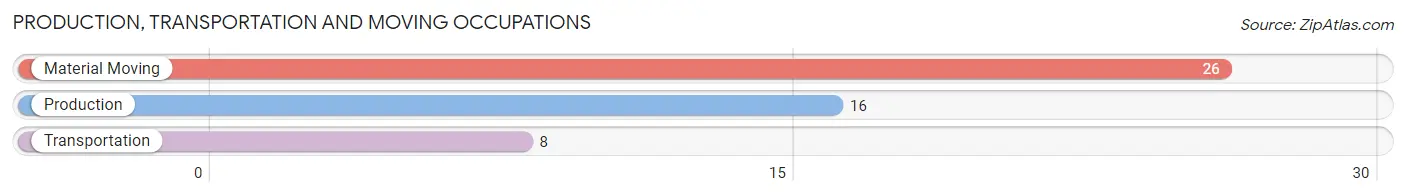
Production, Transportation and Moving Occupations
The most common Production, Transportation and Moving occupations in Aurora are Material Moving (26 | 12.7%), Production (16 | 7.8%), and Transportation (8 | 3.9%).
Production, Transportation and Moving Occupations by Sex
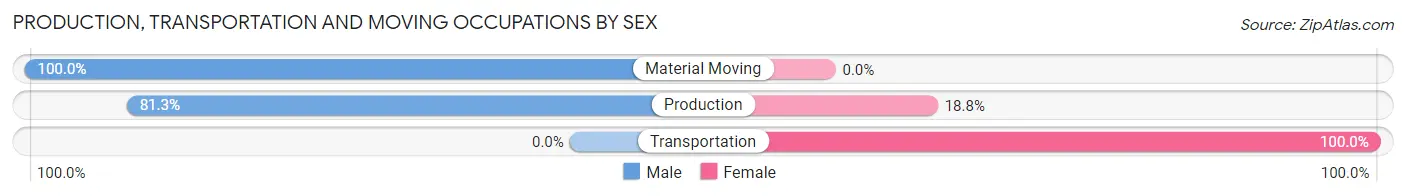
| Occupation | Male | Female |
| Production | 13 (81.2%) | 3 (18.8%) |
| Transportation | 0 (0.0%) | 8 (100.0%) |
| Material Moving | 26 (100.0%) | 0 (0.0%) |
| Total (Category) | 39 (78.0%) | 11 (22.0%) |
| Total (Overall) | 103 (50.2%) | 102 (49.8%) |
Employment Industries by Sex in Aurora
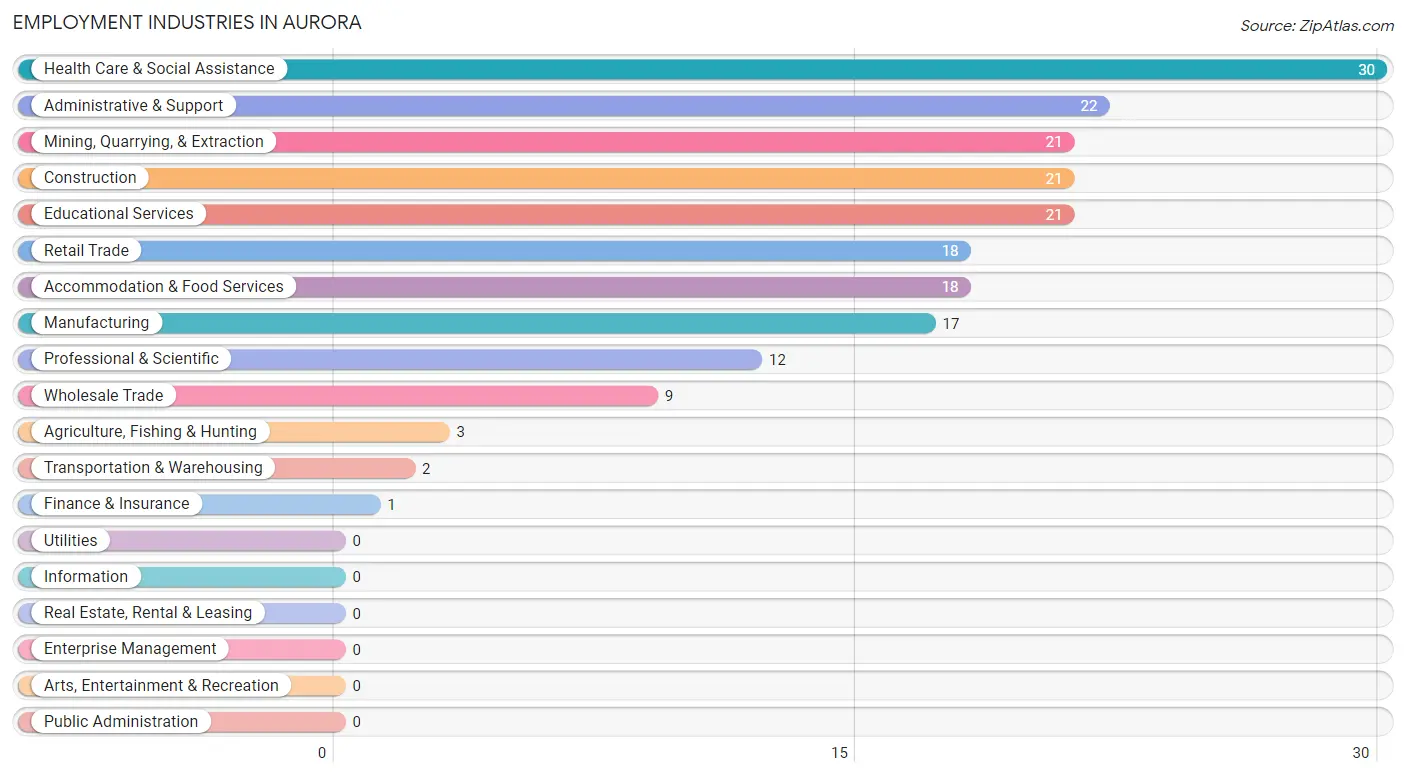
Employment Industries in Aurora
The major employment industries in Aurora include Health Care & Social Assistance (30 | 14.6%), Administrative & Support (22 | 10.7%), Mining, Quarrying, & Extraction (21 | 10.2%), Construction (21 | 10.2%), and Educational Services (21 | 10.2%).
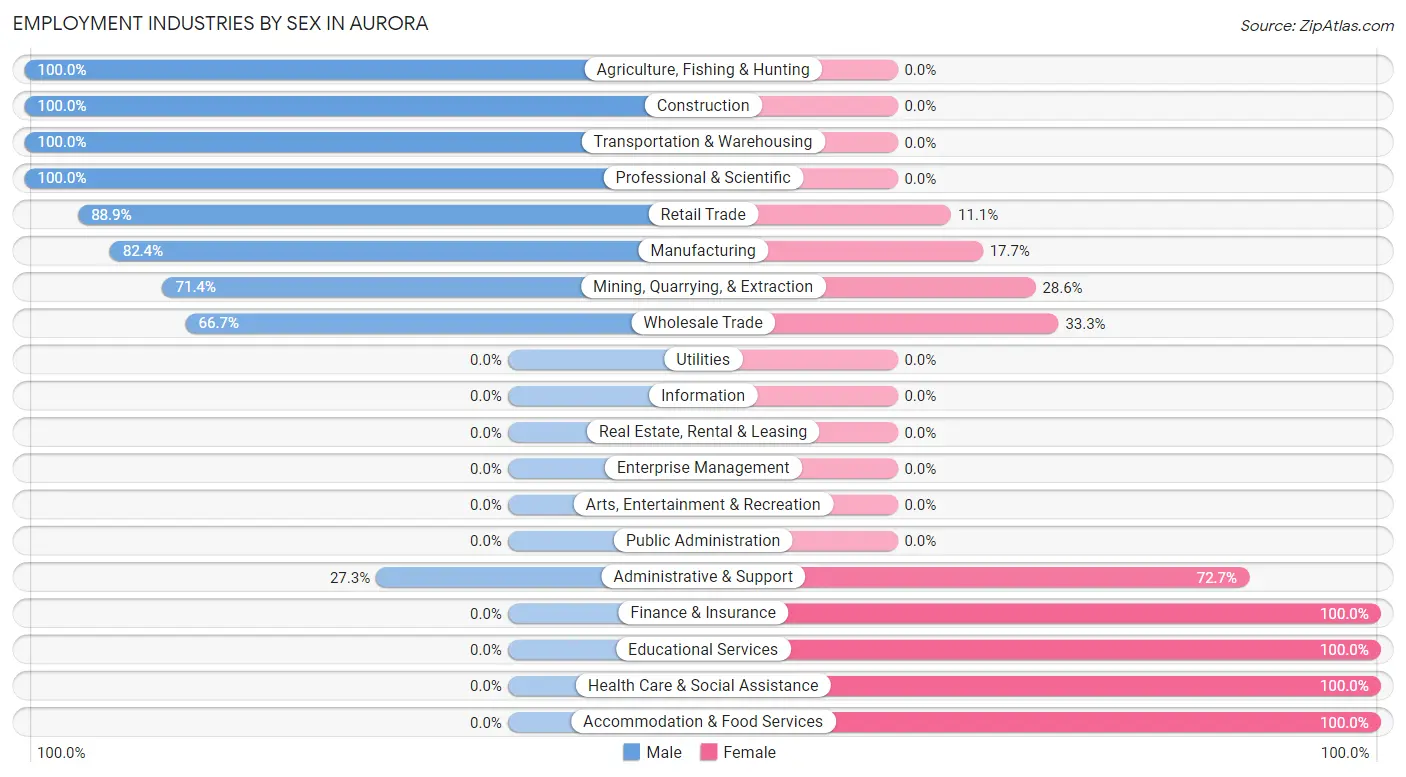
Employment Industries by Sex in Aurora
The Aurora industries that see more men than women are Agriculture, Fishing & Hunting (100.0%), Construction (100.0%), and Transportation & Warehousing (100.0%), whereas the industries that tend to have a higher number of women are Finance & Insurance (100.0%), Educational Services (100.0%), and Health Care & Social Assistance (100.0%).
| Industry | Male | Female |
| Agriculture, Fishing & Hunting | 3 (100.0%) | 0 (0.0%) |
| Mining, Quarrying, & Extraction | 15 (71.4%) | 6 (28.6%) |
| Construction | 21 (100.0%) | 0 (0.0%) |
| Manufacturing | 14 (82.4%) | 3 (17.6%) |
| Wholesale Trade | 6 (66.7%) | 3 (33.3%) |
| Retail Trade | 16 (88.9%) | 2 (11.1%) |
| Transportation & Warehousing | 2 (100.0%) | 0 (0.0%) |
| Utilities | 0 (0.0%) | 0 (0.0%) |
| Information | 0 (0.0%) | 0 (0.0%) |
| Finance & Insurance | 0 (0.0%) | 1 (100.0%) |
| Real Estate, Rental & Leasing | 0 (0.0%) | 0 (0.0%) |
| Professional & Scientific | 12 (100.0%) | 0 (0.0%) |
| Enterprise Management | 0 (0.0%) | 0 (0.0%) |
| Administrative & Support | 6 (27.3%) | 16 (72.7%) |
| Educational Services | 0 (0.0%) | 21 (100.0%) |
| Health Care & Social Assistance | 0 (0.0%) | 30 (100.0%) |
| Arts, Entertainment & Recreation | 0 (0.0%) | 0 (0.0%) |
| Accommodation & Food Services | 0 (0.0%) | 18 (100.0%) |
| Public Administration | 0 (0.0%) | 0 (0.0%) |
| Total | 103 (50.2%) | 102 (49.8%) |
Education in Aurora
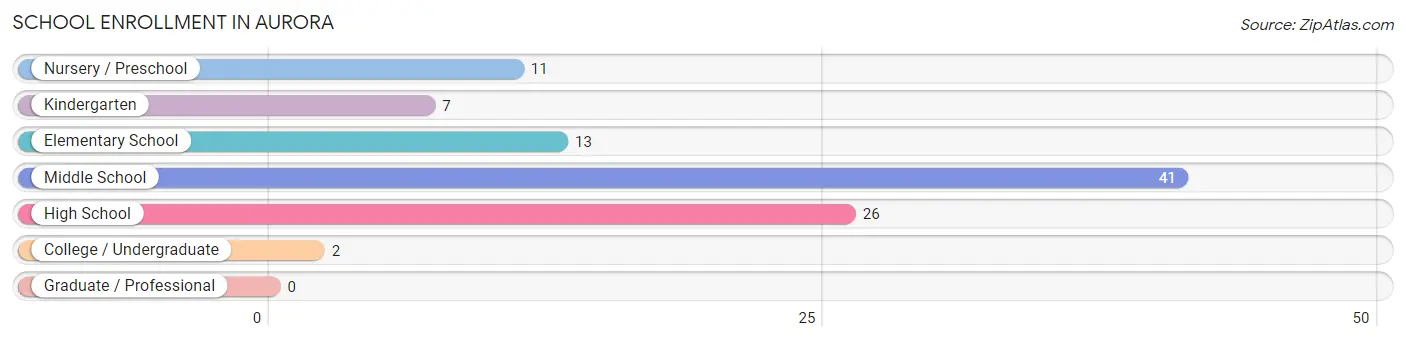
School Enrollment in Aurora
The most common levels of schooling among the 100 students in Aurora are middle school (41 | 41.0%), high school (26 | 26.0%), and elementary school (13 | 13.0%).
| School Level | # Students | % Students |
| Nursery / Preschool | 11 | 11.0% |
| Kindergarten | 7 | 7.0% |
| Elementary School | 13 | 13.0% |
| Middle School | 41 | 41.0% |
| High School | 26 | 26.0% |
| College / Undergraduate | 2 | 2.0% |
| Graduate / Professional | 0 | 0.0% |
| Total | 100 | 100.0% |
School Enrollment by Age by Funding Source in Aurora
Out of a total of 100 students who are enrolled in schools in Aurora, 5 (5.0%) attend a private institution, while the remaining 95 (95.0%) are enrolled in public schools. The age group of 10 to 14 year olds has the highest likelihood of being enrolled in private schools, with 3 (7.3% in the age bracket) enrolled. Conversely, the age group of 15 to 17 year olds has the lowest likelihood of being enrolled in a private school, with 26 (100.0% in the age bracket) attending a public institution.
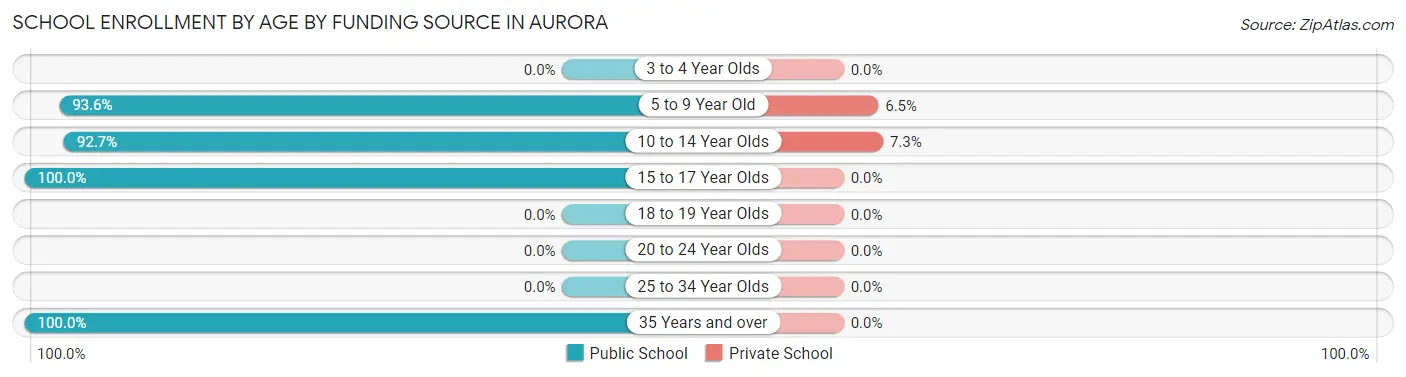
| Age Bracket | Public School | Private School |
| 3 to 4 Year Olds | 0 (0.0%) | 0 (0.0%) |
| 5 to 9 Year Old | 29 (93.5%) | 2 (6.5%) |
| 10 to 14 Year Olds | 38 (92.7%) | 3 (7.3%) |
| 15 to 17 Year Olds | 26 (100.0%) | 0 (0.0%) |
| 18 to 19 Year Olds | 0 (0.0%) | 0 (0.0%) |
| 20 to 24 Year Olds | 0 (0.0%) | 0 (0.0%) |
| 25 to 34 Year Olds | 0 (0.0%) | 0 (0.0%) |
| 35 Years and over | 2 (100.0%) | 0 (0.0%) |
| Total | 95 (95.0%) | 5 (5.0%) |
Educational Attainment by Field of Study in Aurora
Business (17 | 48.6%), education (13 | 37.1%), science & technology (2 | 5.7%), computers & mathematics (1 | 2.9%), and physical & health sciences (1 | 2.9%) are the most common fields of study among 35 individuals in Aurora who have obtained a bachelor's degree or higher.
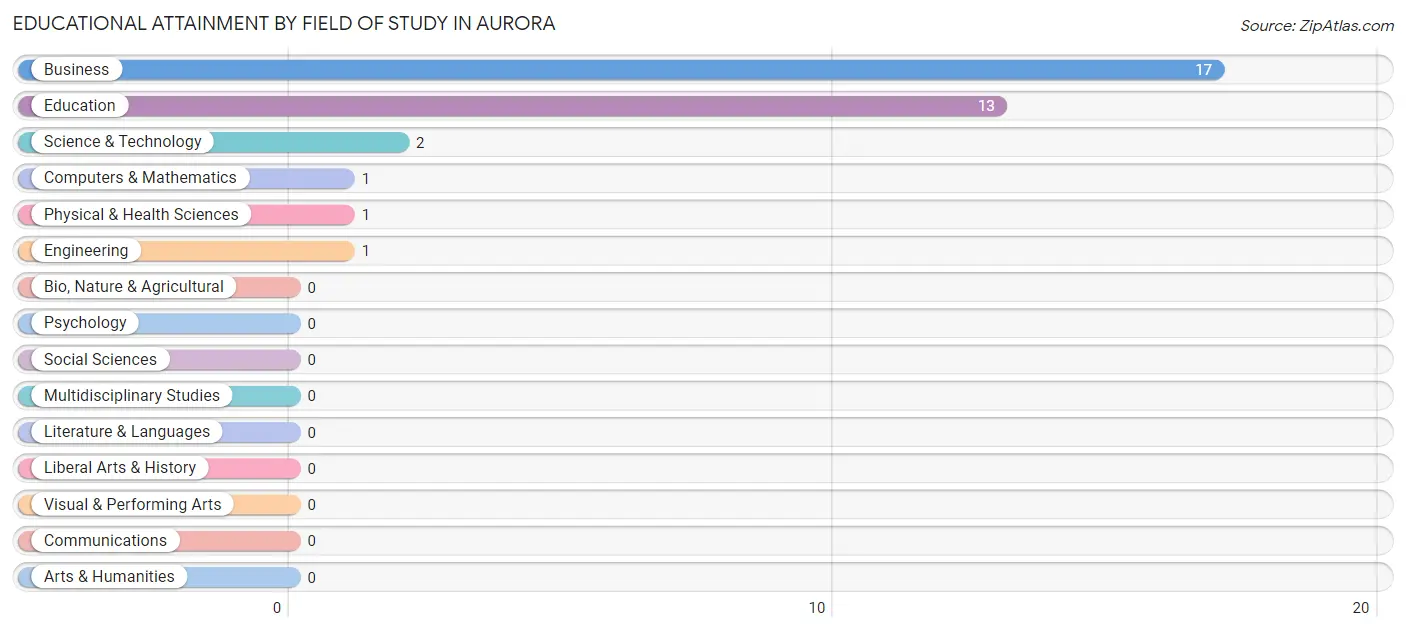
| Field of Study | # Graduates | % Graduates |
| Computers & Mathematics | 1 | 2.9% |
| Bio, Nature & Agricultural | 0 | 0.0% |
| Physical & Health Sciences | 1 | 2.9% |
| Psychology | 0 | 0.0% |
| Social Sciences | 0 | 0.0% |
| Engineering | 1 | 2.9% |
| Multidisciplinary Studies | 0 | 0.0% |
| Science & Technology | 2 | 5.7% |
| Business | 17 | 48.6% |
| Education | 13 | 37.1% |
| Literature & Languages | 0 | 0.0% |
| Liberal Arts & History | 0 | 0.0% |
| Visual & Performing Arts | 0 | 0.0% |
| Communications | 0 | 0.0% |
| Arts & Humanities | 0 | 0.0% |
| Total | 35 | 100.0% |
Transportation & Commute in Aurora
Vehicle Availability by Sex in Aurora
The most prevalent vehicle ownership categories in Aurora are males with 2 vehicles (59, accounting for 57.3%) and females with 2 vehicles (37, making up 57.8%).
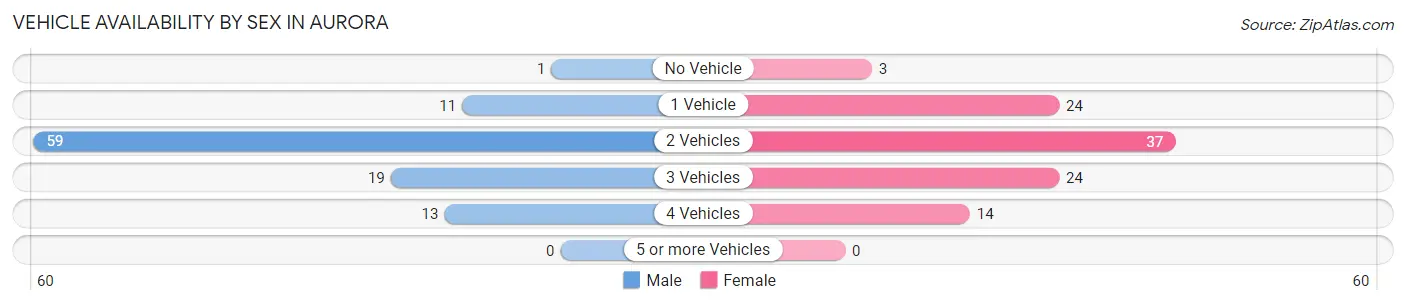
| Vehicles Available | Male | Female |
| No Vehicle | 1 (1.0%) | 3 (2.9%) |
| 1 Vehicle | 11 (10.7%) | 24 (23.5%) |
| 2 Vehicles | 59 (57.3%) | 37 (36.3%) |
| 3 Vehicles | 19 (18.4%) | 24 (23.5%) |
| 4 Vehicles | 13 (12.6%) | 14 (13.7%) |
| 5 or more Vehicles | 0 (0.0%) | 0 (0.0%) |
| Total | 103 (100.0%) | 102 (100.0%) |
Commute Time in Aurora
The most frequently occuring commute durations in Aurora are 5 to 9 minutes (63 commuters, 30.7%), 10 to 14 minutes (39 commuters, 19.0%), and 20 to 24 minutes (27 commuters, 13.2%).
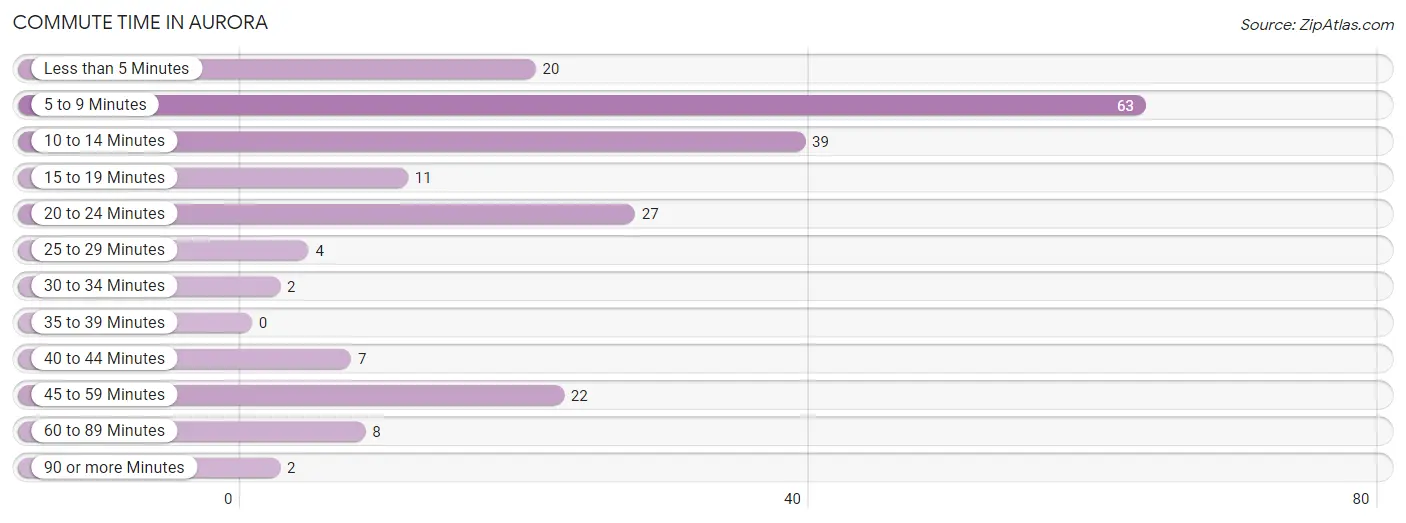
| Commute Time | # Commuters | % Commuters |
| Less than 5 Minutes | 20 | 9.8% |
| 5 to 9 Minutes | 63 | 30.7% |
| 10 to 14 Minutes | 39 | 19.0% |
| 15 to 19 Minutes | 11 | 5.4% |
| 20 to 24 Minutes | 27 | 13.2% |
| 25 to 29 Minutes | 4 | 1.9% |
| 30 to 34 Minutes | 2 | 1.0% |
| 35 to 39 Minutes | 0 | 0.0% |
| 40 to 44 Minutes | 7 | 3.4% |
| 45 to 59 Minutes | 22 | 10.7% |
| 60 to 89 Minutes | 8 | 3.9% |
| 90 or more Minutes | 2 | 1.0% |
Commute Time by Sex in Aurora
The most common commute times in Aurora are 5 to 9 minutes (42 commuters, 40.8%) for males and 45 to 59 minutes (22 commuters, 21.6%) for females.
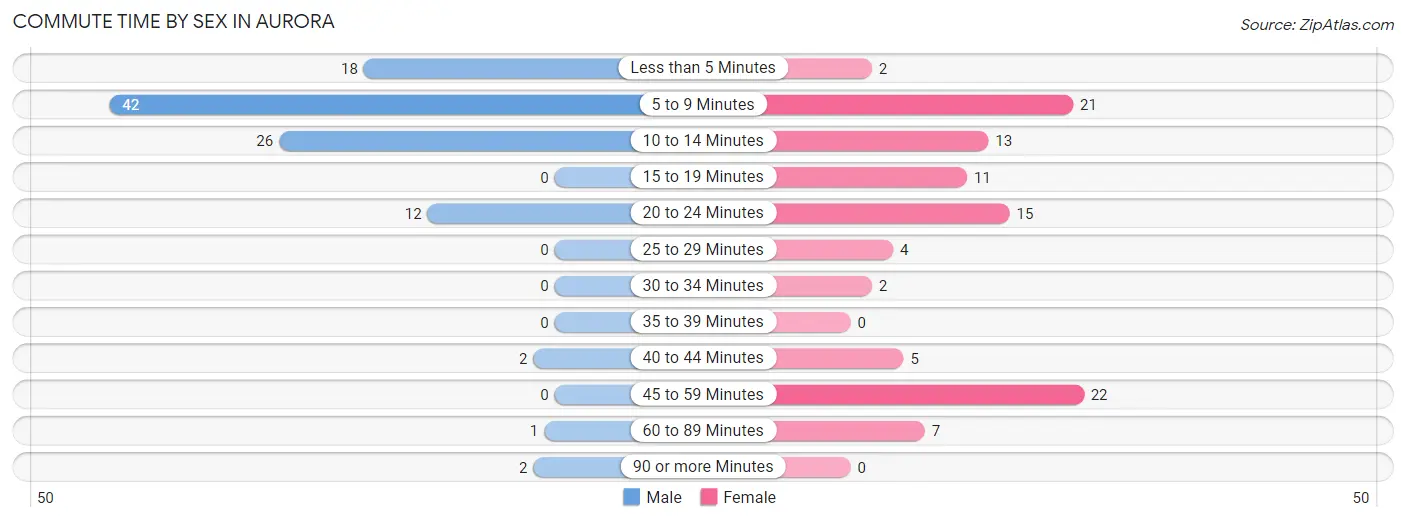
| Commute Time | Male | Female |
| Less than 5 Minutes | 18 (17.5%) | 2 (2.0%) |
| 5 to 9 Minutes | 42 (40.8%) | 21 (20.6%) |
| 10 to 14 Minutes | 26 (25.2%) | 13 (12.8%) |
| 15 to 19 Minutes | 0 (0.0%) | 11 (10.8%) |
| 20 to 24 Minutes | 12 (11.7%) | 15 (14.7%) |
| 25 to 29 Minutes | 0 (0.0%) | 4 (3.9%) |
| 30 to 34 Minutes | 0 (0.0%) | 2 (2.0%) |
| 35 to 39 Minutes | 0 (0.0%) | 0 (0.0%) |
| 40 to 44 Minutes | 2 (1.9%) | 5 (4.9%) |
| 45 to 59 Minutes | 0 (0.0%) | 22 (21.6%) |
| 60 to 89 Minutes | 1 (1.0%) | 7 (6.9%) |
| 90 or more Minutes | 2 (1.9%) | 0 (0.0%) |
Time of Departure to Work by Sex in Aurora
The most frequent times of departure to work in Aurora are 8:00 AM to 8:29 AM (52, 50.5%) for males and 4:00 PM to 11:59 PM (30, 29.4%) for females.
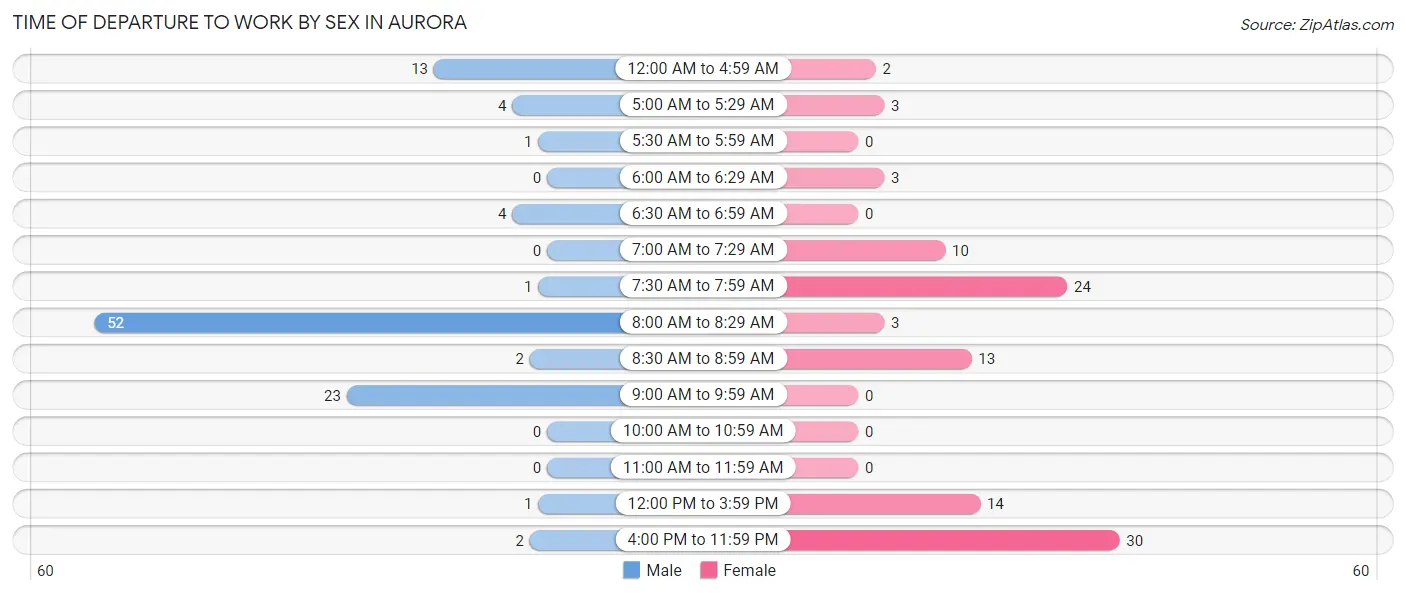
| Time of Departure | Male | Female |
| 12:00 AM to 4:59 AM | 13 (12.6%) | 2 (2.0%) |
| 5:00 AM to 5:29 AM | 4 (3.9%) | 3 (2.9%) |
| 5:30 AM to 5:59 AM | 1 (1.0%) | 0 (0.0%) |
| 6:00 AM to 6:29 AM | 0 (0.0%) | 3 (2.9%) |
| 6:30 AM to 6:59 AM | 4 (3.9%) | 0 (0.0%) |
| 7:00 AM to 7:29 AM | 0 (0.0%) | 10 (9.8%) |
| 7:30 AM to 7:59 AM | 1 (1.0%) | 24 (23.5%) |
| 8:00 AM to 8:29 AM | 52 (50.5%) | 3 (2.9%) |
| 8:30 AM to 8:59 AM | 2 (1.9%) | 13 (12.8%) |
| 9:00 AM to 9:59 AM | 23 (22.3%) | 0 (0.0%) |
| 10:00 AM to 10:59 AM | 0 (0.0%) | 0 (0.0%) |
| 11:00 AM to 11:59 AM | 0 (0.0%) | 0 (0.0%) |
| 12:00 PM to 3:59 PM | 1 (1.0%) | 14 (13.7%) |
| 4:00 PM to 11:59 PM | 2 (1.9%) | 30 (29.4%) |
| Total | 103 (100.0%) | 102 (100.0%) |
Housing Occupancy in Aurora
Occupancy by Ownership in Aurora
Of the total 193 dwellings in Aurora, owner-occupied units account for 89 (46.1%), while renter-occupied units make up 104 (53.9%).
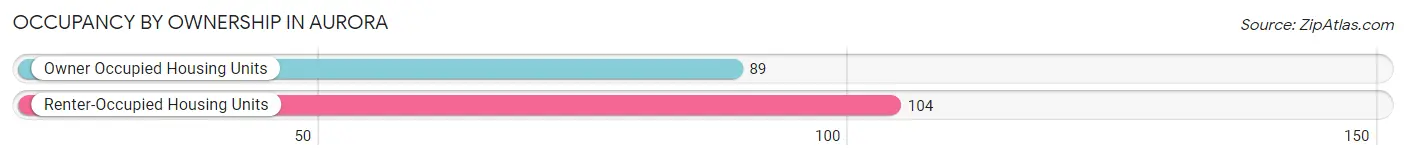
| Occupancy | # Housing Units | % Housing Units |
| Owner Occupied Housing Units | 89 | 46.1% |
| Renter-Occupied Housing Units | 104 | 53.9% |
| Total Occupied Housing Units | 193 | 100.0% |
Occupancy by Household Size in Aurora
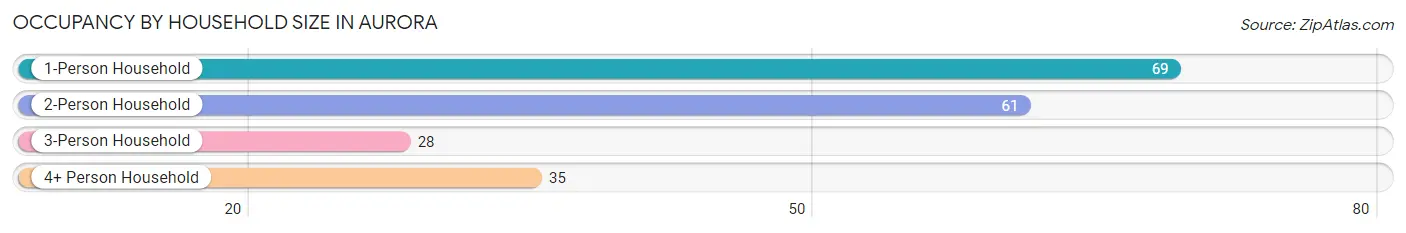
| Household Size | # Housing Units | % Housing Units |
| 1-Person Household | 69 | 35.7% |
| 2-Person Household | 61 | 31.6% |
| 3-Person Household | 28 | 14.5% |
| 4+ Person Household | 35 | 18.1% |
| Total Housing Units | 193 | 100.0% |
Occupancy by Ownership by Household Size in Aurora
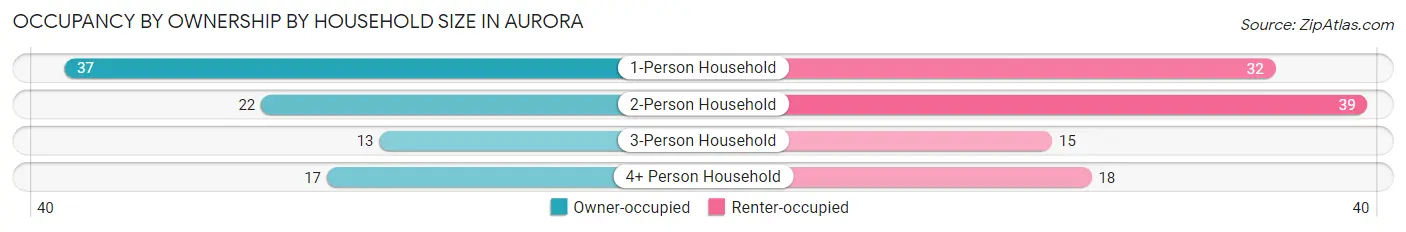
| Household Size | Owner-occupied | Renter-occupied |
| 1-Person Household | 37 (53.6%) | 32 (46.4%) |
| 2-Person Household | 22 (36.1%) | 39 (63.9%) |
| 3-Person Household | 13 (46.4%) | 15 (53.6%) |
| 4+ Person Household | 17 (48.6%) | 18 (51.4%) |
| Total Housing Units | 89 (46.1%) | 104 (53.9%) |
Occupancy by Educational Attainment in Aurora
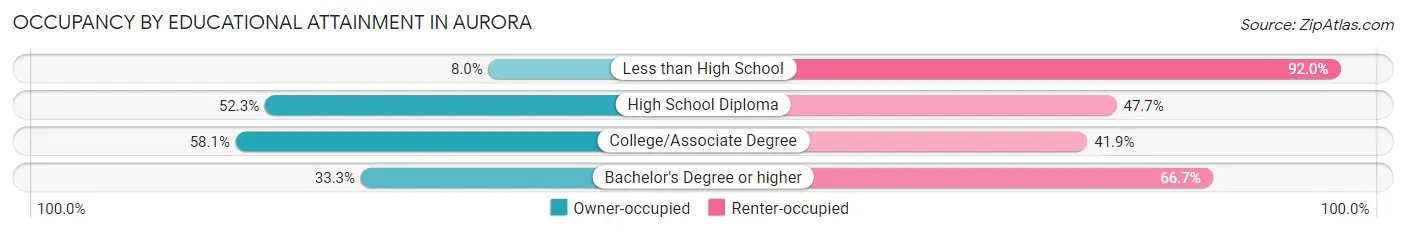
| Household Size | Owner-occupied | Renter-occupied |
| Less than High School | 2 (8.0%) | 23 (92.0%) |
| High School Diploma | 56 (52.3%) | 51 (47.7%) |
| College/Associate Degree | 25 (58.1%) | 18 (41.9%) |
| Bachelor's Degree or higher | 6 (33.3%) | 12 (66.7%) |
Occupancy by Age of Householder in Aurora
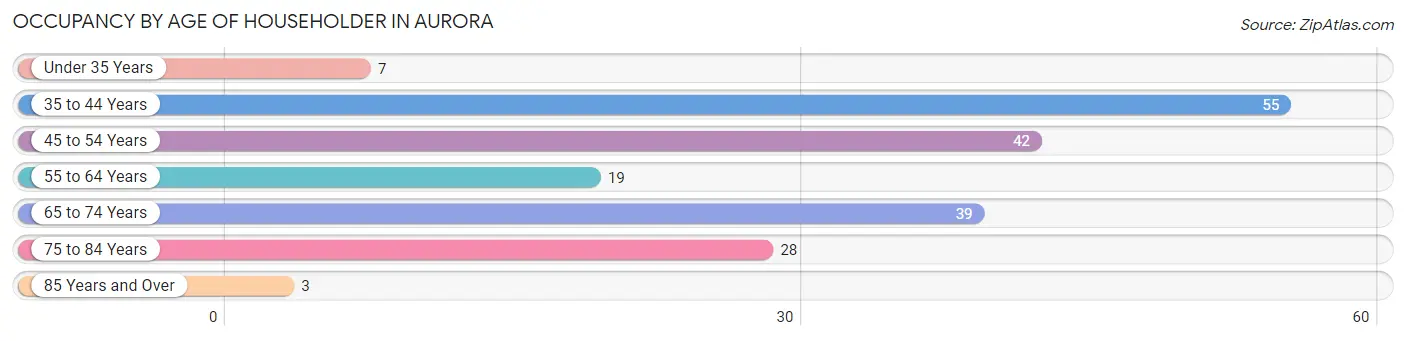
| Age Bracket | # Households | % Households |
| Under 35 Years | 7 | 3.6% |
| 35 to 44 Years | 55 | 28.5% |
| 45 to 54 Years | 42 | 21.8% |
| 55 to 64 Years | 19 | 9.8% |
| 65 to 74 Years | 39 | 20.2% |
| 75 to 84 Years | 28 | 14.5% |
| 85 Years and Over | 3 | 1.5% |
| Total | 193 | 100.0% |
Housing Finances in Aurora
Median Income by Occupancy in Aurora
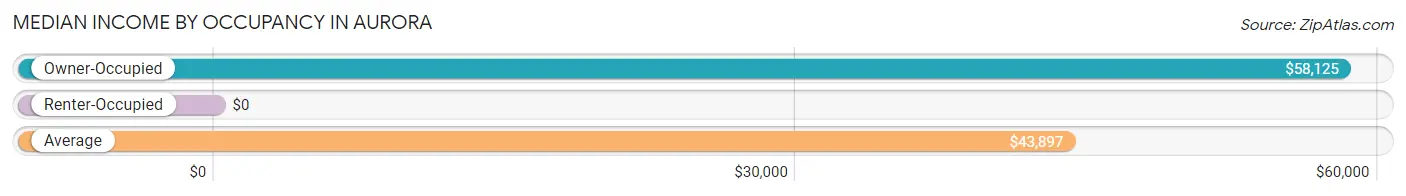
| Occupancy Type | # Households | Median Income |
| Owner-Occupied | 89 (46.1%) | $58,125 |
| Renter-Occupied | 104 (53.9%) | $0 |
| Average | 193 (100.0%) | $43,897 |
Occupancy by Householder Income Bracket in Aurora
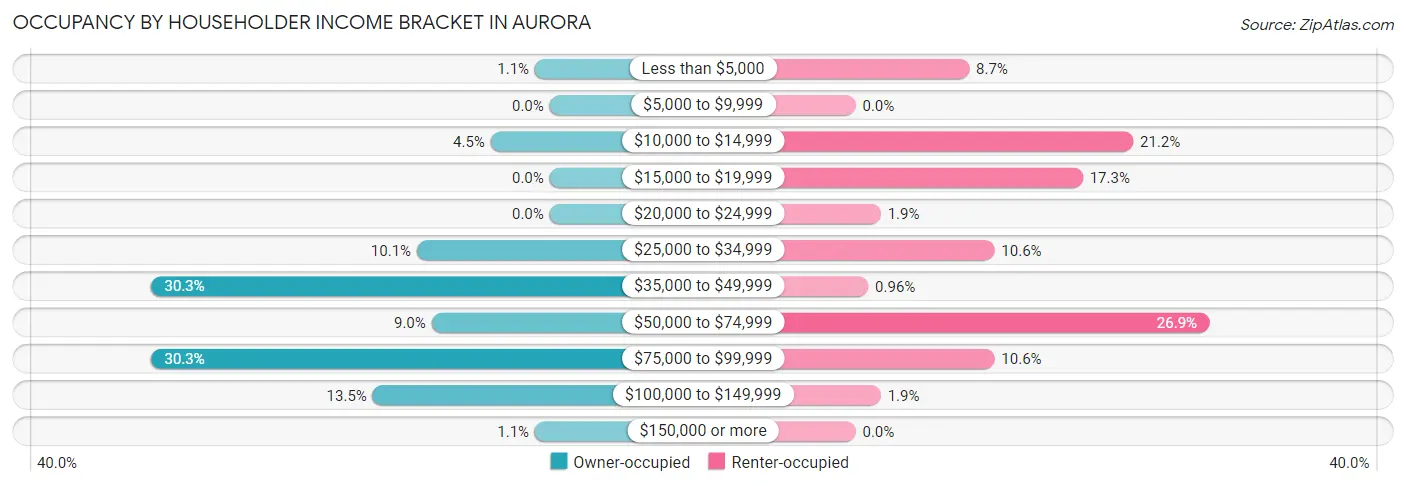
| Income Bracket | Owner-occupied | Renter-occupied |
| Less than $5,000 | 1 (1.1%) | 9 (8.6%) |
| $5,000 to $9,999 | 0 (0.0%) | 0 (0.0%) |
| $10,000 to $14,999 | 4 (4.5%) | 22 (21.1%) |
| $15,000 to $19,999 | 0 (0.0%) | 18 (17.3%) |
| $20,000 to $24,999 | 0 (0.0%) | 2 (1.9%) |
| $25,000 to $34,999 | 9 (10.1%) | 11 (10.6%) |
| $35,000 to $49,999 | 27 (30.3%) | 1 (1.0%) |
| $50,000 to $74,999 | 8 (9.0%) | 28 (26.9%) |
| $75,000 to $99,999 | 27 (30.3%) | 11 (10.6%) |
| $100,000 to $149,999 | 12 (13.5%) | 2 (1.9%) |
| $150,000 or more | 1 (1.1%) | 0 (0.0%) |
| Total | 89 (100.0%) | 104 (100.0%) |
Monthly Housing Cost Tiers in Aurora
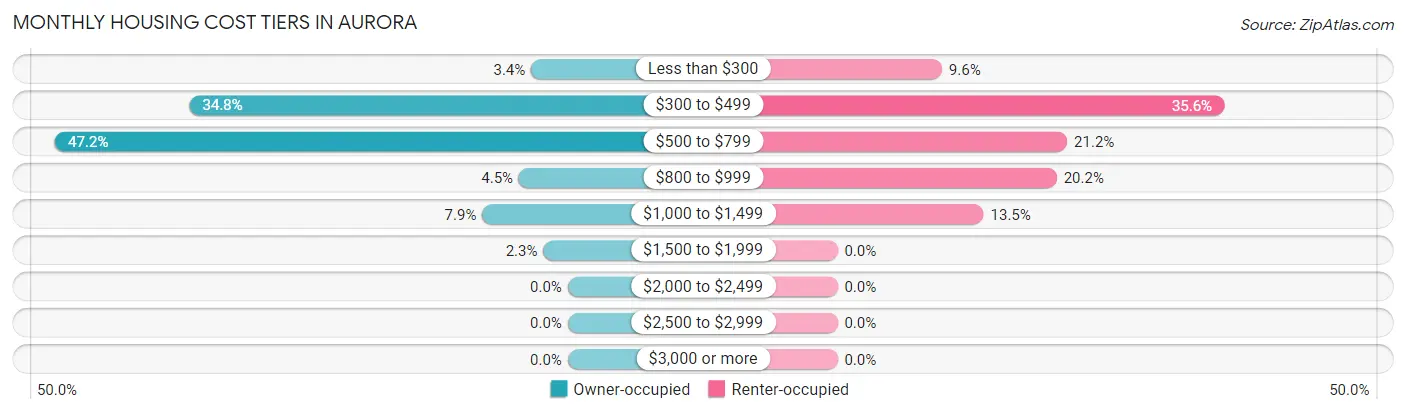
| Monthly Cost | Owner-occupied | Renter-occupied |
| Less than $300 | 3 (3.4%) | 10 (9.6%) |
| $300 to $499 | 31 (34.8%) | 37 (35.6%) |
| $500 to $799 | 42 (47.2%) | 22 (21.1%) |
| $800 to $999 | 4 (4.5%) | 21 (20.2%) |
| $1,000 to $1,499 | 7 (7.9%) | 14 (13.5%) |
| $1,500 to $1,999 | 2 (2.2%) | 0 (0.0%) |
| $2,000 to $2,499 | 0 (0.0%) | 0 (0.0%) |
| $2,500 to $2,999 | 0 (0.0%) | 0 (0.0%) |
| $3,000 or more | 0 (0.0%) | 0 (0.0%) |
| Total | 89 (100.0%) | 104 (100.0%) |
Physical Housing Characteristics in Aurora
Housing Structures in Aurora
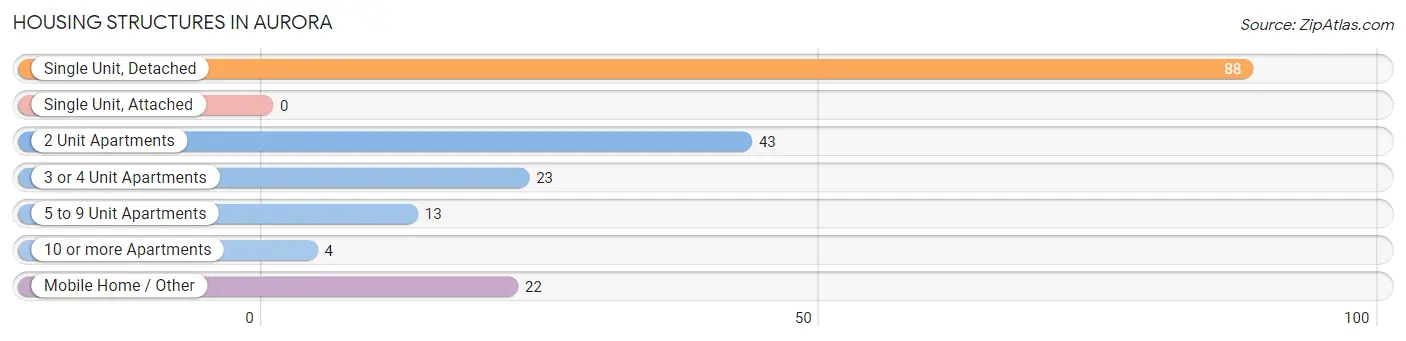
| Structure Type | # Housing Units | % Housing Units |
| Single Unit, Detached | 88 | 45.6% |
| Single Unit, Attached | 0 | 0.0% |
| 2 Unit Apartments | 43 | 22.3% |
| 3 or 4 Unit Apartments | 23 | 11.9% |
| 5 to 9 Unit Apartments | 13 | 6.7% |
| 10 or more Apartments | 4 | 2.1% |
| Mobile Home / Other | 22 | 11.4% |
| Total | 193 | 100.0% |
Housing Structures by Occupancy in Aurora
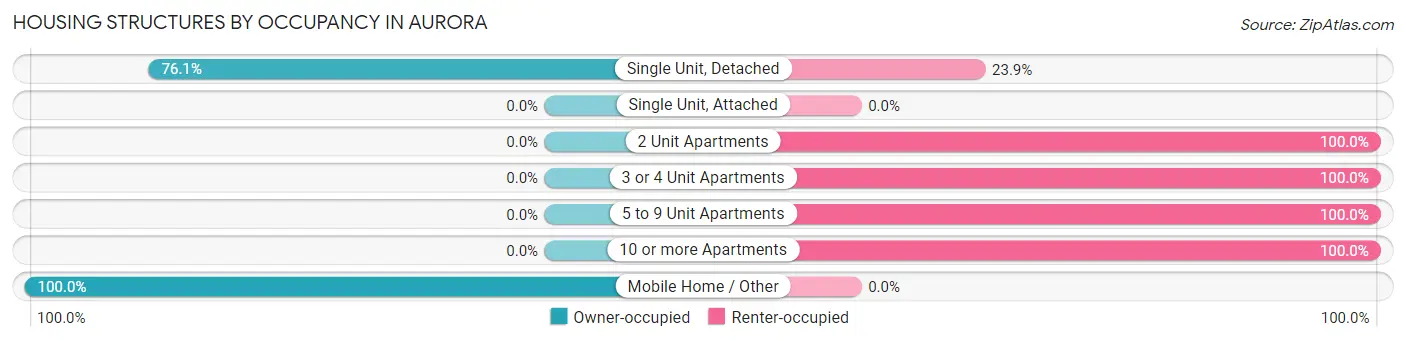
| Structure Type | Owner-occupied | Renter-occupied |
| Single Unit, Detached | 67 (76.1%) | 21 (23.9%) |
| Single Unit, Attached | 0 (0.0%) | 0 (0.0%) |
| 2 Unit Apartments | 0 (0.0%) | 43 (100.0%) |
| 3 or 4 Unit Apartments | 0 (0.0%) | 23 (100.0%) |
| 5 to 9 Unit Apartments | 0 (0.0%) | 13 (100.0%) |
| 10 or more Apartments | 0 (0.0%) | 4 (100.0%) |
| Mobile Home / Other | 22 (100.0%) | 0 (0.0%) |
| Total | 89 (46.1%) | 104 (53.9%) |
Housing Structures by Number of Rooms in Aurora
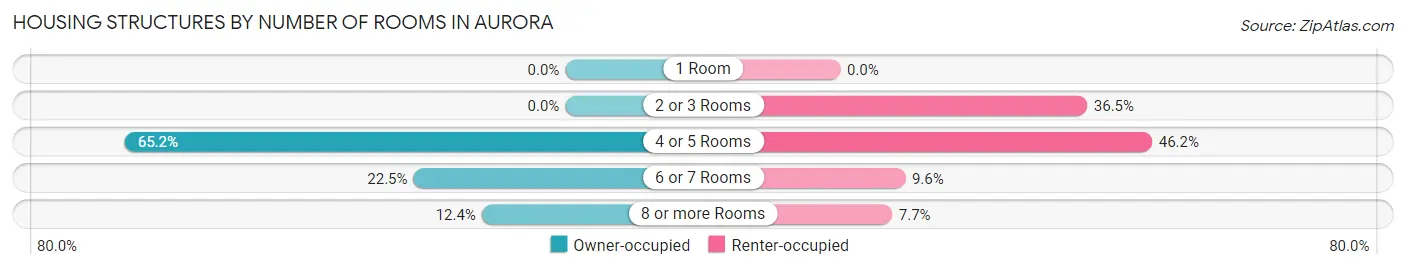
| Number of Rooms | Owner-occupied | Renter-occupied |
| 1 Room | 0 (0.0%) | 0 (0.0%) |
| 2 or 3 Rooms | 0 (0.0%) | 38 (36.5%) |
| 4 or 5 Rooms | 58 (65.2%) | 48 (46.2%) |
| 6 or 7 Rooms | 20 (22.5%) | 10 (9.6%) |
| 8 or more Rooms | 11 (12.4%) | 8 (7.7%) |
| Total | 89 (100.0%) | 104 (100.0%) |
Housing Structure by Heating Type in Aurora
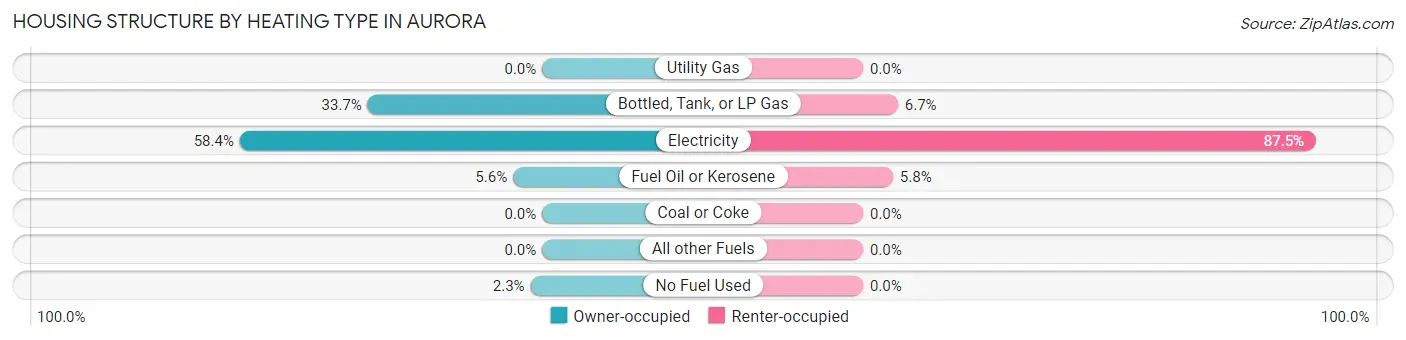
| Heating Type | Owner-occupied | Renter-occupied |
| Utility Gas | 0 (0.0%) | 0 (0.0%) |
| Bottled, Tank, or LP Gas | 30 (33.7%) | 7 (6.7%) |
| Electricity | 52 (58.4%) | 91 (87.5%) |
| Fuel Oil or Kerosene | 5 (5.6%) | 6 (5.8%) |
| Coal or Coke | 0 (0.0%) | 0 (0.0%) |
| All other Fuels | 0 (0.0%) | 0 (0.0%) |
| No Fuel Used | 2 (2.2%) | 0 (0.0%) |
| Total | 89 (100.0%) | 104 (100.0%) |
Household Vehicle Usage in Aurora
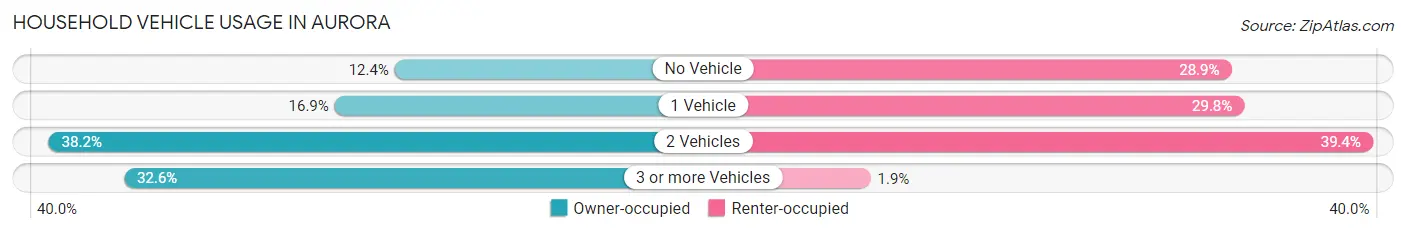
| Vehicles per Household | Owner-occupied | Renter-occupied |
| No Vehicle | 11 (12.4%) | 30 (28.8%) |
| 1 Vehicle | 15 (16.9%) | 31 (29.8%) |
| 2 Vehicles | 34 (38.2%) | 41 (39.4%) |
| 3 or more Vehicles | 29 (32.6%) | 2 (1.9%) |
| Total | 89 (100.0%) | 104 (100.0%) |
Real Estate & Mortgages in Aurora
Real Estate and Mortgage Overview in Aurora
| Characteristic | Without Mortgage | With Mortgage |
| Housing Units | 57 | 32 |
| Median Property Value | $62,500 | $91,800 |
| Median Household Income | $44,338 | $1 |
| Monthly Housing Costs | $421 | $0 |
| Real Estate Taxes | $1,011 | $1 |
Property Value by Mortgage Status in Aurora
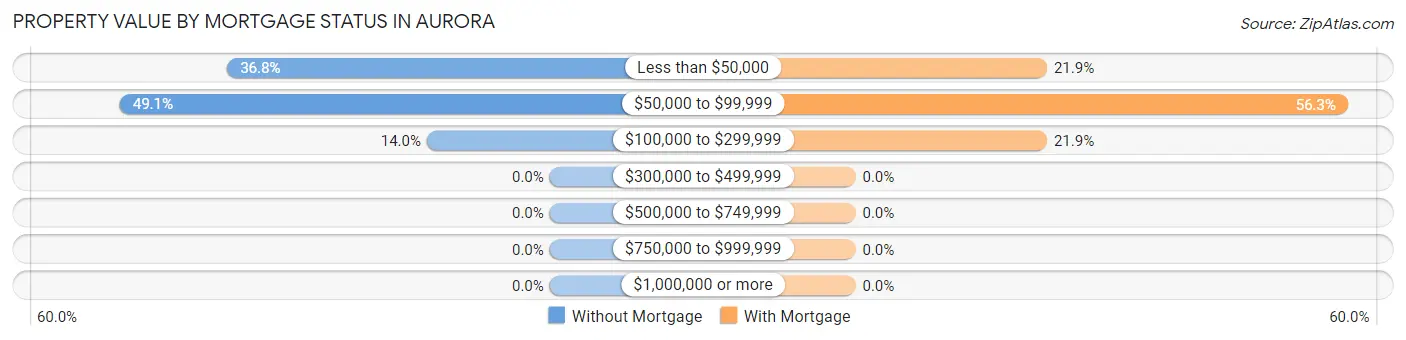
| Property Value | Without Mortgage | With Mortgage |
| Less than $50,000 | 21 (36.8%) | 7 (21.9%) |
| $50,000 to $99,999 | 28 (49.1%) | 18 (56.2%) |
| $100,000 to $299,999 | 8 (14.0%) | 7 (21.9%) |
| $300,000 to $499,999 | 0 (0.0%) | 0 (0.0%) |
| $500,000 to $749,999 | 0 (0.0%) | 0 (0.0%) |
| $750,000 to $999,999 | 0 (0.0%) | 0 (0.0%) |
| $1,000,000 or more | 0 (0.0%) | 0 (0.0%) |
| Total | 57 (100.0%) | 32 (100.0%) |
Household Income by Mortgage Status in Aurora
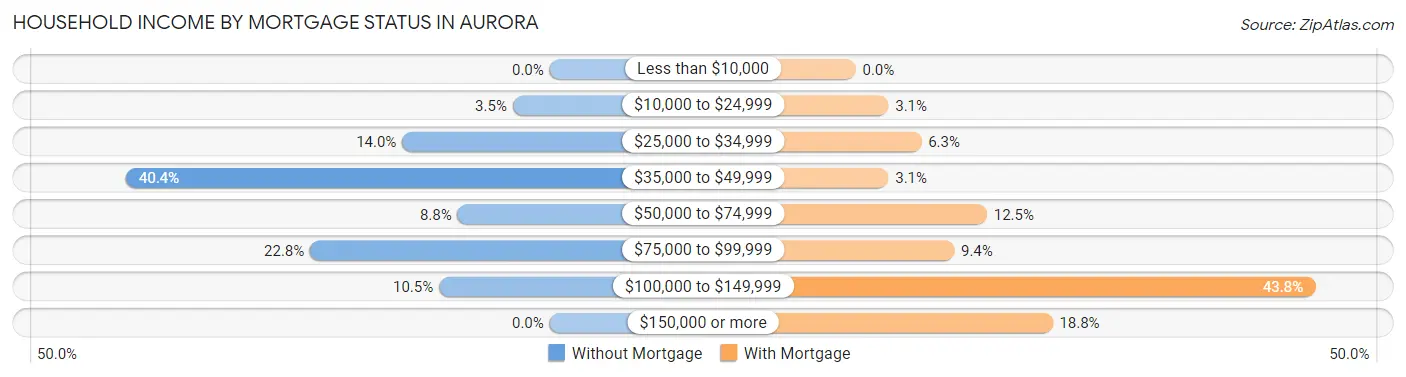
| Household Income | Without Mortgage | With Mortgage |
| Less than $10,000 | 0 (0.0%) | 0 (0.0%) |
| $10,000 to $24,999 | 2 (3.5%) | 1 (3.1%) |
| $25,000 to $34,999 | 8 (14.0%) | 2 (6.2%) |
| $35,000 to $49,999 | 23 (40.4%) | 1 (3.1%) |
| $50,000 to $74,999 | 5 (8.8%) | 4 (12.5%) |
| $75,000 to $99,999 | 13 (22.8%) | 3 (9.4%) |
| $100,000 to $149,999 | 6 (10.5%) | 14 (43.8%) |
| $150,000 or more | 0 (0.0%) | 6 (18.8%) |
| Total | 57 (100.0%) | 32 (100.0%) |
Property Value to Household Income Ratio in Aurora
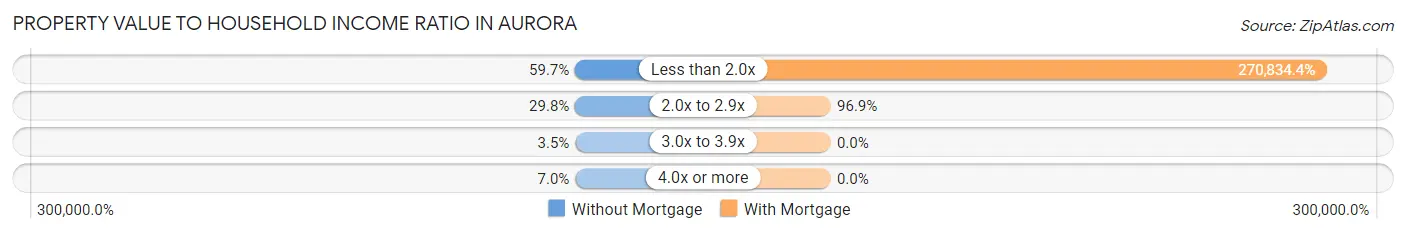
| Value-to-Income Ratio | Without Mortgage | With Mortgage |
| Less than 2.0x | 34 (59.7%) | 86,667 (270,834.4%) |
| 2.0x to 2.9x | 17 (29.8%) | 31 (96.9%) |
| 3.0x to 3.9x | 2 (3.5%) | 0 (0.0%) |
| 4.0x or more | 4 (7.0%) | 0 (0.0%) |
| Total | 57 (100.0%) | 32 (100.0%) |
Real Estate Taxes by Mortgage Status in Aurora
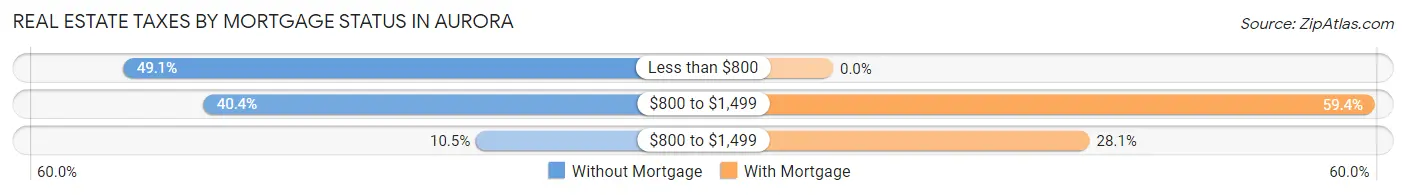
| Property Taxes | Without Mortgage | With Mortgage |
| Less than $800 | 28 (49.1%) | 0 (0.0%) |
| $800 to $1,499 | 23 (40.4%) | 19 (59.4%) |
| $800 to $1,499 | 6 (10.5%) | 9 (28.1%) |
| Total | 57 (100.0%) | 32 (100.0%) |
Health & Disability in Aurora
Health Insurance Coverage by Age in Aurora
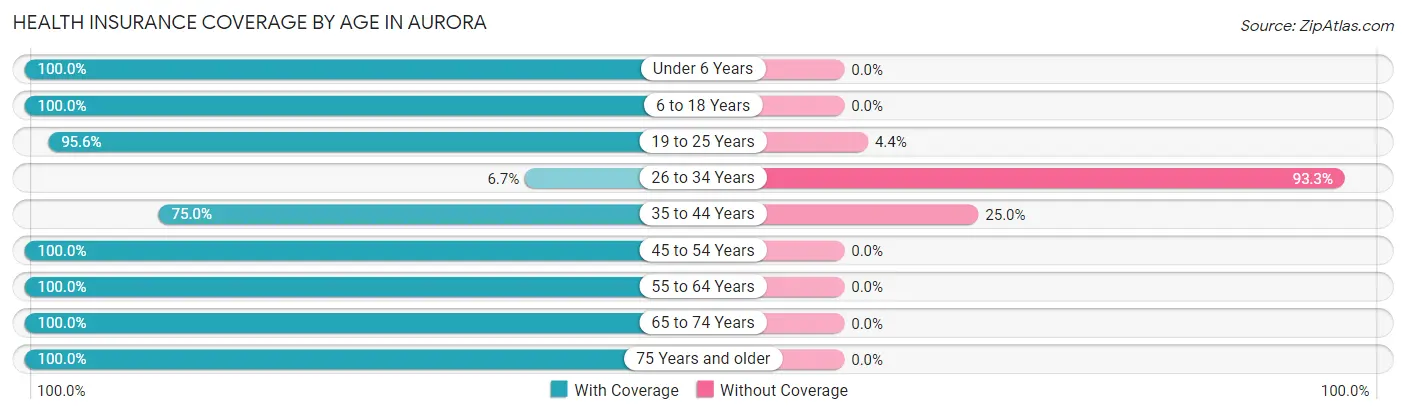
| Age Bracket | With Coverage | Without Coverage |
| Under 6 Years | 40 (100.0%) | 0 (0.0%) |
| 6 to 18 Years | 82 (100.0%) | 0 (0.0%) |
| 19 to 25 Years | 65 (95.6%) | 3 (4.4%) |
| 26 to 34 Years | 2 (6.7%) | 28 (93.3%) |
| 35 to 44 Years | 75 (75.0%) | 25 (25.0%) |
| 45 to 54 Years | 81 (100.0%) | 0 (0.0%) |
| 55 to 64 Years | 43 (100.0%) | 0 (0.0%) |
| 65 to 74 Years | 44 (100.0%) | 0 (0.0%) |
| 75 Years and older | 34 (100.0%) | 0 (0.0%) |
| Total | 466 (89.3%) | 56 (10.7%) |
Health Insurance Coverage by Citizenship Status in Aurora
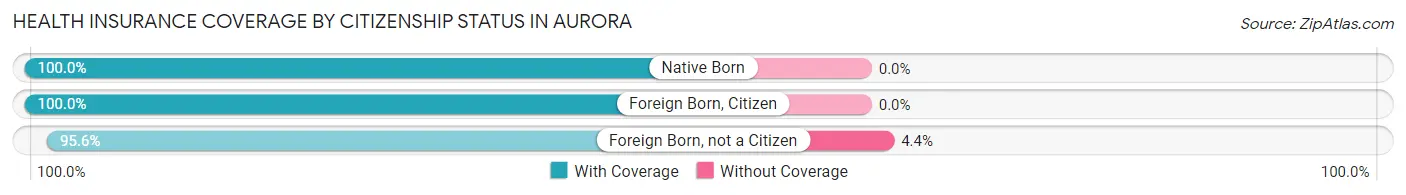
| Citizenship Status | With Coverage | Without Coverage |
| Native Born | 40 (100.0%) | 0 (0.0%) |
| Foreign Born, Citizen | 82 (100.0%) | 0 (0.0%) |
| Foreign Born, not a Citizen | 65 (95.6%) | 3 (4.4%) |
Health Insurance Coverage by Household Income in Aurora
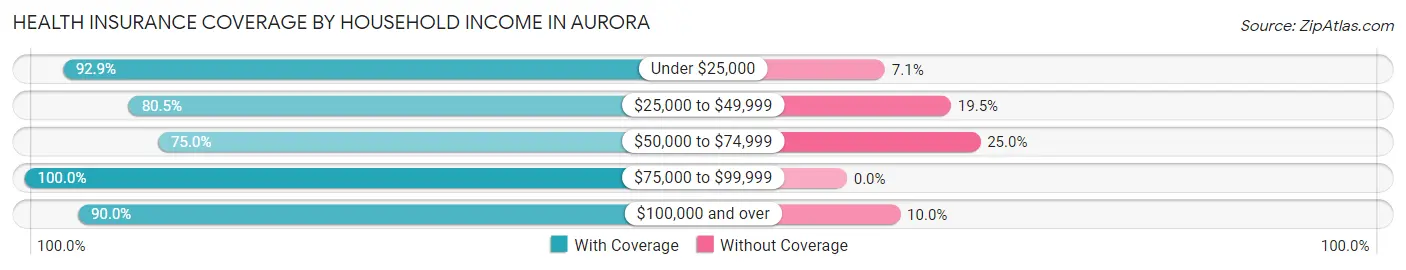
| Household Income | With Coverage | Without Coverage |
| Under $25,000 | 104 (92.9%) | 8 (7.1%) |
| $25,000 to $49,999 | 66 (80.5%) | 16 (19.5%) |
| $50,000 to $74,999 | 84 (75.0%) | 28 (25.0%) |
| $75,000 to $99,999 | 176 (100.0%) | 0 (0.0%) |
| $100,000 and over | 36 (90.0%) | 4 (10.0%) |
Public vs Private Health Insurance Coverage by Age in Aurora
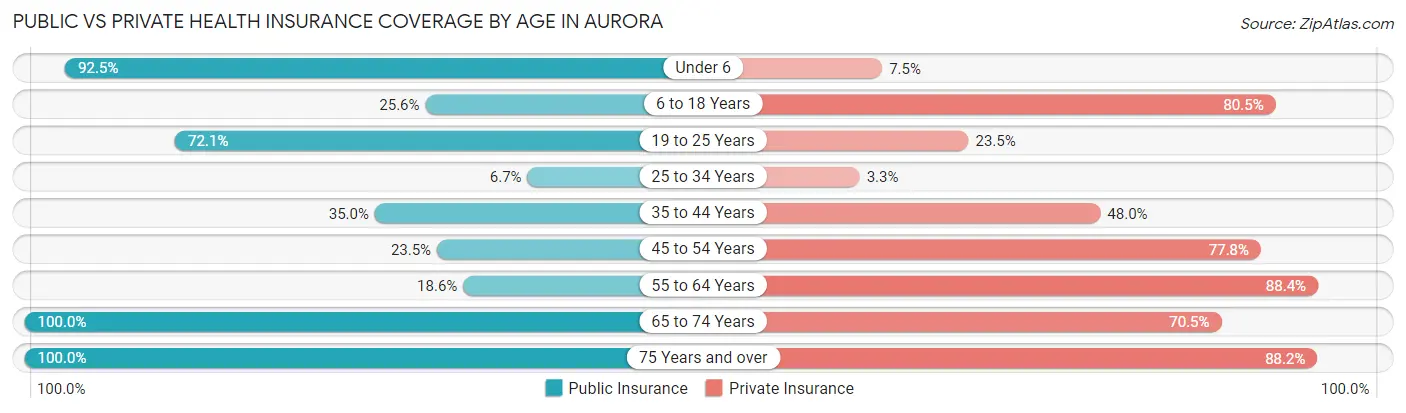
| Age Bracket | Public Insurance | Private Insurance |
| Under 6 | 37 (92.5%) | 3 (7.5%) |
| 6 to 18 Years | 21 (25.6%) | 66 (80.5%) |
| 19 to 25 Years | 49 (72.1%) | 16 (23.5%) |
| 25 to 34 Years | 2 (6.7%) | 1 (3.3%) |
| 35 to 44 Years | 35 (35.0%) | 48 (48.0%) |
| 45 to 54 Years | 19 (23.5%) | 63 (77.8%) |
| 55 to 64 Years | 8 (18.6%) | 38 (88.4%) |
| 65 to 74 Years | 44 (100.0%) | 31 (70.5%) |
| 75 Years and over | 34 (100.0%) | 30 (88.2%) |
| Total | 249 (47.7%) | 296 (56.7%) |
Disability Status by Sex by Age in Aurora
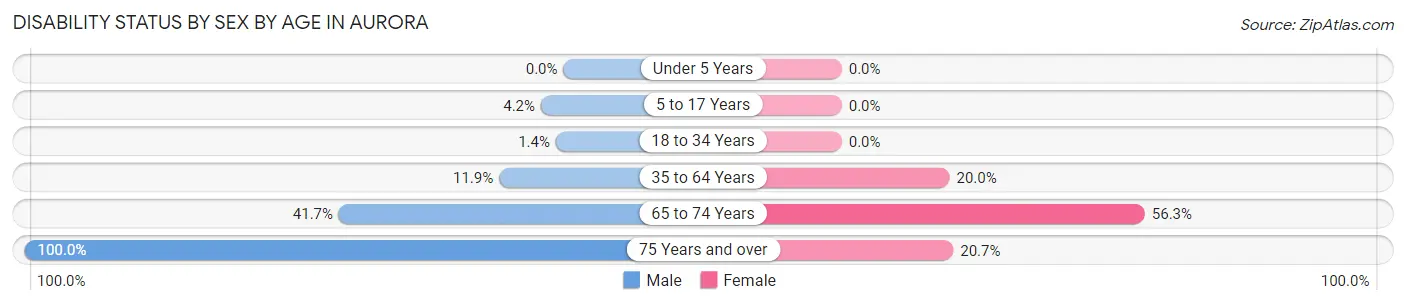
| Age Bracket | Male | Female |
| Under 5 Years | 0 (0.0%) | 0 (0.0%) |
| 5 to 17 Years | 3 (4.2%) | 0 (0.0%) |
| 18 to 34 Years | 1 (1.4%) | 0 (0.0%) |
| 35 to 64 Years | 13 (11.9%) | 23 (20.0%) |
| 65 to 74 Years | 5 (41.7%) | 18 (56.2%) |
| 75 Years and over | 5 (100.0%) | 6 (20.7%) |
Disability Class by Sex by Age in Aurora
Disability Class: Hearing Difficulty
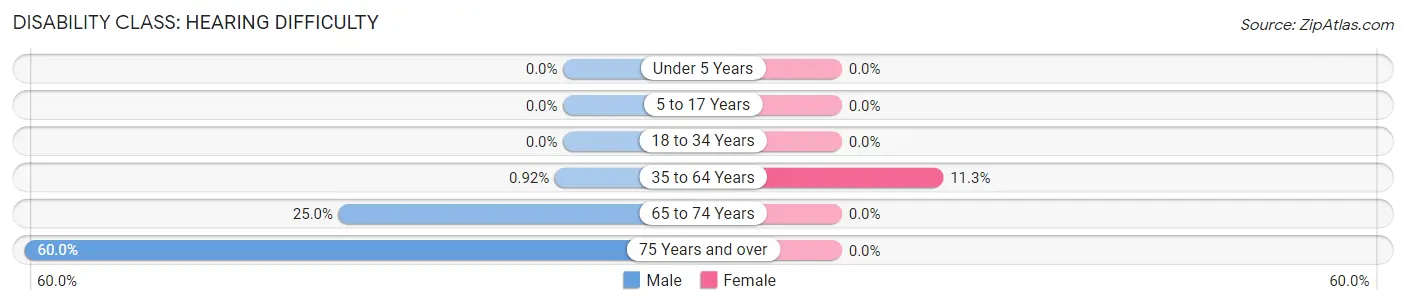
| Age Bracket | Male | Female |
| Under 5 Years | 0 (0.0%) | 0 (0.0%) |
| 5 to 17 Years | 0 (0.0%) | 0 (0.0%) |
| 18 to 34 Years | 0 (0.0%) | 0 (0.0%) |
| 35 to 64 Years | 1 (0.9%) | 13 (11.3%) |
| 65 to 74 Years | 3 (25.0%) | 0 (0.0%) |
| 75 Years and over | 3 (60.0%) | 0 (0.0%) |
Disability Class: Vision Difficulty
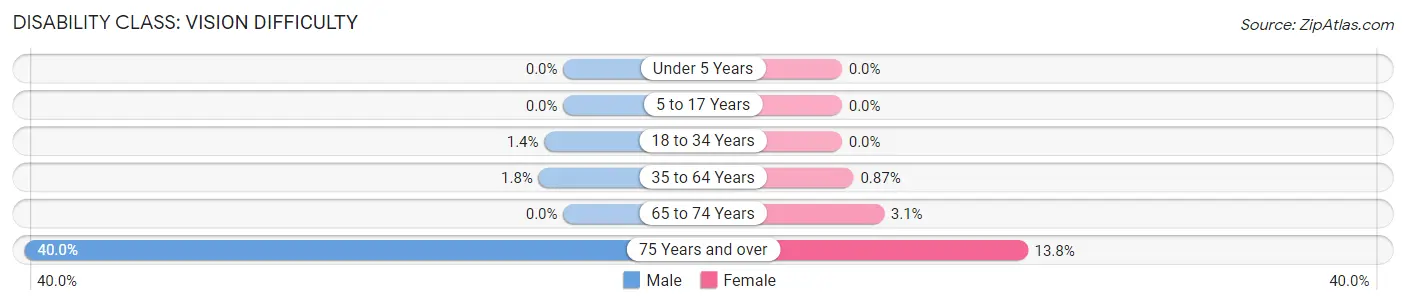
| Age Bracket | Male | Female |
| Under 5 Years | 0 (0.0%) | 0 (0.0%) |
| 5 to 17 Years | 0 (0.0%) | 0 (0.0%) |
| 18 to 34 Years | 1 (1.4%) | 0 (0.0%) |
| 35 to 64 Years | 2 (1.8%) | 1 (0.9%) |
| 65 to 74 Years | 0 (0.0%) | 1 (3.1%) |
| 75 Years and over | 2 (40.0%) | 4 (13.8%) |
Disability Class: Cognitive Difficulty
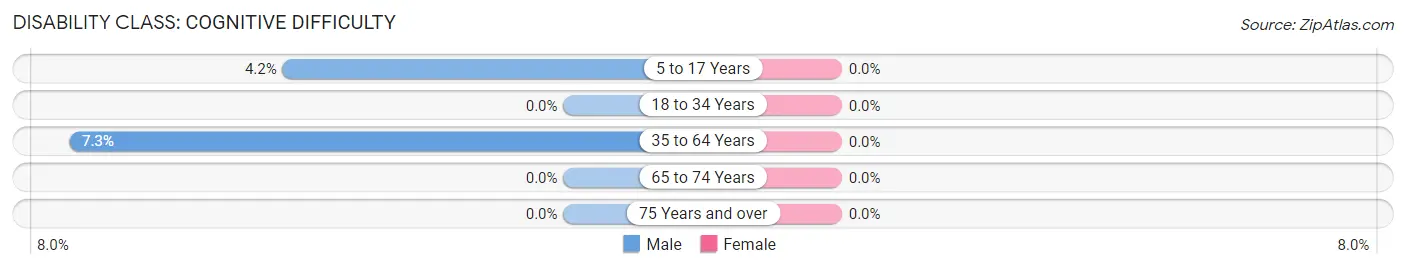
| Age Bracket | Male | Female |
| 5 to 17 Years | 3 (4.2%) | 0 (0.0%) |
| 18 to 34 Years | 0 (0.0%) | 0 (0.0%) |
| 35 to 64 Years | 8 (7.3%) | 0 (0.0%) |
| 65 to 74 Years | 0 (0.0%) | 0 (0.0%) |
| 75 Years and over | 0 (0.0%) | 0 (0.0%) |
Disability Class: Ambulatory Difficulty
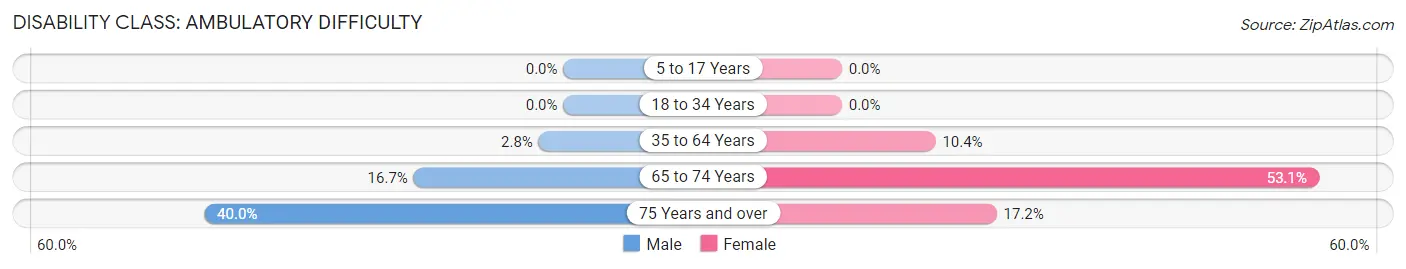
| Age Bracket | Male | Female |
| 5 to 17 Years | 0 (0.0%) | 0 (0.0%) |
| 18 to 34 Years | 0 (0.0%) | 0 (0.0%) |
| 35 to 64 Years | 3 (2.8%) | 12 (10.4%) |
| 65 to 74 Years | 2 (16.7%) | 17 (53.1%) |
| 75 Years and over | 2 (40.0%) | 5 (17.2%) |
Disability Class: Self-Care Difficulty
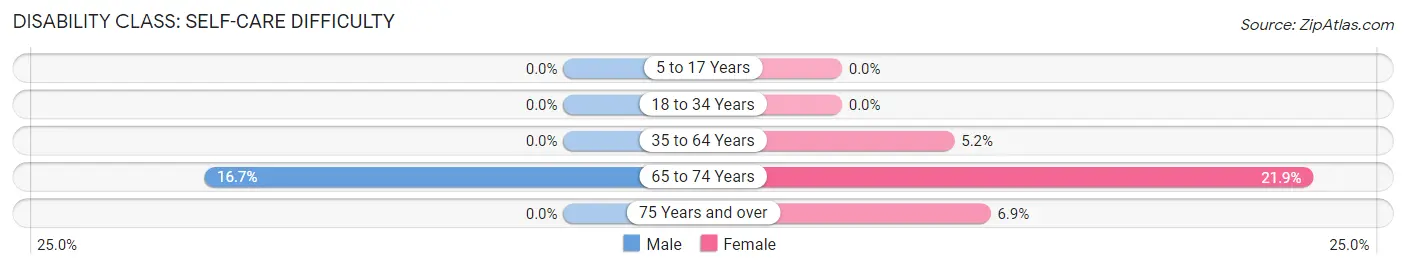
| Age Bracket | Male | Female |
| 5 to 17 Years | 0 (0.0%) | 0 (0.0%) |
| 18 to 34 Years | 0 (0.0%) | 0 (0.0%) |
| 35 to 64 Years | 0 (0.0%) | 6 (5.2%) |
| 65 to 74 Years | 2 (16.7%) | 7 (21.9%) |
| 75 Years and over | 0 (0.0%) | 2 (6.9%) |
Technology Access in Aurora
Computing Device Access in Aurora
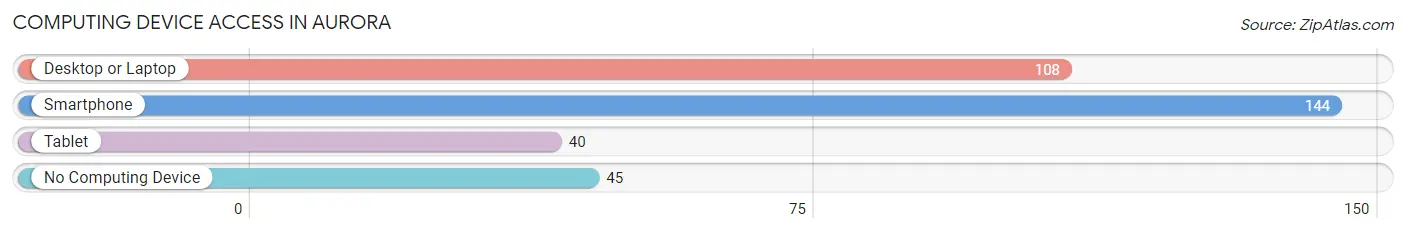
| Device Type | # Households | % Households |
| Desktop or Laptop | 108 | 56.0% |
| Smartphone | 144 | 74.6% |
| Tablet | 40 | 20.7% |
| No Computing Device | 45 | 23.3% |
| Total | 193 | 100.0% |
Internet Access in Aurora
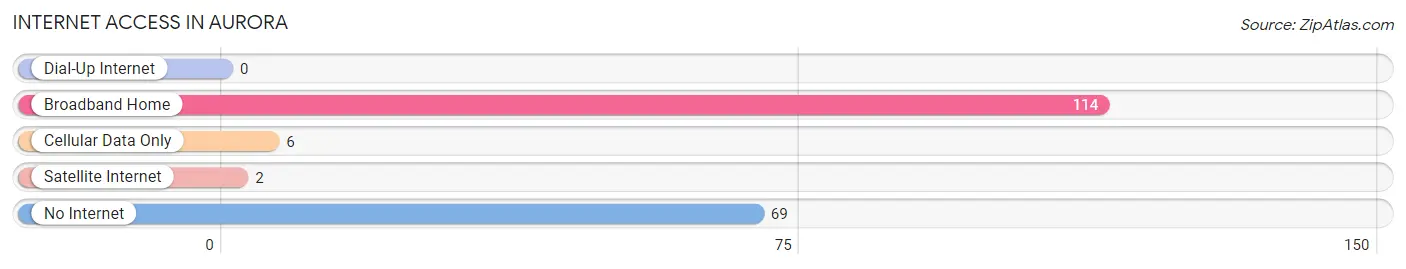
| Internet Type | # Households | % Households |
| Dial-Up Internet | 0 | 0.0% |
| Broadband Home | 114 | 59.1% |
| Cellular Data Only | 6 | 3.1% |
| Satellite Internet | 2 | 1.0% |
| No Internet | 69 | 35.7% |
| Total | 193 | 100.0% |
Aurora Summary
Aurora is a small town located in Beaufort County, North Carolina. It is situated on the banks of the Pamlico River, approximately 30 miles east of Greenville. The town has a population of approximately 1,000 people and is part of the Greenville Metropolitan Statistical Area.
Geography
Aurora is located in the coastal plain region of North Carolina, which is characterized by flat terrain and sandy soils. The town is situated on the banks of the Pamlico River, which is a major tributary of the Neuse River. The town is surrounded by a number of small lakes and ponds, including Lake Phelps, Lake Mattamuskeet, and Lake Mattamuskeet National Wildlife Refuge. The town is also located near the Croatan National Forest, which is a popular destination for outdoor recreation.
Climate
Aurora has a humid subtropical climate, with hot, humid summers and mild winters. The average annual temperature is around 70°F (21°C), with average highs in the summer reaching around 90°F (32°C) and average lows in the winter reaching around 40°F (4°C). The town receives an average of 48 inches (122 cm) of precipitation per year, with most of it falling in the summer months.
Demographics
As of the 2010 census, Aurora had a population of 1,037 people. The racial makeup of the town was 79.3% White, 17.2% African American, 0.7% Native American, 0.3% Asian, 0.1% Pacific Islander, and 2.4% from other races. The median household income was $30,938, and the median family income was $37,813.
Economy
Aurora’s economy is largely based on agriculture and tourism. The town is home to several farms, which produce a variety of crops, including corn, soybeans, and cotton. The town is also home to several seafood processing plants, which process and package seafood for local restaurants and markets. Tourism is also an important part of the local economy, with visitors coming to the area to enjoy the natural beauty of the Pamlico River and the Croatan National Forest.
History
Aurora was first settled in the late 1700s by a group of Quakers from Pennsylvania. The town was officially incorporated in 1883 and was named after Aurora, the Roman goddess of the dawn. The town grew steadily throughout the 19th century, and by the early 20th century, it had become a popular destination for tourists. The town was also home to several large farms, which produced a variety of crops, including cotton, corn, and soybeans.
In the late 20th century, Aurora began to experience a decline in population as many of its residents moved away in search of better economic opportunities. However, the town has seen a resurgence in recent years, with new businesses and restaurants opening up in the downtown area. The town is also home to several festivals and events throughout the year, including the Aurora Music Festival and the Aurora Arts Festival.
Common Questions
What is Per Capita Income in Aurora?
Per Capita income in Aurora is $19,794.
What is the Median Family Income in Aurora?
Median Family Income in Aurora is $58,750.
What is the Median Household income in Aurora?
Median Household Income in Aurora is $43,897.
What is Income or Wage Gap in Aurora?
Income or Wage Gap in Aurora is 31.9%.
Women in Aurora earn 68.1 cents for every dollar earned by a man.
What is Inequality or Gini Index in Aurora?
Inequality or Gini Index in Aurora is 0.38.
What is the Total Population of Aurora?
Total Population of Aurora is 522.
What is the Total Male Population of Aurora?
Total Male Population of Aurora is 271.
What is the Total Female Population of Aurora?
Total Female Population of Aurora is 251.
What is the Ratio of Males per 100 Females in Aurora?
There are 107.97 Males per 100 Females in Aurora.
What is the Ratio of Females per 100 Males in Aurora?
There are 92.62 Females per 100 Males in Aurora.
What is the Median Population Age in Aurora?
Median Population Age in Aurora is 39.3 Years.
What is the Average Family Size in Aurora
Average Family Size in Aurora is 3.5 People.
What is the Average Household Size in Aurora
Average Household Size in Aurora is 2.7 People.
How Large is the Labor Force in Aurora?
There are 251 People in the Labor Forcein in Aurora.
What is the Percentage of People in the Labor Force in Aurora?
58.9% of People are in the Labor Force in Aurora.
What is the Unemployment Rate in Aurora?
Unemployment Rate in Aurora is 18.3%.