Pine Level, NC Map & Demographics
Pine Level Map
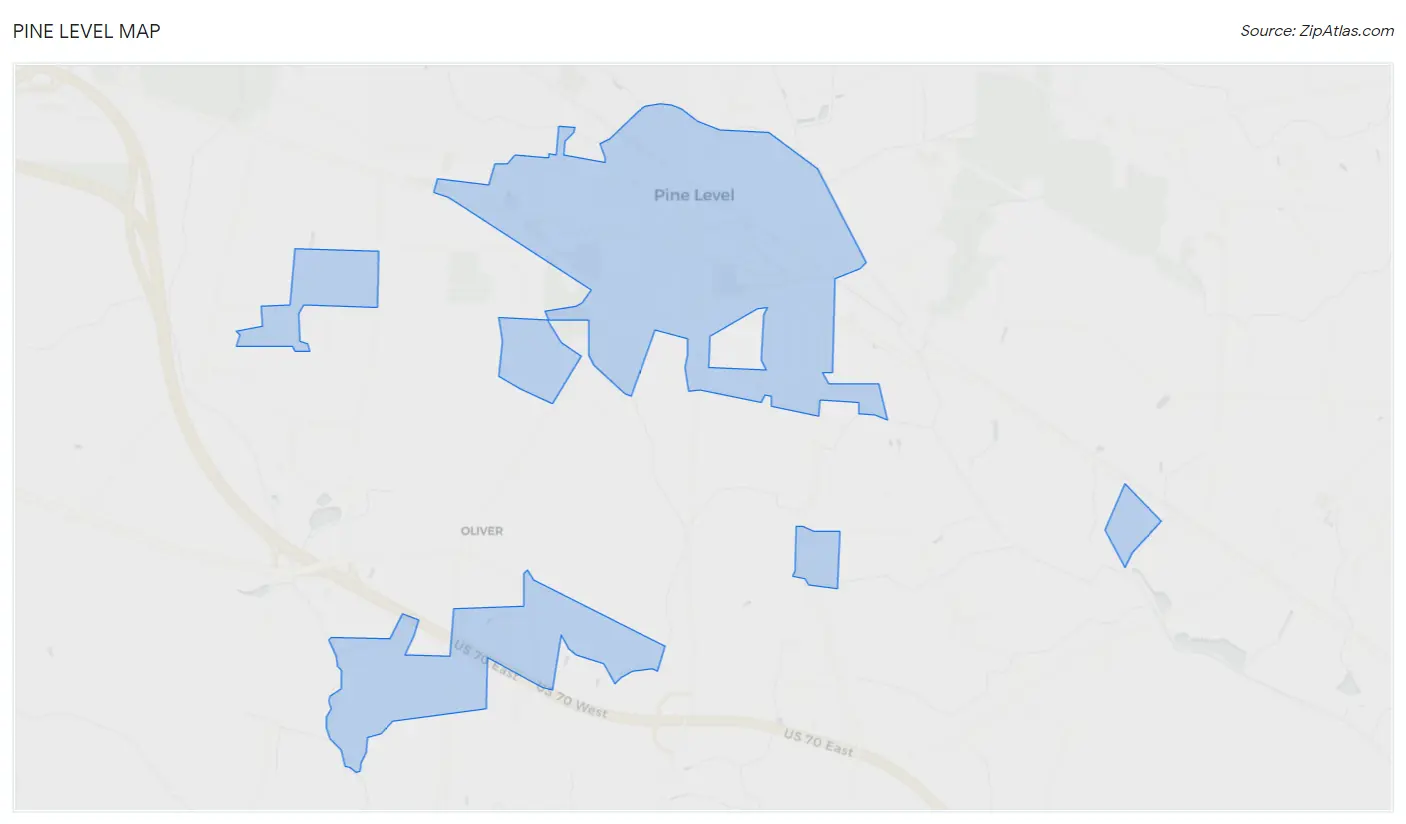
Pine Level Overview
$24,592
PER CAPITA INCOME
$80,943
AVG FAMILY INCOME
$65,347
AVG HOUSEHOLD INCOME
12.6%
WAGE / INCOME GAP [ % ]
87.4¢/ $1
WAGE / INCOME GAP [ $ ]
$8,277
FAMILY INCOME DEFICIT
0.37
INEQUALITY / GINI INDEX
2,116
TOTAL POPULATION
1,056
MALE POPULATION
1,060
FEMALE POPULATION
99.62
MALES / 100 FEMALES
100.38
FEMALES / 100 MALES
34.8
MEDIAN AGE
3.7
AVG FAMILY SIZE
2.9
AVG HOUSEHOLD SIZE
1,016
LABOR FORCE [ PEOPLE ]
64.4%
PERCENT IN LABOR FORCE
3.2%
UNEMPLOYMENT RATE
Pine Level Zip Codes
Income in Pine Level
Income Overview in Pine Level
Per Capita Income in Pine Level is $24,592, while median incomes of families and households are $80,943 and $65,347 respectively.
| Characteristic | Number | Measure |
| Per Capita Income | 2,116 | $24,592 |
| Median Family Income | 495 | $80,943 |
| Mean Family Income | 495 | $82,300 |
| Median Household Income | 717 | $65,347 |
| Mean Household Income | 717 | $68,702 |
| Income Deficit | 495 | $8,277 |
| Wage / Income Gap (%) | 2,116 | 12.60% |
| Wage / Income Gap ($) | 2,116 | 87.40¢ per $1 |
| Gini / Inequality Index | 2,116 | 0.37 |
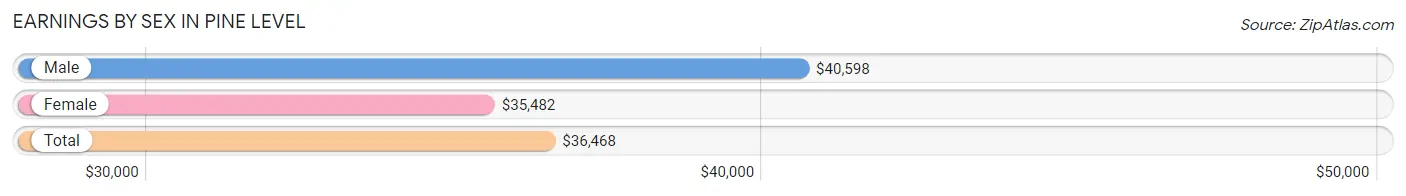
Earnings by Sex in Pine Level
Average Earnings in Pine Level are $36,468, $40,598 for men and $35,482 for women, a difference of 12.6%.
| Sex | Number | Average Earnings |
| Male | 543 (51.4%) | $40,598 |
| Female | 514 (48.6%) | $35,482 |
| Total | 1,057 (100.0%) | $36,468 |
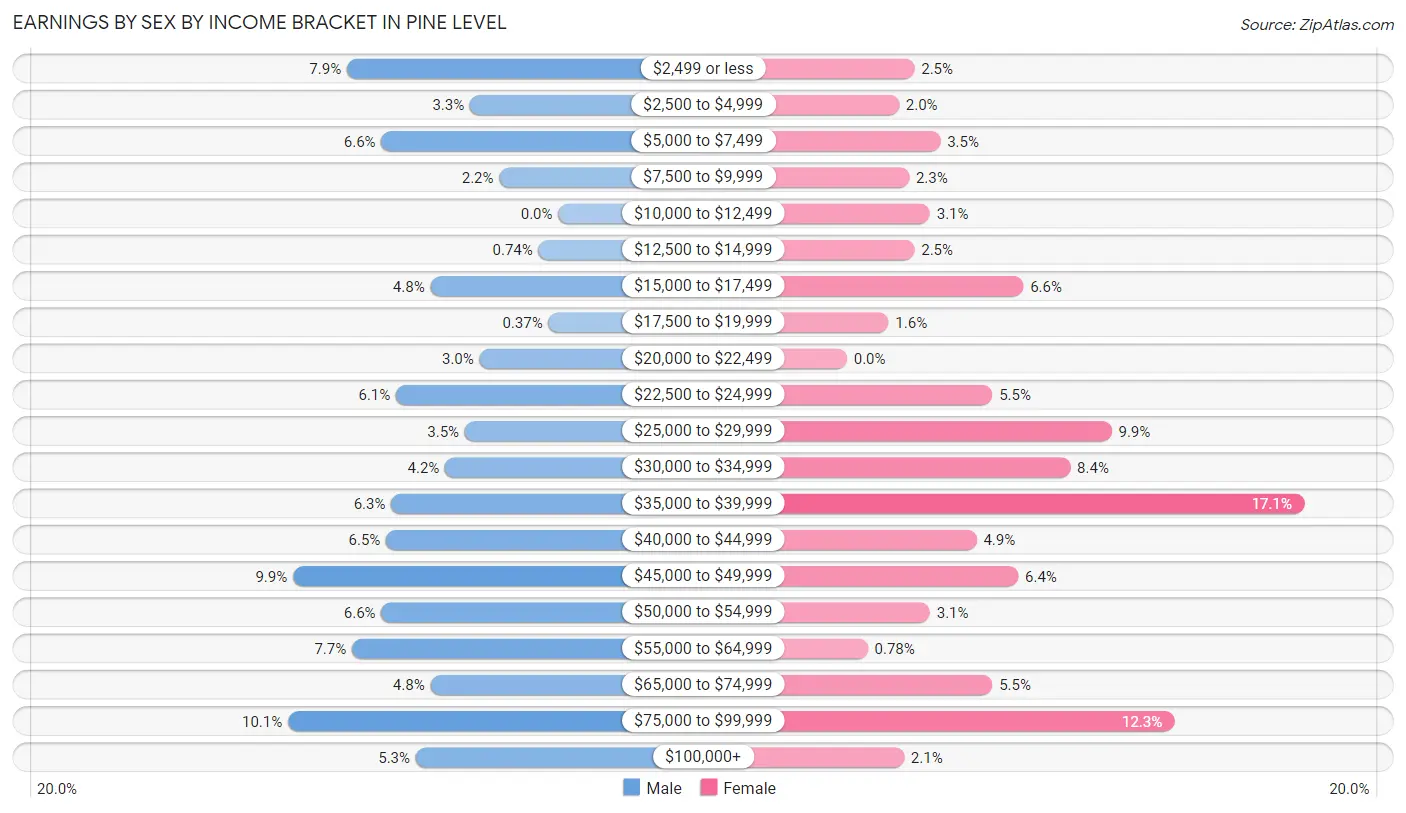
Earnings by Sex by Income Bracket in Pine Level
The most common earnings brackets in Pine Level are $75,000 to $99,999 for men (55 | 10.1%) and $35,000 to $39,999 for women (88 | 17.1%).
| Income | Male | Female |
| $2,499 or less | 43 (7.9%) | 13 (2.5%) |
| $2,500 to $4,999 | 18 (3.3%) | 10 (1.9%) |
| $5,000 to $7,499 | 36 (6.6%) | 18 (3.5%) |
| $7,500 to $9,999 | 12 (2.2%) | 12 (2.3%) |
| $10,000 to $12,499 | 0 (0.0%) | 16 (3.1%) |
| $12,500 to $14,999 | 4 (0.7%) | 13 (2.5%) |
| $15,000 to $17,499 | 26 (4.8%) | 34 (6.6%) |
| $17,500 to $19,999 | 2 (0.4%) | 8 (1.6%) |
| $20,000 to $22,499 | 16 (2.9%) | 0 (0.0%) |
| $22,500 to $24,999 | 33 (6.1%) | 28 (5.4%) |
| $25,000 to $29,999 | 19 (3.5%) | 51 (9.9%) |
| $30,000 to $34,999 | 23 (4.2%) | 43 (8.4%) |
| $35,000 to $39,999 | 34 (6.3%) | 88 (17.1%) |
| $40,000 to $44,999 | 35 (6.5%) | 25 (4.9%) |
| $45,000 to $49,999 | 54 (9.9%) | 33 (6.4%) |
| $50,000 to $54,999 | 36 (6.6%) | 16 (3.1%) |
| $55,000 to $64,999 | 42 (7.7%) | 4 (0.8%) |
| $65,000 to $74,999 | 26 (4.8%) | 28 (5.4%) |
| $75,000 to $99,999 | 55 (10.1%) | 63 (12.3%) |
| $100,000+ | 29 (5.3%) | 11 (2.1%) |
| Total | 543 (100.0%) | 514 (100.0%) |
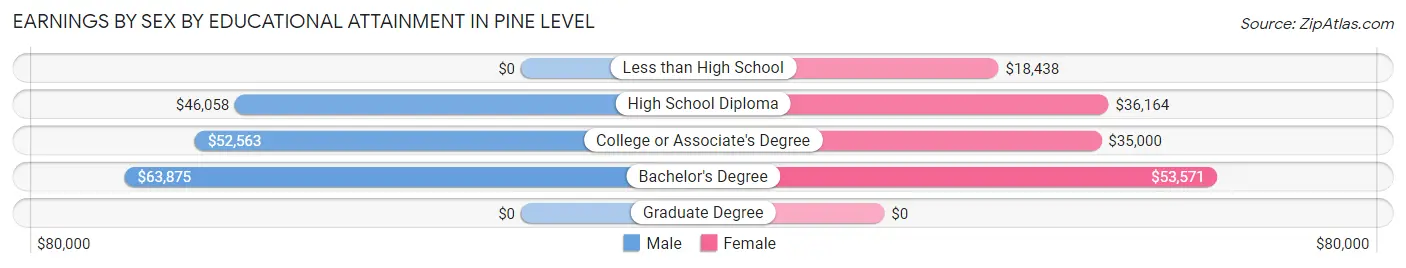
Earnings by Sex by Educational Attainment in Pine Level
Average earnings in Pine Level are $44,271 for men and $35,899 for women, a difference of 18.9%. Men with an educational attainment of bachelor's degree enjoy the highest average annual earnings of $63,875, while those with high school diploma education earn the least with $46,058. Women with an educational attainment of bachelor's degree earn the most with the average annual earnings of $53,571, while those with less than high school education have the smallest earnings of $18,438.
| Educational Attainment | Male Income | Female Income |
| Less than High School | - | - |
| High School Diploma | $46,058 | $36,164 |
| College or Associate's Degree | $52,563 | $35,000 |
| Bachelor's Degree | $63,875 | $53,571 |
| Graduate Degree | - | - |
| Total | $44,271 | $35,899 |
Family Income in Pine Level
Family Income Brackets in Pine Level
According to the Pine Level family income data, there are 144 families falling into the $75,000 to $99,999 income range, which is the most common income bracket and makes up 29.1% of all families. Conversely, the $25,000 to $34,999 income bracket is the least frequent group with only 1 families (0.2%) belonging to this category.
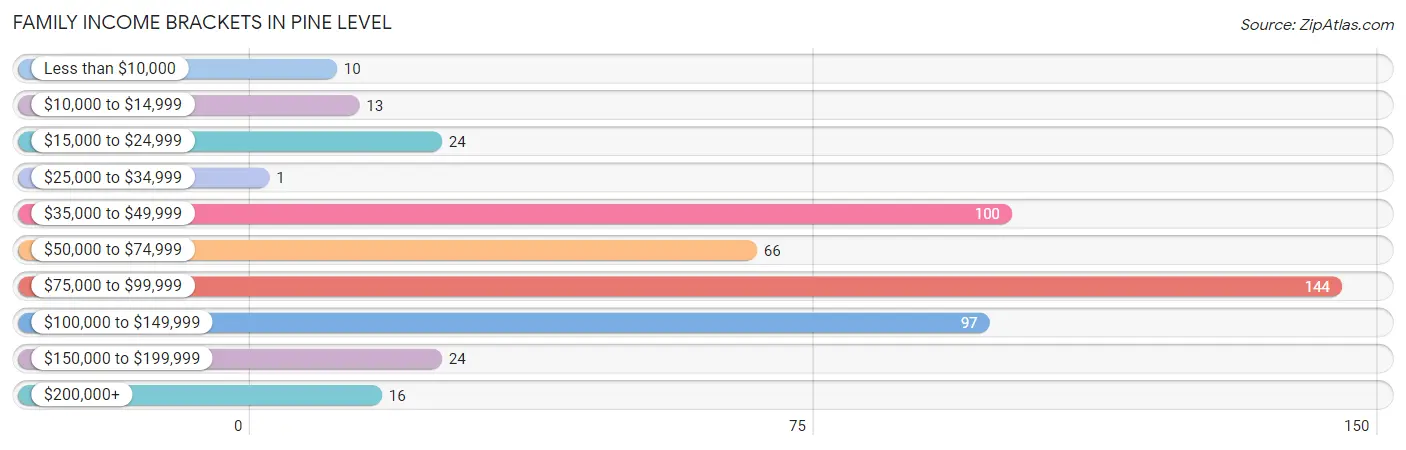
| Income Bracket | # Families | % Families |
| Less than $10,000 | 10 | 2.0% |
| $10,000 to $14,999 | 13 | 2.6% |
| $15,000 to $24,999 | 24 | 4.8% |
| $25,000 to $34,999 | 1 | 0.2% |
| $35,000 to $49,999 | 100 | 20.2% |
| $50,000 to $74,999 | 66 | 13.3% |
| $75,000 to $99,999 | 144 | 29.1% |
| $100,000 to $149,999 | 97 | 19.6% |
| $150,000 to $199,999 | 24 | 4.8% |
| $200,000+ | 16 | 3.2% |
Family Income by Famaliy Size in Pine Level
4-person families (62 | 12.5%) account for the highest median family income in Pine Level with $93,750 per family, while 3-person families (103 | 20.8%) have the highest median income of $30,353 per family member.
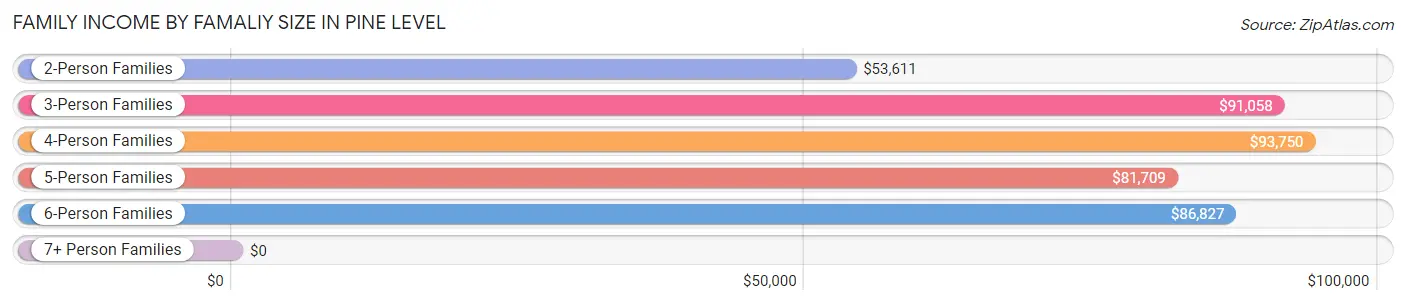
| Income Bracket | # Families | Median Income |
| 2-Person Families | 198 (40.0%) | $53,611 |
| 3-Person Families | 103 (20.8%) | $91,058 |
| 4-Person Families | 62 (12.5%) | $93,750 |
| 5-Person Families | 101 (20.4%) | $81,709 |
| 6-Person Families | 19 (3.8%) | $86,827 |
| 7+ Person Families | 12 (2.4%) | $0 |
| Total | 495 (100.0%) | $80,943 |
Family Income by Number of Earners in Pine Level
The median family income in Pine Level is $80,943, with families comprising 3+ earners (86) having the highest median family income of $132,115, while families with 1 earner (190) have the lowest median family income of $67,500, accounting for 17.4% and 38.4% of families, respectively.
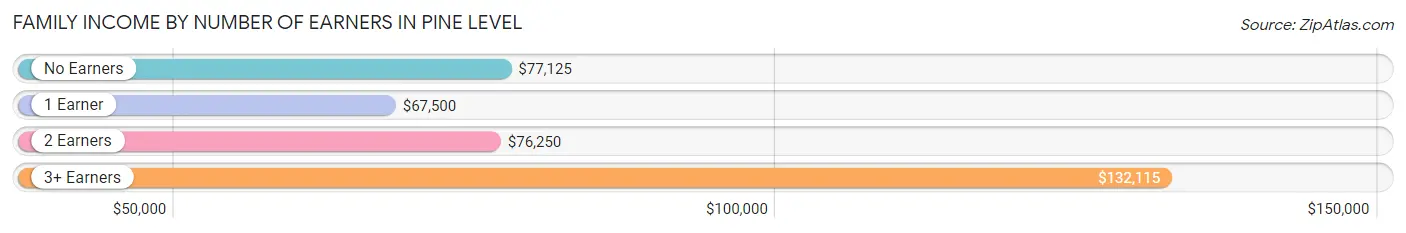
| Number of Earners | # Families | Median Income |
| No Earners | 31 (6.3%) | $77,125 |
| 1 Earner | 190 (38.4%) | $67,500 |
| 2 Earners | 188 (38.0%) | $76,250 |
| 3+ Earners | 86 (17.4%) | $132,115 |
| Total | 495 (100.0%) | $80,943 |
Household Income in Pine Level
Household Income Brackets in Pine Level
With 173 households falling in the category, the $75,000 to $99,999 income range is the most frequent in Pine Level, accounting for 24.1% of all households. In contrast, only 16 households (2.2%) fall into the $200,000+ income bracket, making it the least populous group.
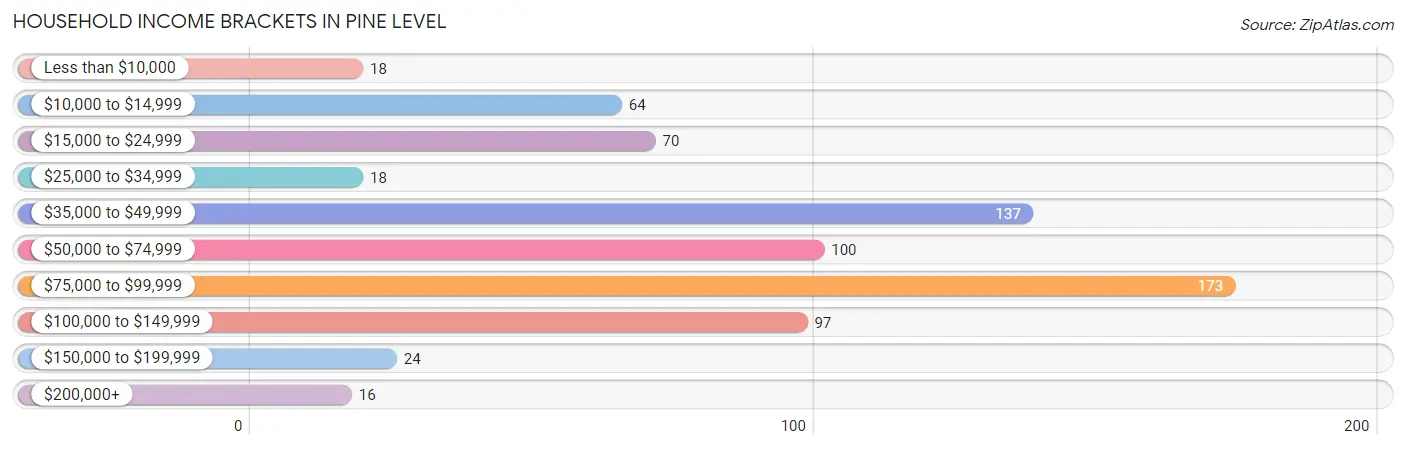
| Income Bracket | # Households | % Households |
| Less than $10,000 | 18 | 2.5% |
| $10,000 to $14,999 | 64 | 8.9% |
| $15,000 to $24,999 | 70 | 9.8% |
| $25,000 to $34,999 | 18 | 2.5% |
| $35,000 to $49,999 | 137 | 19.1% |
| $50,000 to $74,999 | 100 | 13.9% |
| $75,000 to $99,999 | 173 | 24.1% |
| $100,000 to $149,999 | 97 | 13.5% |
| $150,000 to $199,999 | 24 | 3.3% |
| $200,000+ | 16 | 2.2% |
Household Income by Householder Age in Pine Level
The median household income in Pine Level is $65,347, with the highest median household income of $87,448 found in the 25 to 44 years age bracket for the primary householder. A total of 203 households (28.3%) fall into this category. Meanwhile, the 65+ years age bracket for the primary householder has the lowest median household income of $43,063, with 211 households (29.4%) in this group.
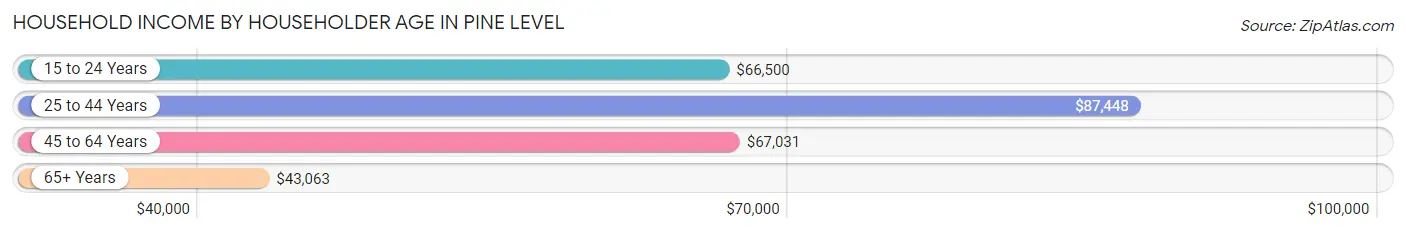
| Income Bracket | # Households | Median Income |
| 15 to 24 Years | 16 (2.2%) | $66,500 |
| 25 to 44 Years | 203 (28.3%) | $87,448 |
| 45 to 64 Years | 287 (40.0%) | $67,031 |
| 65+ Years | 211 (29.4%) | $43,063 |
| Total | 717 (100.0%) | $65,347 |
Poverty in Pine Level
Income Below Poverty by Sex and Age in Pine Level
With 2.9% poverty level for males and 11.7% for females among the residents of Pine Level, 5 year old males and 6 to 11 year old females are the most vulnerable to poverty, with 2 males (33.3%) and 28 females (38.9%) in their respective age groups living below the poverty level.
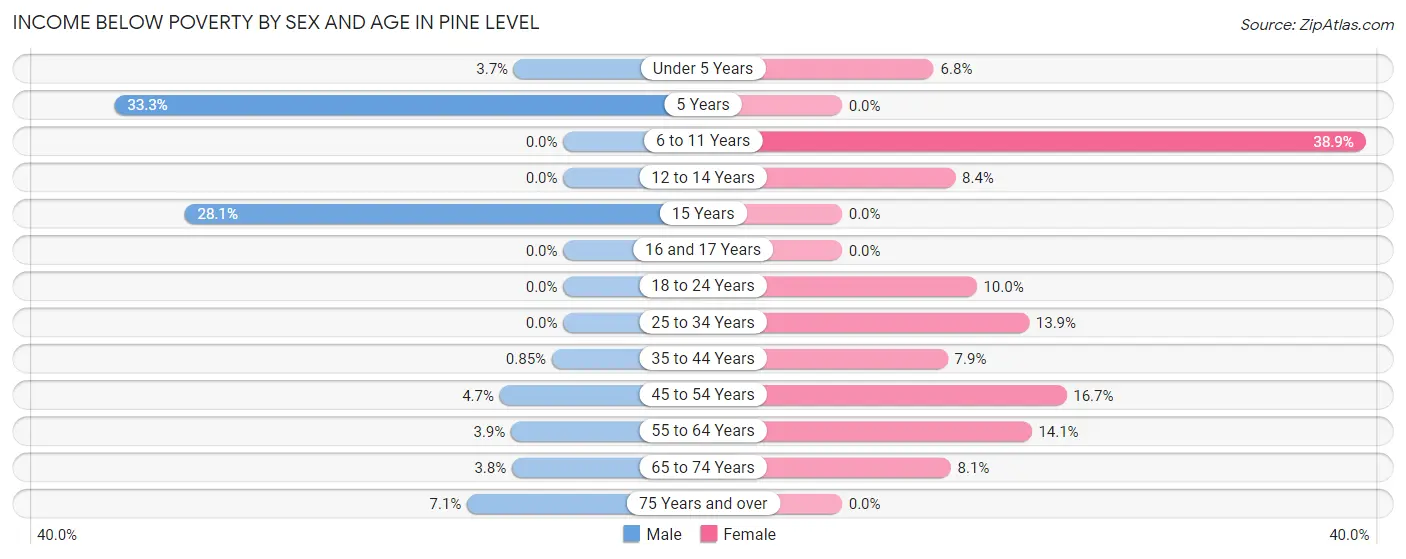
| Age Bracket | Male | Female |
| Under 5 Years | 4 (3.7%) | 3 (6.8%) |
| 5 Years | 2 (33.3%) | 0 (0.0%) |
| 6 to 11 Years | 0 (0.0%) | 28 (38.9%) |
| 12 to 14 Years | 0 (0.0%) | 9 (8.4%) |
| 15 Years | 9 (28.1%) | 0 (0.0%) |
| 16 and 17 Years | 0 (0.0%) | 0 (0.0%) |
| 18 to 24 Years | 0 (0.0%) | 2 (10.0%) |
| 25 to 34 Years | 0 (0.0%) | 20 (13.9%) |
| 35 to 44 Years | 1 (0.9%) | 11 (7.9%) |
| 45 to 54 Years | 5 (4.7%) | 13 (16.7%) |
| 55 to 64 Years | 4 (3.9%) | 29 (14.1%) |
| 65 to 74 Years | 4 (3.8%) | 8 (8.1%) |
| 75 Years and over | 2 (7.1%) | 0 (0.0%) |
| Total | 31 (2.9%) | 123 (11.7%) |
Income Above Poverty by Sex and Age in Pine Level
According to the poverty statistics in Pine Level, males aged 6 to 11 years and females aged 5 years are the age groups that are most secure financially, with 100.0% of males and 100.0% of females in these age groups living above the poverty line.
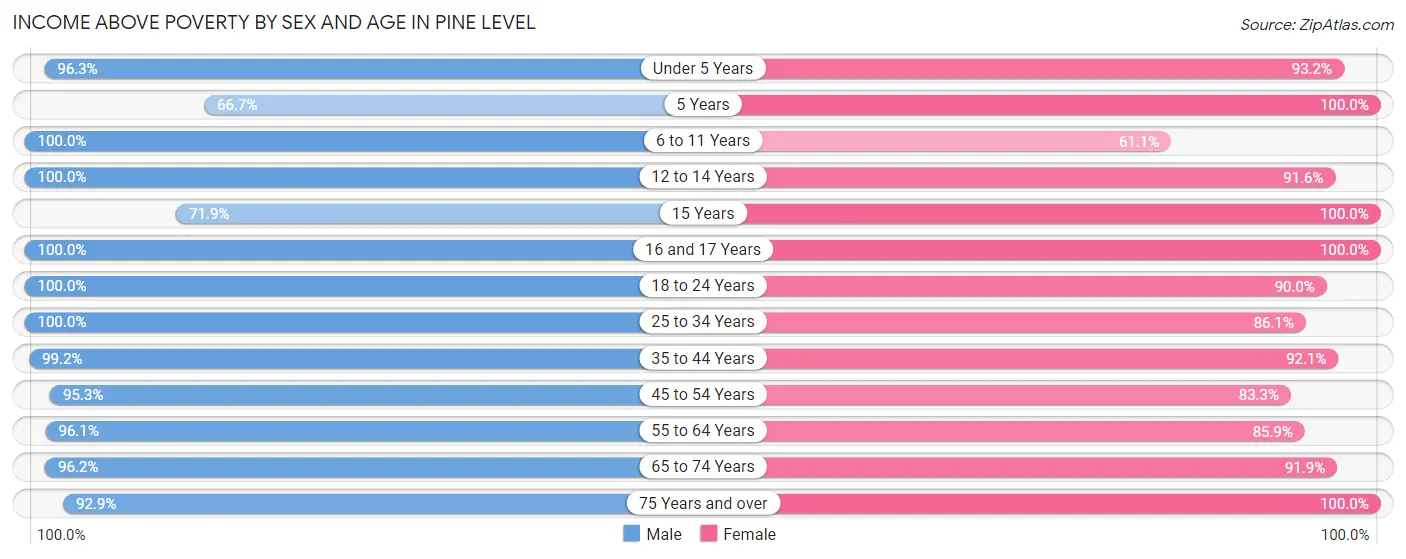
| Age Bracket | Male | Female |
| Under 5 Years | 105 (96.3%) | 41 (93.2%) |
| 5 Years | 4 (66.7%) | 17 (100.0%) |
| 6 to 11 Years | 99 (100.0%) | 44 (61.1%) |
| 12 to 14 Years | 29 (100.0%) | 98 (91.6%) |
| 15 Years | 23 (71.9%) | 12 (100.0%) |
| 16 and 17 Years | 18 (100.0%) | 55 (100.0%) |
| 18 to 24 Years | 117 (100.0%) | 18 (90.0%) |
| 25 to 34 Years | 187 (100.0%) | 124 (86.1%) |
| 35 to 44 Years | 116 (99.2%) | 129 (92.1%) |
| 45 to 54 Years | 101 (95.3%) | 65 (83.3%) |
| 55 to 64 Years | 99 (96.1%) | 177 (85.9%) |
| 65 to 74 Years | 101 (96.2%) | 91 (91.9%) |
| 75 Years and over | 26 (92.9%) | 55 (100.0%) |
| Total | 1,025 (97.1%) | 926 (88.3%) |
Income Below Poverty Among Married-Couple Families in Pine Level
The poverty statistics for married-couple families in Pine Level show that 6.5% or 25 of the total 387 families live below the poverty line. Families with no children have the highest poverty rate of 9.1%, comprising of 20 families. On the other hand, families with 3 or 4 children have the lowest poverty rate of 0.0%, which includes 0 families.
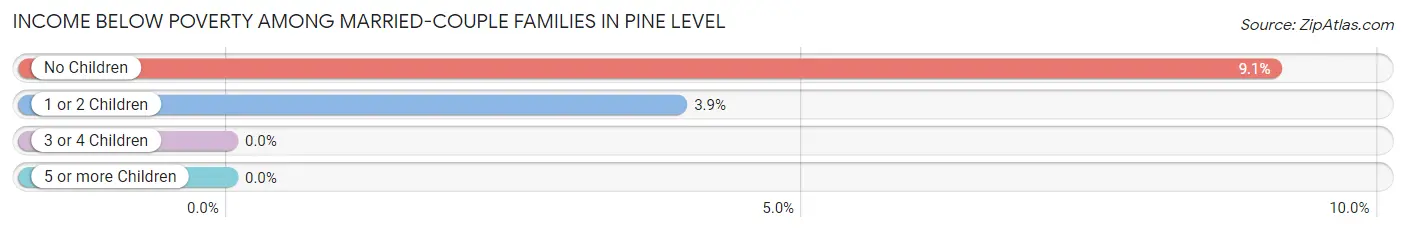
| Children | Above Poverty | Below Poverty |
| No Children | 200 (90.9%) | 20 (9.1%) |
| 1 or 2 Children | 123 (96.1%) | 5 (3.9%) |
| 3 or 4 Children | 39 (100.0%) | 0 (0.0%) |
| 5 or more Children | 0 (0.0%) | 0 (0.0%) |
| Total | 362 (93.5%) | 25 (6.5%) |
Income Below Poverty Among Single-Parent Households in Pine Level
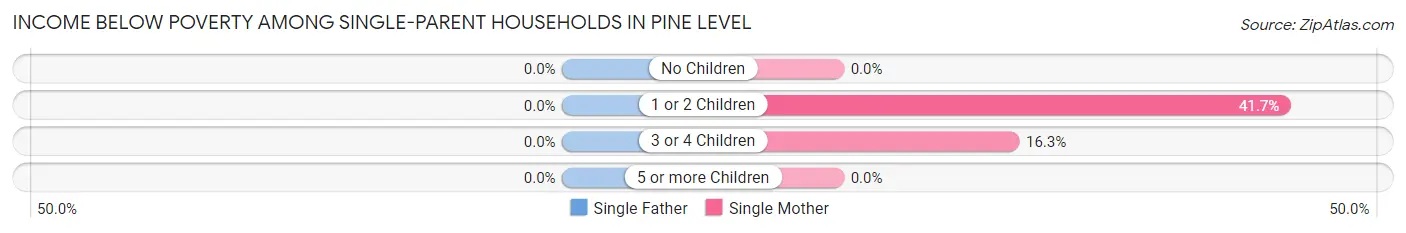
| Children | Single Father | Single Mother |
| No Children | 0 (0.0%) | 0 (0.0%) |
| 1 or 2 Children | 0 (0.0%) | 10 (41.7%) |
| 3 or 4 Children | 0 (0.0%) | 8 (16.3%) |
| 5 or more Children | 0 (0.0%) | 0 (0.0%) |
| Total | 0 (0.0%) | 18 (20.7%) |
Income Below Poverty Among Married-Couple vs Single-Parent Households in Pine Level
The poverty data for Pine Level shows that 25 of the married-couple family households (6.5%) and 18 of the single-parent households (16.7%) are living below the poverty level. Within the married-couple family households, those with no children have the highest poverty rate, with 20 households (9.1%) falling below the poverty line. Among the single-parent households, those with 1 or 2 children have the highest poverty rate, with 10 household (27.8%) living below poverty.
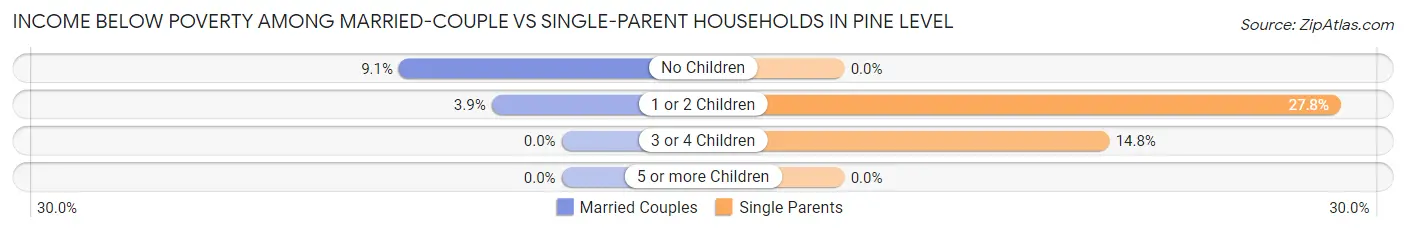
| Children | Married-Couple Families | Single-Parent Households |
| No Children | 20 (9.1%) | 0 (0.0%) |
| 1 or 2 Children | 5 (3.9%) | 10 (27.8%) |
| 3 or 4 Children | 0 (0.0%) | 8 (14.8%) |
| 5 or more Children | 0 (0.0%) | 0 (0.0%) |
| Total | 25 (6.5%) | 18 (16.7%) |
Race in Pine Level
The most populous races in Pine Level are White / Caucasian (1,711 | 80.9%), Hispanic or Latino (377 | 17.8%), and Two or more Races (216 | 10.2%).
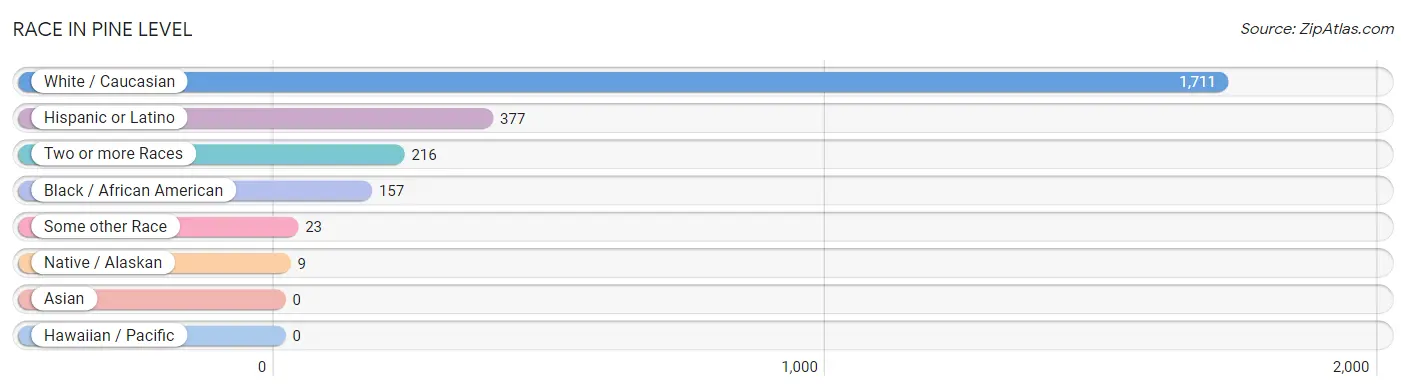
| Race | # Population | % Population |
| Asian | 0 | 0.0% |
| Black / African American | 157 | 7.4% |
| Hawaiian / Pacific | 0 | 0.0% |
| Hispanic or Latino | 377 | 17.8% |
| Native / Alaskan | 9 | 0.4% |
| White / Caucasian | 1,711 | 80.9% |
| Two or more Races | 216 | 10.2% |
| Some other Race | 23 | 1.1% |
| Total | 2,116 | 100.0% |
Ancestry in Pine Level
The most populous ancestries reported in Pine Level are American (322 | 15.2%), Mexican (250 | 11.8%), English (199 | 9.4%), German (76 | 3.6%), and Puerto Rican (69 | 3.3%), together accounting for 43.3% of all Pine Level residents.
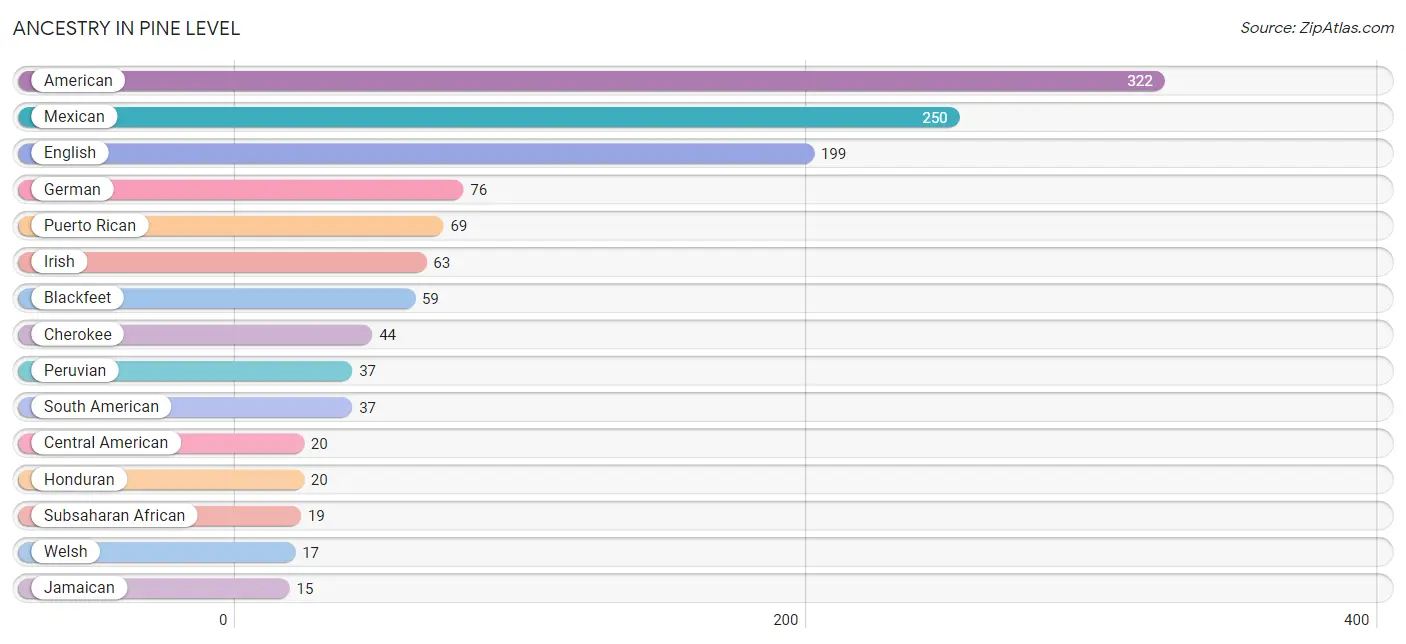
| Ancestry | # Population | % Population |
| African | 6 | 0.3% |
| American | 322 | 15.2% |
| Blackfeet | 59 | 2.8% |
| Canadian | 12 | 0.6% |
| Central American | 20 | 0.9% |
| Cherokee | 44 | 2.1% |
| Croatian | 7 | 0.3% |
| Dutch | 4 | 0.2% |
| English | 199 | 9.4% |
| Ethiopian | 11 | 0.5% |
| French | 7 | 0.3% |
| German | 76 | 3.6% |
| Honduran | 20 | 0.9% |
| Hungarian | 4 | 0.2% |
| Irish | 63 | 3.0% |
| Italian | 6 | 0.3% |
| Jamaican | 15 | 0.7% |
| Mexican | 250 | 11.8% |
| Nigerian | 2 | 0.1% |
| Peruvian | 37 | 1.8% |
| Puerto Rican | 69 | 3.3% |
| Scotch-Irish | 11 | 0.5% |
| Scottish | 12 | 0.6% |
| South American | 37 | 1.8% |
| Spanish | 1 | 0.1% |
| Subsaharan African | 19 | 0.9% |
| Welsh | 17 | 0.8% | View All 27 Rows |
Immigrants in Pine Level
The most numerous immigrant groups reported in Pine Level came from Latin America (83 | 3.9%), Central America (61 | 2.9%), Mexico (50 | 2.4%), Peru (14 | 0.7%), and South America (14 | 0.7%), together accounting for 10.5% of all Pine Level residents.
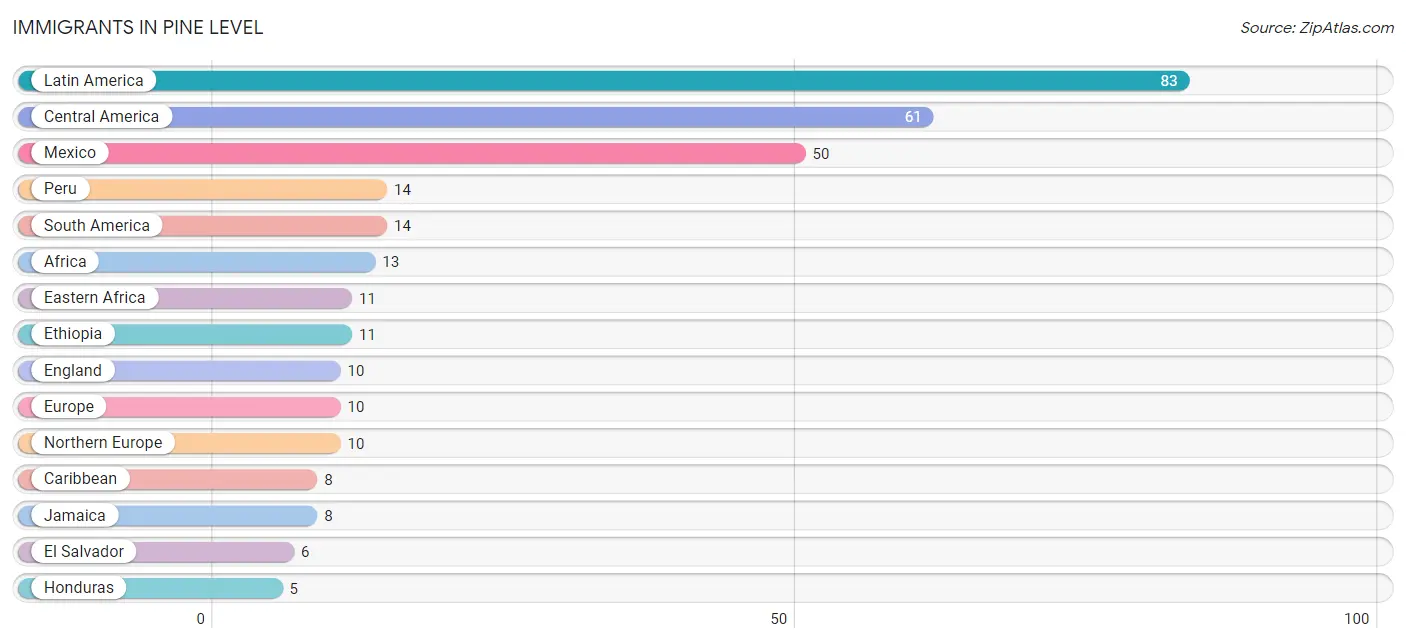
| Immigration Origin | # Population | % Population |
| Africa | 13 | 0.6% |
| Caribbean | 8 | 0.4% |
| Central America | 61 | 2.9% |
| Eastern Africa | 11 | 0.5% |
| El Salvador | 6 | 0.3% |
| England | 10 | 0.5% |
| Ethiopia | 11 | 0.5% |
| Europe | 10 | 0.5% |
| Honduras | 5 | 0.2% |
| Jamaica | 8 | 0.4% |
| Latin America | 83 | 3.9% |
| Mexico | 50 | 2.4% |
| Nigeria | 2 | 0.1% |
| Northern Europe | 10 | 0.5% |
| Peru | 14 | 0.7% |
| South America | 14 | 0.7% |
| Western Africa | 2 | 0.1% | View All 17 Rows |
Sex and Age in Pine Level
Sex and Age in Pine Level
The most populous age groups in Pine Level are 30 to 34 Years (158 | 15.0%) for men and 10 to 14 Years (143 | 13.5%) for women.
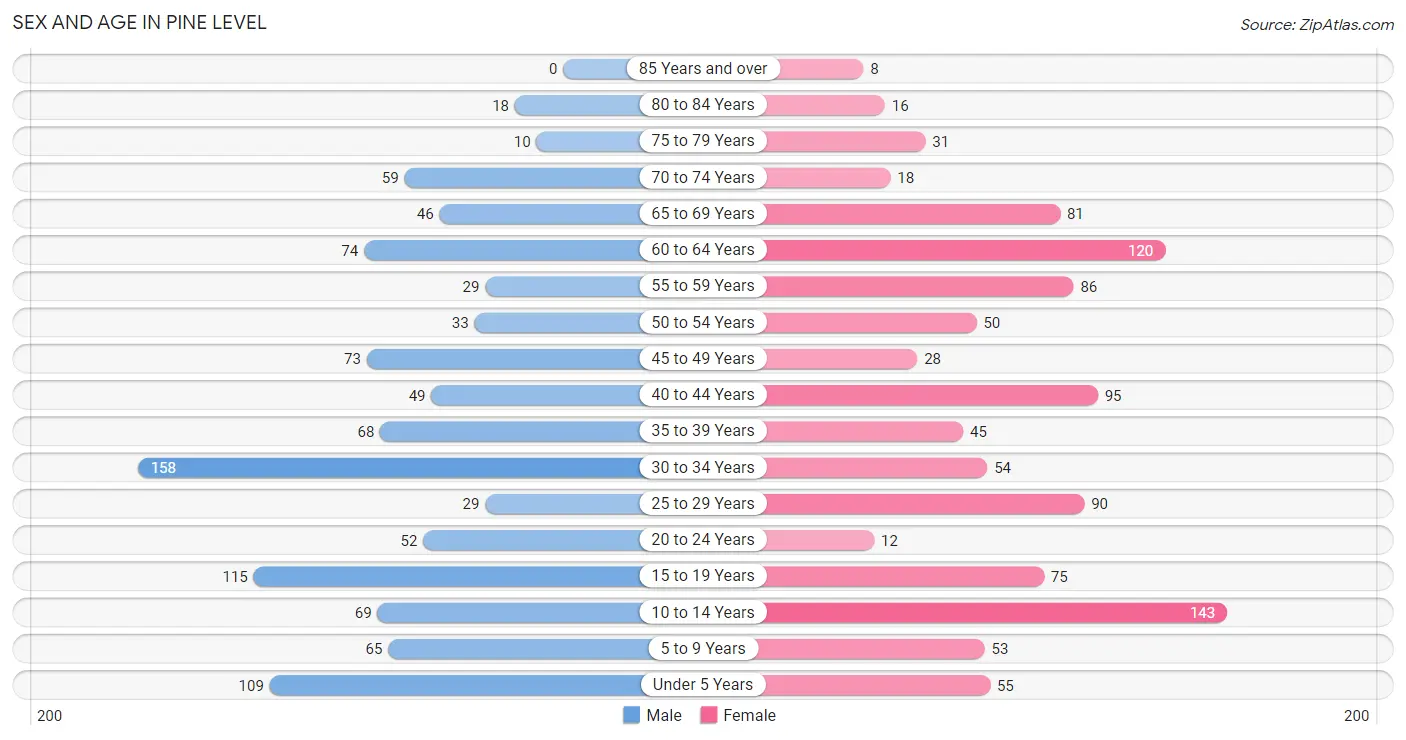
| Age Bracket | Male | Female |
| Under 5 Years | 109 (10.3%) | 55 (5.2%) |
| 5 to 9 Years | 65 (6.2%) | 53 (5.0%) |
| 10 to 14 Years | 69 (6.5%) | 143 (13.5%) |
| 15 to 19 Years | 115 (10.9%) | 75 (7.1%) |
| 20 to 24 Years | 52 (4.9%) | 12 (1.1%) |
| 25 to 29 Years | 29 (2.8%) | 90 (8.5%) |
| 30 to 34 Years | 158 (15.0%) | 54 (5.1%) |
| 35 to 39 Years | 68 (6.4%) | 45 (4.3%) |
| 40 to 44 Years | 49 (4.6%) | 95 (9.0%) |
| 45 to 49 Years | 73 (6.9%) | 28 (2.6%) |
| 50 to 54 Years | 33 (3.1%) | 50 (4.7%) |
| 55 to 59 Years | 29 (2.8%) | 86 (8.1%) |
| 60 to 64 Years | 74 (7.0%) | 120 (11.3%) |
| 65 to 69 Years | 46 (4.4%) | 81 (7.6%) |
| 70 to 74 Years | 59 (5.6%) | 18 (1.7%) |
| 75 to 79 Years | 10 (0.9%) | 31 (2.9%) |
| 80 to 84 Years | 18 (1.7%) | 16 (1.5%) |
| 85 Years and over | 0 (0.0%) | 8 (0.7%) |
| Total | 1,056 (100.0%) | 1,060 (100.0%) |
Families and Households in Pine Level
Median Family Size in Pine Level
The median family size in Pine Level is 3.72 persons per family, with single female/mother families (87 | 17.6%) accounting for the largest median family size of 5.26 persons per family. On the other hand, single male/father families (21 | 4.2%) represent the smallest median family size with 3.10 persons per family.
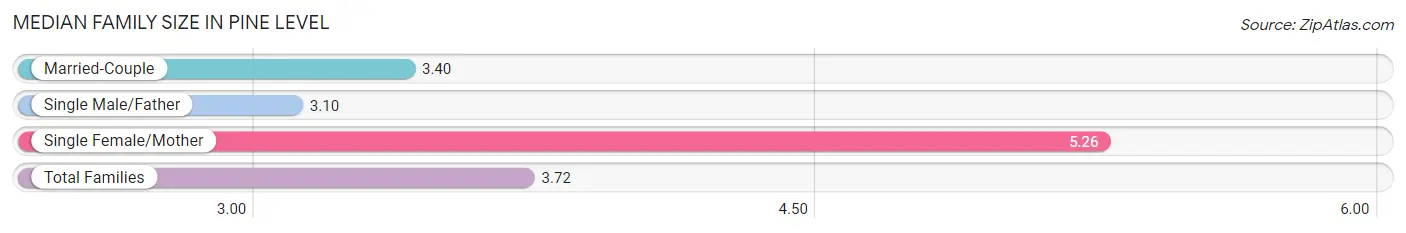
| Family Type | # Families | Family Size |
| Married-Couple | 387 (78.2%) | 3.40 |
| Single Male/Father | 21 (4.2%) | 3.10 |
| Single Female/Mother | 87 (17.6%) | 5.26 |
| Total Families | 495 (100.0%) | 3.72 |
Median Household Size in Pine Level
The median household size in Pine Level is 2.94 persons per household, with single female/mother households (87 | 12.1%) accounting for the largest median household size of 5.29 persons per household. non-family households (222 | 31.0%) represent the smallest median household size with 1.06 persons per household.
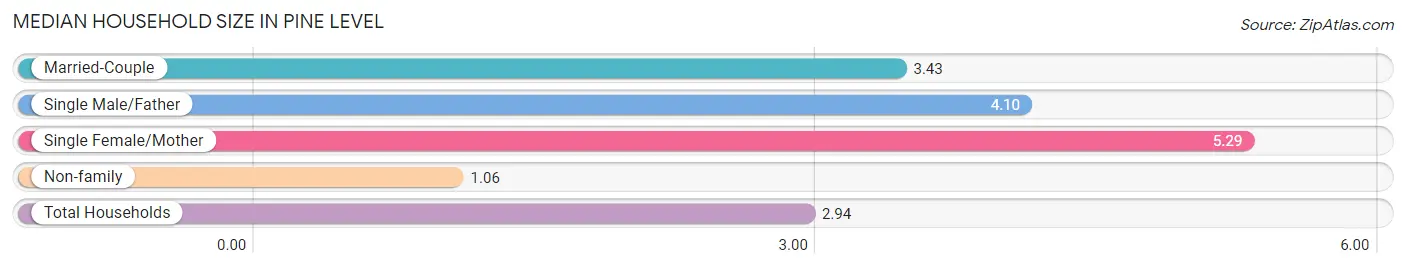
| Household Type | # Households | Household Size |
| Married-Couple | 387 (54.0%) | 3.43 |
| Single Male/Father | 21 (2.9%) | 4.10 |
| Single Female/Mother | 87 (12.1%) | 5.29 |
| Non-family | 222 (31.0%) | 1.06 |
| Total Households | 717 (100.0%) | 2.94 |
Household Size by Marriage Status in Pine Level
Out of a total of 717 households in Pine Level, 495 (69.0%) are family households, while 222 (31.0%) are nonfamily households. The most numerous type of family households are 2-person households, comprising 176, and the most common type of nonfamily households are 1-person households, comprising 210.
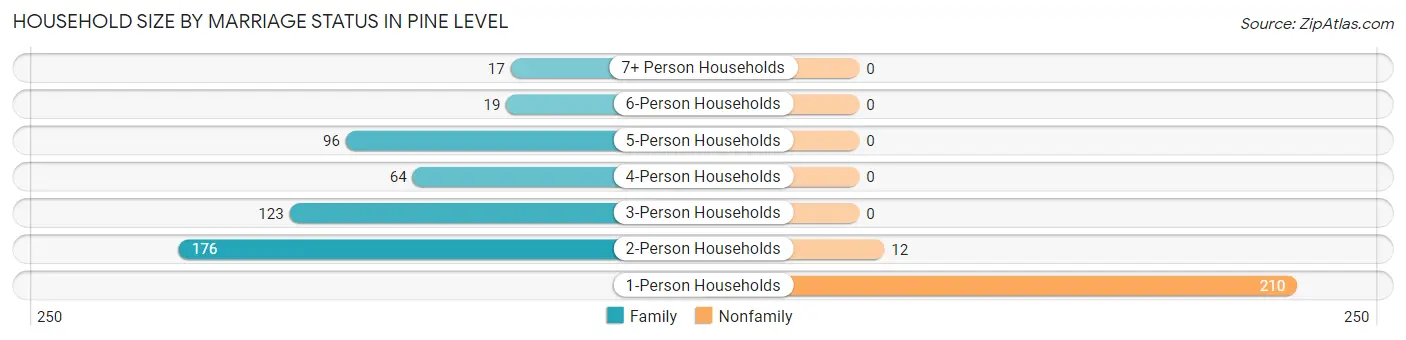
| Household Size | Family Households | Nonfamily Households |
| 1-Person Households | - | 210 (29.3%) |
| 2-Person Households | 176 (24.5%) | 12 (1.7%) |
| 3-Person Households | 123 (17.2%) | 0 (0.0%) |
| 4-Person Households | 64 (8.9%) | 0 (0.0%) |
| 5-Person Households | 96 (13.4%) | 0 (0.0%) |
| 6-Person Households | 19 (2.6%) | 0 (0.0%) |
| 7+ Person Households | 17 (2.4%) | 0 (0.0%) |
| Total | 495 (69.0%) | 222 (31.0%) |
Female Fertility in Pine Level
Fertility by Age in Pine Level
Average fertility rate in Pine Level is 27.0 births per 1,000 women. Women in the age bracket of 20 to 34 years have the highest fertility rate with 64.0 births per 1,000 women. Women in the age bracket of 20 to 34 years acount for 90.9% of all women with births.
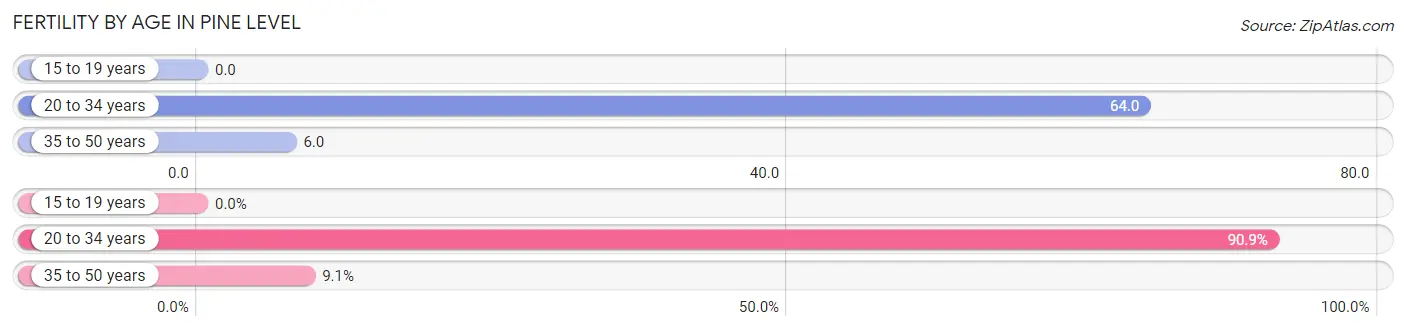
| Age Bracket | Women with Births | Births / 1,000 Women |
| 15 to 19 years | 0 (0.0%) | 0.0 |
| 20 to 34 years | 10 (90.9%) | 64.0 |
| 35 to 50 years | 1 (9.1%) | 6.0 |
| Total | 11 (100.0%) | 27.0 |
Fertility by Age by Marriage Status in Pine Level
45.5% of women with births (11) in Pine Level are married. The highest percentage of unmarried women with births falls into 20 to 34 years age bracket with 60.0% of them unmarried at the time of birth, while the lowest percentage of unmarried women with births belong to 35 to 50 years age bracket with 0.0% of them unmarried.
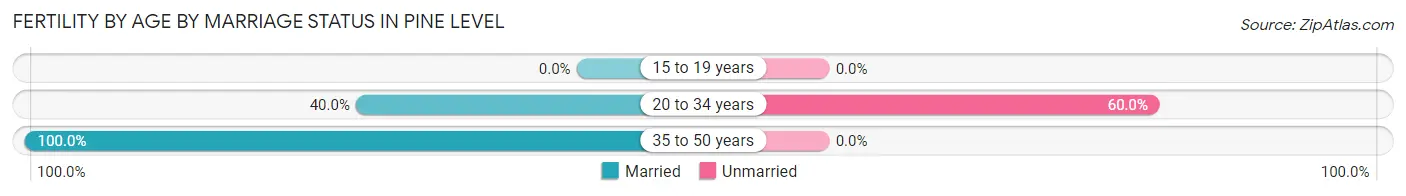
| Age Bracket | Married | Unmarried |
| 15 to 19 years | 0 (0.0%) | 0 (0.0%) |
| 20 to 34 years | 4 (40.0%) | 6 (60.0%) |
| 35 to 50 years | 1 (100.0%) | 0 (0.0%) |
| Total | 5 (45.5%) | 6 (54.5%) |
Fertility by Education in Pine Level
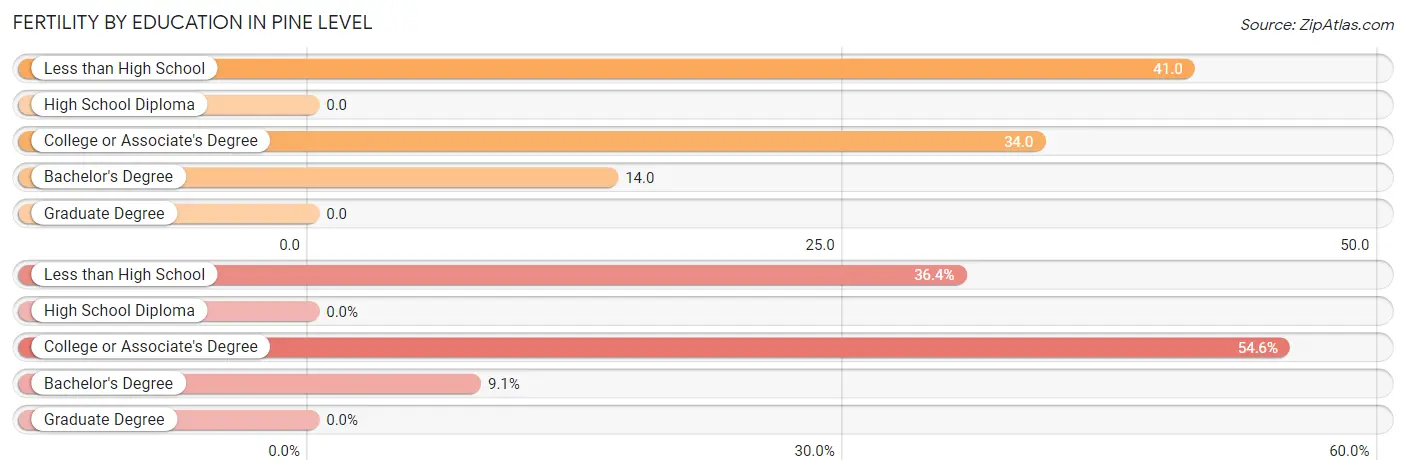
| Educational Attainment | Women with Births | Births / 1,000 Women |
| Less than High School | 4 (36.4%) | 41.0 |
| High School Diploma | 0 (0.0%) | 0.0 |
| College or Associate's Degree | 6 (54.5%) | 34.0 |
| Bachelor's Degree | 1 (9.1%) | 14.0 |
| Graduate Degree | 0 (0.0%) | 0.0 |
| Total | 11 (100.0%) | 27.0 |
Fertility by Education by Marriage Status in Pine Level
54.5% of women with births in Pine Level are unmarried. Women with the educational attainment of bachelor's degree are most likely to be married with 100.0% of them married at childbirth, while women with the educational attainment of less than high school are least likely to be married with 100.0% of them unmarried at childbirth.
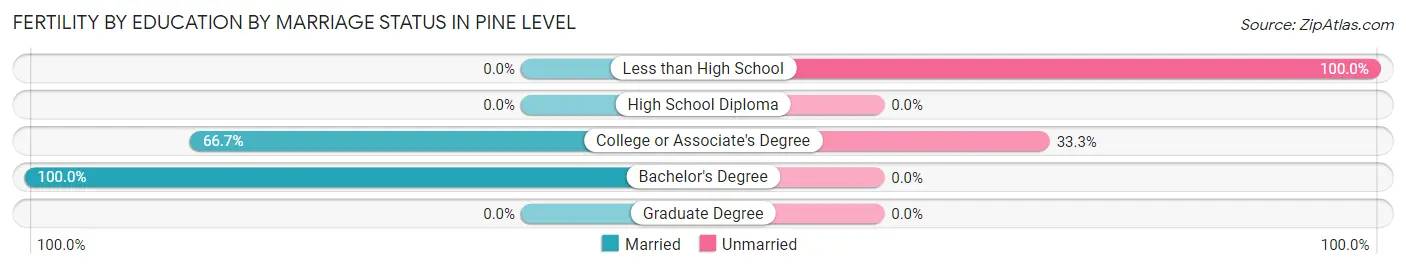
| Educational Attainment | Married | Unmarried |
| Less than High School | 0 (0.0%) | 4 (100.0%) |
| High School Diploma | 0 (0.0%) | 0 (0.0%) |
| College or Associate's Degree | 4 (66.7%) | 2 (33.3%) |
| Bachelor's Degree | 1 (100.0%) | 0 (0.0%) |
| Graduate Degree | 0 (0.0%) | 0 (0.0%) |
| Total | 5 (45.5%) | 6 (54.5%) |
Employment Characteristics in Pine Level
Employment by Class of Employer in Pine Level
Among the 980 employed individuals in Pine Level, private company employees (621 | 63.4%), self-employed (not incorporated) (85 | 8.7%), and self-employed (incorporated) (82 | 8.4%) make up the most common classes of employment.
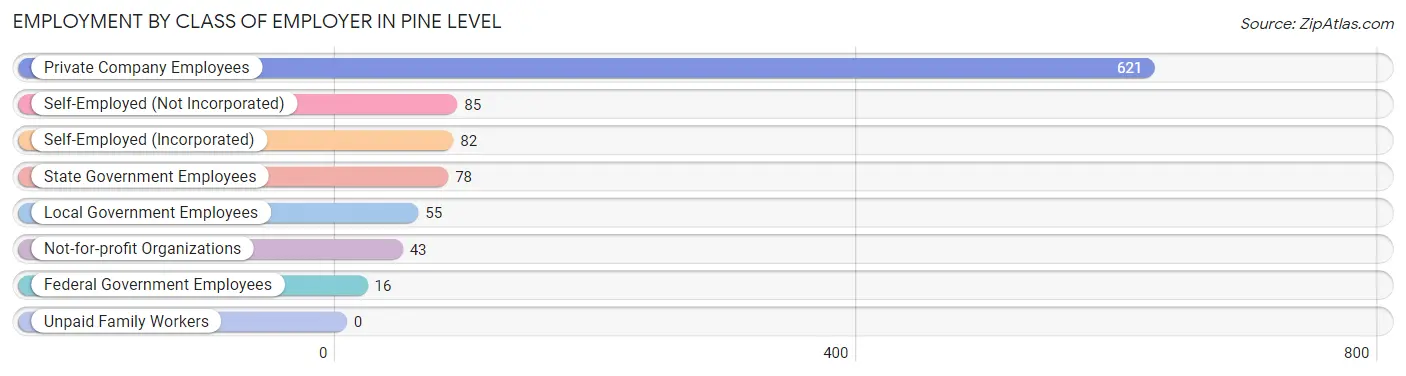
| Employer Class | # Employees | % Employees |
| Private Company Employees | 621 | 63.4% |
| Self-Employed (Incorporated) | 82 | 8.4% |
| Self-Employed (Not Incorporated) | 85 | 8.7% |
| Not-for-profit Organizations | 43 | 4.4% |
| Local Government Employees | 55 | 5.6% |
| State Government Employees | 78 | 8.0% |
| Federal Government Employees | 16 | 1.6% |
| Unpaid Family Workers | 0 | 0.0% |
| Total | 980 | 100.0% |
Employment Status by Age in Pine Level
According to the labor force statistics for Pine Level, out of the total population over 16 years of age (1,578), 64.4% or 1,016 individuals are in the labor force, with 3.2% or 33 of them unemployed. The age group with the highest labor force participation rate is 45 to 54 years, with 95.7% or 176 individuals in the labor force. Within the labor force, the 30 to 34 years age range has the highest percentage of unemployed individuals, with 15.6% or 17 of them being unemployed.
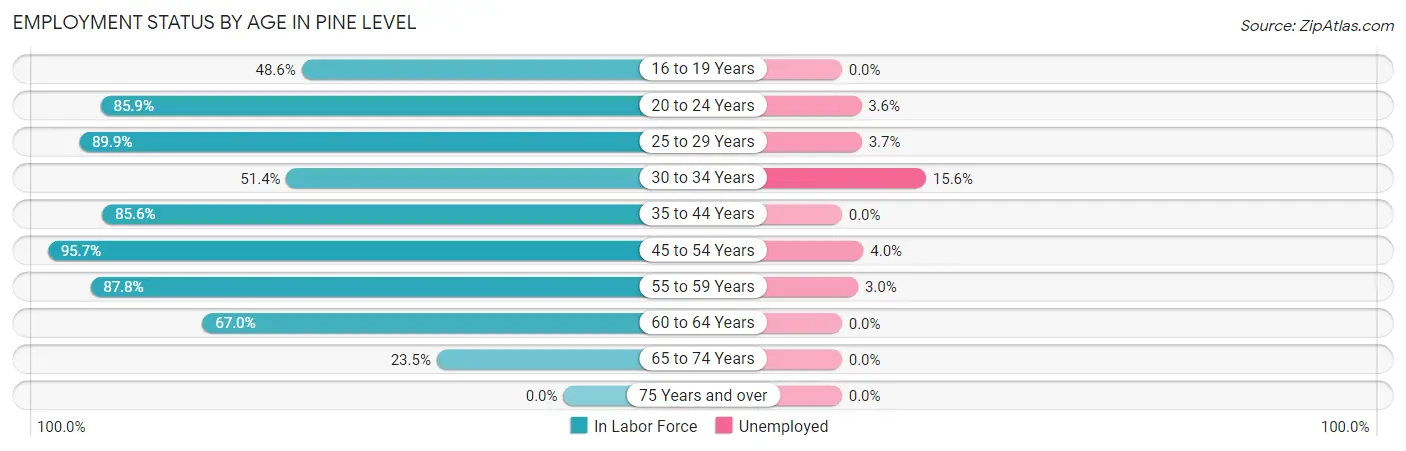
| Age Bracket | In Labor Force | Unemployed |
| 16 to 19 Years | 71 (48.6%) | 0 (0.0%) |
| 20 to 24 Years | 55 (85.9%) | 2 (3.6%) |
| 25 to 29 Years | 107 (89.9%) | 4 (3.7%) |
| 30 to 34 Years | 109 (51.4%) | 17 (15.6%) |
| 35 to 44 Years | 220 (85.6%) | 0 (0.0%) |
| 45 to 54 Years | 176 (95.7%) | 7 (4.0%) |
| 55 to 59 Years | 101 (87.8%) | 3 (3.0%) |
| 60 to 64 Years | 130 (67.0%) | 0 (0.0%) |
| 65 to 74 Years | 48 (23.5%) | 0 (0.0%) |
| 75 Years and over | 0 (0.0%) | 0 (0.0%) |
| Total | 1,016 (64.4%) | 33 (3.2%) |
Employment Status by Educational Attainment in Pine Level
According to labor force statistics for Pine Level, 78.0% of individuals (843) out of the total population between 25 and 64 years of age (1,081) are in the labor force, with 3.7% or 31 of them being unemployed. The group with the highest labor force participation rate are those with the educational attainment of bachelor's degree or higher, with 92.1% or 186 individuals in the labor force. Within the labor force, individuals with less than high school education have the highest percentage of unemployment, with 8.9% or 7 of them being unemployed.
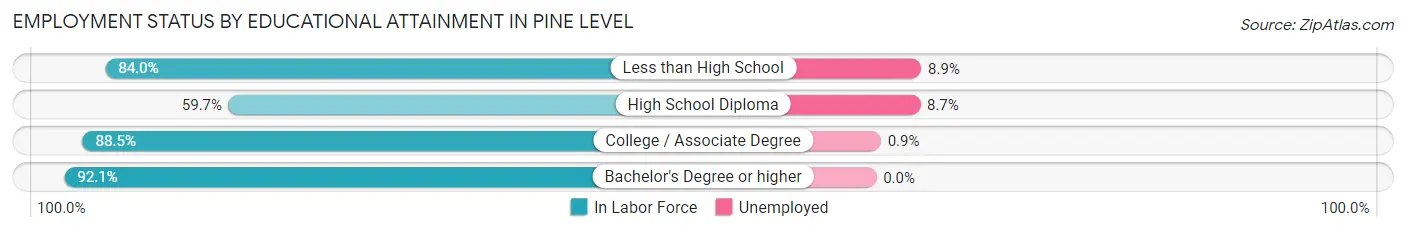
| Educational Attainment | In Labor Force | Unemployed |
| Less than High School | 79 (84.0%) | 8 (8.9%) |
| High School Diploma | 241 (59.7%) | 35 (8.7%) |
| College / Associate Degree | 337 (88.5%) | 3 (0.9%) |
| Bachelor's Degree or higher | 186 (92.1%) | 0 (0.0%) |
| Total | 843 (78.0%) | 40 (3.7%) |
Employment Occupations by Sex in Pine Level
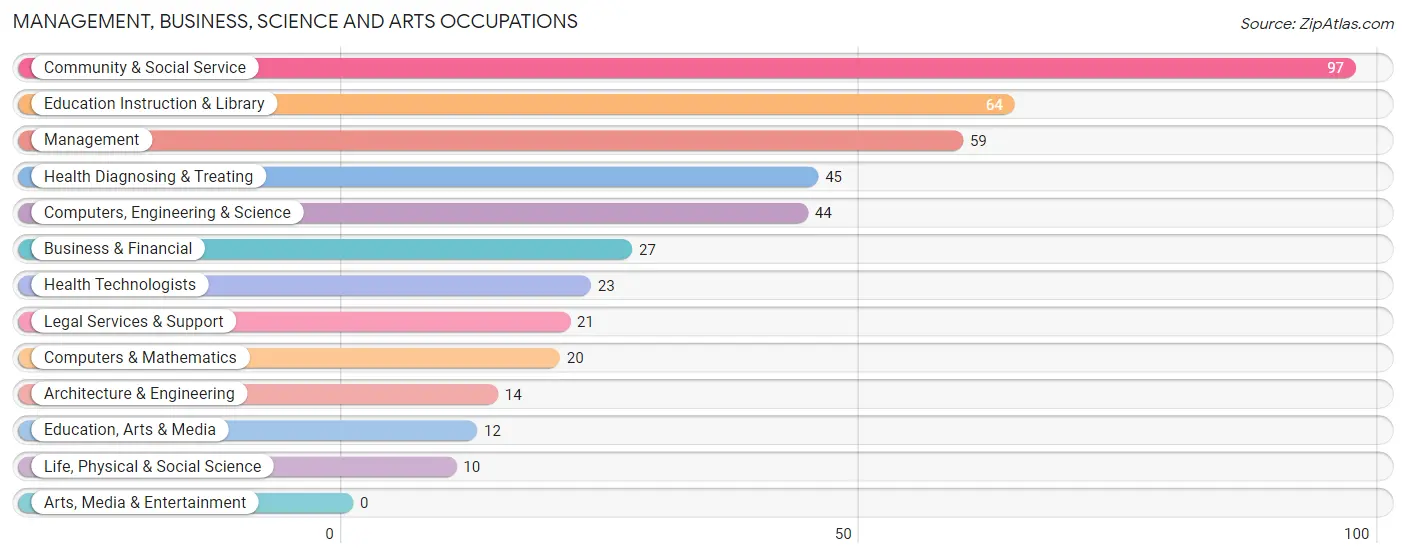
Management, Business, Science and Arts Occupations
The most common Management, Business, Science and Arts occupations in Pine Level are Community & Social Service (97 | 9.9%), Education Instruction & Library (64 | 6.5%), Management (59 | 6.0%), Health Diagnosing & Treating (45 | 4.6%), and Computers, Engineering & Science (44 | 4.5%).
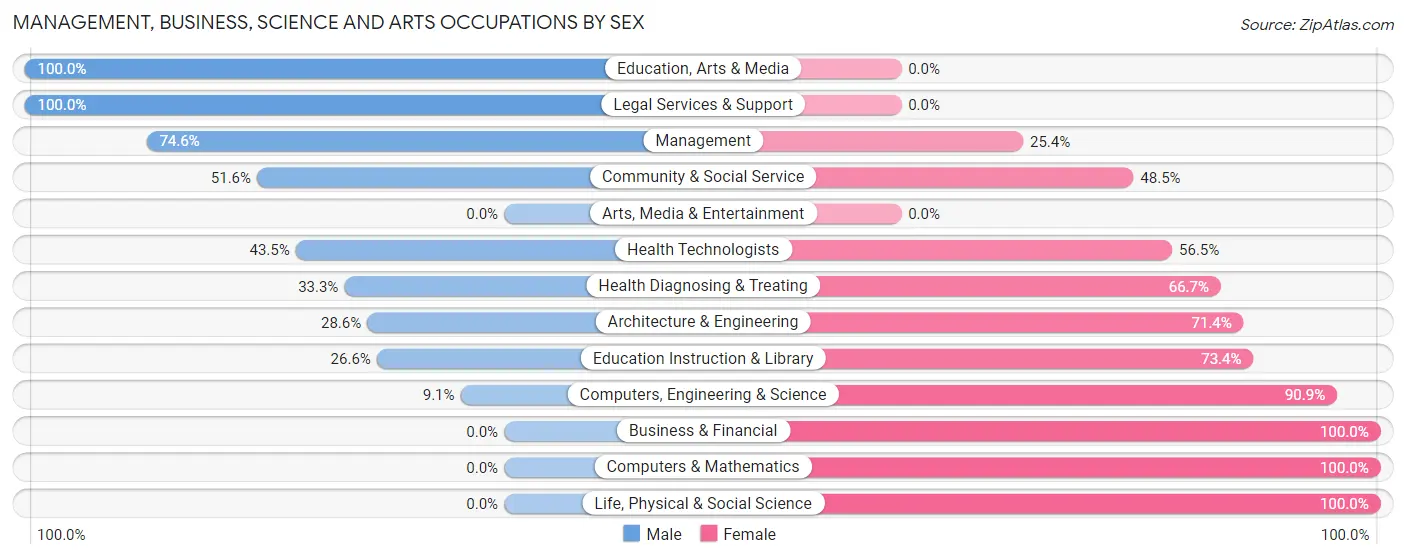
Management, Business, Science and Arts Occupations by Sex
Within the Management, Business, Science and Arts occupations in Pine Level, the most male-oriented occupations are Education, Arts & Media (100.0%), Legal Services & Support (100.0%), and Management (74.6%), while the most female-oriented occupations are Business & Financial (100.0%), Computers & Mathematics (100.0%), and Life, Physical & Social Science (100.0%).
| Occupation | Male | Female |
| Management | 44 (74.6%) | 15 (25.4%) |
| Business & Financial | 0 (0.0%) | 27 (100.0%) |
| Computers, Engineering & Science | 4 (9.1%) | 40 (90.9%) |
| Computers & Mathematics | 0 (0.0%) | 20 (100.0%) |
| Architecture & Engineering | 4 (28.6%) | 10 (71.4%) |
| Life, Physical & Social Science | 0 (0.0%) | 10 (100.0%) |
| Community & Social Service | 50 (51.5%) | 47 (48.4%) |
| Education, Arts & Media | 12 (100.0%) | 0 (0.0%) |
| Legal Services & Support | 21 (100.0%) | 0 (0.0%) |
| Education Instruction & Library | 17 (26.6%) | 47 (73.4%) |
| Arts, Media & Entertainment | 0 (0.0%) | 0 (0.0%) |
| Health Diagnosing & Treating | 15 (33.3%) | 30 (66.7%) |
| Health Technologists | 10 (43.5%) | 13 (56.5%) |
| Total (Category) | 113 (41.5%) | 159 (58.5%) |
| Total (Overall) | 499 (50.7%) | 485 (49.3%) |
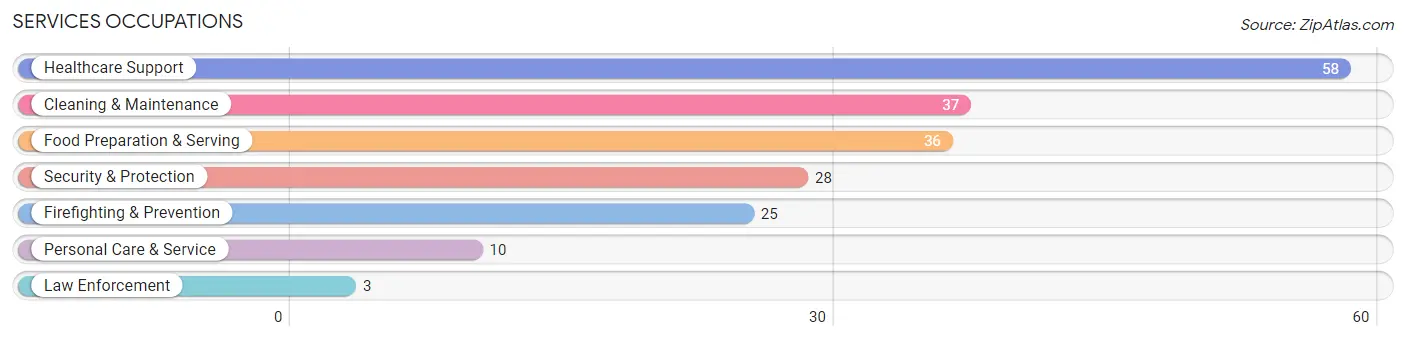
Services Occupations
The most common Services occupations in Pine Level are Healthcare Support (58 | 5.9%), Cleaning & Maintenance (37 | 3.8%), Food Preparation & Serving (36 | 3.7%), Security & Protection (28 | 2.9%), and Firefighting & Prevention (25 | 2.5%).
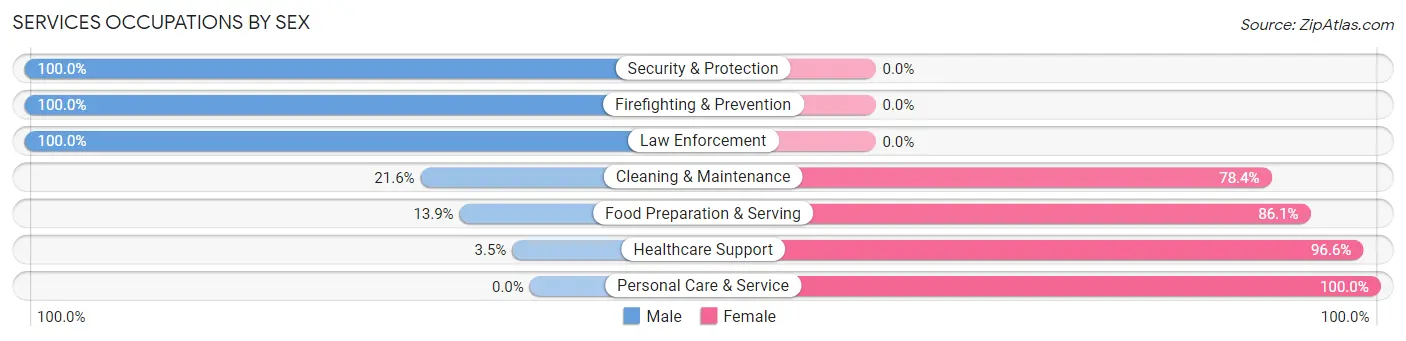
Services Occupations by Sex
Within the Services occupations in Pine Level, the most male-oriented occupations are Security & Protection (100.0%), Firefighting & Prevention (100.0%), and Law Enforcement (100.0%), while the most female-oriented occupations are Personal Care & Service (100.0%), Healthcare Support (96.6%), and Food Preparation & Serving (86.1%).
| Occupation | Male | Female |
| Healthcare Support | 2 (3.5%) | 56 (96.6%) |
| Security & Protection | 28 (100.0%) | 0 (0.0%) |
| Firefighting & Prevention | 25 (100.0%) | 0 (0.0%) |
| Law Enforcement | 3 (100.0%) | 0 (0.0%) |
| Food Preparation & Serving | 5 (13.9%) | 31 (86.1%) |
| Cleaning & Maintenance | 8 (21.6%) | 29 (78.4%) |
| Personal Care & Service | 0 (0.0%) | 10 (100.0%) |
| Total (Category) | 43 (25.4%) | 126 (74.6%) |
| Total (Overall) | 499 (50.7%) | 485 (49.3%) |
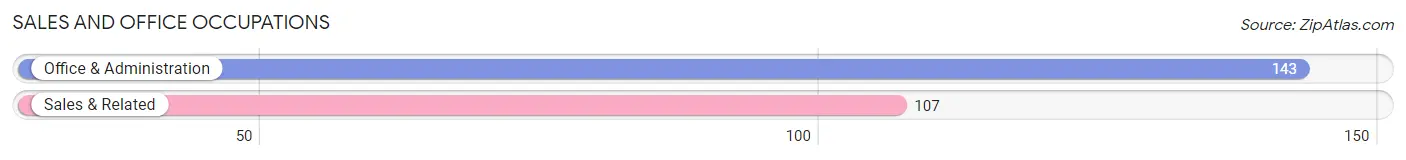
Sales and Office Occupations
The most common Sales and Office occupations in Pine Level are Office & Administration (143 | 14.5%), and Sales & Related (107 | 10.9%).
Sales and Office Occupations by Sex
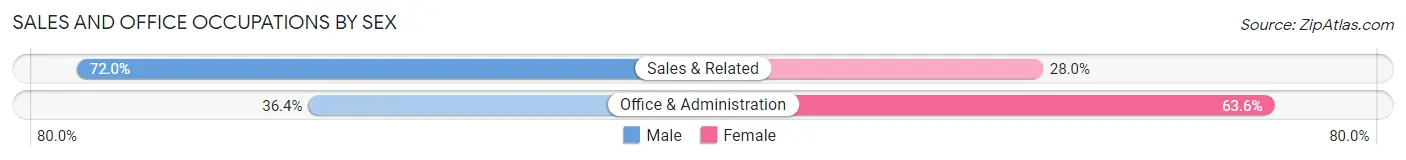
| Occupation | Male | Female |
| Sales & Related | 77 (72.0%) | 30 (28.0%) |
| Office & Administration | 52 (36.4%) | 91 (63.6%) |
| Total (Category) | 129 (51.6%) | 121 (48.4%) |
| Total (Overall) | 499 (50.7%) | 485 (49.3%) |
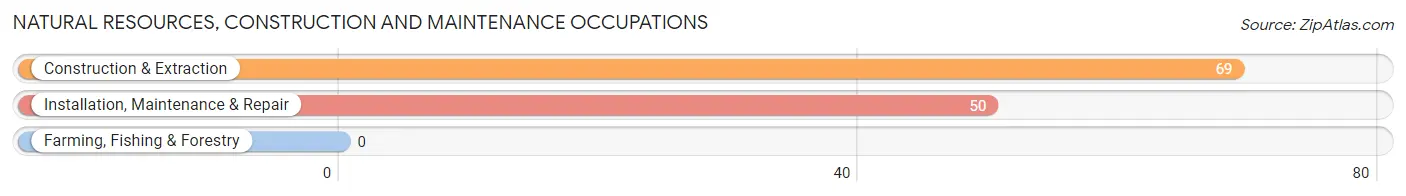
Natural Resources, Construction and Maintenance Occupations
The most common Natural Resources, Construction and Maintenance occupations in Pine Level are Construction & Extraction (69 | 7.0%), and Installation, Maintenance & Repair (50 | 5.1%).
Natural Resources, Construction and Maintenance Occupations by Sex
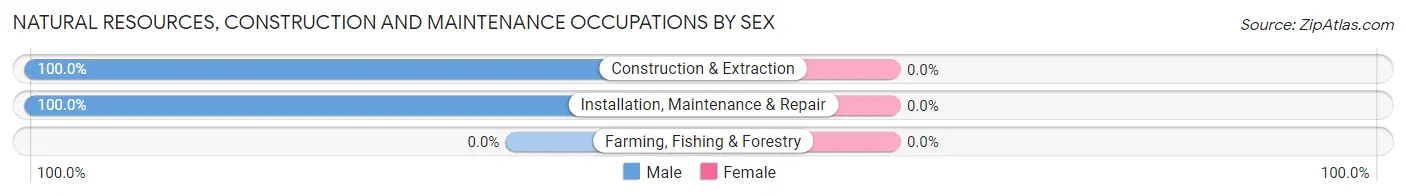
| Occupation | Male | Female |
| Farming, Fishing & Forestry | 0 (0.0%) | 0 (0.0%) |
| Construction & Extraction | 69 (100.0%) | 0 (0.0%) |
| Installation, Maintenance & Repair | 50 (100.0%) | 0 (0.0%) |
| Total (Category) | 119 (100.0%) | 0 (0.0%) |
| Total (Overall) | 499 (50.7%) | 485 (49.3%) |
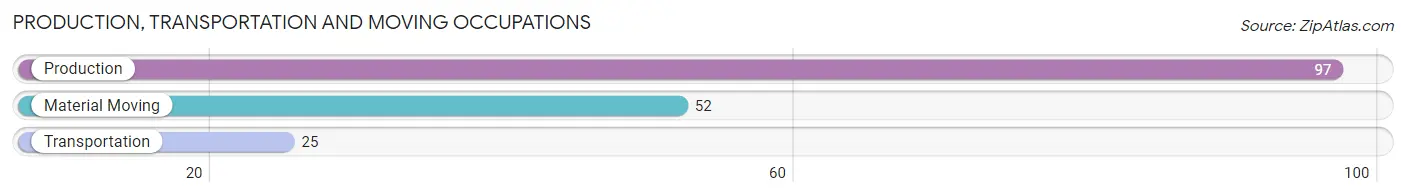
Production, Transportation and Moving Occupations
The most common Production, Transportation and Moving occupations in Pine Level are Production (97 | 9.9%), Material Moving (52 | 5.3%), and Transportation (25 | 2.5%).
Production, Transportation and Moving Occupations by Sex
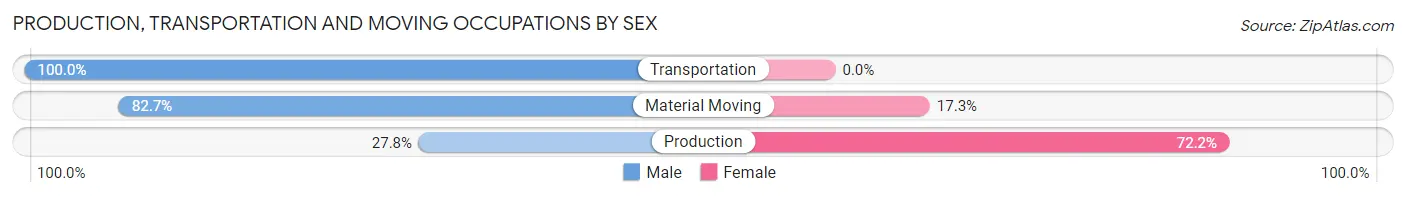
| Occupation | Male | Female |
| Production | 27 (27.8%) | 70 (72.2%) |
| Transportation | 25 (100.0%) | 0 (0.0%) |
| Material Moving | 43 (82.7%) | 9 (17.3%) |
| Total (Category) | 95 (54.6%) | 79 (45.4%) |
| Total (Overall) | 499 (50.7%) | 485 (49.3%) |
Employment Industries by Sex in Pine Level
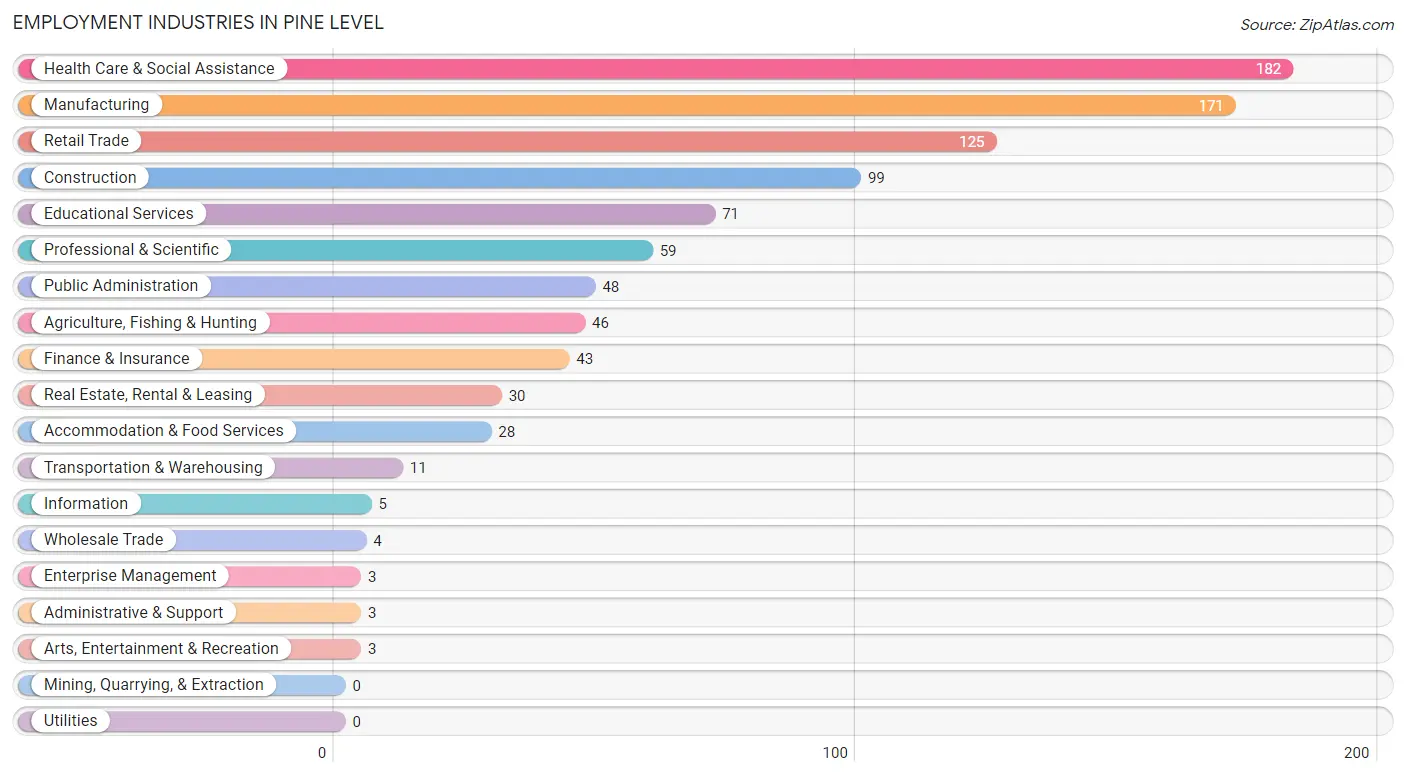
Employment Industries in Pine Level
The major employment industries in Pine Level include Health Care & Social Assistance (182 | 18.5%), Manufacturing (171 | 17.4%), Retail Trade (125 | 12.7%), Construction (99 | 10.1%), and Educational Services (71 | 7.2%).
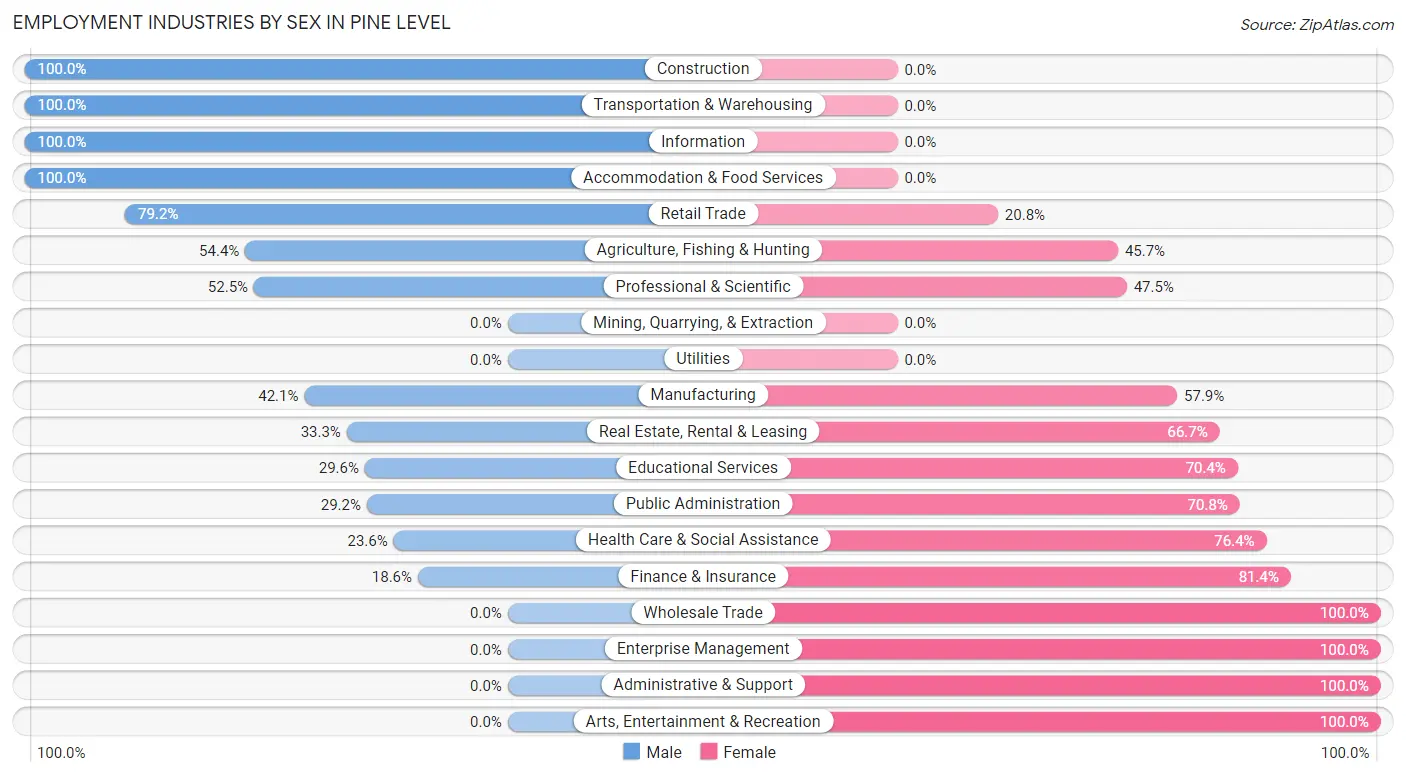
Employment Industries by Sex in Pine Level
The Pine Level industries that see more men than women are Construction (100.0%), Transportation & Warehousing (100.0%), and Information (100.0%), whereas the industries that tend to have a higher number of women are Wholesale Trade (100.0%), Enterprise Management (100.0%), and Administrative & Support (100.0%).
| Industry | Male | Female |
| Agriculture, Fishing & Hunting | 25 (54.3%) | 21 (45.7%) |
| Mining, Quarrying, & Extraction | 0 (0.0%) | 0 (0.0%) |
| Construction | 99 (100.0%) | 0 (0.0%) |
| Manufacturing | 72 (42.1%) | 99 (57.9%) |
| Wholesale Trade | 0 (0.0%) | 4 (100.0%) |
| Retail Trade | 99 (79.2%) | 26 (20.8%) |
| Transportation & Warehousing | 11 (100.0%) | 0 (0.0%) |
| Utilities | 0 (0.0%) | 0 (0.0%) |
| Information | 5 (100.0%) | 0 (0.0%) |
| Finance & Insurance | 8 (18.6%) | 35 (81.4%) |
| Real Estate, Rental & Leasing | 10 (33.3%) | 20 (66.7%) |
| Professional & Scientific | 31 (52.5%) | 28 (47.5%) |
| Enterprise Management | 0 (0.0%) | 3 (100.0%) |
| Administrative & Support | 0 (0.0%) | 3 (100.0%) |
| Educational Services | 21 (29.6%) | 50 (70.4%) |
| Health Care & Social Assistance | 43 (23.6%) | 139 (76.4%) |
| Arts, Entertainment & Recreation | 0 (0.0%) | 3 (100.0%) |
| Accommodation & Food Services | 28 (100.0%) | 0 (0.0%) |
| Public Administration | 14 (29.2%) | 34 (70.8%) |
| Total | 499 (50.7%) | 485 (49.3%) |
Education in Pine Level
School Enrollment in Pine Level
The most common levels of schooling among the 566 students in Pine Level are middle school (172 | 30.4%), high school (155 | 27.4%), and elementary school (84 | 14.8%).
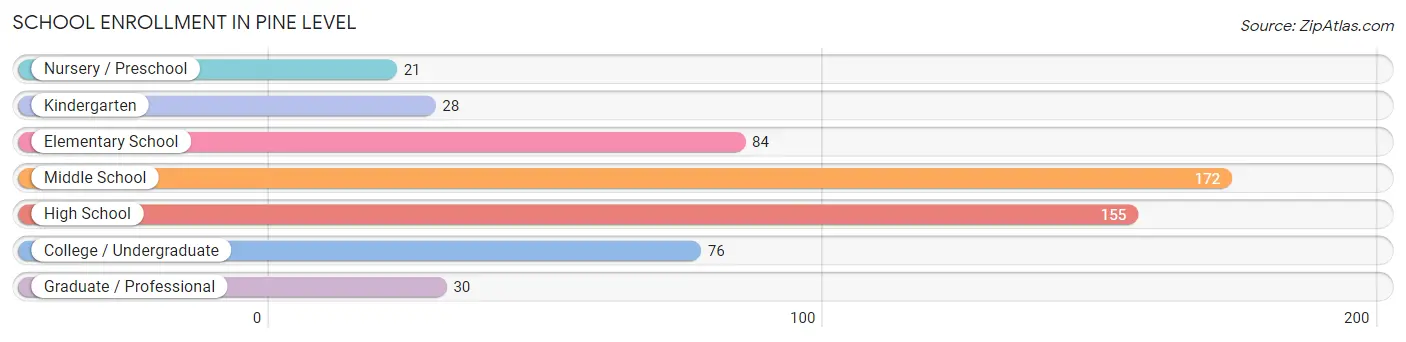
| School Level | # Students | % Students |
| Nursery / Preschool | 21 | 3.7% |
| Kindergarten | 28 | 5.0% |
| Elementary School | 84 | 14.8% |
| Middle School | 172 | 30.4% |
| High School | 155 | 27.4% |
| College / Undergraduate | 76 | 13.4% |
| Graduate / Professional | 30 | 5.3% |
| Total | 566 | 100.0% |
School Enrollment by Age by Funding Source in Pine Level
Out of a total of 566 students who are enrolled in schools in Pine Level, 38 (6.7%) attend a private institution, while the remaining 528 (93.3%) are enrolled in public schools. The age group of 3 to 4 year olds has the highest likelihood of being enrolled in private schools, with 11 (73.3% in the age bracket) enrolled. Conversely, the age group of 10 to 14 year olds has the lowest likelihood of being enrolled in a private school, with 212 (100.0% in the age bracket) attending a public institution.
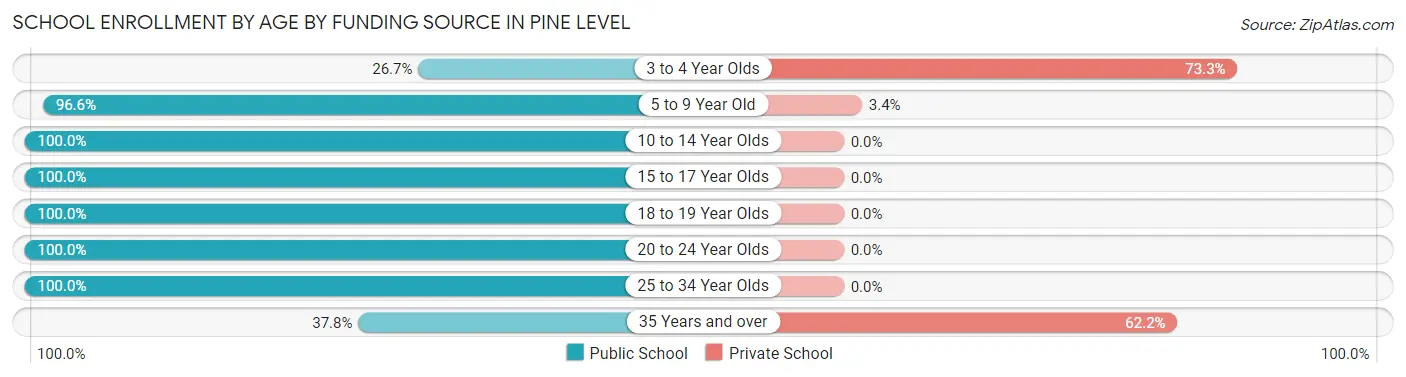
| Age Bracket | Public School | Private School |
| 3 to 4 Year Olds | 4 (26.7%) | 11 (73.3%) |
| 5 to 9 Year Old | 114 (96.6%) | 4 (3.4%) |
| 10 to 14 Year Olds | 212 (100.0%) | 0 (0.0%) |
| 15 to 17 Year Olds | 102 (100.0%) | 0 (0.0%) |
| 18 to 19 Year Olds | 48 (100.0%) | 0 (0.0%) |
| 20 to 24 Year Olds | 17 (100.0%) | 0 (0.0%) |
| 25 to 34 Year Olds | 17 (100.0%) | 0 (0.0%) |
| 35 Years and over | 14 (37.8%) | 23 (62.2%) |
| Total | 528 (93.3%) | 38 (6.7%) |
Educational Attainment by Field of Study in Pine Level
Education (59 | 20.3%), liberal arts & history (51 | 17.5%), science & technology (45 | 15.5%), computers & mathematics (36 | 12.4%), and social sciences (36 | 12.4%) are the most common fields of study among 291 individuals in Pine Level who have obtained a bachelor's degree or higher.
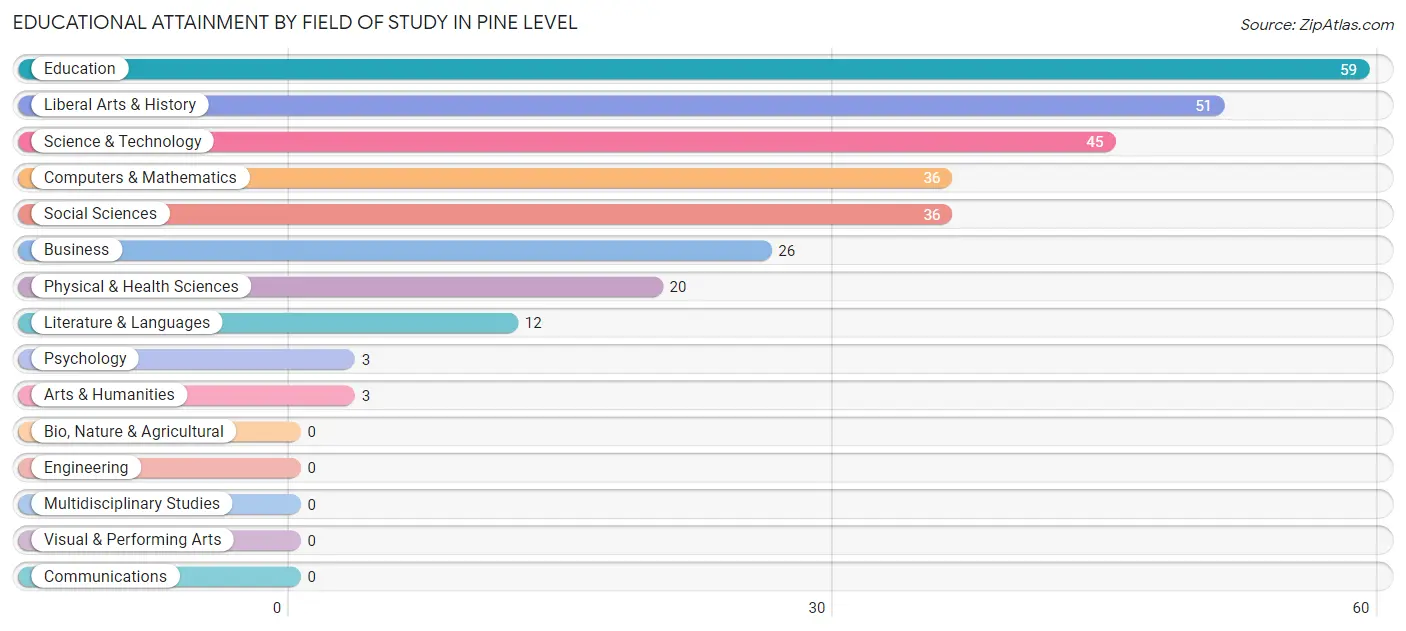
| Field of Study | # Graduates | % Graduates |
| Computers & Mathematics | 36 | 12.4% |
| Bio, Nature & Agricultural | 0 | 0.0% |
| Physical & Health Sciences | 20 | 6.9% |
| Psychology | 3 | 1.0% |
| Social Sciences | 36 | 12.4% |
| Engineering | 0 | 0.0% |
| Multidisciplinary Studies | 0 | 0.0% |
| Science & Technology | 45 | 15.5% |
| Business | 26 | 8.9% |
| Education | 59 | 20.3% |
| Literature & Languages | 12 | 4.1% |
| Liberal Arts & History | 51 | 17.5% |
| Visual & Performing Arts | 0 | 0.0% |
| Communications | 0 | 0.0% |
| Arts & Humanities | 3 | 1.0% |
| Total | 291 | 100.0% |
Transportation & Commute in Pine Level
Vehicle Availability by Sex in Pine Level
The most prevalent vehicle ownership categories in Pine Level are males with 2 vehicles (182, accounting for 36.5%) and females with 2 vehicles (207, making up 37.8%).
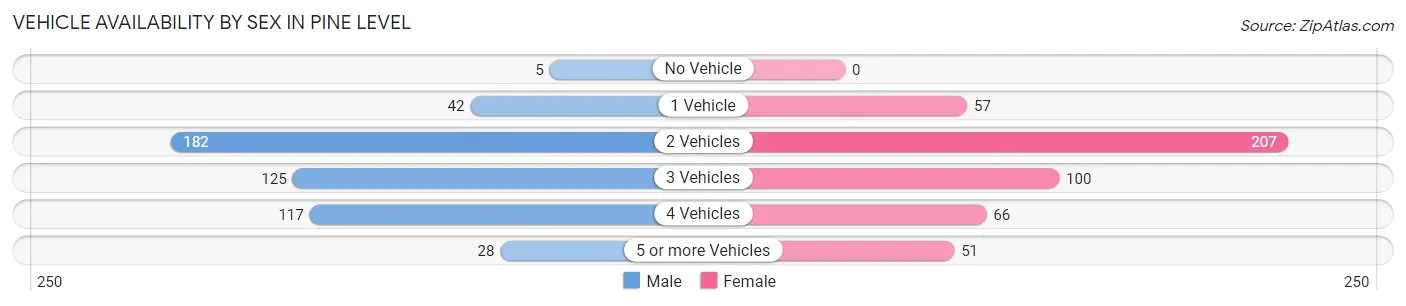
| Vehicles Available | Male | Female |
| No Vehicle | 5 (1.0%) | 0 (0.0%) |
| 1 Vehicle | 42 (8.4%) | 57 (11.8%) |
| 2 Vehicles | 182 (36.5%) | 207 (43.0%) |
| 3 Vehicles | 125 (25.1%) | 100 (20.8%) |
| 4 Vehicles | 117 (23.4%) | 66 (13.7%) |
| 5 or more Vehicles | 28 (5.6%) | 51 (10.6%) |
| Total | 499 (100.0%) | 481 (100.0%) |
Commute Time in Pine Level
The most frequently occuring commute durations in Pine Level are 15 to 19 minutes (193 commuters, 20.5%), 10 to 14 minutes (154 commuters, 16.4%), and 5 to 9 minutes (136 commuters, 14.5%).
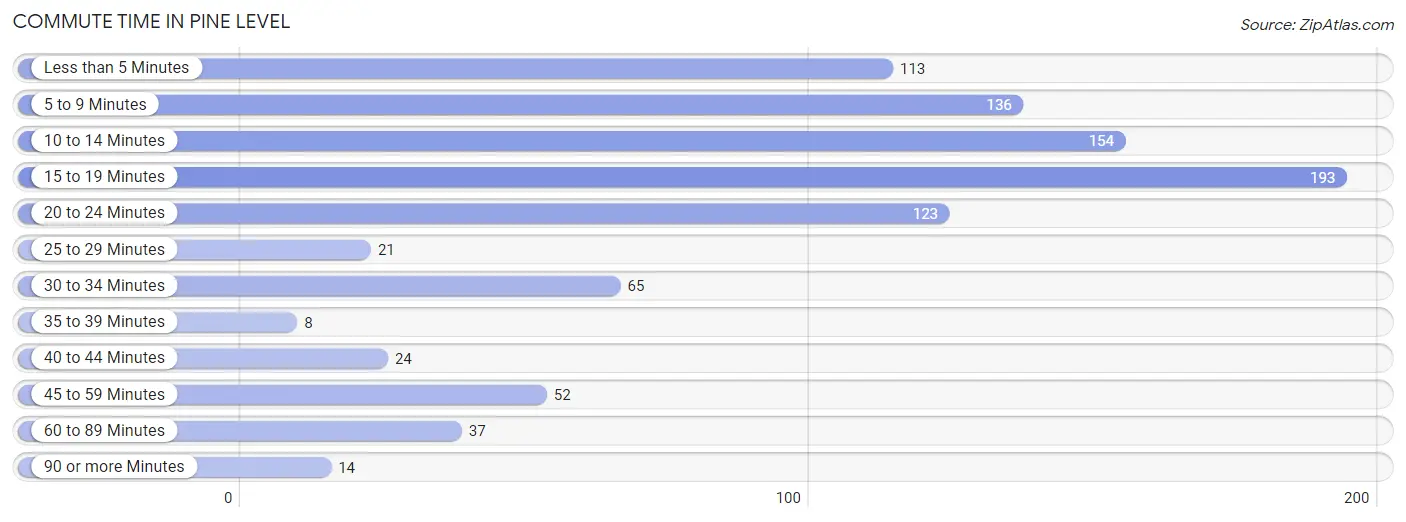
| Commute Time | # Commuters | % Commuters |
| Less than 5 Minutes | 113 | 12.0% |
| 5 to 9 Minutes | 136 | 14.5% |
| 10 to 14 Minutes | 154 | 16.4% |
| 15 to 19 Minutes | 193 | 20.5% |
| 20 to 24 Minutes | 123 | 13.1% |
| 25 to 29 Minutes | 21 | 2.2% |
| 30 to 34 Minutes | 65 | 6.9% |
| 35 to 39 Minutes | 8 | 0.9% |
| 40 to 44 Minutes | 24 | 2.5% |
| 45 to 59 Minutes | 52 | 5.5% |
| 60 to 89 Minutes | 37 | 3.9% |
| 90 or more Minutes | 14 | 1.5% |
Commute Time by Sex in Pine Level
The most common commute times in Pine Level are 5 to 9 minutes (95 commuters, 19.4%) for males and 15 to 19 minutes (101 commuters, 22.5%) for females.
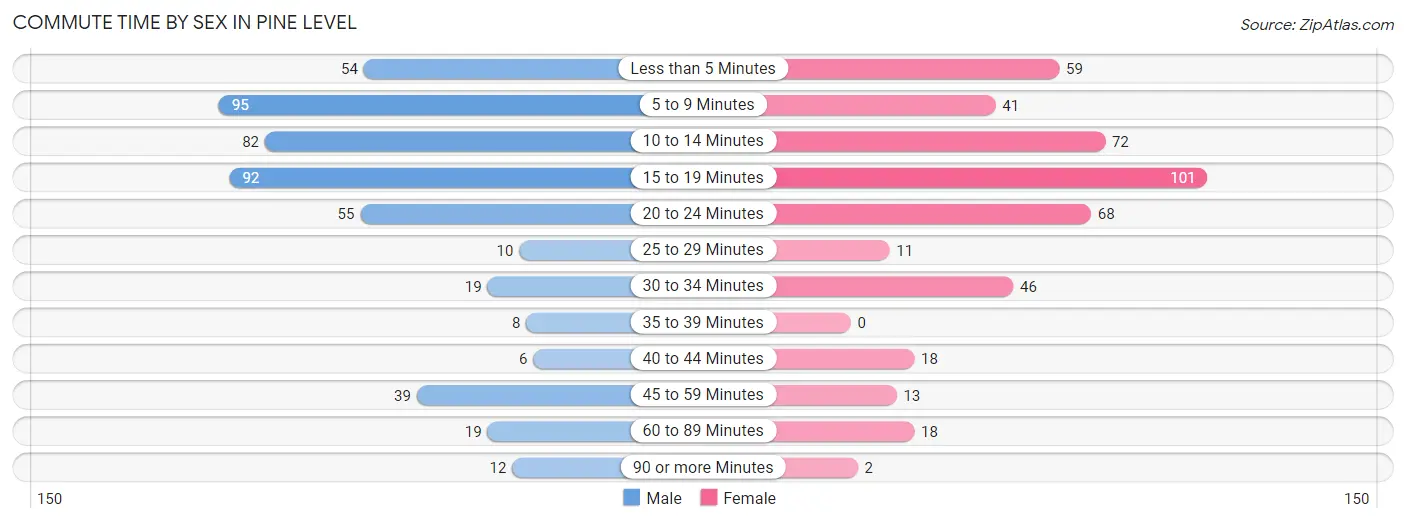
| Commute Time | Male | Female |
| Less than 5 Minutes | 54 (11.0%) | 59 (13.1%) |
| 5 to 9 Minutes | 95 (19.4%) | 41 (9.1%) |
| 10 to 14 Minutes | 82 (16.7%) | 72 (16.0%) |
| 15 to 19 Minutes | 92 (18.7%) | 101 (22.5%) |
| 20 to 24 Minutes | 55 (11.2%) | 68 (15.1%) |
| 25 to 29 Minutes | 10 (2.0%) | 11 (2.5%) |
| 30 to 34 Minutes | 19 (3.9%) | 46 (10.2%) |
| 35 to 39 Minutes | 8 (1.6%) | 0 (0.0%) |
| 40 to 44 Minutes | 6 (1.2%) | 18 (4.0%) |
| 45 to 59 Minutes | 39 (7.9%) | 13 (2.9%) |
| 60 to 89 Minutes | 19 (3.9%) | 18 (4.0%) |
| 90 or more Minutes | 12 (2.4%) | 2 (0.4%) |
Time of Departure to Work by Sex in Pine Level
The most frequent times of departure to work in Pine Level are 6:00 AM to 6:29 AM (69, 14.1%) for males and 7:00 AM to 7:29 AM (78, 17.4%) for females.
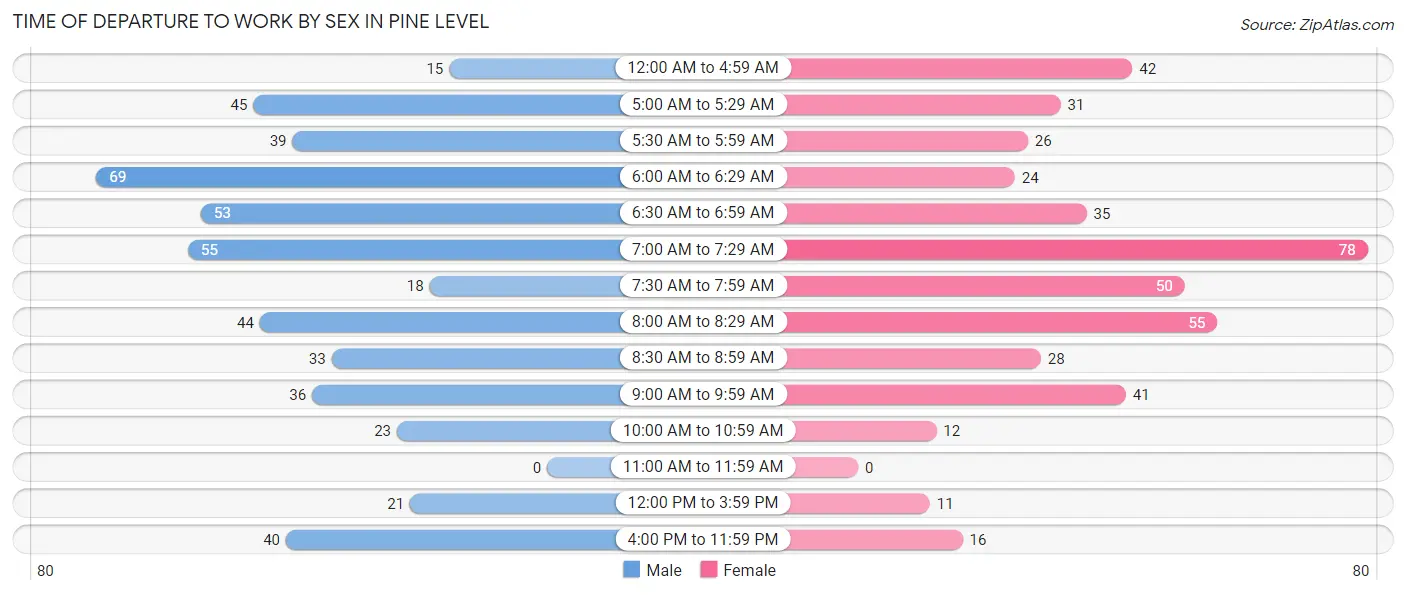
| Time of Departure | Male | Female |
| 12:00 AM to 4:59 AM | 15 (3.0%) | 42 (9.3%) |
| 5:00 AM to 5:29 AM | 45 (9.2%) | 31 (6.9%) |
| 5:30 AM to 5:59 AM | 39 (7.9%) | 26 (5.8%) |
| 6:00 AM to 6:29 AM | 69 (14.1%) | 24 (5.3%) |
| 6:30 AM to 6:59 AM | 53 (10.8%) | 35 (7.8%) |
| 7:00 AM to 7:29 AM | 55 (11.2%) | 78 (17.4%) |
| 7:30 AM to 7:59 AM | 18 (3.7%) | 50 (11.1%) |
| 8:00 AM to 8:29 AM | 44 (9.0%) | 55 (12.2%) |
| 8:30 AM to 8:59 AM | 33 (6.7%) | 28 (6.2%) |
| 9:00 AM to 9:59 AM | 36 (7.3%) | 41 (9.1%) |
| 10:00 AM to 10:59 AM | 23 (4.7%) | 12 (2.7%) |
| 11:00 AM to 11:59 AM | 0 (0.0%) | 0 (0.0%) |
| 12:00 PM to 3:59 PM | 21 (4.3%) | 11 (2.5%) |
| 4:00 PM to 11:59 PM | 40 (8.2%) | 16 (3.6%) |
| Total | 491 (100.0%) | 449 (100.0%) |
Housing Occupancy in Pine Level
Occupancy by Ownership in Pine Level
Of the total 717 dwellings in Pine Level, owner-occupied units account for 532 (74.2%), while renter-occupied units make up 185 (25.8%).
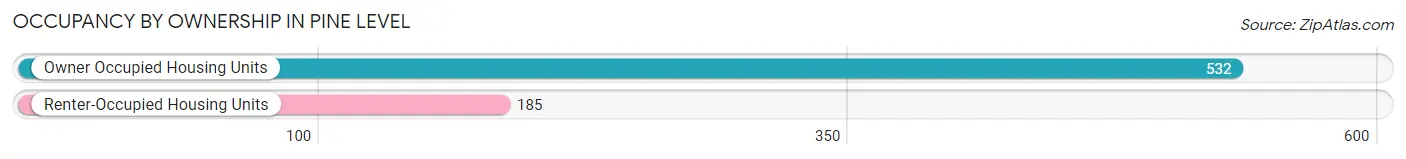
| Occupancy | # Housing Units | % Housing Units |
| Owner Occupied Housing Units | 532 | 74.2% |
| Renter-Occupied Housing Units | 185 | 25.8% |
| Total Occupied Housing Units | 717 | 100.0% |
Occupancy by Household Size in Pine Level
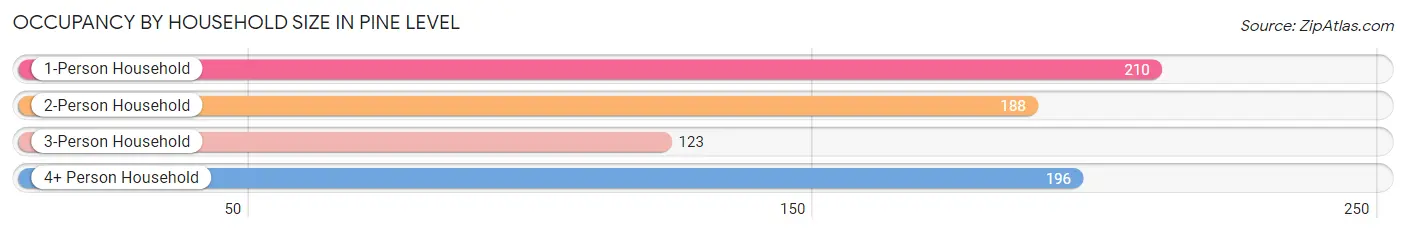
| Household Size | # Housing Units | % Housing Units |
| 1-Person Household | 210 | 29.3% |
| 2-Person Household | 188 | 26.2% |
| 3-Person Household | 123 | 17.2% |
| 4+ Person Household | 196 | 27.3% |
| Total Housing Units | 717 | 100.0% |
Occupancy by Ownership by Household Size in Pine Level
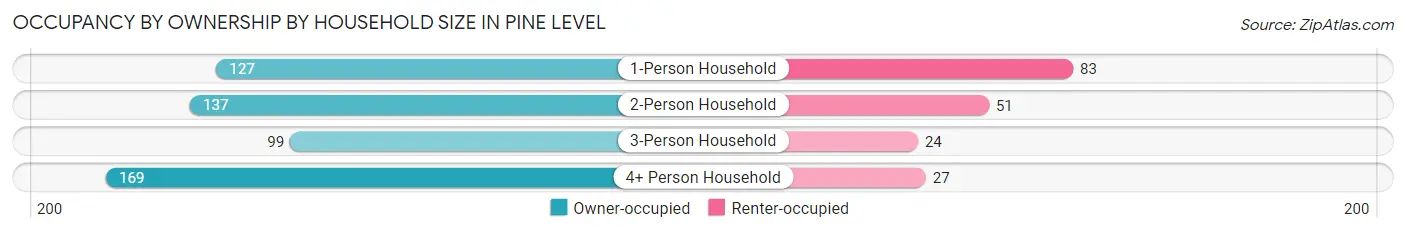
| Household Size | Owner-occupied | Renter-occupied |
| 1-Person Household | 127 (60.5%) | 83 (39.5%) |
| 2-Person Household | 137 (72.9%) | 51 (27.1%) |
| 3-Person Household | 99 (80.5%) | 24 (19.5%) |
| 4+ Person Household | 169 (86.2%) | 27 (13.8%) |
| Total Housing Units | 532 (74.2%) | 185 (25.8%) |
Occupancy by Educational Attainment in Pine Level
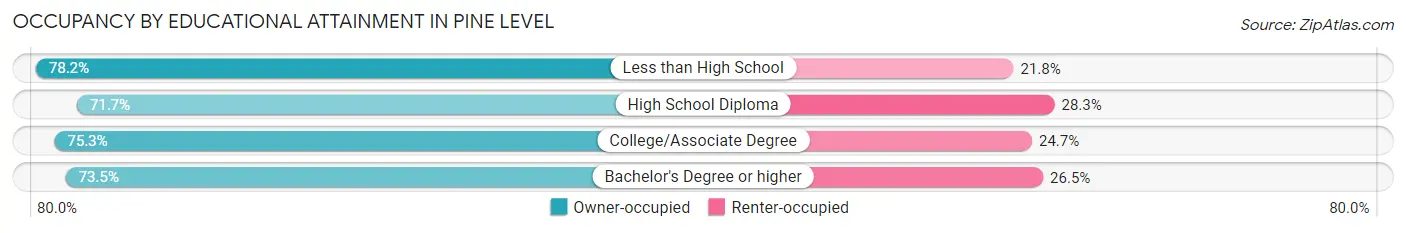
| Household Size | Owner-occupied | Renter-occupied |
| Less than High School | 61 (78.2%) | 17 (21.8%) |
| High School Diploma | 147 (71.7%) | 58 (28.3%) |
| College/Associate Degree | 213 (75.3%) | 70 (24.7%) |
| Bachelor's Degree or higher | 111 (73.5%) | 40 (26.5%) |
Occupancy by Age of Householder in Pine Level
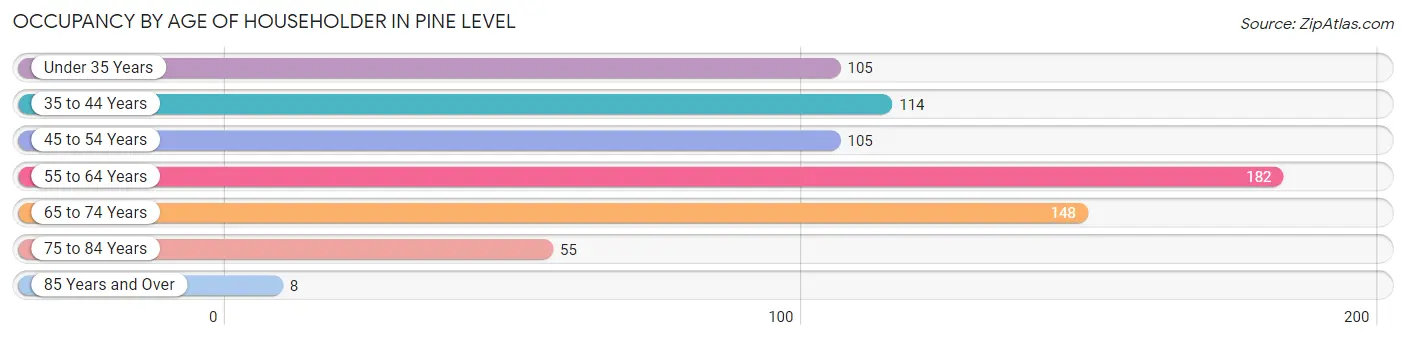
| Age Bracket | # Households | % Households |
| Under 35 Years | 105 | 14.6% |
| 35 to 44 Years | 114 | 15.9% |
| 45 to 54 Years | 105 | 14.6% |
| 55 to 64 Years | 182 | 25.4% |
| 65 to 74 Years | 148 | 20.6% |
| 75 to 84 Years | 55 | 7.7% |
| 85 Years and Over | 8 | 1.1% |
| Total | 717 | 100.0% |
Housing Finances in Pine Level
Median Income by Occupancy in Pine Level
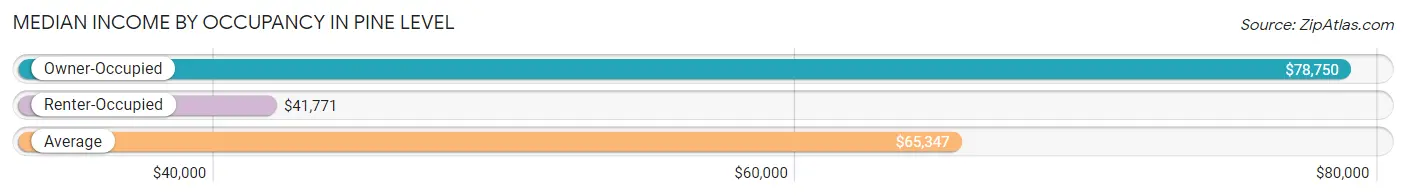
| Occupancy Type | # Households | Median Income |
| Owner-Occupied | 532 (74.2%) | $78,750 |
| Renter-Occupied | 185 (25.8%) | $41,771 |
| Average | 717 (100.0%) | $65,347 |
Occupancy by Householder Income Bracket in Pine Level
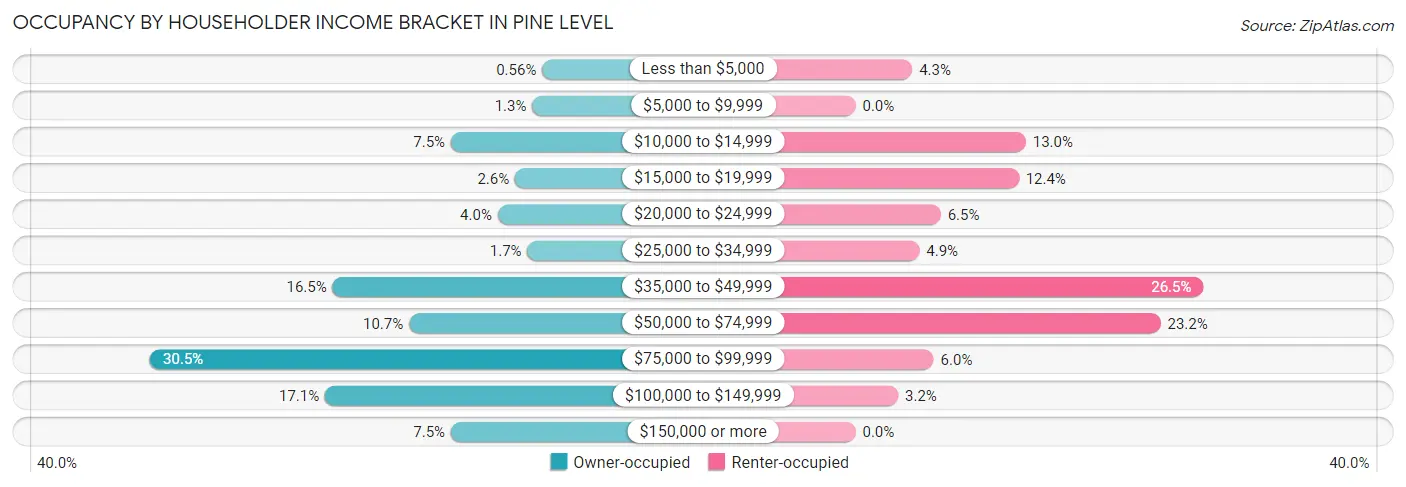
| Income Bracket | Owner-occupied | Renter-occupied |
| Less than $5,000 | 3 (0.6%) | 8 (4.3%) |
| $5,000 to $9,999 | 7 (1.3%) | 0 (0.0%) |
| $10,000 to $14,999 | 40 (7.5%) | 24 (13.0%) |
| $15,000 to $19,999 | 14 (2.6%) | 23 (12.4%) |
| $20,000 to $24,999 | 21 (4.0%) | 12 (6.5%) |
| $25,000 to $34,999 | 9 (1.7%) | 9 (4.9%) |
| $35,000 to $49,999 | 88 (16.5%) | 49 (26.5%) |
| $50,000 to $74,999 | 57 (10.7%) | 43 (23.2%) |
| $75,000 to $99,999 | 162 (30.4%) | 11 (5.9%) |
| $100,000 to $149,999 | 91 (17.1%) | 6 (3.2%) |
| $150,000 or more | 40 (7.5%) | 0 (0.0%) |
| Total | 532 (100.0%) | 185 (100.0%) |
Monthly Housing Cost Tiers in Pine Level
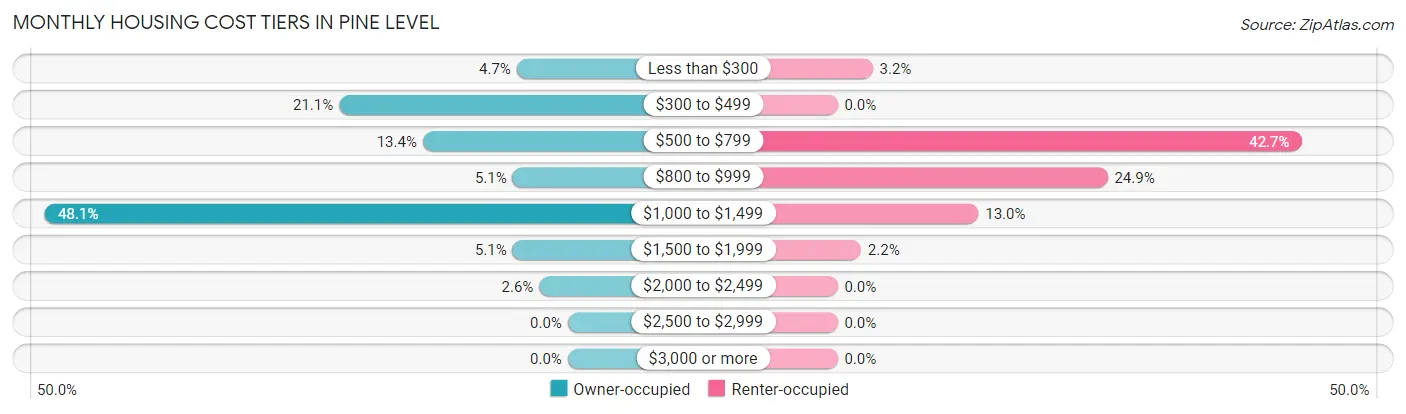
| Monthly Cost | Owner-occupied | Renter-occupied |
| Less than $300 | 25 (4.7%) | 6 (3.2%) |
| $300 to $499 | 112 (21.0%) | 0 (0.0%) |
| $500 to $799 | 71 (13.4%) | 79 (42.7%) |
| $800 to $999 | 27 (5.1%) | 46 (24.9%) |
| $1,000 to $1,499 | 256 (48.1%) | 24 (13.0%) |
| $1,500 to $1,999 | 27 (5.1%) | 4 (2.2%) |
| $2,000 to $2,499 | 14 (2.6%) | 0 (0.0%) |
| $2,500 to $2,999 | 0 (0.0%) | 0 (0.0%) |
| $3,000 or more | 0 (0.0%) | 0 (0.0%) |
| Total | 532 (100.0%) | 185 (100.0%) |
Physical Housing Characteristics in Pine Level
Housing Structures in Pine Level
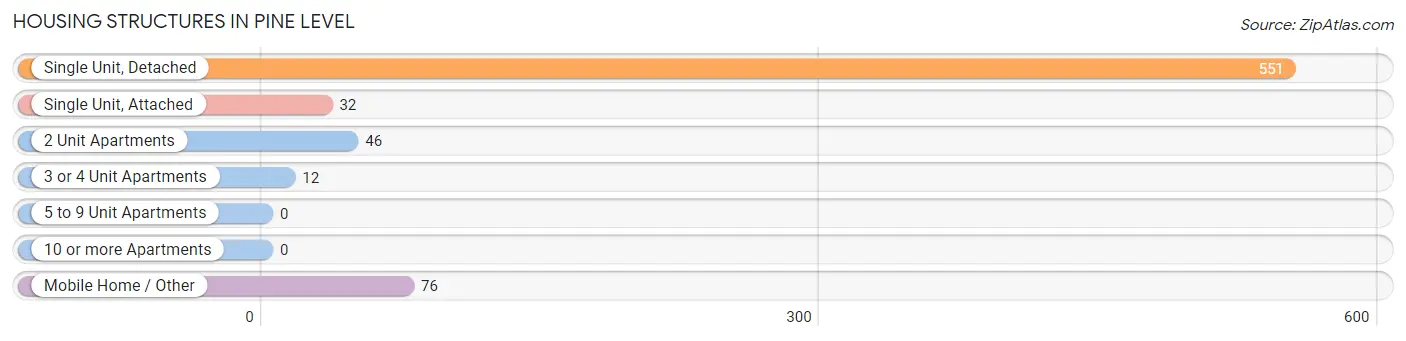
| Structure Type | # Housing Units | % Housing Units |
| Single Unit, Detached | 551 | 76.8% |
| Single Unit, Attached | 32 | 4.5% |
| 2 Unit Apartments | 46 | 6.4% |
| 3 or 4 Unit Apartments | 12 | 1.7% |
| 5 to 9 Unit Apartments | 0 | 0.0% |
| 10 or more Apartments | 0 | 0.0% |
| Mobile Home / Other | 76 | 10.6% |
| Total | 717 | 100.0% |
Housing Structures by Occupancy in Pine Level
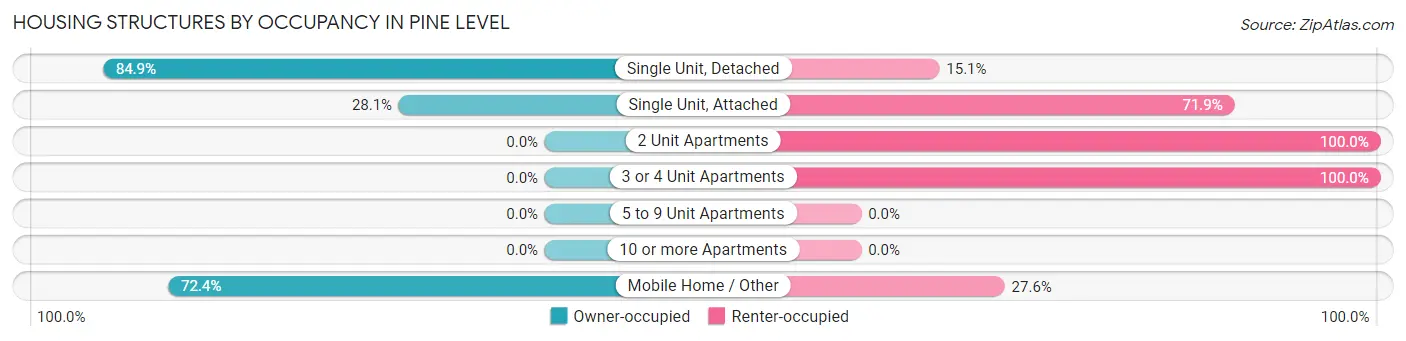
| Structure Type | Owner-occupied | Renter-occupied |
| Single Unit, Detached | 468 (84.9%) | 83 (15.1%) |
| Single Unit, Attached | 9 (28.1%) | 23 (71.9%) |
| 2 Unit Apartments | 0 (0.0%) | 46 (100.0%) |
| 3 or 4 Unit Apartments | 0 (0.0%) | 12 (100.0%) |
| 5 to 9 Unit Apartments | 0 (0.0%) | 0 (0.0%) |
| 10 or more Apartments | 0 (0.0%) | 0 (0.0%) |
| Mobile Home / Other | 55 (72.4%) | 21 (27.6%) |
| Total | 532 (74.2%) | 185 (25.8%) |
Housing Structures by Number of Rooms in Pine Level
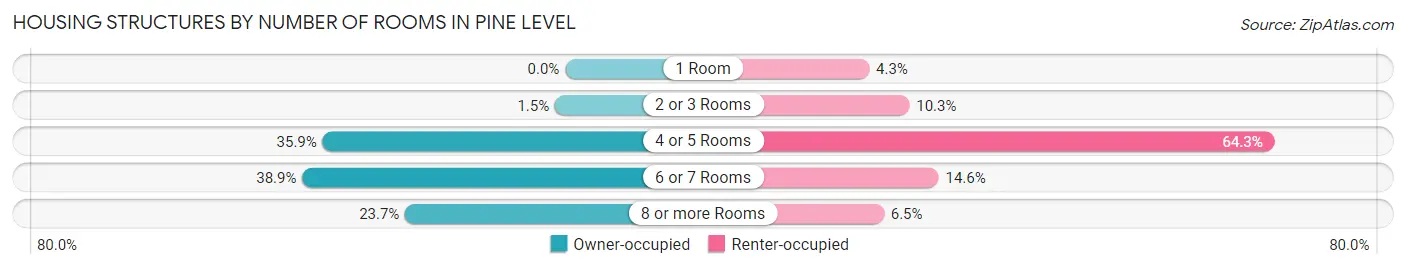
| Number of Rooms | Owner-occupied | Renter-occupied |
| 1 Room | 0 (0.0%) | 8 (4.3%) |
| 2 or 3 Rooms | 8 (1.5%) | 19 (10.3%) |
| 4 or 5 Rooms | 191 (35.9%) | 119 (64.3%) |
| 6 or 7 Rooms | 207 (38.9%) | 27 (14.6%) |
| 8 or more Rooms | 126 (23.7%) | 12 (6.5%) |
| Total | 532 (100.0%) | 185 (100.0%) |
Housing Structure by Heating Type in Pine Level
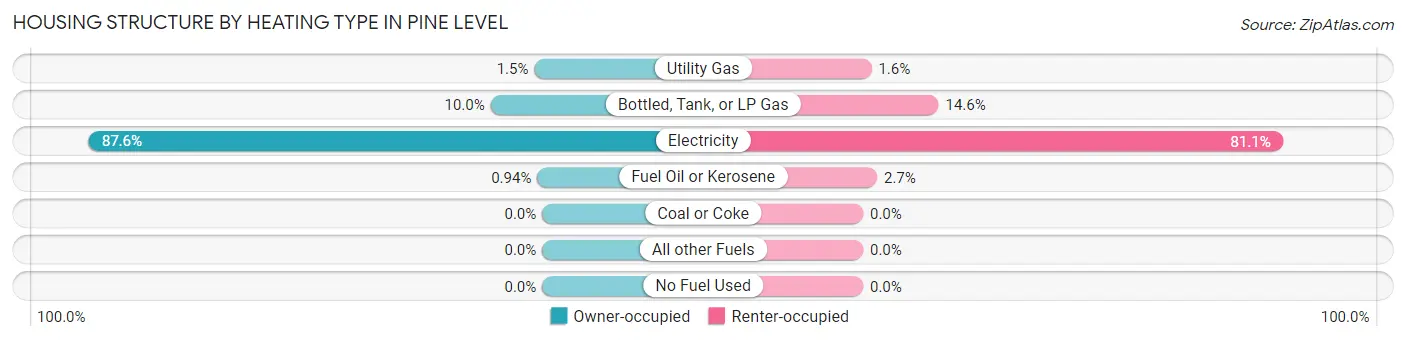
| Heating Type | Owner-occupied | Renter-occupied |
| Utility Gas | 8 (1.5%) | 3 (1.6%) |
| Bottled, Tank, or LP Gas | 53 (10.0%) | 27 (14.6%) |
| Electricity | 466 (87.6%) | 150 (81.1%) |
| Fuel Oil or Kerosene | 5 (0.9%) | 5 (2.7%) |
| Coal or Coke | 0 (0.0%) | 0 (0.0%) |
| All other Fuels | 0 (0.0%) | 0 (0.0%) |
| No Fuel Used | 0 (0.0%) | 0 (0.0%) |
| Total | 532 (100.0%) | 185 (100.0%) |
Household Vehicle Usage in Pine Level
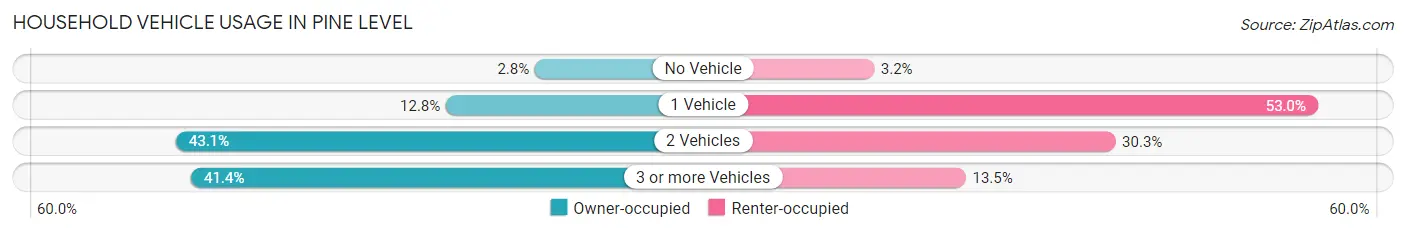
| Vehicles per Household | Owner-occupied | Renter-occupied |
| No Vehicle | 15 (2.8%) | 6 (3.2%) |
| 1 Vehicle | 68 (12.8%) | 98 (53.0%) |
| 2 Vehicles | 229 (43.0%) | 56 (30.3%) |
| 3 or more Vehicles | 220 (41.3%) | 25 (13.5%) |
| Total | 532 (100.0%) | 185 (100.0%) |
Real Estate & Mortgages in Pine Level
Real Estate and Mortgage Overview in Pine Level
| Characteristic | Without Mortgage | With Mortgage |
| Housing Units | 240 | 292 |
| Median Property Value | $132,500 | $185,900 |
| Median Household Income | $66,875 | $14 |
| Monthly Housing Costs | $466 | $0 |
| Real Estate Taxes | $1,087 | $0 |
Property Value by Mortgage Status in Pine Level
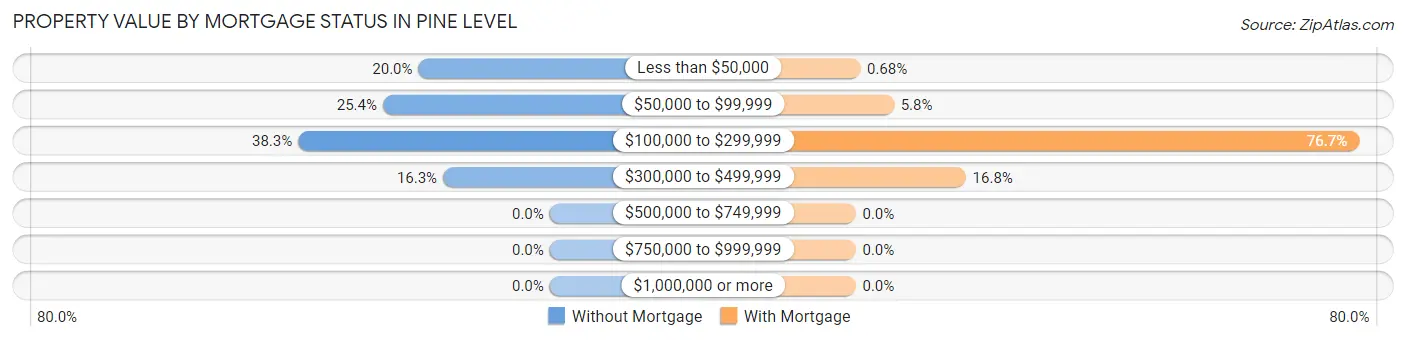
| Property Value | Without Mortgage | With Mortgage |
| Less than $50,000 | 48 (20.0%) | 2 (0.7%) |
| $50,000 to $99,999 | 61 (25.4%) | 17 (5.8%) |
| $100,000 to $299,999 | 92 (38.3%) | 224 (76.7%) |
| $300,000 to $499,999 | 39 (16.3%) | 49 (16.8%) |
| $500,000 to $749,999 | 0 (0.0%) | 0 (0.0%) |
| $750,000 to $999,999 | 0 (0.0%) | 0 (0.0%) |
| $1,000,000 or more | 0 (0.0%) | 0 (0.0%) |
| Total | 240 (100.0%) | 292 (100.0%) |
Household Income by Mortgage Status in Pine Level
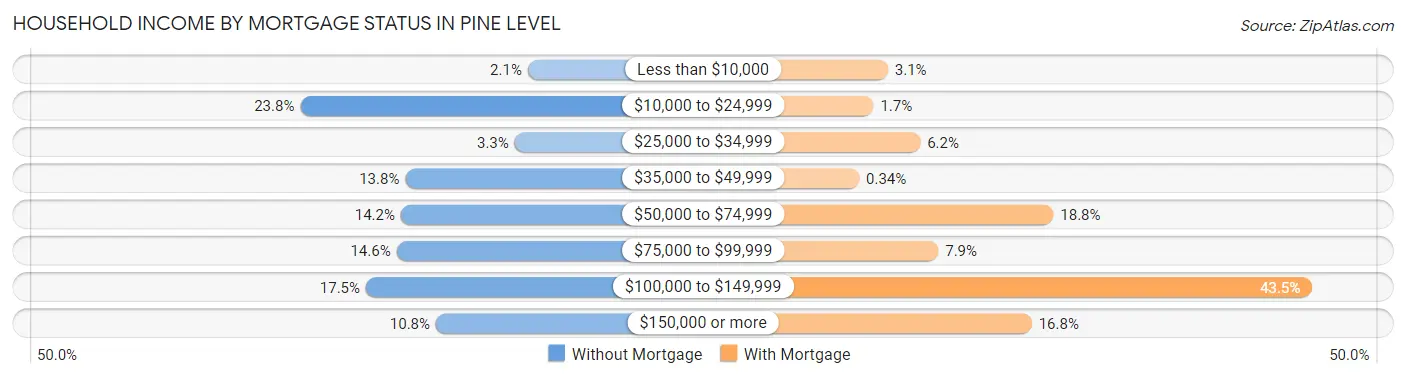
| Household Income | Without Mortgage | With Mortgage |
| Less than $10,000 | 5 (2.1%) | 9 (3.1%) |
| $10,000 to $24,999 | 57 (23.7%) | 5 (1.7%) |
| $25,000 to $34,999 | 8 (3.3%) | 18 (6.2%) |
| $35,000 to $49,999 | 33 (13.8%) | 1 (0.3%) |
| $50,000 to $74,999 | 34 (14.2%) | 55 (18.8%) |
| $75,000 to $99,999 | 35 (14.6%) | 23 (7.9%) |
| $100,000 to $149,999 | 42 (17.5%) | 127 (43.5%) |
| $150,000 or more | 26 (10.8%) | 49 (16.8%) |
| Total | 240 (100.0%) | 292 (100.0%) |
Property Value to Household Income Ratio in Pine Level
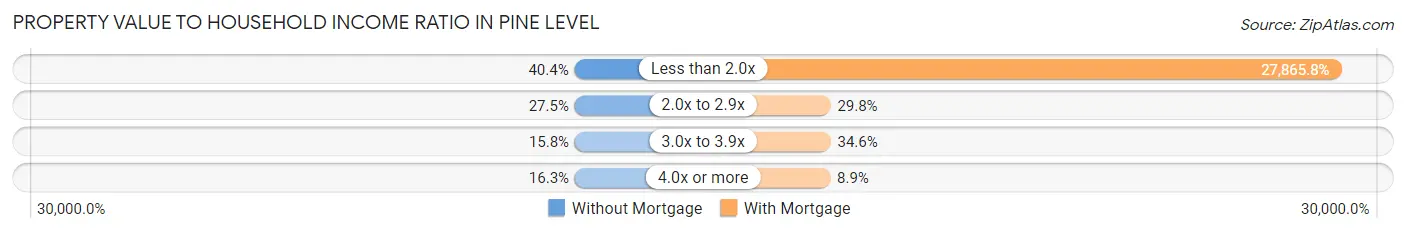
| Value-to-Income Ratio | Without Mortgage | With Mortgage |
| Less than 2.0x | 97 (40.4%) | 81,368 (27,865.8%) |
| 2.0x to 2.9x | 66 (27.5%) | 87 (29.8%) |
| 3.0x to 3.9x | 38 (15.8%) | 101 (34.6%) |
| 4.0x or more | 39 (16.3%) | 26 (8.9%) |
| Total | 240 (100.0%) | 292 (100.0%) |
Real Estate Taxes by Mortgage Status in Pine Level
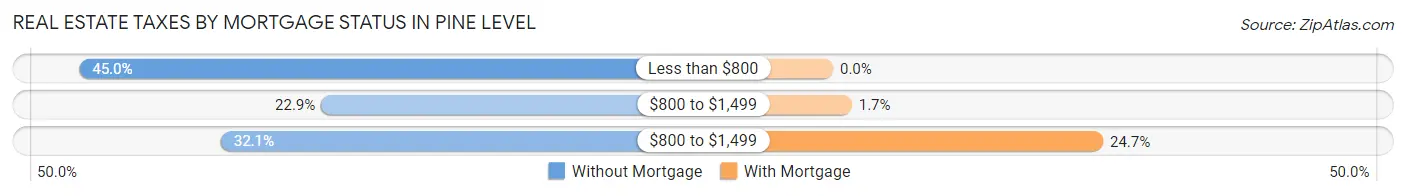
| Property Taxes | Without Mortgage | With Mortgage |
| Less than $800 | 108 (45.0%) | 0 (0.0%) |
| $800 to $1,499 | 55 (22.9%) | 5 (1.7%) |
| $800 to $1,499 | 77 (32.1%) | 72 (24.7%) |
| Total | 240 (100.0%) | 292 (100.0%) |
Health & Disability in Pine Level
Health Insurance Coverage by Age in Pine Level
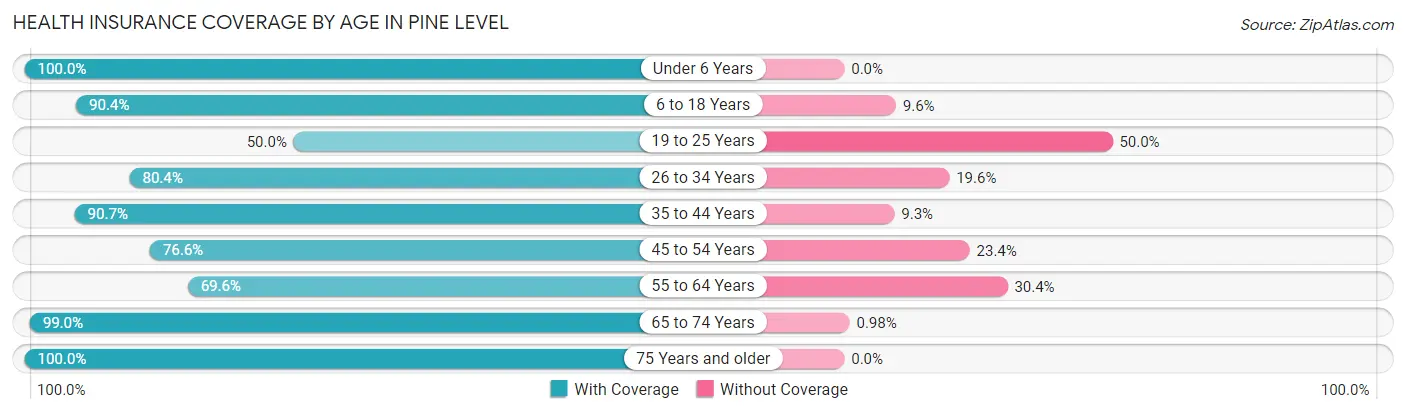
| Age Bracket | With Coverage | Without Coverage |
| Under 6 Years | 187 (100.0%) | 0 (0.0%) |
| 6 to 18 Years | 442 (90.4%) | 47 (9.6%) |
| 19 to 25 Years | 38 (50.0%) | 38 (50.0%) |
| 26 to 34 Years | 263 (80.4%) | 64 (19.6%) |
| 35 to 44 Years | 233 (90.7%) | 24 (9.3%) |
| 45 to 54 Years | 141 (76.6%) | 43 (23.4%) |
| 55 to 64 Years | 215 (69.6%) | 94 (30.4%) |
| 65 to 74 Years | 202 (99.0%) | 2 (1.0%) |
| 75 Years and older | 83 (100.0%) | 0 (0.0%) |
| Total | 1,804 (85.3%) | 312 (14.7%) |
Health Insurance Coverage by Citizenship Status in Pine Level
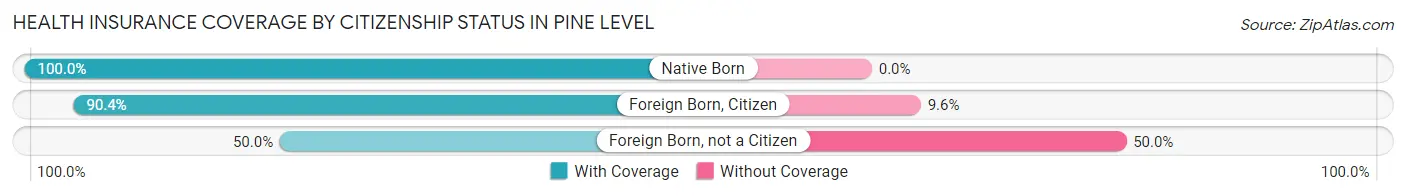
| Citizenship Status | With Coverage | Without Coverage |
| Native Born | 187 (100.0%) | 0 (0.0%) |
| Foreign Born, Citizen | 442 (90.4%) | 47 (9.6%) |
| Foreign Born, not a Citizen | 38 (50.0%) | 38 (50.0%) |
Health Insurance Coverage by Household Income in Pine Level
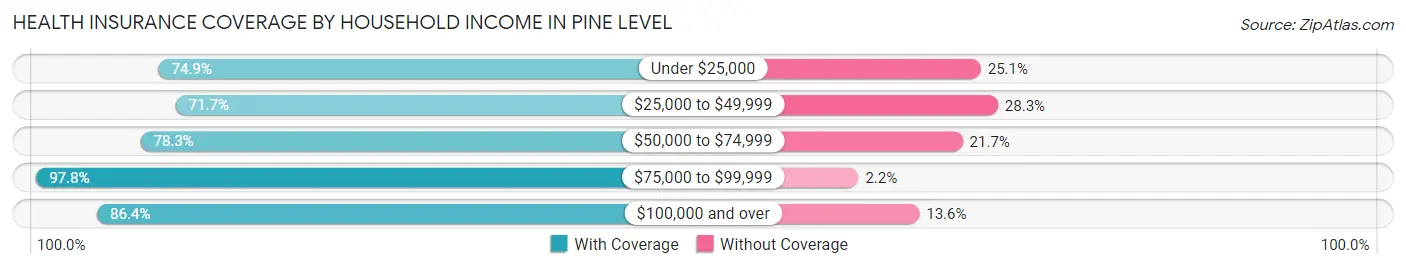
| Household Income | With Coverage | Without Coverage |
| Under $25,000 | 167 (74.9%) | 56 (25.1%) |
| $25,000 to $49,999 | 233 (71.7%) | 92 (28.3%) |
| $50,000 to $74,999 | 238 (78.3%) | 66 (21.7%) |
| $75,000 to $99,999 | 624 (97.8%) | 14 (2.2%) |
| $100,000 and over | 534 (86.4%) | 84 (13.6%) |
Public vs Private Health Insurance Coverage by Age in Pine Level
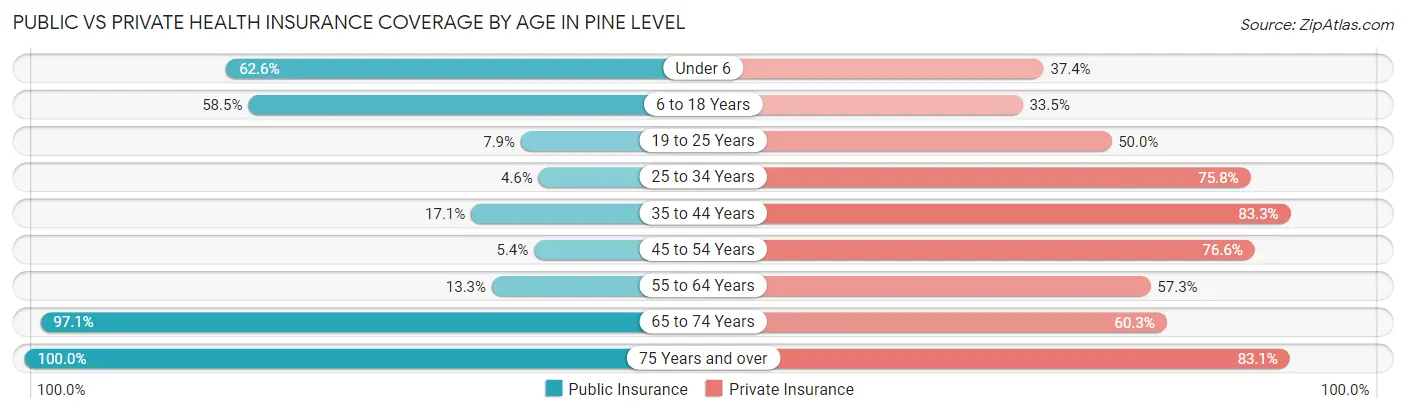
| Age Bracket | Public Insurance | Private Insurance |
| Under 6 | 117 (62.6%) | 70 (37.4%) |
| 6 to 18 Years | 286 (58.5%) | 164 (33.5%) |
| 19 to 25 Years | 6 (7.9%) | 38 (50.0%) |
| 25 to 34 Years | 15 (4.6%) | 248 (75.8%) |
| 35 to 44 Years | 44 (17.1%) | 214 (83.3%) |
| 45 to 54 Years | 10 (5.4%) | 141 (76.6%) |
| 55 to 64 Years | 41 (13.3%) | 177 (57.3%) |
| 65 to 74 Years | 198 (97.1%) | 123 (60.3%) |
| 75 Years and over | 83 (100.0%) | 69 (83.1%) |
| Total | 800 (37.8%) | 1,244 (58.8%) |
Disability Status by Sex by Age in Pine Level
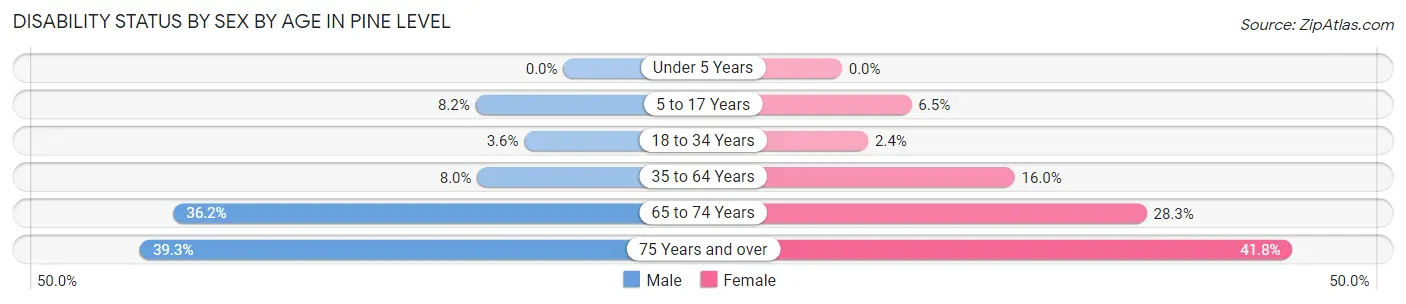
| Age Bracket | Male | Female |
| Under 5 Years | 0 (0.0%) | 0 (0.0%) |
| 5 to 17 Years | 15 (8.2%) | 17 (6.5%) |
| 18 to 34 Years | 11 (3.6%) | 4 (2.4%) |
| 35 to 64 Years | 26 (8.0%) | 68 (16.0%) |
| 65 to 74 Years | 38 (36.2%) | 28 (28.3%) |
| 75 Years and over | 11 (39.3%) | 23 (41.8%) |
Disability Class by Sex by Age in Pine Level
Disability Class: Hearing Difficulty
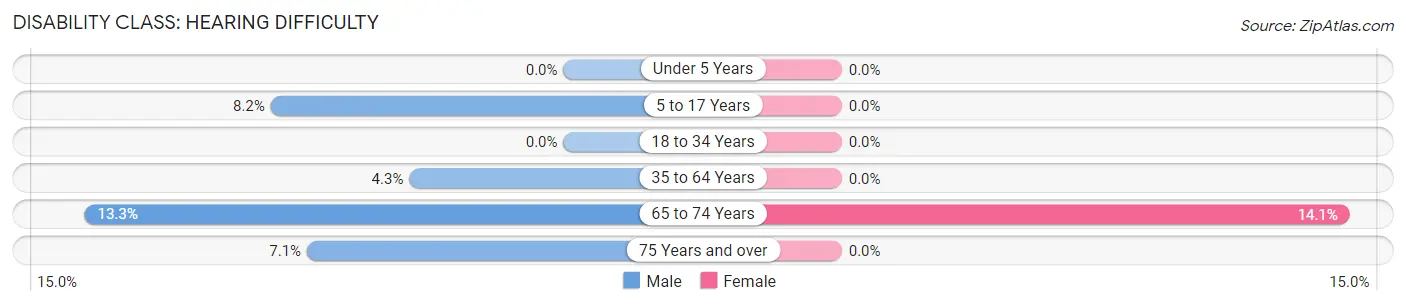
| Age Bracket | Male | Female |
| Under 5 Years | 0 (0.0%) | 0 (0.0%) |
| 5 to 17 Years | 15 (8.2%) | 0 (0.0%) |
| 18 to 34 Years | 0 (0.0%) | 0 (0.0%) |
| 35 to 64 Years | 14 (4.3%) | 0 (0.0%) |
| 65 to 74 Years | 14 (13.3%) | 14 (14.1%) |
| 75 Years and over | 2 (7.1%) | 0 (0.0%) |
Disability Class: Vision Difficulty
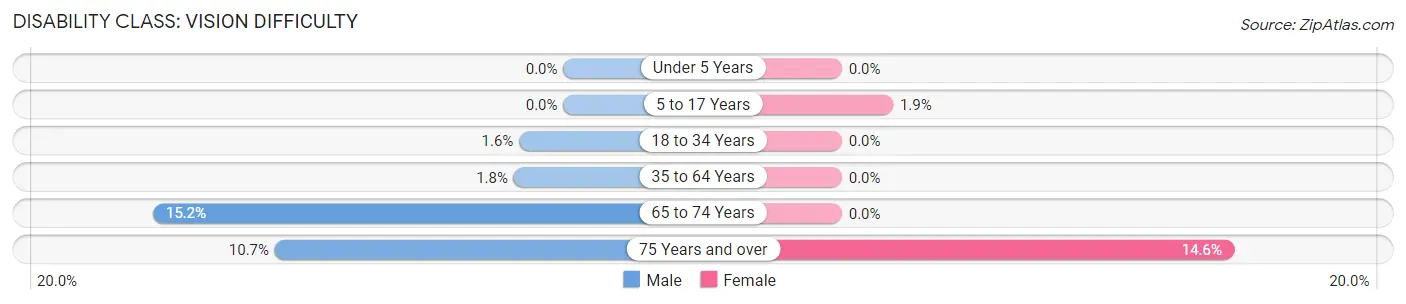
| Age Bracket | Male | Female |
| Under 5 Years | 0 (0.0%) | 0 (0.0%) |
| 5 to 17 Years | 0 (0.0%) | 5 (1.9%) |
| 18 to 34 Years | 5 (1.6%) | 0 (0.0%) |
| 35 to 64 Years | 6 (1.8%) | 0 (0.0%) |
| 65 to 74 Years | 16 (15.2%) | 0 (0.0%) |
| 75 Years and over | 3 (10.7%) | 8 (14.5%) |
Disability Class: Cognitive Difficulty
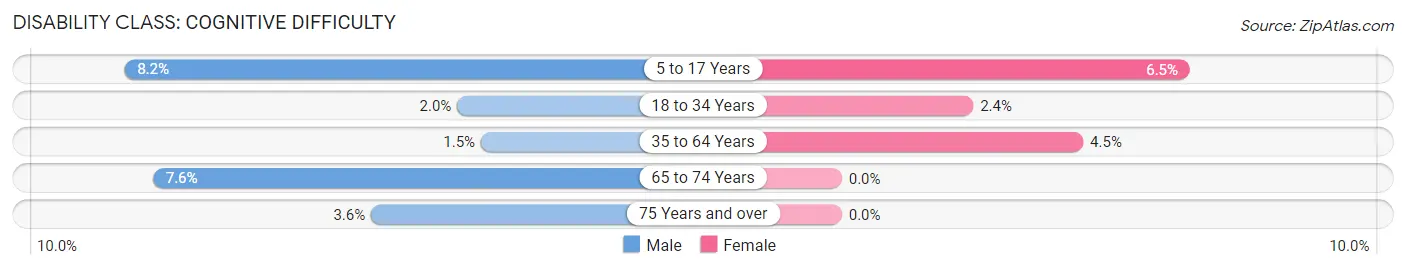
| Age Bracket | Male | Female |
| 5 to 17 Years | 15 (8.2%) | 17 (6.5%) |
| 18 to 34 Years | 6 (2.0%) | 4 (2.4%) |
| 35 to 64 Years | 5 (1.5%) | 19 (4.5%) |
| 65 to 74 Years | 8 (7.6%) | 0 (0.0%) |
| 75 Years and over | 1 (3.6%) | 0 (0.0%) |
Disability Class: Ambulatory Difficulty
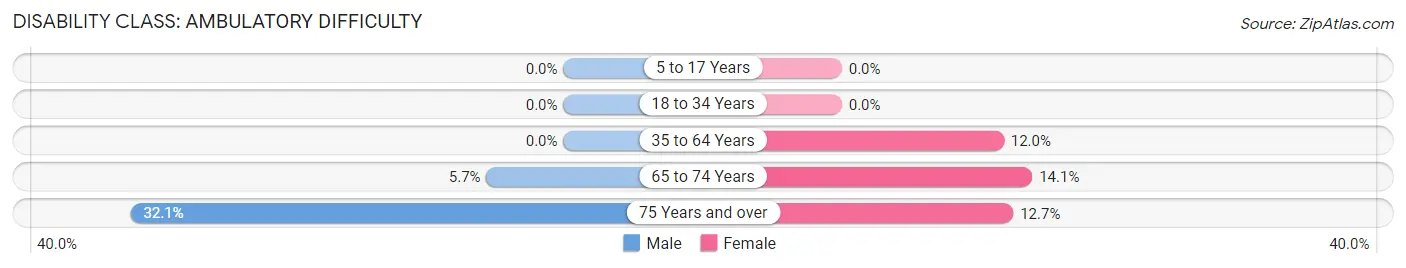
| Age Bracket | Male | Female |
| 5 to 17 Years | 0 (0.0%) | 0 (0.0%) |
| 18 to 34 Years | 0 (0.0%) | 0 (0.0%) |
| 35 to 64 Years | 0 (0.0%) | 51 (12.0%) |
| 65 to 74 Years | 6 (5.7%) | 14 (14.1%) |
| 75 Years and over | 9 (32.1%) | 7 (12.7%) |
Disability Class: Self-Care Difficulty
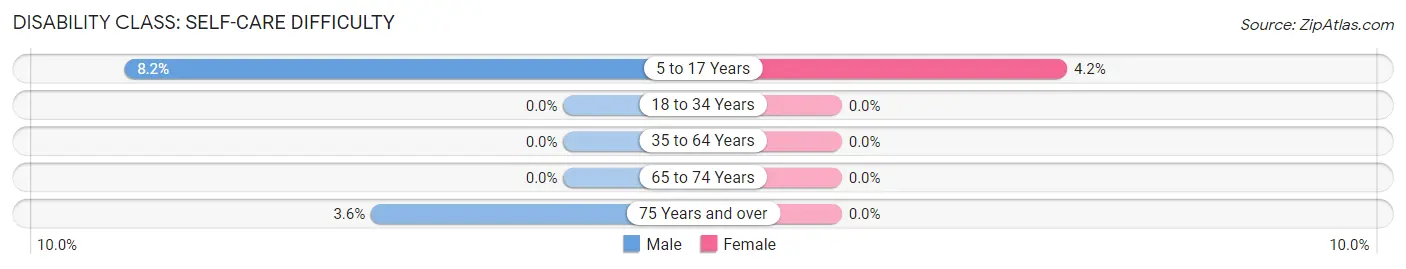
| Age Bracket | Male | Female |
| 5 to 17 Years | 15 (8.2%) | 11 (4.2%) |
| 18 to 34 Years | 0 (0.0%) | 0 (0.0%) |
| 35 to 64 Years | 0 (0.0%) | 0 (0.0%) |
| 65 to 74 Years | 0 (0.0%) | 0 (0.0%) |
| 75 Years and over | 1 (3.6%) | 0 (0.0%) |
Technology Access in Pine Level
Computing Device Access in Pine Level
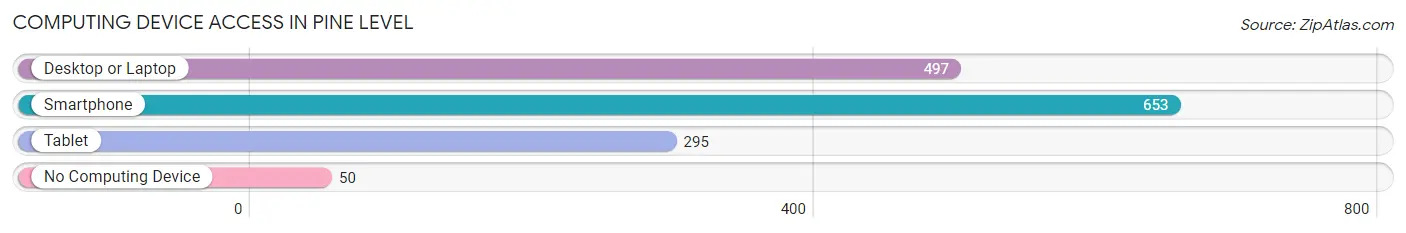
| Device Type | # Households | % Households |
| Desktop or Laptop | 497 | 69.3% |
| Smartphone | 653 | 91.1% |
| Tablet | 295 | 41.1% |
| No Computing Device | 50 | 7.0% |
| Total | 717 | 100.0% |
Internet Access in Pine Level
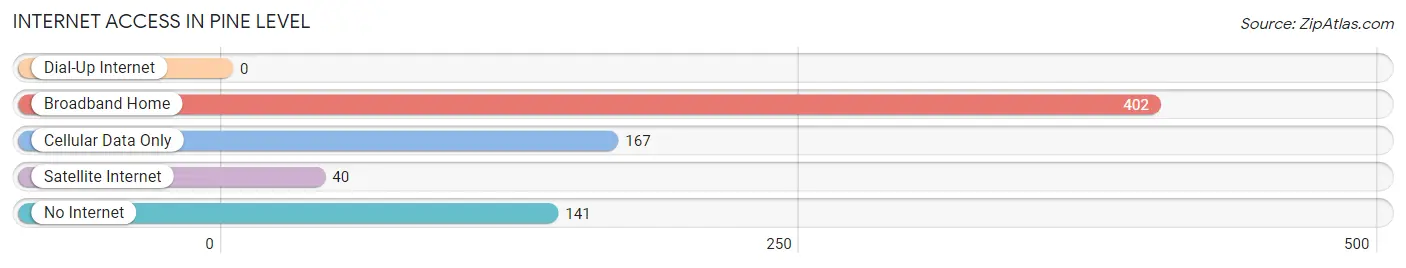
| Internet Type | # Households | % Households |
| Dial-Up Internet | 0 | 0.0% |
| Broadband Home | 402 | 56.1% |
| Cellular Data Only | 167 | 23.3% |
| Satellite Internet | 40 | 5.6% |
| No Internet | 141 | 19.7% |
| Total | 717 | 100.0% |
Pine Level Summary
Pine Level is a small town located in Johnston County, North Carolina. It is situated about 25 miles southeast of Raleigh, the state capital. The town has a population of approximately 1,000 people and is part of the larger Smithfield-Selma Metropolitan Statistical Area.
History
Pine Level was first settled in the early 1800s by a group of settlers from Virginia. The town was originally known as “Piney Level” and was named after the abundance of pine trees in the area. The town was officially incorporated in 1891 and was named after the nearby Pine Level Baptist Church.
In the late 1800s, Pine Level was a thriving agricultural community. The town was home to several cotton gins, a grist mill, and a sawmill. The town also had a post office, a general store, and a hotel.
In the early 1900s, the town began to decline as the railroad bypassed it. The town’s population decreased and many of the businesses closed. In the 1950s, the town began to experience a resurgence as new businesses opened and the population began to grow.
Geography
Pine Level is located in the Coastal Plain region of North Carolina. The town is situated on the Neuse River, which is a major tributary of the Pamlico Sound. The town is surrounded by rolling hills and is located about 25 miles southeast of Raleigh.
The climate in Pine Level is humid subtropical, with hot, humid summers and mild winters. The average annual temperature is around 68 degrees Fahrenheit. The average annual precipitation is around 45 inches.
Economy
The economy of Pine Level is largely based on agriculture. The town is home to several farms that produce corn, soybeans, cotton, and tobacco. The town is also home to several small businesses, including a grocery store, a hardware store, and a restaurant.
The town is also home to several manufacturing companies, including a furniture manufacturer and a plastics manufacturer. The town is also home to a number of service-based businesses, including a bank, a post office, and a medical clinic.
Demographics
As of the 2010 census, the population of Pine Level was 1,000 people. The racial makeup of the town was 94.2% White, 3.2% African American, 0.7% Native American, 0.3% Asian, and 1.6% from other races. The median household income was $37,500 and the median family income was $45,000.
The town is home to a number of churches, including Pine Level Baptist Church, Pine Level United Methodist Church, and Pine Level Presbyterian Church. The town is also home to a number of schools, including Pine Level Elementary School, Pine Level Middle School, and Pine Level High School.
Conclusion
Pine Level is a small town located in Johnston County, North Carolina. The town has a population of approximately 1,000 people and is part of the larger Smithfield-Selma Metropolitan Statistical Area. The town was first settled in the early 1800s and was officially incorporated in 1891. The economy of Pine Level is largely based on agriculture and the town is home to several small businesses. The racial makeup of the town is 94.2% White, 3.2% African American, 0.7% Native American, 0.3% Asian, and 1.6% from other races. The town is home to a number of churches and schools.
Common Questions
What is Per Capita Income in Pine Level?
Per Capita income in Pine Level is $24,592.
What is the Median Family Income in Pine Level?
Median Family Income in Pine Level is $80,943.
What is the Median Household income in Pine Level?
Median Household Income in Pine Level is $65,347.
What is Income or Wage Gap in Pine Level?
Income or Wage Gap in Pine Level is 12.6%.
Women in Pine Level earn 87.4 cents for every dollar earned by a man.
What is Family Income Deficit in Pine Level?
Family Income Deficit in Pine Level is $8,277.
Families that are below poverty line in Pine Level earn $8,277 less on average than the poverty threshold level.
What is Inequality or Gini Index in Pine Level?
Inequality or Gini Index in Pine Level is 0.37.
What is the Total Population of Pine Level?
Total Population of Pine Level is 2,116.
What is the Total Male Population of Pine Level?
Total Male Population of Pine Level is 1,056.
What is the Total Female Population of Pine Level?
Total Female Population of Pine Level is 1,060.
What is the Ratio of Males per 100 Females in Pine Level?
There are 99.62 Males per 100 Females in Pine Level.
What is the Ratio of Females per 100 Males in Pine Level?
There are 100.38 Females per 100 Males in Pine Level.
What is the Median Population Age in Pine Level?
Median Population Age in Pine Level is 34.8 Years.
What is the Average Family Size in Pine Level
Average Family Size in Pine Level is 3.7 People.
What is the Average Household Size in Pine Level
Average Household Size in Pine Level is 2.9 People.
How Large is the Labor Force in Pine Level?
There are 1,016 People in the Labor Forcein in Pine Level.
What is the Percentage of People in the Labor Force in Pine Level?
64.4% of People are in the Labor Force in Pine Level.
What is the Unemployment Rate in Pine Level?
Unemployment Rate in Pine Level is 3.2%.