Pleasant Garden, NC Map & Demographics
Pleasant Garden Map
Pleasant Garden Overview
$34,270
PER CAPITA INCOME
$93,682
AVG FAMILY INCOME
$84,395
AVG HOUSEHOLD INCOME
44.2%
WAGE / INCOME GAP [ % ]
55.8¢/ $1
WAGE / INCOME GAP [ $ ]
0.43
INEQUALITY / GINI INDEX
4,987
TOTAL POPULATION
2,369
MALE POPULATION
2,618
FEMALE POPULATION
90.49
MALES / 100 FEMALES
110.51
FEMALES / 100 MALES
53.7
MEDIAN AGE
2.8
AVG FAMILY SIZE
2.9
AVG HOUSEHOLD SIZE
2,276
LABOR FORCE [ PEOPLE ]
53.1%
PERCENT IN LABOR FORCE
1.2%
UNEMPLOYMENT RATE
Pleasant Garden Zip Codes
Pleasant Garden Area Codes
Income in Pleasant Garden
Income Overview in Pleasant Garden
Per Capita Income in Pleasant Garden is $34,270, while median incomes of families and households are $93,682 and $84,395 respectively.
| Characteristic | Number | Measure |
| Per Capita Income | 4,987 | $34,270 |
| Median Family Income | 1,174 | $93,682 |
| Mean Family Income | 1,174 | $98,310 |
| Median Household Income | 1,677 | $84,395 |
| Mean Household Income | 1,677 | $96,870 |
| Income Deficit | 1,174 | $0 |
| Wage / Income Gap (%) | 4,987 | 44.18% |
| Wage / Income Gap ($) | 4,987 | 55.82¢ per $1 |
| Gini / Inequality Index | 4,987 | 0.43 |
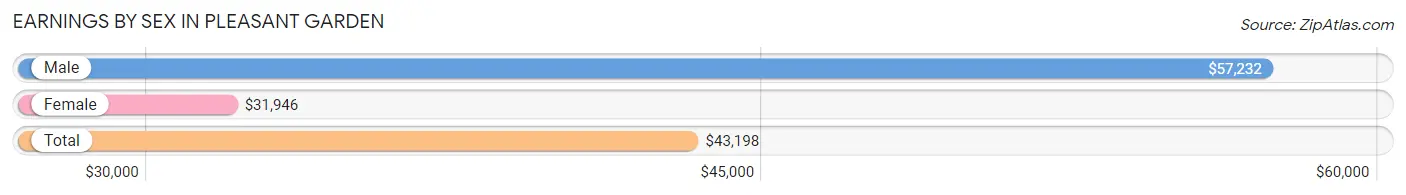
Earnings by Sex in Pleasant Garden
Average Earnings in Pleasant Garden are $43,198, $57,232 for men and $31,946 for women, a difference of 44.2%.
| Sex | Number | Average Earnings |
| Male | 1,291 (55.5%) | $57,232 |
| Female | 1,035 (44.5%) | $31,946 |
| Total | 2,326 (100.0%) | $43,198 |
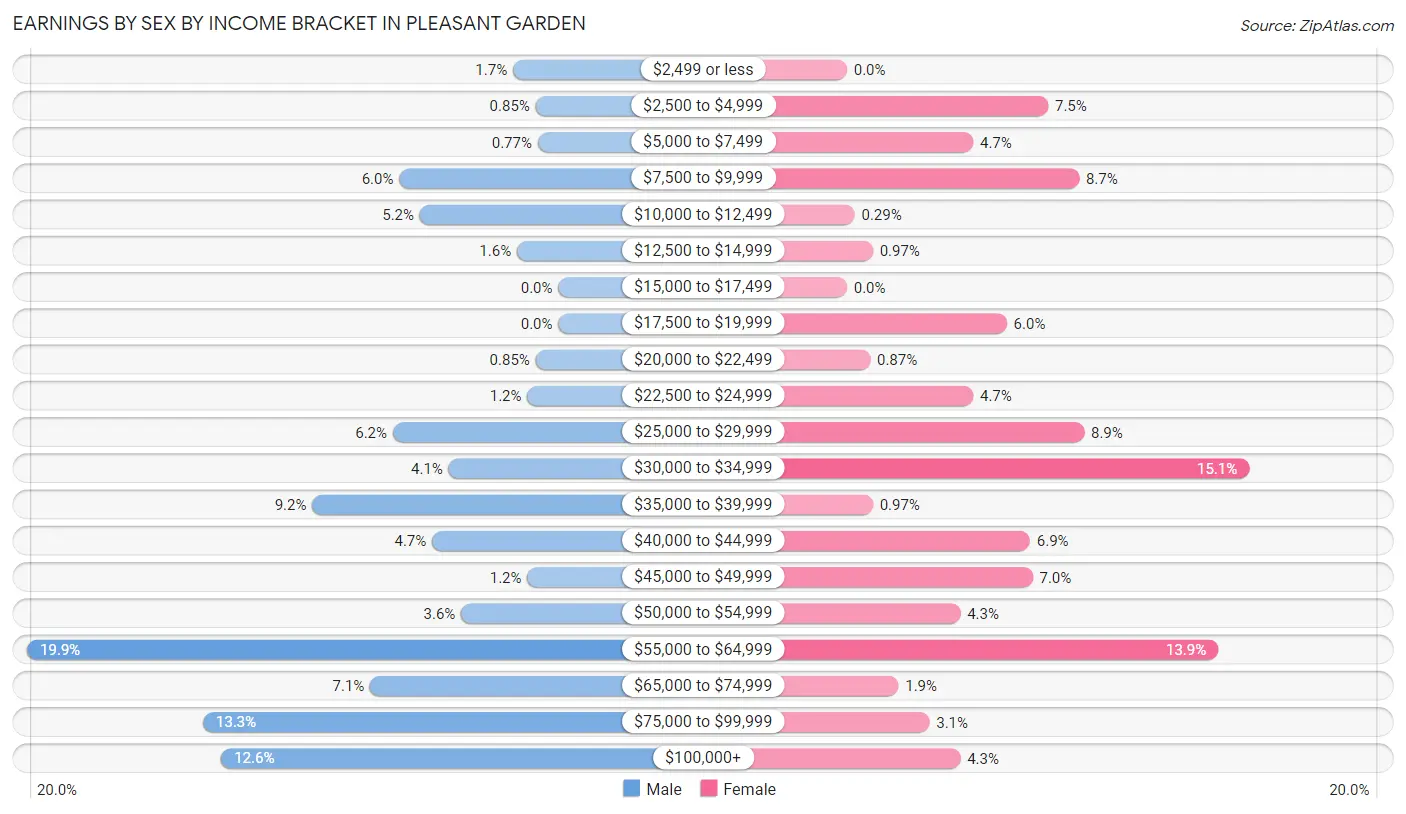
Earnings by Sex by Income Bracket in Pleasant Garden
The most common earnings brackets in Pleasant Garden are $55,000 to $64,999 for men (257 | 19.9%) and $30,000 to $34,999 for women (156 | 15.1%).
| Income | Male | Female |
| $2,499 or less | 22 (1.7%) | 0 (0.0%) |
| $2,500 to $4,999 | 11 (0.9%) | 78 (7.5%) |
| $5,000 to $7,499 | 10 (0.8%) | 49 (4.7%) |
| $7,500 to $9,999 | 77 (6.0%) | 90 (8.7%) |
| $10,000 to $12,499 | 67 (5.2%) | 3 (0.3%) |
| $12,500 to $14,999 | 20 (1.5%) | 10 (1.0%) |
| $15,000 to $17,499 | 0 (0.0%) | 0 (0.0%) |
| $17,500 to $19,999 | 0 (0.0%) | 62 (6.0%) |
| $20,000 to $22,499 | 11 (0.9%) | 9 (0.9%) |
| $22,500 to $24,999 | 15 (1.2%) | 49 (4.7%) |
| $25,000 to $29,999 | 80 (6.2%) | 92 (8.9%) |
| $30,000 to $34,999 | 53 (4.1%) | 156 (15.1%) |
| $35,000 to $39,999 | 119 (9.2%) | 10 (1.0%) |
| $40,000 to $44,999 | 61 (4.7%) | 71 (6.9%) |
| $45,000 to $49,999 | 15 (1.2%) | 72 (7.0%) |
| $50,000 to $54,999 | 47 (3.6%) | 44 (4.3%) |
| $55,000 to $64,999 | 257 (19.9%) | 144 (13.9%) |
| $65,000 to $74,999 | 91 (7.0%) | 20 (1.9%) |
| $75,000 to $99,999 | 172 (13.3%) | 32 (3.1%) |
| $100,000+ | 163 (12.6%) | 44 (4.3%) |
| Total | 1,291 (100.0%) | 1,035 (100.0%) |
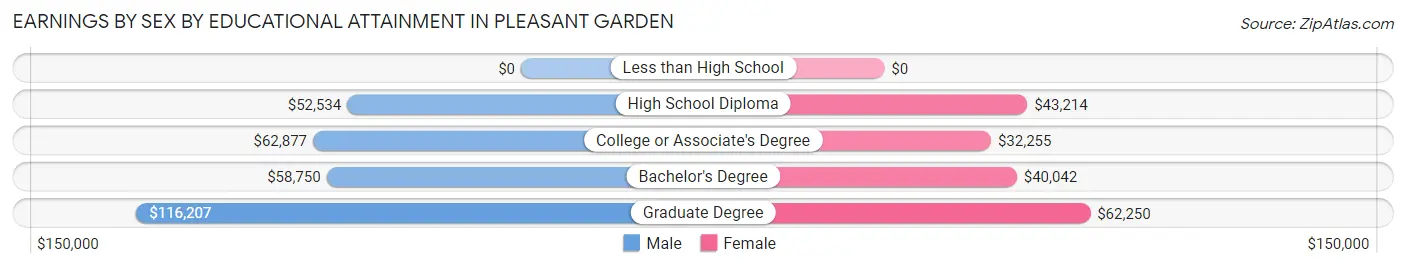
Earnings by Sex by Educational Attainment in Pleasant Garden
Average earnings in Pleasant Garden are $61,912 for men and $38,000 for women, a difference of 38.6%. Men with an educational attainment of graduate degree enjoy the highest average annual earnings of $116,207, while those with high school diploma education earn the least with $52,534. Women with an educational attainment of graduate degree earn the most with the average annual earnings of $62,250, while those with college or associate's degree education have the smallest earnings of $32,255.
| Educational Attainment | Male Income | Female Income |
| Less than High School | - | - |
| High School Diploma | $52,534 | $43,214 |
| College or Associate's Degree | $62,877 | $32,255 |
| Bachelor's Degree | $58,750 | $40,042 |
| Graduate Degree | $116,207 | $62,250 |
| Total | $61,912 | $38,000 |
Family Income in Pleasant Garden
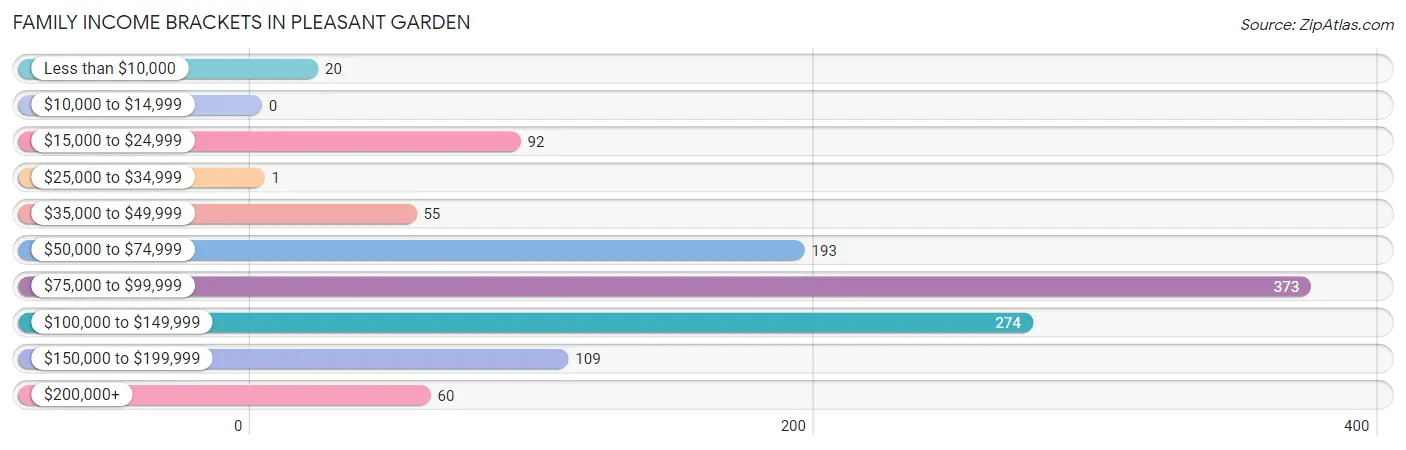
Family Income Brackets in Pleasant Garden
According to the Pleasant Garden family income data, there are 373 families falling into the $75,000 to $99,999 income range, which is the most common income bracket and makes up 31.8% of all families.
| Income Bracket | # Families | % Families |
| Less than $10,000 | 20 | 1.7% |
| $10,000 to $14,999 | 0 | 0.0% |
| $15,000 to $24,999 | 92 | 7.8% |
| $25,000 to $34,999 | 1 | 0.1% |
| $35,000 to $49,999 | 55 | 4.7% |
| $50,000 to $74,999 | 193 | 16.4% |
| $75,000 to $99,999 | 373 | 31.8% |
| $100,000 to $149,999 | 274 | 23.3% |
| $150,000 to $199,999 | 109 | 9.3% |
| $200,000+ | 60 | 5.1% |
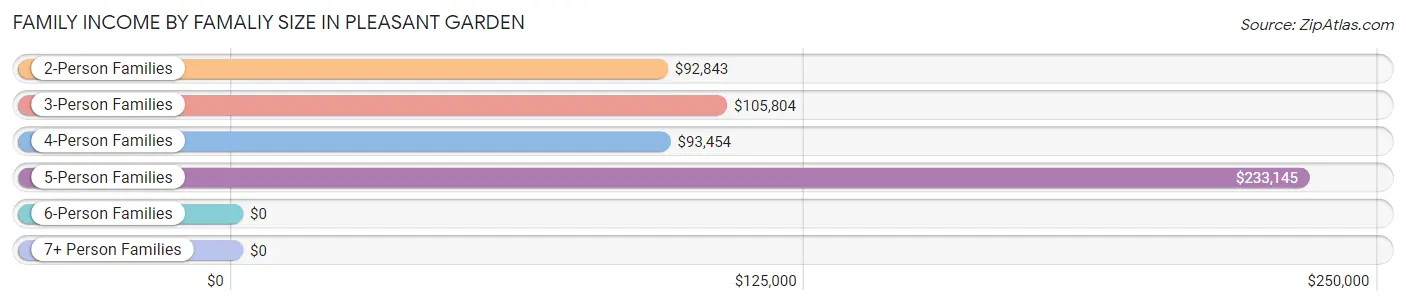
Family Income by Famaliy Size in Pleasant Garden
5-person families (46 | 3.9%) account for the highest median family income in Pleasant Garden with $233,145 per family, while 5-person families (46 | 3.9%) have the highest median income of $46,629 per family member.
| Income Bracket | # Families | Median Income |
| 2-Person Families | 600 (51.1%) | $92,843 |
| 3-Person Families | 209 (17.8%) | $105,804 |
| 4-Person Families | 315 (26.8%) | $93,454 |
| 5-Person Families | 46 (3.9%) | $233,145 |
| 6-Person Families | 4 (0.3%) | $0 |
| 7+ Person Families | 0 (0.0%) | $0 |
| Total | 1,174 (100.0%) | $93,682 |
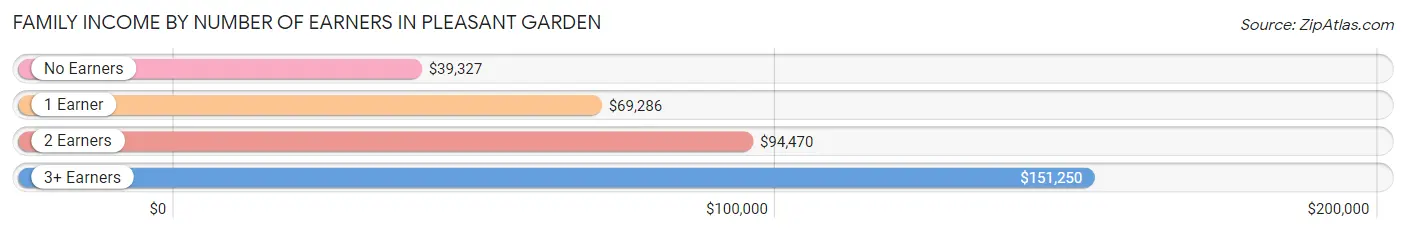
Family Income by Number of Earners in Pleasant Garden
The median family income in Pleasant Garden is $93,682, with families comprising 3+ earners (123) having the highest median family income of $151,250, while families with no earners (139) have the lowest median family income of $39,327, accounting for 10.5% and 11.8% of families, respectively.
| Number of Earners | # Families | Median Income |
| No Earners | 139 (11.8%) | $39,327 |
| 1 Earner | 328 (27.9%) | $69,286 |
| 2 Earners | 584 (49.7%) | $94,470 |
| 3+ Earners | 123 (10.5%) | $151,250 |
| Total | 1,174 (100.0%) | $93,682 |
Household Income in Pleasant Garden
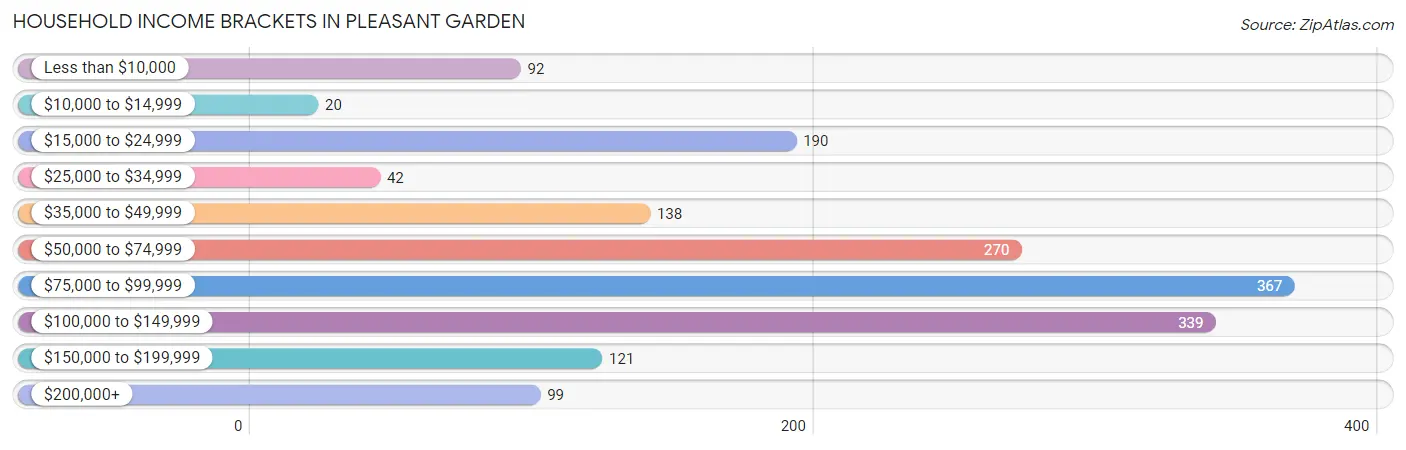
Household Income Brackets in Pleasant Garden
With 367 households falling in the category, the $75,000 to $99,999 income range is the most frequent in Pleasant Garden, accounting for 21.9% of all households. In contrast, only 20 households (1.2%) fall into the $10,000 to $14,999 income bracket, making it the least populous group.
| Income Bracket | # Households | % Households |
| Less than $10,000 | 92 | 5.5% |
| $10,000 to $14,999 | 20 | 1.2% |
| $15,000 to $24,999 | 190 | 11.3% |
| $25,000 to $34,999 | 42 | 2.5% |
| $35,000 to $49,999 | 138 | 8.2% |
| $50,000 to $74,999 | 270 | 16.1% |
| $75,000 to $99,999 | 367 | 21.9% |
| $100,000 to $149,999 | 339 | 20.2% |
| $150,000 to $199,999 | 121 | 7.2% |
| $200,000+ | 99 | 5.9% |
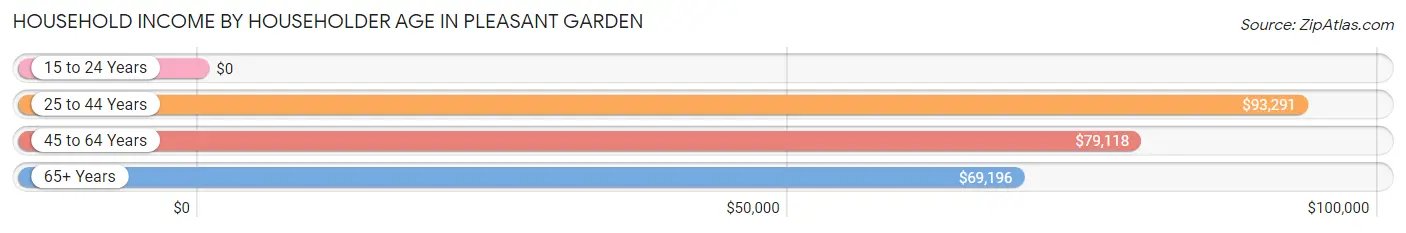
Household Income by Householder Age in Pleasant Garden
The median household income in Pleasant Garden is $84,395, with the highest median household income of $93,291 found in the 25 to 44 years age bracket for the primary householder. A total of 465 households (27.7%) fall into this category. Meanwhile, the 15 to 24 years age bracket for the primary householder has the lowest median household income of $0, with 65 households (3.9%) in this group.
| Income Bracket | # Households | Median Income |
| 15 to 24 Years | 65 (3.9%) | $0 |
| 25 to 44 Years | 465 (27.7%) | $93,291 |
| 45 to 64 Years | 640 (38.2%) | $79,118 |
| 65+ Years | 507 (30.2%) | $69,196 |
| Total | 1,677 (100.0%) | $84,395 |
Poverty in Pleasant Garden
Income Below Poverty by Sex and Age in Pleasant Garden
With 7.2% poverty level for males and 13.5% for females among the residents of Pleasant Garden, 35 to 44 year old males and 12 to 14 year old females are the most vulnerable to poverty, with 30 males (40.5%) and 59 females (76.6%) in their respective age groups living below the poverty level.
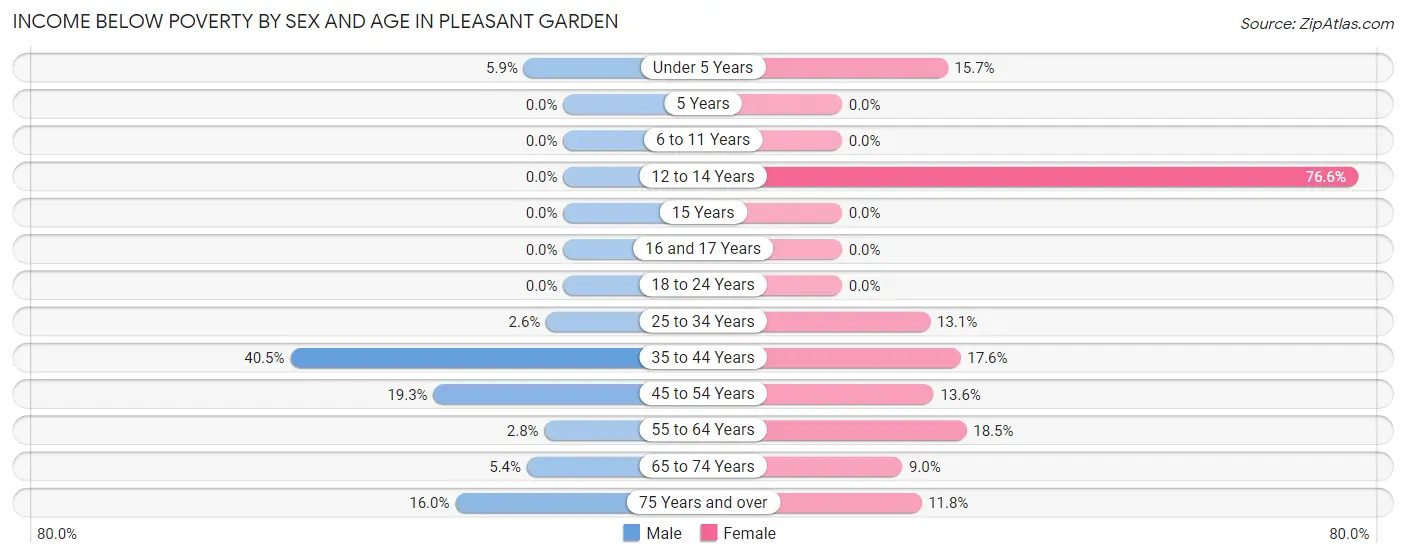
| Age Bracket | Male | Female |
| Under 5 Years | 9 (5.9%) | 8 (15.7%) |
| 5 Years | 0 (0.0%) | 0 (0.0%) |
| 6 to 11 Years | 0 (0.0%) | 0 (0.0%) |
| 12 to 14 Years | 0 (0.0%) | 59 (76.6%) |
| 15 Years | 0 (0.0%) | 0 (0.0%) |
| 16 and 17 Years | 0 (0.0%) | 0 (0.0%) |
| 18 to 24 Years | 0 (0.0%) | 0 (0.0%) |
| 25 to 34 Years | 12 (2.5%) | 30 (13.1%) |
| 35 to 44 Years | 30 (40.5%) | 31 (17.6%) |
| 45 to 54 Years | 49 (19.3%) | 33 (13.6%) |
| 55 to 64 Years | 8 (2.8%) | 54 (18.5%) |
| 65 to 74 Years | 11 (5.4%) | 35 (8.9%) |
| 75 Years and over | 47 (16.0%) | 97 (11.8%) |
| Total | 166 (7.2%) | 347 (13.5%) |
Income Above Poverty by Sex and Age in Pleasant Garden
According to the poverty statistics in Pleasant Garden, males aged 6 to 11 years and females aged 6 to 11 years are the age groups that are most secure financially, with 100.0% of males and 100.0% of females in these age groups living above the poverty line.
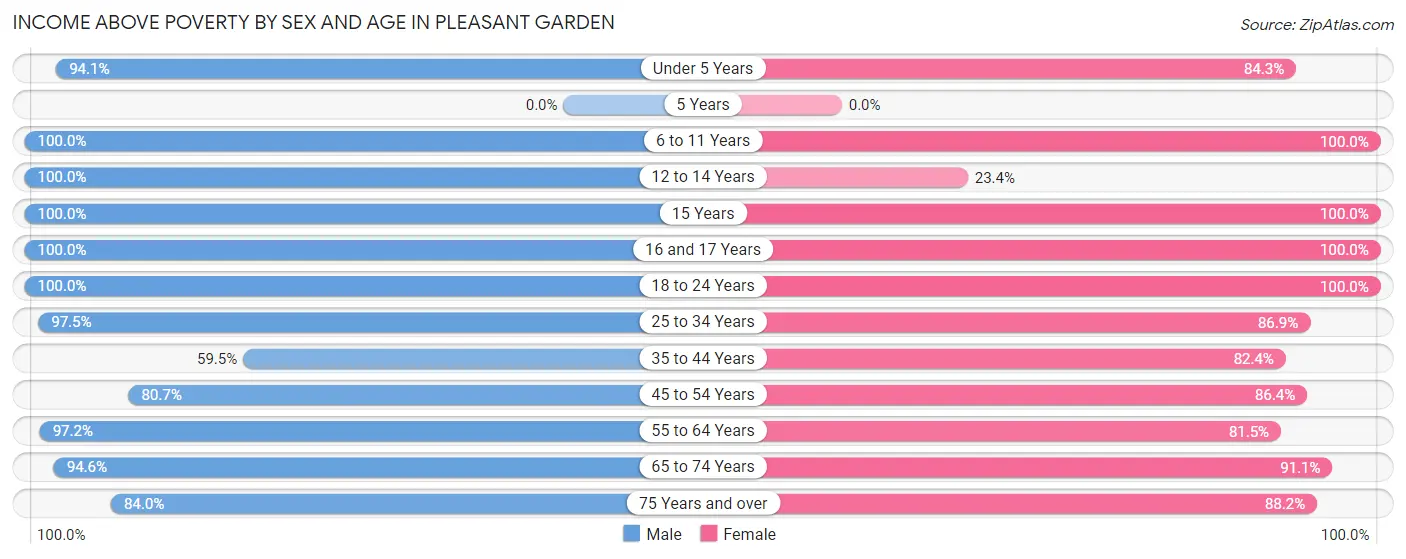
| Age Bracket | Male | Female |
| Under 5 Years | 144 (94.1%) | 43 (84.3%) |
| 5 Years | 0 (0.0%) | 0 (0.0%) |
| 6 to 11 Years | 294 (100.0%) | 23 (100.0%) |
| 12 to 14 Years | 40 (100.0%) | 18 (23.4%) |
| 15 Years | 7 (100.0%) | 55 (100.0%) |
| 16 and 17 Years | 72 (100.0%) | 34 (100.0%) |
| 18 to 24 Years | 165 (100.0%) | 169 (100.0%) |
| 25 to 34 Years | 459 (97.5%) | 199 (86.9%) |
| 35 to 44 Years | 44 (59.5%) | 145 (82.4%) |
| 45 to 54 Years | 205 (80.7%) | 209 (86.4%) |
| 55 to 64 Years | 277 (97.2%) | 238 (81.5%) |
| 65 to 74 Years | 192 (94.6%) | 356 (91.0%) |
| 75 Years and over | 246 (84.0%) | 726 (88.2%) |
| Total | 2,145 (92.8%) | 2,215 (86.5%) |
Income Below Poverty Among Married-Couple Families in Pleasant Garden
The poverty statistics for married-couple families in Pleasant Garden show that 2.5% or 23 of the total 903 families live below the poverty line. Families with no children have the highest poverty rate of 4.3%, comprising of 23 families. On the other hand, families with 1 or 2 children have the lowest poverty rate of 0.0%, which includes 0 families.
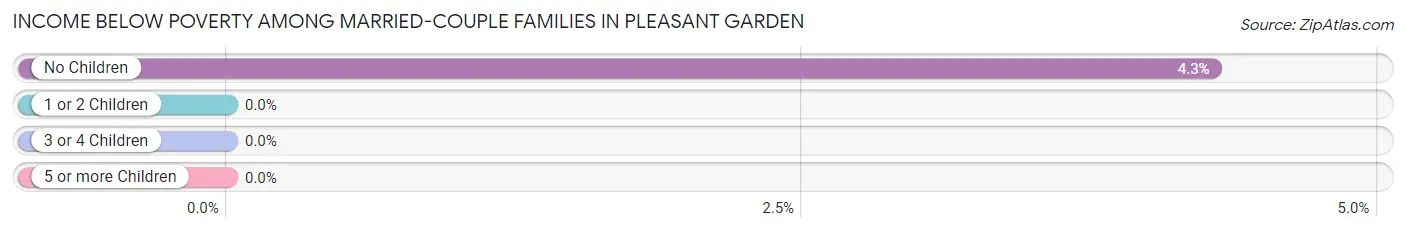
| Children | Above Poverty | Below Poverty |
| No Children | 515 (95.7%) | 23 (4.3%) |
| 1 or 2 Children | 355 (100.0%) | 0 (0.0%) |
| 3 or 4 Children | 10 (100.0%) | 0 (0.0%) |
| 5 or more Children | 0 (0.0%) | 0 (0.0%) |
| Total | 880 (97.5%) | 23 (2.5%) |
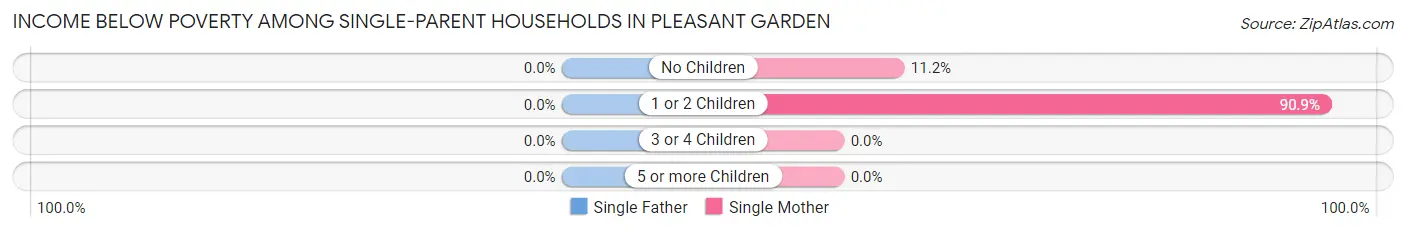
Income Below Poverty Among Single-Parent Households in Pleasant Garden
| Children | Single Father | Single Mother |
| No Children | 0 (0.0%) | 11 (11.2%) |
| 1 or 2 Children | 0 (0.0%) | 60 (90.9%) |
| 3 or 4 Children | 0 (0.0%) | 0 (0.0%) |
| 5 or more Children | 0 (0.0%) | 0 (0.0%) |
| Total | 0 (0.0%) | 71 (34.5%) |
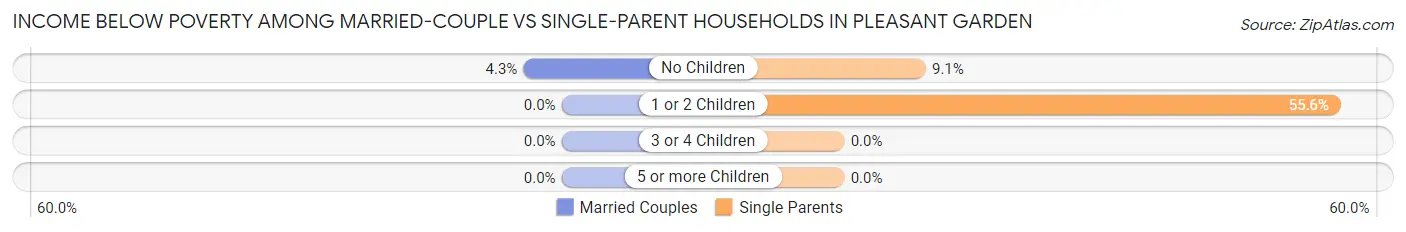
Income Below Poverty Among Married-Couple vs Single-Parent Households in Pleasant Garden
The poverty data for Pleasant Garden shows that 23 of the married-couple family households (2.5%) and 71 of the single-parent households (26.2%) are living below the poverty level. Within the married-couple family households, those with no children have the highest poverty rate, with 23 households (4.3%) falling below the poverty line. Among the single-parent households, those with 1 or 2 children have the highest poverty rate, with 60 household (55.6%) living below poverty.
| Children | Married-Couple Families | Single-Parent Households |
| No Children | 23 (4.3%) | 11 (9.1%) |
| 1 or 2 Children | 0 (0.0%) | 60 (55.6%) |
| 3 or 4 Children | 0 (0.0%) | 0 (0.0%) |
| 5 or more Children | 0 (0.0%) | 0 (0.0%) |
| Total | 23 (2.5%) | 71 (26.2%) |
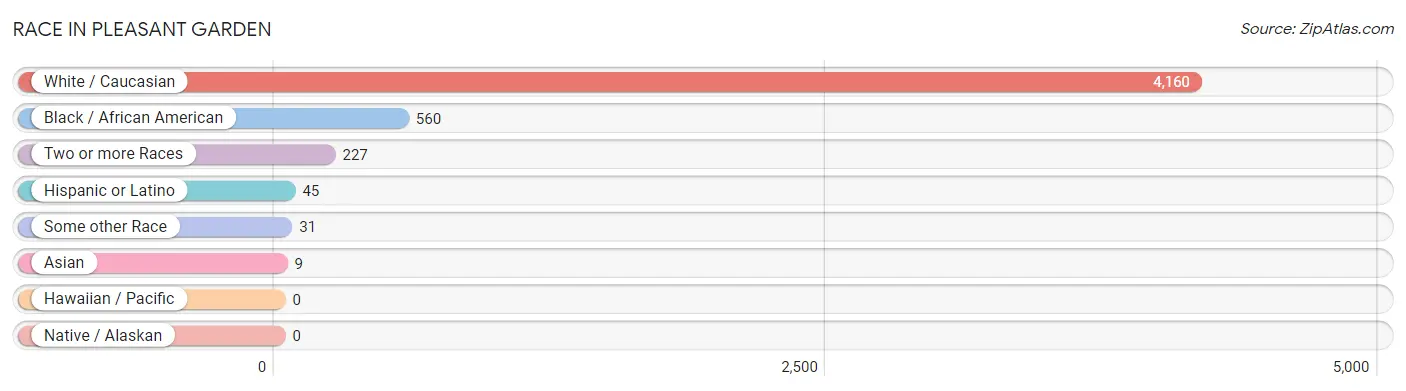
Race in Pleasant Garden
The most populous races in Pleasant Garden are White / Caucasian (4,160 | 83.4%), Black / African American (560 | 11.2%), and Two or more Races (227 | 4.5%).
| Race | # Population | % Population |
| Asian | 9 | 0.2% |
| Black / African American | 560 | 11.2% |
| Hawaiian / Pacific | 0 | 0.0% |
| Hispanic or Latino | 45 | 0.9% |
| Native / Alaskan | 0 | 0.0% |
| White / Caucasian | 4,160 | 83.4% |
| Two or more Races | 227 | 4.5% |
| Some other Race | 31 | 0.6% |
| Total | 4,987 | 100.0% |
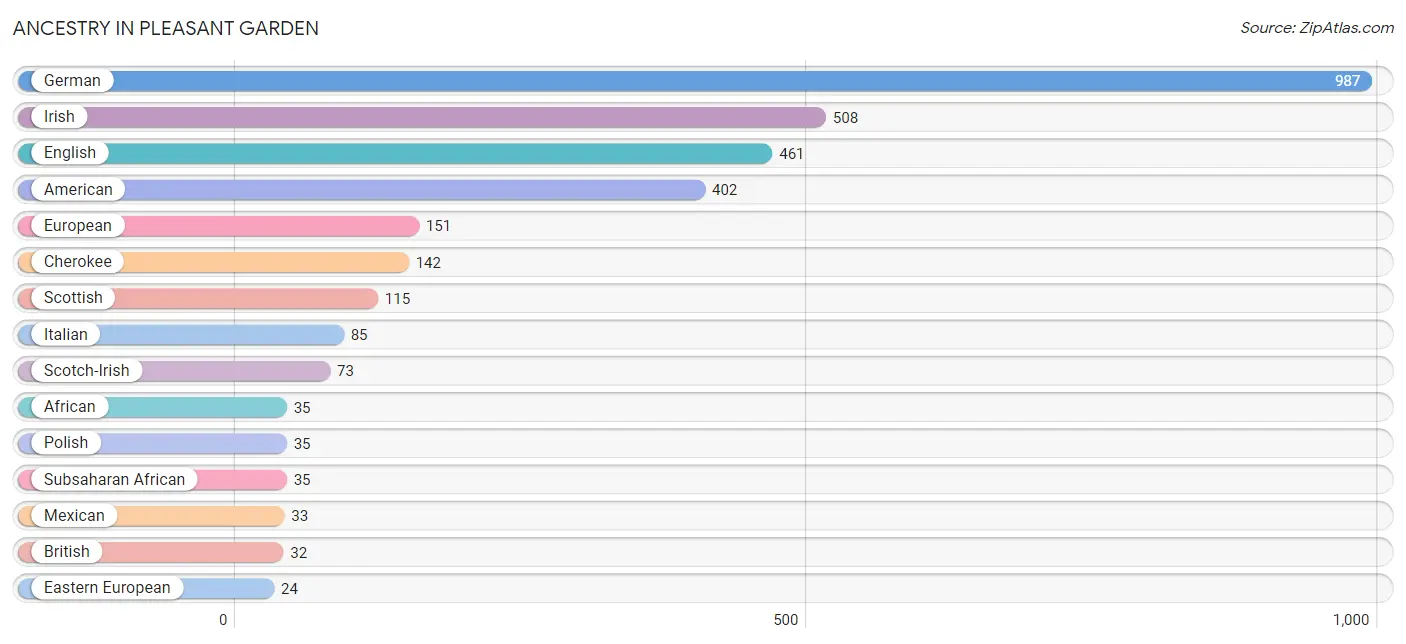
Ancestry in Pleasant Garden
The most populous ancestries reported in Pleasant Garden are German (987 | 19.8%), Irish (508 | 10.2%), English (461 | 9.2%), American (402 | 8.1%), and European (151 | 3.0%), together accounting for 50.3% of all Pleasant Garden residents.
| Ancestry | # Population | % Population |
| African | 35 | 0.7% |
| American | 402 | 8.1% |
| Blackfeet | 10 | 0.2% |
| British | 32 | 0.6% |
| Burmese | 23 | 0.5% |
| Cherokee | 142 | 2.9% |
| Croatian | 17 | 0.3% |
| Eastern European | 24 | 0.5% |
| Ecuadorian | 5 | 0.1% |
| English | 461 | 9.2% |
| European | 151 | 3.0% |
| French | 5 | 0.1% |
| German | 987 | 19.8% |
| Irish | 508 | 10.2% |
| Italian | 85 | 1.7% |
| Jamaican | 17 | 0.3% |
| Mexican | 33 | 0.7% |
| Polish | 35 | 0.7% |
| Portuguese | 14 | 0.3% |
| Scotch-Irish | 73 | 1.5% |
| Scottish | 115 | 2.3% |
| South American | 5 | 0.1% |
| Subsaharan African | 35 | 0.7% |
| Swedish | 9 | 0.2% |
| West Indian | 19 | 0.4% | View All 25 Rows |
Immigrants in Pleasant Garden
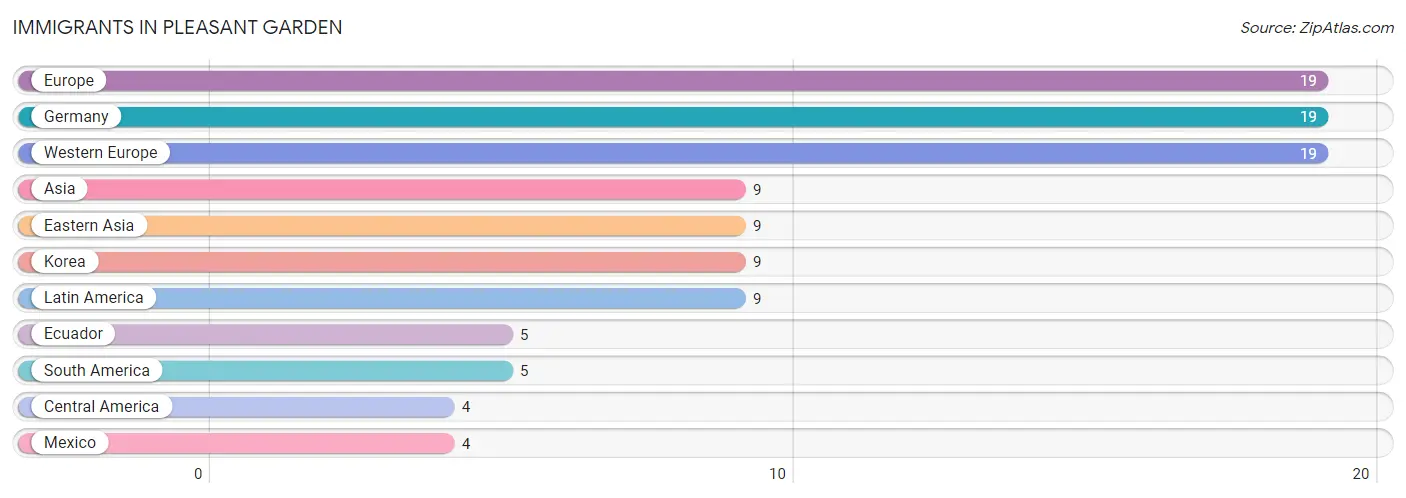
The most numerous immigrant groups reported in Pleasant Garden came from Europe (19 | 0.4%), Germany (19 | 0.4%), Western Europe (19 | 0.4%), Asia (9 | 0.2%), and Eastern Asia (9 | 0.2%), together accounting for 1.5% of all Pleasant Garden residents.
| Immigration Origin | # Population | % Population |
| Asia | 9 | 0.2% |
| Central America | 4 | 0.1% |
| Eastern Asia | 9 | 0.2% |
| Ecuador | 5 | 0.1% |
| Europe | 19 | 0.4% |
| Germany | 19 | 0.4% |
| Korea | 9 | 0.2% |
| Latin America | 9 | 0.2% |
| Mexico | 4 | 0.1% |
| South America | 5 | 0.1% |
| Western Europe | 19 | 0.4% | View All 11 Rows |
Sex and Age in Pleasant Garden
Sex and Age in Pleasant Garden
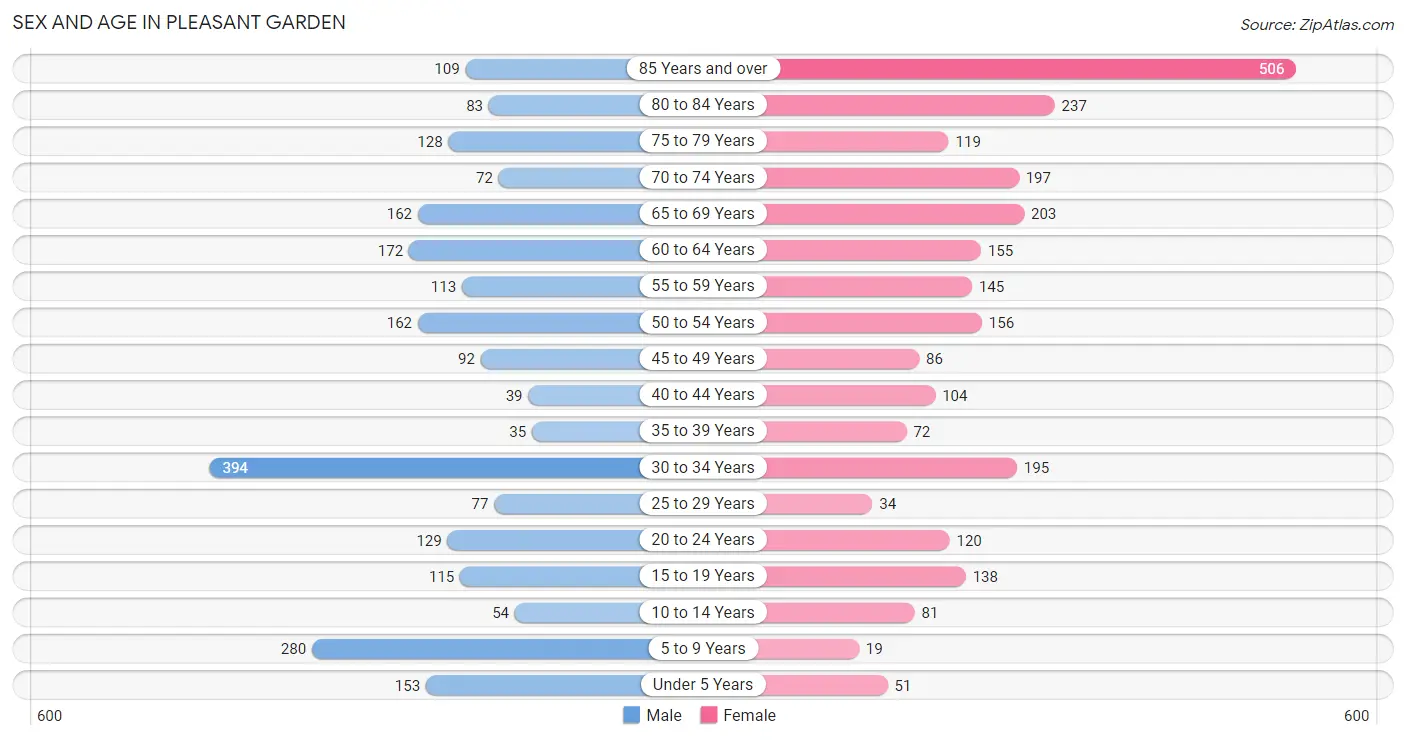
The most populous age groups in Pleasant Garden are 30 to 34 Years (394 | 16.6%) for men and 85 Years and over (506 | 19.3%) for women.
| Age Bracket | Male | Female |
| Under 5 Years | 153 (6.5%) | 51 (1.9%) |
| 5 to 9 Years | 280 (11.8%) | 19 (0.7%) |
| 10 to 14 Years | 54 (2.3%) | 81 (3.1%) |
| 15 to 19 Years | 115 (4.9%) | 138 (5.3%) |
| 20 to 24 Years | 129 (5.4%) | 120 (4.6%) |
| 25 to 29 Years | 77 (3.3%) | 34 (1.3%) |
| 30 to 34 Years | 394 (16.6%) | 195 (7.4%) |
| 35 to 39 Years | 35 (1.5%) | 72 (2.8%) |
| 40 to 44 Years | 39 (1.7%) | 104 (4.0%) |
| 45 to 49 Years | 92 (3.9%) | 86 (3.3%) |
| 50 to 54 Years | 162 (6.8%) | 156 (6.0%) |
| 55 to 59 Years | 113 (4.8%) | 145 (5.5%) |
| 60 to 64 Years | 172 (7.3%) | 155 (5.9%) |
| 65 to 69 Years | 162 (6.8%) | 203 (7.7%) |
| 70 to 74 Years | 72 (3.0%) | 197 (7.5%) |
| 75 to 79 Years | 128 (5.4%) | 119 (4.5%) |
| 80 to 84 Years | 83 (3.5%) | 237 (9.0%) |
| 85 Years and over | 109 (4.6%) | 506 (19.3%) |
| Total | 2,369 (100.0%) | 2,618 (100.0%) |
Families and Households in Pleasant Garden
Median Family Size in Pleasant Garden
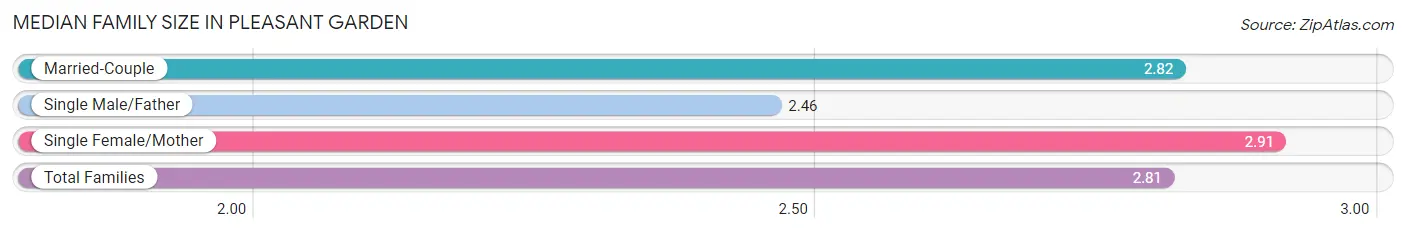
The median family size in Pleasant Garden is 2.81 persons per family, with single female/mother families (206 | 17.5%) accounting for the largest median family size of 2.91 persons per family. On the other hand, single male/father families (65 | 5.5%) represent the smallest median family size with 2.46 persons per family.
| Family Type | # Families | Family Size |
| Married-Couple | 903 (76.9%) | 2.82 |
| Single Male/Father | 65 (5.5%) | 2.46 |
| Single Female/Mother | 206 (17.5%) | 2.91 |
| Total Families | 1,174 (100.0%) | 2.81 |
Median Household Size in Pleasant Garden
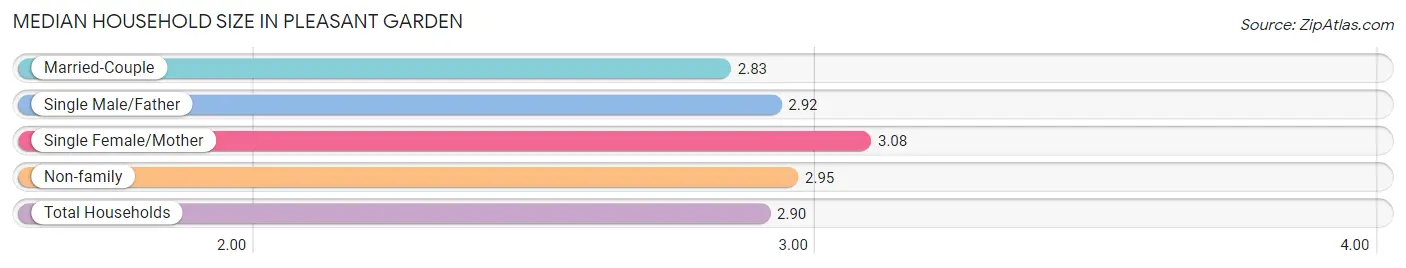
The median household size in Pleasant Garden is 2.90 persons per household, with single female/mother households (206 | 12.3%) accounting for the largest median household size of 3.08 persons per household. married-couple households (903 | 53.8%) represent the smallest median household size with 2.83 persons per household.
| Household Type | # Households | Household Size |
| Married-Couple | 903 (53.8%) | 2.83 |
| Single Male/Father | 65 (3.9%) | 2.92 |
| Single Female/Mother | 206 (12.3%) | 3.08 |
| Non-family | 503 (30.0%) | 2.95 |
| Total Households | 1,677 (100.0%) | 2.90 |
Household Size by Marriage Status in Pleasant Garden
Out of a total of 1,677 households in Pleasant Garden, 1,174 (70.0%) are family households, while 503 (30.0%) are nonfamily households. The most numerous type of family households are 2-person households, comprising 589, and the most common type of nonfamily households are 1-person households, comprising 374.
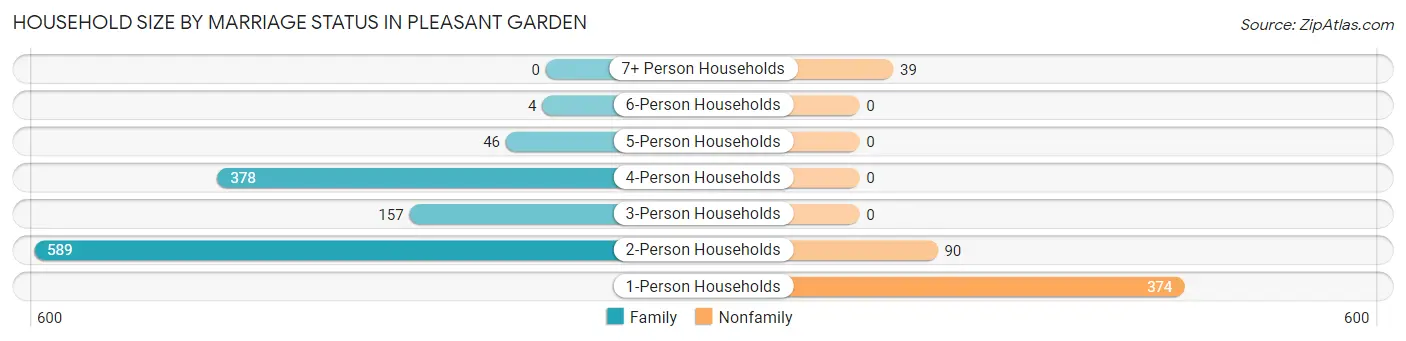
| Household Size | Family Households | Nonfamily Households |
| 1-Person Households | - | 374 (22.3%) |
| 2-Person Households | 589 (35.1%) | 90 (5.4%) |
| 3-Person Households | 157 (9.4%) | 0 (0.0%) |
| 4-Person Households | 378 (22.5%) | 0 (0.0%) |
| 5-Person Households | 46 (2.7%) | 0 (0.0%) |
| 6-Person Households | 4 (0.2%) | 0 (0.0%) |
| 7+ Person Households | 0 (0.0%) | 39 (2.3%) |
| Total | 1,174 (70.0%) | 503 (30.0%) |
Female Fertility in Pleasant Garden
Fertility by Age in Pleasant Garden
Average fertility rate in Pleasant Garden is 62.0 births per 1,000 women. Women in the age bracket of 20 to 34 years have the highest fertility rate with 109.0 births per 1,000 women. Women in the age bracket of 20 to 34 years acount for 80.8% of all women with births.
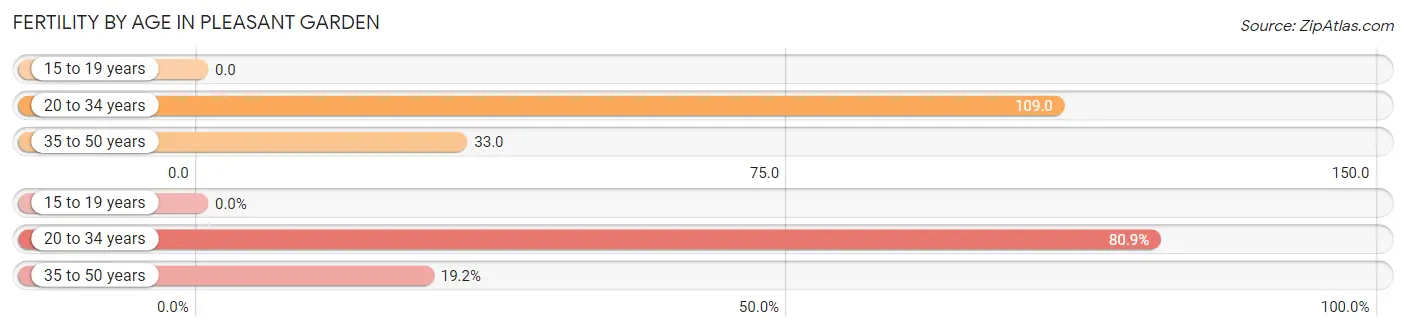
| Age Bracket | Women with Births | Births / 1,000 Women |
| 15 to 19 years | 0 (0.0%) | 0.0 |
| 20 to 34 years | 38 (80.8%) | 109.0 |
| 35 to 50 years | 9 (19.2%) | 33.0 |
| Total | 47 (100.0%) | 62.0 |
Fertility by Age by Marriage Status in Pleasant Garden
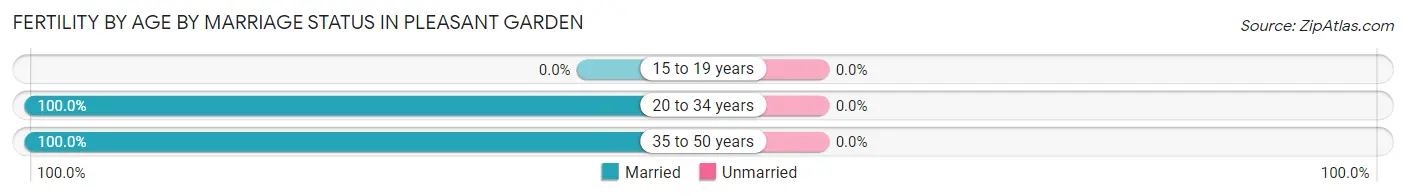
| Age Bracket | Married | Unmarried |
| 15 to 19 years | 0 (0.0%) | 0 (0.0%) |
| 20 to 34 years | 38 (100.0%) | 0 (0.0%) |
| 35 to 50 years | 9 (100.0%) | 0 (0.0%) |
| Total | 47 (100.0%) | 0 (0.0%) |
Fertility by Education in Pleasant Garden
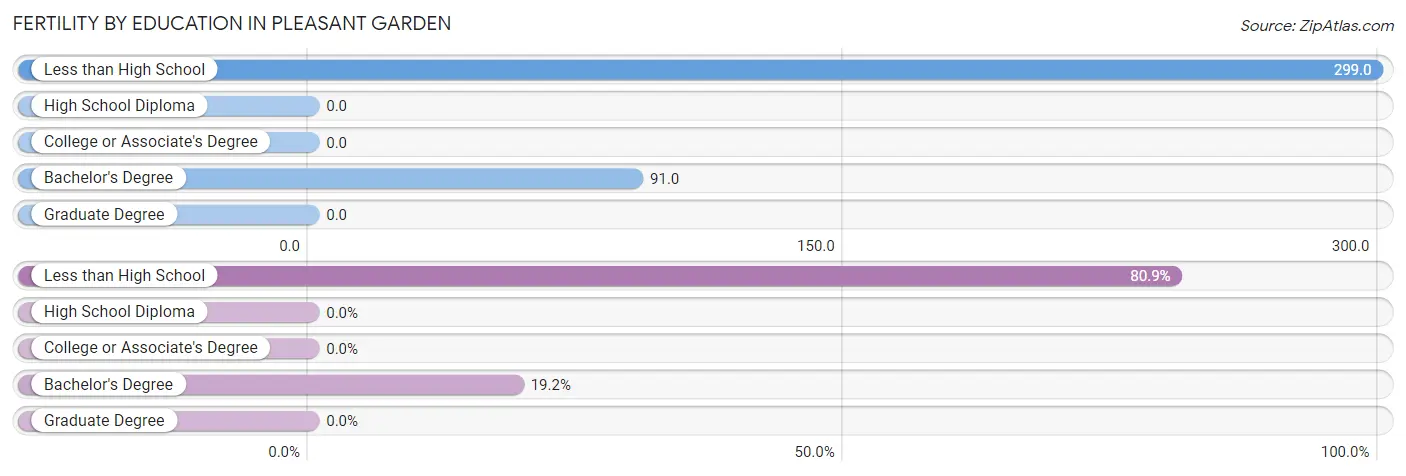
| Educational Attainment | Women with Births | Births / 1,000 Women |
| Less than High School | 38 (80.8%) | 299.0 |
| High School Diploma | 0 (0.0%) | 0.0 |
| College or Associate's Degree | 0 (0.0%) | 0.0 |
| Bachelor's Degree | 9 (19.2%) | 91.0 |
| Graduate Degree | 0 (0.0%) | 0.0 |
| Total | 47 (100.0%) | 62.0 |
Fertility by Education by Marriage Status in Pleasant Garden
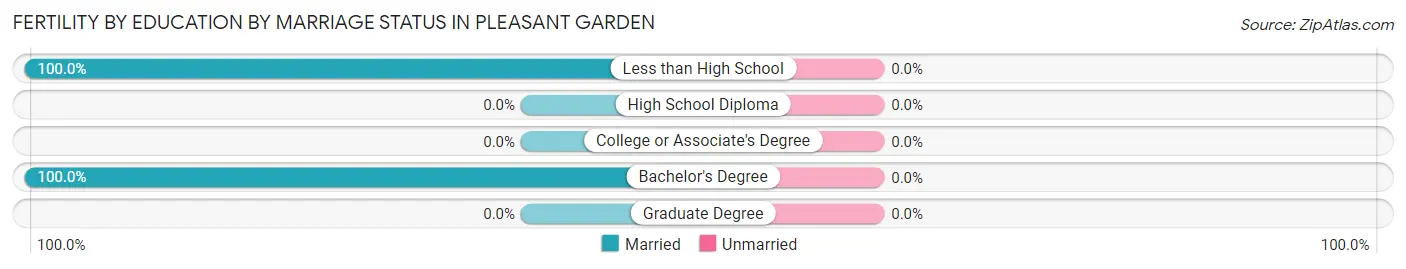
| Educational Attainment | Married | Unmarried |
| Less than High School | 38 (100.0%) | 0 (0.0%) |
| High School Diploma | 0 (0.0%) | 0 (0.0%) |
| College or Associate's Degree | 0 (0.0%) | 0 (0.0%) |
| Bachelor's Degree | 9 (100.0%) | 0 (0.0%) |
| Graduate Degree | 0 (0.0%) | 0 (0.0%) |
| Total | 47 (100.0%) | 0 (0.0%) |
Employment Characteristics in Pleasant Garden
Employment by Class of Employer in Pleasant Garden
Among the 2,213 employed individuals in Pleasant Garden, private company employees (1,440 | 65.1%), local government employees (416 | 18.8%), and not-for-profit organizations (152 | 6.9%) make up the most common classes of employment.
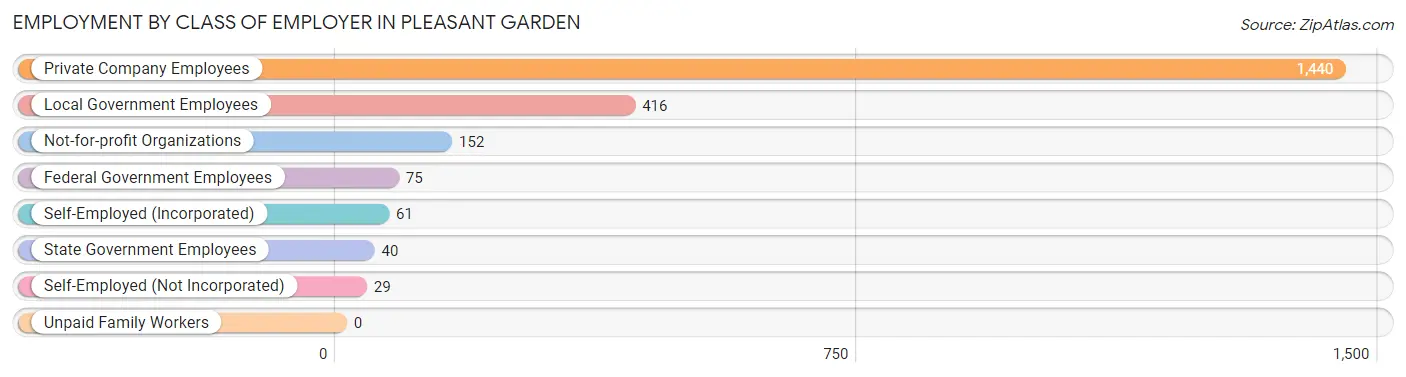
| Employer Class | # Employees | % Employees |
| Private Company Employees | 1,440 | 65.1% |
| Self-Employed (Incorporated) | 61 | 2.8% |
| Self-Employed (Not Incorporated) | 29 | 1.3% |
| Not-for-profit Organizations | 152 | 6.9% |
| Local Government Employees | 416 | 18.8% |
| State Government Employees | 40 | 1.8% |
| Federal Government Employees | 75 | 3.4% |
| Unpaid Family Workers | 0 | 0.0% |
| Total | 2,213 | 100.0% |
Employment Status by Age in Pleasant Garden
According to the labor force statistics for Pleasant Garden, out of the total population over 16 years of age (4,287), 53.1% or 2,276 individuals are in the labor force, with 1.2% or 27 of them unemployed. The age group with the highest labor force participation rate is 20 to 24 years, with 94.4% or 235 individuals in the labor force. Within the labor force, the 55 to 59 years age range has the highest percentage of unemployed individuals, with 9.2% or 19 of them being unemployed.

| Age Bracket | In Labor Force | Unemployed |
| 16 to 19 Years | 85 (44.5%) | 0 (0.0%) |
| 20 to 24 Years | 235 (94.4%) | 0 (0.0%) |
| 25 to 29 Years | 99 (89.2%) | 0 (0.0%) |
| 30 to 34 Years | 536 (91.0%) | 0 (0.0%) |
| 35 to 44 Years | 179 (71.6%) | 0 (0.0%) |
| 45 to 54 Years | 397 (80.0%) | 0 (0.0%) |
| 55 to 59 Years | 206 (79.8%) | 19 (9.2%) |
| 60 to 64 Years | 262 (80.1%) | 8 (3.1%) |
| 65 to 74 Years | 192 (30.3%) | 0 (0.0%) |
| 75 Years and over | 87 (7.4%) | 0 (0.0%) |
| Total | 2,276 (53.1%) | 27 (1.2%) |
Employment Status by Educational Attainment in Pleasant Garden
According to labor force statistics for Pleasant Garden, 82.7% of individuals (1,680) out of the total population between 25 and 64 years of age (2,031) are in the labor force, with 1.6% or 27 of them being unemployed. The group with the highest labor force participation rate are those with the educational attainment of college / associate degree, with 89.6% or 699 individuals in the labor force. Within the labor force, individuals with less than high school education have the highest percentage of unemployment, with 31.1% or 19 of them being unemployed.
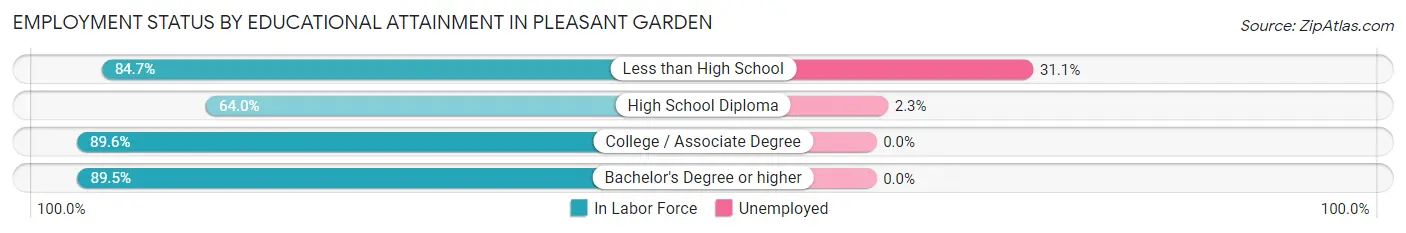
| Educational Attainment | In Labor Force | Unemployed |
| Less than High School | 61 (84.7%) | 22 (31.1%) |
| High School Diploma | 341 (64.0%) | 12 (2.3%) |
| College / Associate Degree | 699 (89.6%) | 0 (0.0%) |
| Bachelor's Degree or higher | 578 (89.5%) | 0 (0.0%) |
| Total | 1,680 (82.7%) | 32 (1.6%) |
Employment Occupations by Sex in Pleasant Garden
Management, Business, Science and Arts Occupations
The most common Management, Business, Science and Arts occupations in Pleasant Garden are Health Diagnosing & Treating (358 | 15.9%), Community & Social Service (248 | 11.0%), Management (196 | 8.7%), Education Instruction & Library (188 | 8.4%), and Business & Financial (138 | 6.1%).
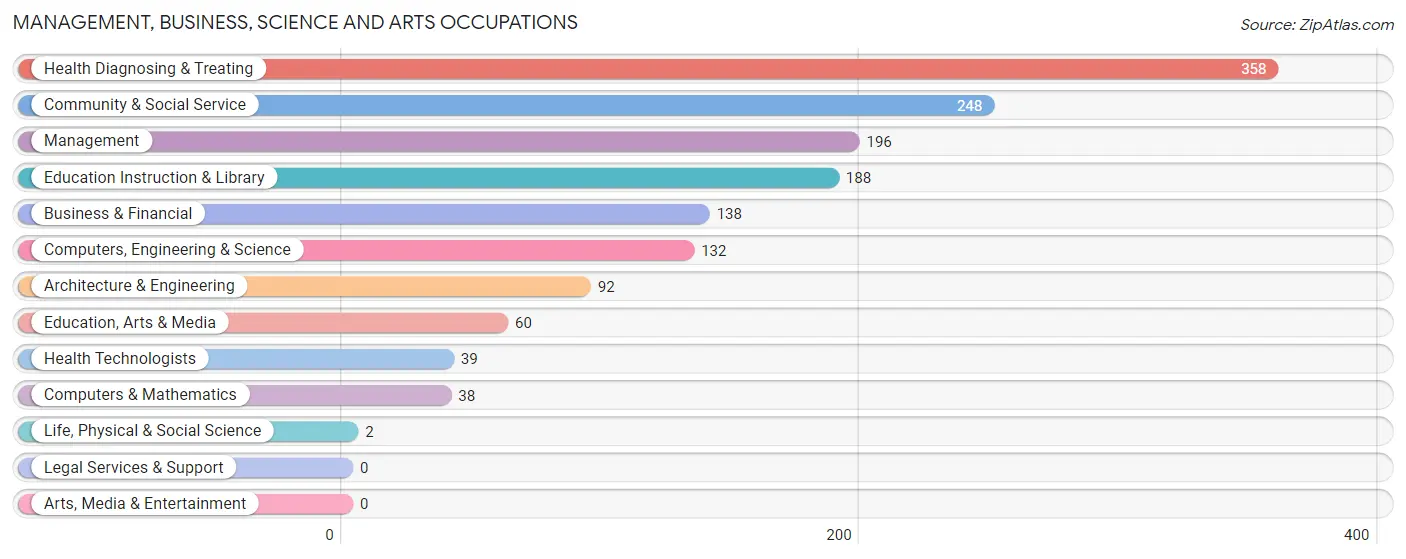
Management, Business, Science and Arts Occupations by Sex
Within the Management, Business, Science and Arts occupations in Pleasant Garden, the most male-oriented occupations are Computers, Engineering & Science (100.0%), Computers & Mathematics (100.0%), and Architecture & Engineering (100.0%), while the most female-oriented occupations are Education, Arts & Media (100.0%), Community & Social Service (90.3%), and Education Instruction & Library (87.2%).
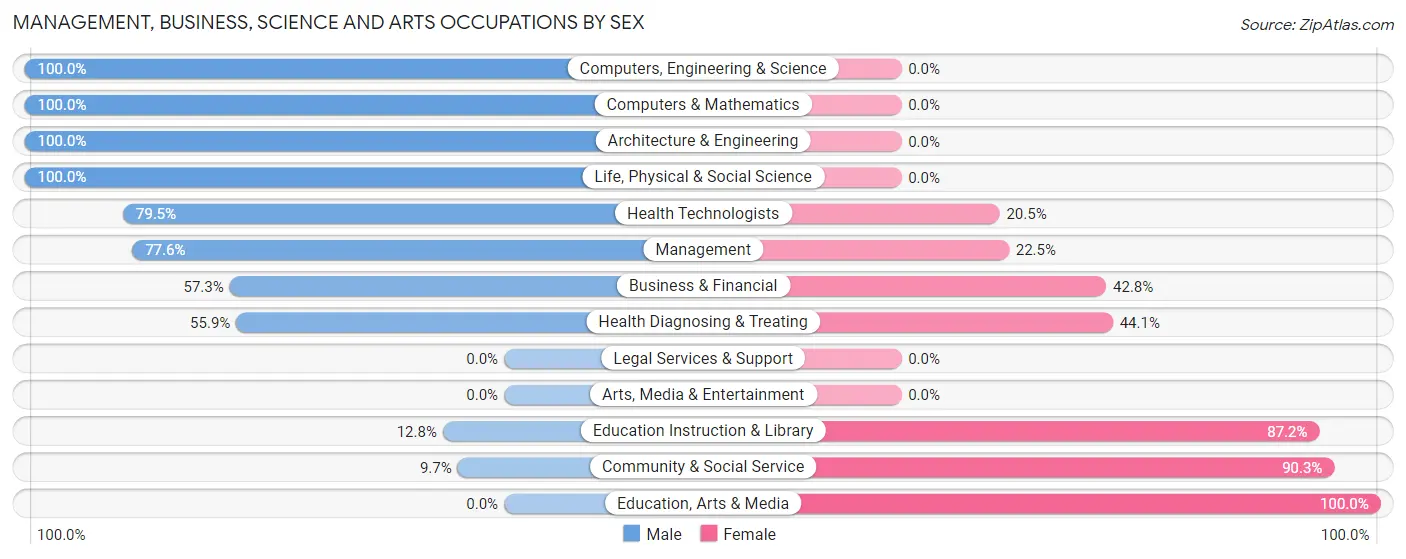
| Occupation | Male | Female |
| Management | 152 (77.5%) | 44 (22.5%) |
| Business & Financial | 79 (57.3%) | 59 (42.7%) |
| Computers, Engineering & Science | 132 (100.0%) | 0 (0.0%) |
| Computers & Mathematics | 38 (100.0%) | 0 (0.0%) |
| Architecture & Engineering | 92 (100.0%) | 0 (0.0%) |
| Life, Physical & Social Science | 2 (100.0%) | 0 (0.0%) |
| Community & Social Service | 24 (9.7%) | 224 (90.3%) |
| Education, Arts & Media | 0 (0.0%) | 60 (100.0%) |
| Legal Services & Support | 0 (0.0%) | 0 (0.0%) |
| Education Instruction & Library | 24 (12.8%) | 164 (87.2%) |
| Arts, Media & Entertainment | 0 (0.0%) | 0 (0.0%) |
| Health Diagnosing & Treating | 200 (55.9%) | 158 (44.1%) |
| Health Technologists | 31 (79.5%) | 8 (20.5%) |
| Total (Category) | 587 (54.8%) | 485 (45.2%) |
| Total (Overall) | 1,261 (56.0%) | 990 (44.0%) |
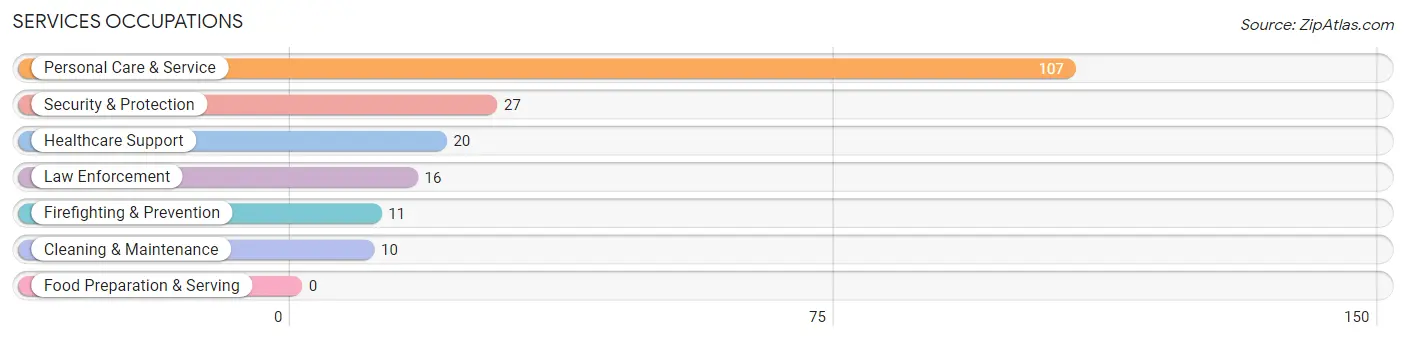
Services Occupations
The most common Services occupations in Pleasant Garden are Personal Care & Service (107 | 4.8%), Security & Protection (27 | 1.2%), Healthcare Support (20 | 0.9%), Law Enforcement (16 | 0.7%), and Firefighting & Prevention (11 | 0.5%).
Services Occupations by Sex
Within the Services occupations in Pleasant Garden, the most male-oriented occupations are Security & Protection (100.0%), Firefighting & Prevention (100.0%), and Law Enforcement (100.0%), while the most female-oriented occupations are Healthcare Support (100.0%), Cleaning & Maintenance (90.0%), and Personal Care & Service (57.9%).
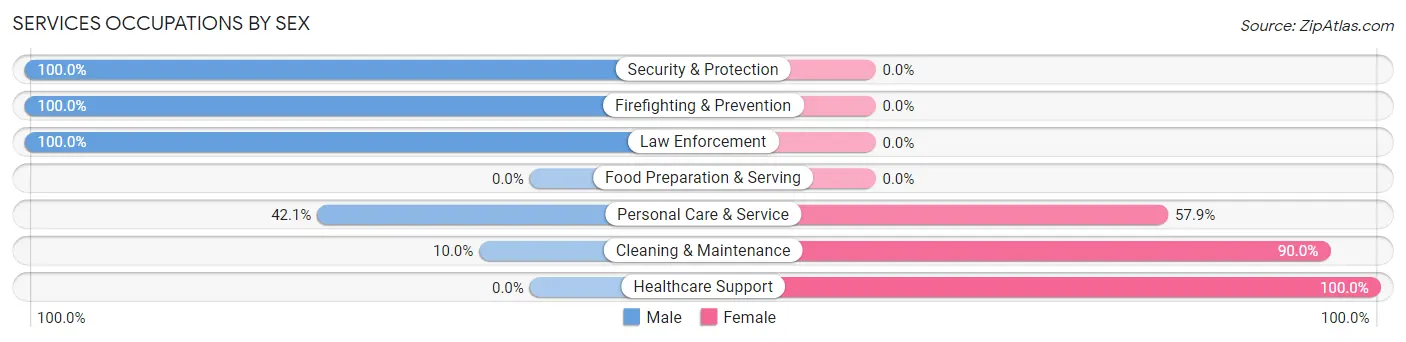
| Occupation | Male | Female |
| Healthcare Support | 0 (0.0%) | 20 (100.0%) |
| Security & Protection | 27 (100.0%) | 0 (0.0%) |
| Firefighting & Prevention | 11 (100.0%) | 0 (0.0%) |
| Law Enforcement | 16 (100.0%) | 0 (0.0%) |
| Food Preparation & Serving | 0 (0.0%) | 0 (0.0%) |
| Cleaning & Maintenance | 1 (10.0%) | 9 (90.0%) |
| Personal Care & Service | 45 (42.1%) | 62 (57.9%) |
| Total (Category) | 73 (44.5%) | 91 (55.5%) |
| Total (Overall) | 1,261 (56.0%) | 990 (44.0%) |
Sales and Office Occupations
The most common Sales and Office occupations in Pleasant Garden are Sales & Related (187 | 8.3%), and Office & Administration (183 | 8.1%).
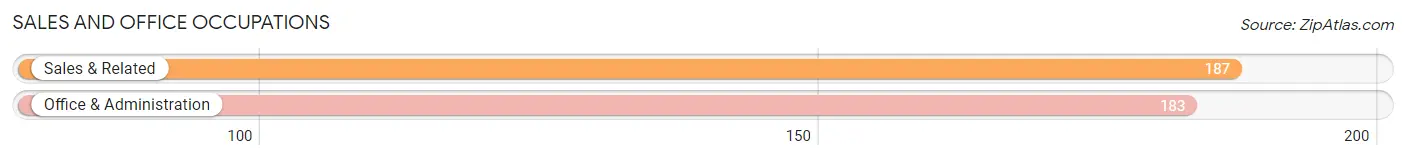
Sales and Office Occupations by Sex
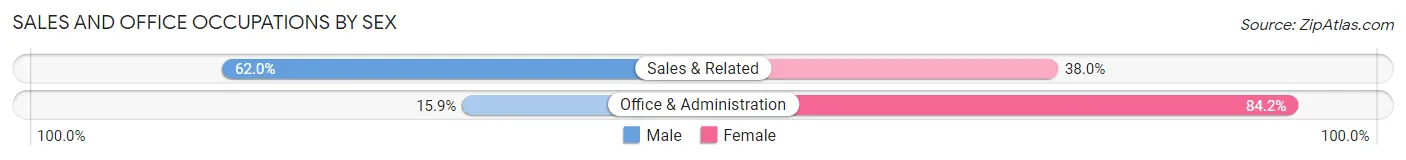
| Occupation | Male | Female |
| Sales & Related | 116 (62.0%) | 71 (38.0%) |
| Office & Administration | 29 (15.9%) | 154 (84.2%) |
| Total (Category) | 145 (39.2%) | 225 (60.8%) |
| Total (Overall) | 1,261 (56.0%) | 990 (44.0%) |
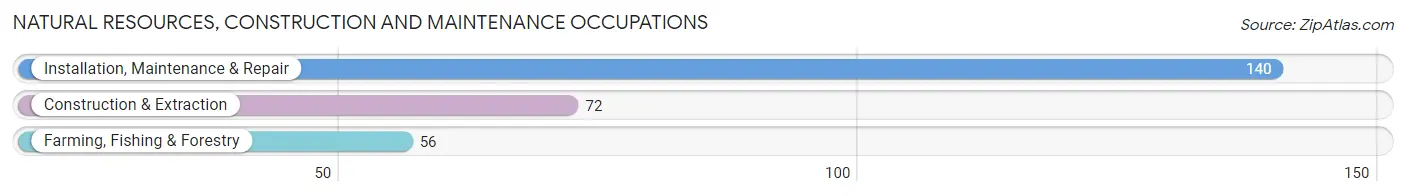
Natural Resources, Construction and Maintenance Occupations
The most common Natural Resources, Construction and Maintenance occupations in Pleasant Garden are Installation, Maintenance & Repair (140 | 6.2%), Construction & Extraction (72 | 3.2%), and Farming, Fishing & Forestry (56 | 2.5%).
Natural Resources, Construction and Maintenance Occupations by Sex
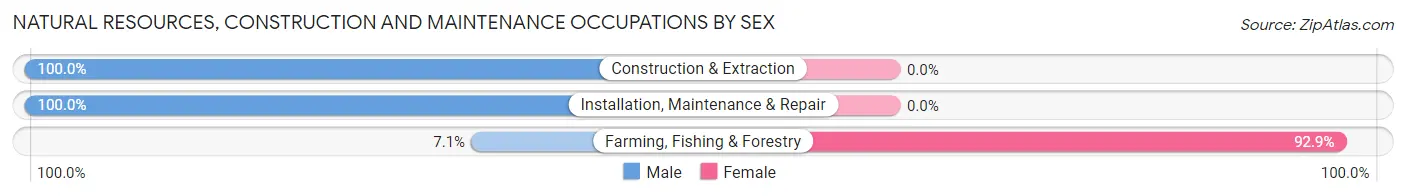
| Occupation | Male | Female |
| Farming, Fishing & Forestry | 4 (7.1%) | 52 (92.9%) |
| Construction & Extraction | 72 (100.0%) | 0 (0.0%) |
| Installation, Maintenance & Repair | 140 (100.0%) | 0 (0.0%) |
| Total (Category) | 216 (80.6%) | 52 (19.4%) |
| Total (Overall) | 1,261 (56.0%) | 990 (44.0%) |
Production, Transportation and Moving Occupations
The most common Production, Transportation and Moving occupations in Pleasant Garden are Production (177 | 7.9%), Material Moving (103 | 4.6%), and Transportation (97 | 4.3%).
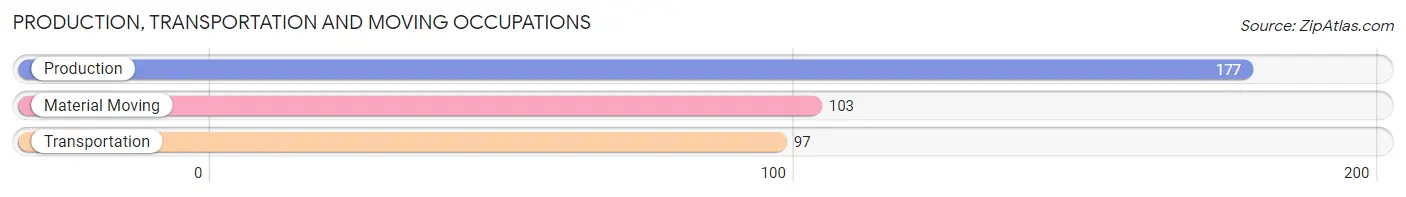
Production, Transportation and Moving Occupations by Sex
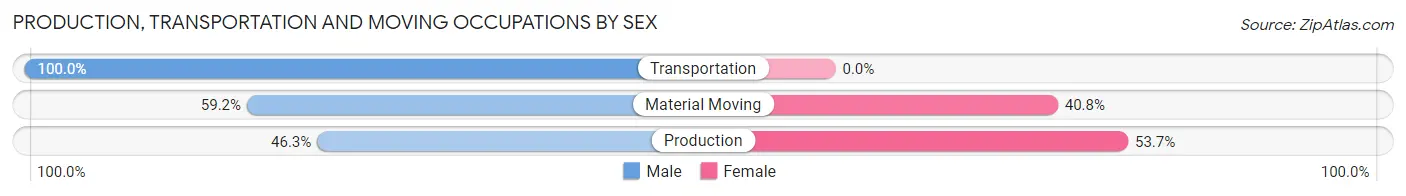
| Occupation | Male | Female |
| Production | 82 (46.3%) | 95 (53.7%) |
| Transportation | 97 (100.0%) | 0 (0.0%) |
| Material Moving | 61 (59.2%) | 42 (40.8%) |
| Total (Category) | 240 (63.7%) | 137 (36.3%) |
| Total (Overall) | 1,261 (56.0%) | 990 (44.0%) |
Employment Industries by Sex in Pleasant Garden
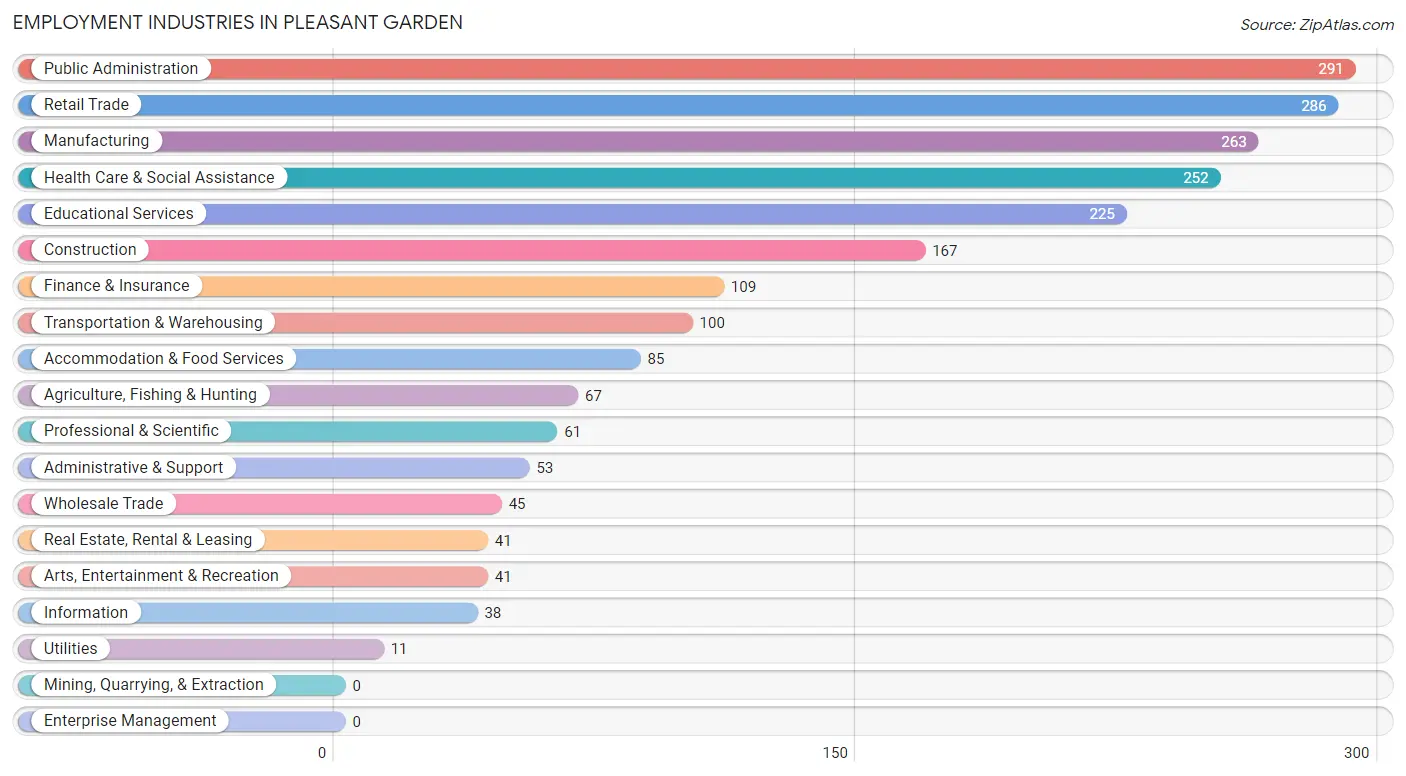
Employment Industries in Pleasant Garden
The major employment industries in Pleasant Garden include Public Administration (291 | 12.9%), Retail Trade (286 | 12.7%), Manufacturing (263 | 11.7%), Health Care & Social Assistance (252 | 11.2%), and Educational Services (225 | 10.0%).
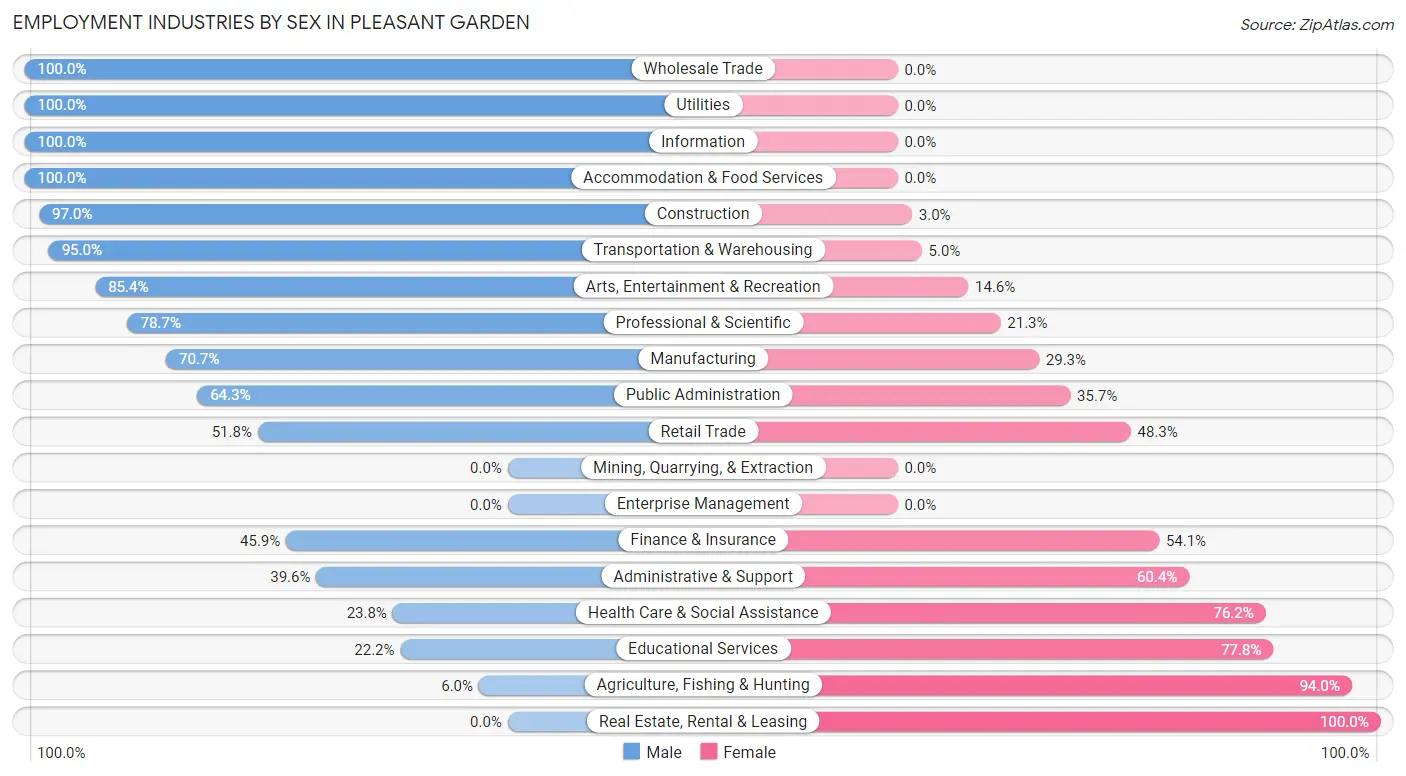
Employment Industries by Sex in Pleasant Garden
The Pleasant Garden industries that see more men than women are Wholesale Trade (100.0%), Utilities (100.0%), and Information (100.0%), whereas the industries that tend to have a higher number of women are Real Estate, Rental & Leasing (100.0%), Agriculture, Fishing & Hunting (94.0%), and Educational Services (77.8%).
| Industry | Male | Female |
| Agriculture, Fishing & Hunting | 4 (6.0%) | 63 (94.0%) |
| Mining, Quarrying, & Extraction | 0 (0.0%) | 0 (0.0%) |
| Construction | 162 (97.0%) | 5 (3.0%) |
| Manufacturing | 186 (70.7%) | 77 (29.3%) |
| Wholesale Trade | 45 (100.0%) | 0 (0.0%) |
| Retail Trade | 148 (51.7%) | 138 (48.2%) |
| Transportation & Warehousing | 95 (95.0%) | 5 (5.0%) |
| Utilities | 11 (100.0%) | 0 (0.0%) |
| Information | 38 (100.0%) | 0 (0.0%) |
| Finance & Insurance | 50 (45.9%) | 59 (54.1%) |
| Real Estate, Rental & Leasing | 0 (0.0%) | 41 (100.0%) |
| Professional & Scientific | 48 (78.7%) | 13 (21.3%) |
| Enterprise Management | 0 (0.0%) | 0 (0.0%) |
| Administrative & Support | 21 (39.6%) | 32 (60.4%) |
| Educational Services | 50 (22.2%) | 175 (77.8%) |
| Health Care & Social Assistance | 60 (23.8%) | 192 (76.2%) |
| Arts, Entertainment & Recreation | 35 (85.4%) | 6 (14.6%) |
| Accommodation & Food Services | 85 (100.0%) | 0 (0.0%) |
| Public Administration | 187 (64.3%) | 104 (35.7%) |
| Total | 1,261 (56.0%) | 990 (44.0%) |
Education in Pleasant Garden
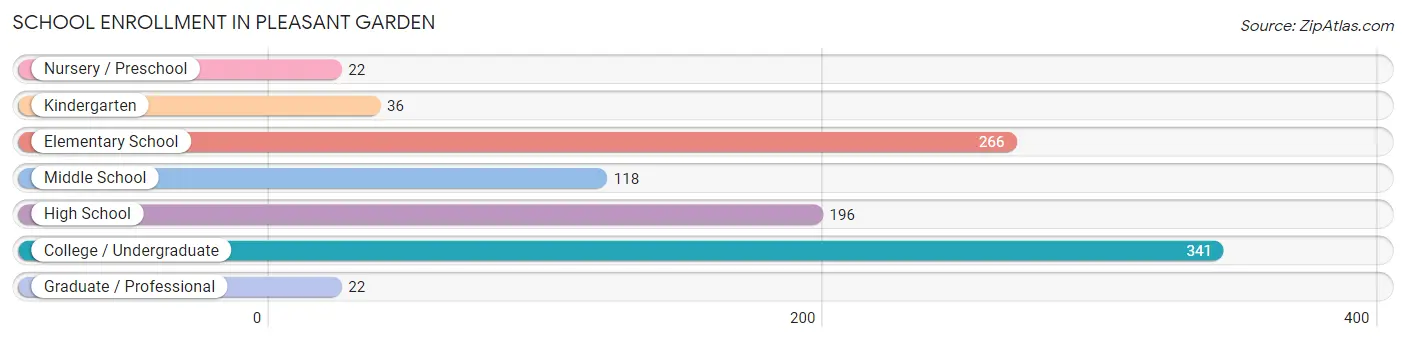
School Enrollment in Pleasant Garden
The most common levels of schooling among the 1,001 students in Pleasant Garden are college / undergraduate (341 | 34.1%), elementary school (266 | 26.6%), and high school (196 | 19.6%).
| School Level | # Students | % Students |
| Nursery / Preschool | 22 | 2.2% |
| Kindergarten | 36 | 3.6% |
| Elementary School | 266 | 26.6% |
| Middle School | 118 | 11.8% |
| High School | 196 | 19.6% |
| College / Undergraduate | 341 | 34.1% |
| Graduate / Professional | 22 | 2.2% |
| Total | 1,001 | 100.0% |
School Enrollment by Age by Funding Source in Pleasant Garden
Out of a total of 1,001 students who are enrolled in schools in Pleasant Garden, 143 (14.3%) attend a private institution, while the remaining 858 (85.7%) are enrolled in public schools. The age group of 3 to 4 year olds has the highest likelihood of being enrolled in private schools, with 22 (100.0% in the age bracket) enrolled. Conversely, the age group of 18 to 19 year olds has the lowest likelihood of being enrolled in a private school, with 85 (100.0% in the age bracket) attending a public institution.
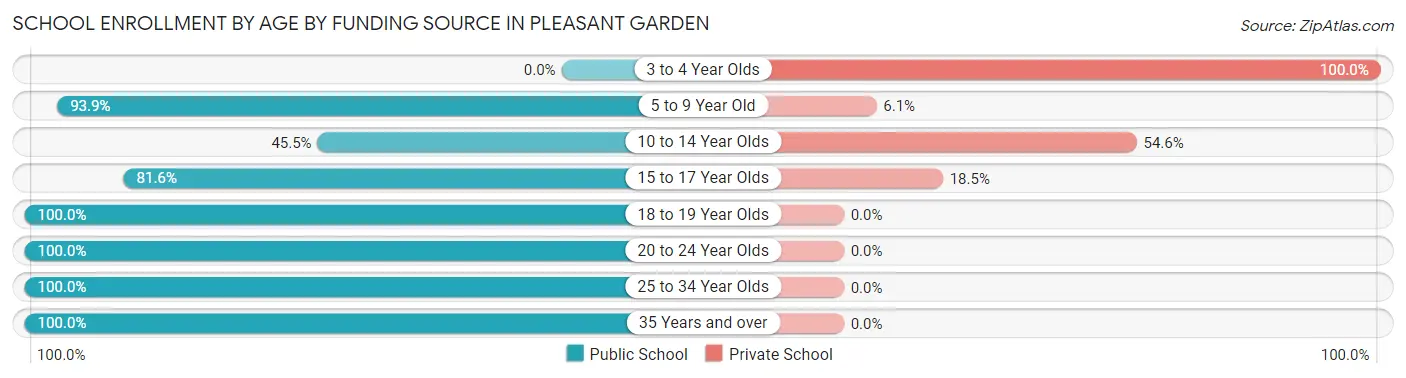
| Age Bracket | Public School | Private School |
| 3 to 4 Year Olds | 0 (0.0%) | 22 (100.0%) |
| 5 to 9 Year Old | 278 (93.9%) | 18 (6.1%) |
| 10 to 14 Year Olds | 60 (45.5%) | 72 (54.5%) |
| 15 to 17 Year Olds | 137 (81.6%) | 31 (18.4%) |
| 18 to 19 Year Olds | 85 (100.0%) | 0 (0.0%) |
| 20 to 24 Year Olds | 73 (100.0%) | 0 (0.0%) |
| 25 to 34 Year Olds | 104 (100.0%) | 0 (0.0%) |
| 35 Years and over | 121 (100.0%) | 0 (0.0%) |
| Total | 858 (85.7%) | 143 (14.3%) |
Educational Attainment by Field of Study in Pleasant Garden
Business (221 | 20.5%), education (194 | 18.0%), engineering (99 | 9.2%), science & technology (93 | 8.6%), and arts & humanities (88 | 8.2%) are the most common fields of study among 1,078 individuals in Pleasant Garden who have obtained a bachelor's degree or higher.
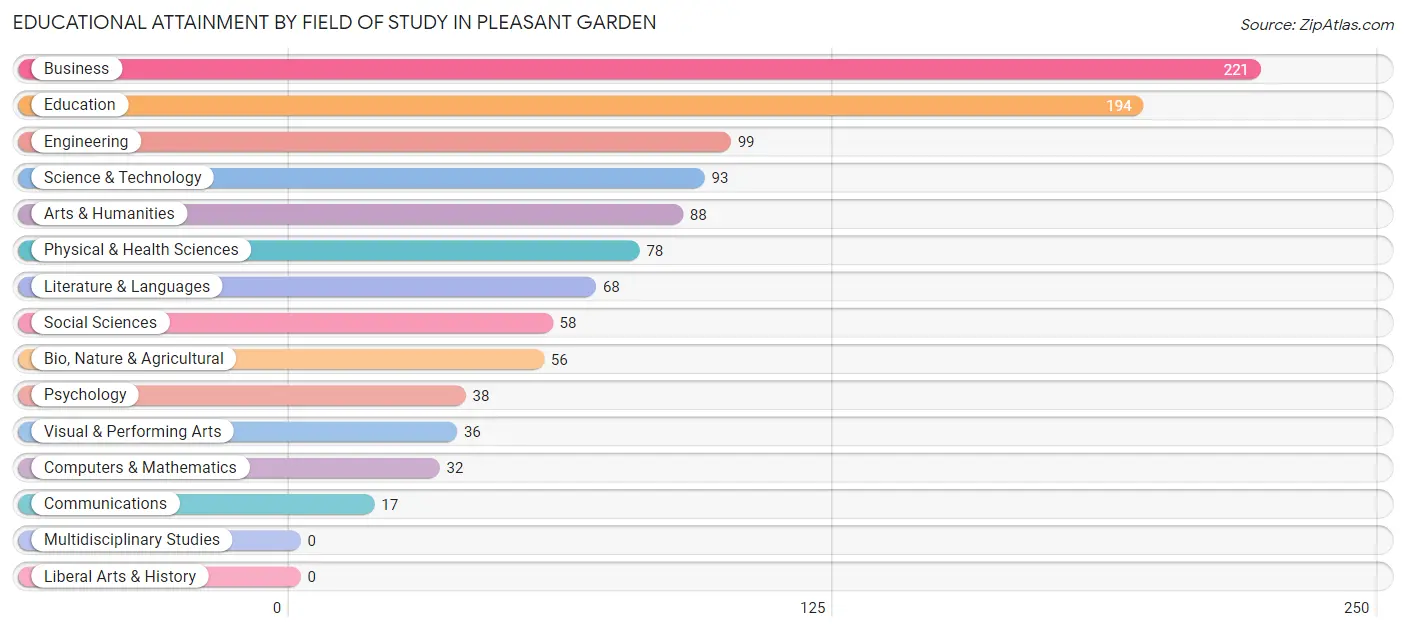
| Field of Study | # Graduates | % Graduates |
| Computers & Mathematics | 32 | 3.0% |
| Bio, Nature & Agricultural | 56 | 5.2% |
| Physical & Health Sciences | 78 | 7.2% |
| Psychology | 38 | 3.5% |
| Social Sciences | 58 | 5.4% |
| Engineering | 99 | 9.2% |
| Multidisciplinary Studies | 0 | 0.0% |
| Science & Technology | 93 | 8.6% |
| Business | 221 | 20.5% |
| Education | 194 | 18.0% |
| Literature & Languages | 68 | 6.3% |
| Liberal Arts & History | 0 | 0.0% |
| Visual & Performing Arts | 36 | 3.3% |
| Communications | 17 | 1.6% |
| Arts & Humanities | 88 | 8.2% |
| Total | 1,078 | 100.0% |
Transportation & Commute in Pleasant Garden
Vehicle Availability by Sex in Pleasant Garden
The most prevalent vehicle ownership categories in Pleasant Garden are males with 2 vehicles (569, accounting for 45.3%) and females with 2 vehicles (406, making up 59.8%).
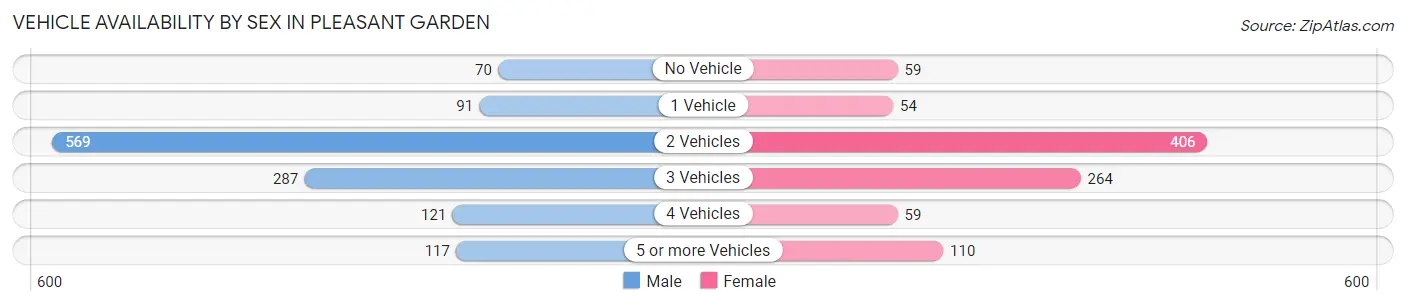
| Vehicles Available | Male | Female |
| No Vehicle | 70 (5.6%) | 59 (6.2%) |
| 1 Vehicle | 91 (7.2%) | 54 (5.7%) |
| 2 Vehicles | 569 (45.3%) | 406 (42.6%) |
| 3 Vehicles | 287 (22.9%) | 264 (27.7%) |
| 4 Vehicles | 121 (9.6%) | 59 (6.2%) |
| 5 or more Vehicles | 117 (9.3%) | 110 (11.6%) |
| Total | 1,255 (100.0%) | 952 (100.0%) |
Commute Time in Pleasant Garden
The most frequently occuring commute durations in Pleasant Garden are 20 to 24 minutes (545 commuters, 27.9%), 25 to 29 minutes (413 commuters, 21.2%), and 60 to 89 minutes (212 commuters, 10.9%).
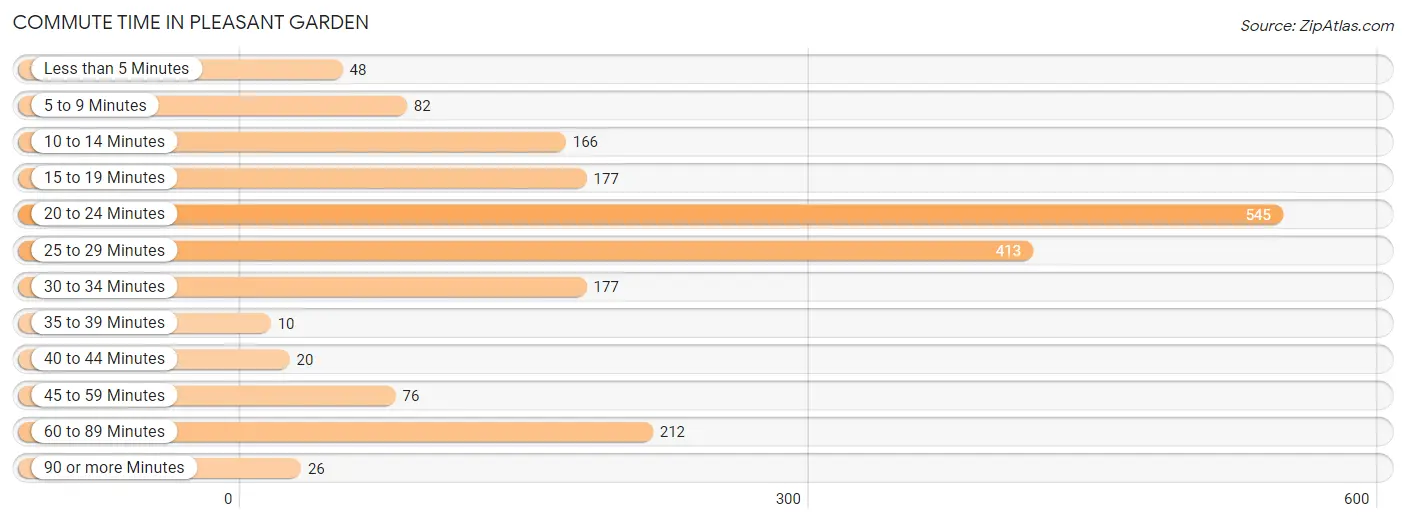
| Commute Time | # Commuters | % Commuters |
| Less than 5 Minutes | 48 | 2.5% |
| 5 to 9 Minutes | 82 | 4.2% |
| 10 to 14 Minutes | 166 | 8.5% |
| 15 to 19 Minutes | 177 | 9.1% |
| 20 to 24 Minutes | 545 | 27.9% |
| 25 to 29 Minutes | 413 | 21.2% |
| 30 to 34 Minutes | 177 | 9.1% |
| 35 to 39 Minutes | 10 | 0.5% |
| 40 to 44 Minutes | 20 | 1.0% |
| 45 to 59 Minutes | 76 | 3.9% |
| 60 to 89 Minutes | 212 | 10.9% |
| 90 or more Minutes | 26 | 1.3% |
Commute Time by Sex in Pleasant Garden
The most common commute times in Pleasant Garden are 20 to 24 minutes (237 commuters, 20.8%) for males and 20 to 24 minutes (308 commuters, 37.8%) for females.
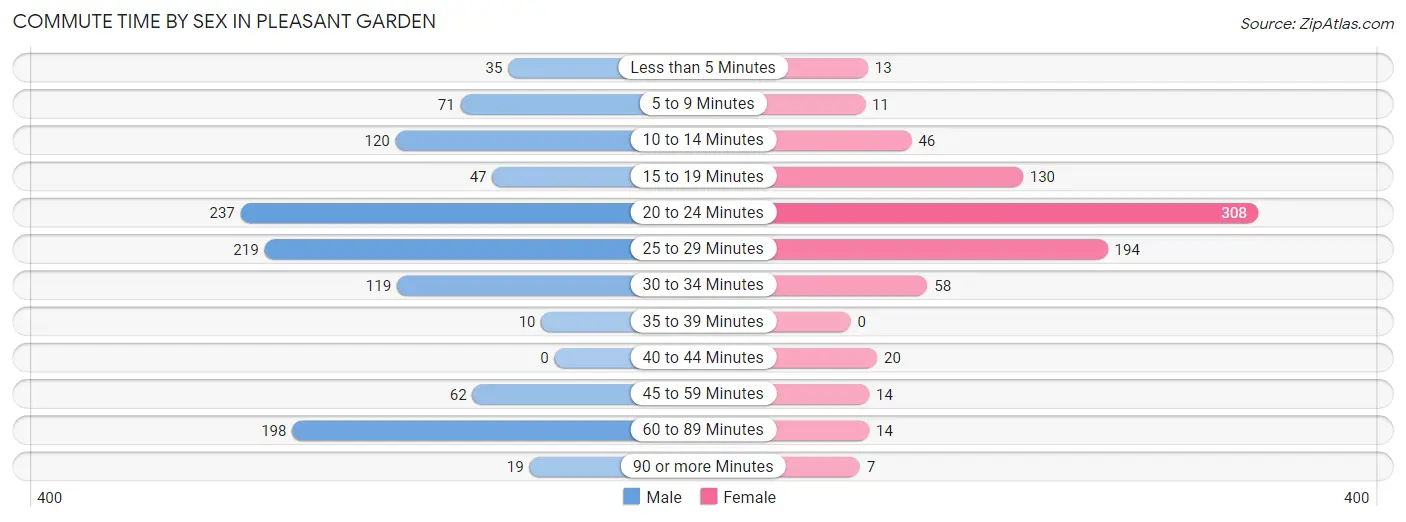
| Commute Time | Male | Female |
| Less than 5 Minutes | 35 (3.1%) | 13 (1.6%) |
| 5 to 9 Minutes | 71 (6.2%) | 11 (1.3%) |
| 10 to 14 Minutes | 120 (10.5%) | 46 (5.6%) |
| 15 to 19 Minutes | 47 (4.1%) | 130 (16.0%) |
| 20 to 24 Minutes | 237 (20.8%) | 308 (37.8%) |
| 25 to 29 Minutes | 219 (19.3%) | 194 (23.8%) |
| 30 to 34 Minutes | 119 (10.5%) | 58 (7.1%) |
| 35 to 39 Minutes | 10 (0.9%) | 0 (0.0%) |
| 40 to 44 Minutes | 0 (0.0%) | 20 (2.5%) |
| 45 to 59 Minutes | 62 (5.4%) | 14 (1.7%) |
| 60 to 89 Minutes | 198 (17.4%) | 14 (1.7%) |
| 90 or more Minutes | 19 (1.7%) | 7 (0.9%) |
Time of Departure to Work by Sex in Pleasant Garden
The most frequent times of departure to work in Pleasant Garden are 6:30 AM to 6:59 AM (260, 22.9%) for males and 4:00 PM to 11:59 PM (180, 22.1%) for females.
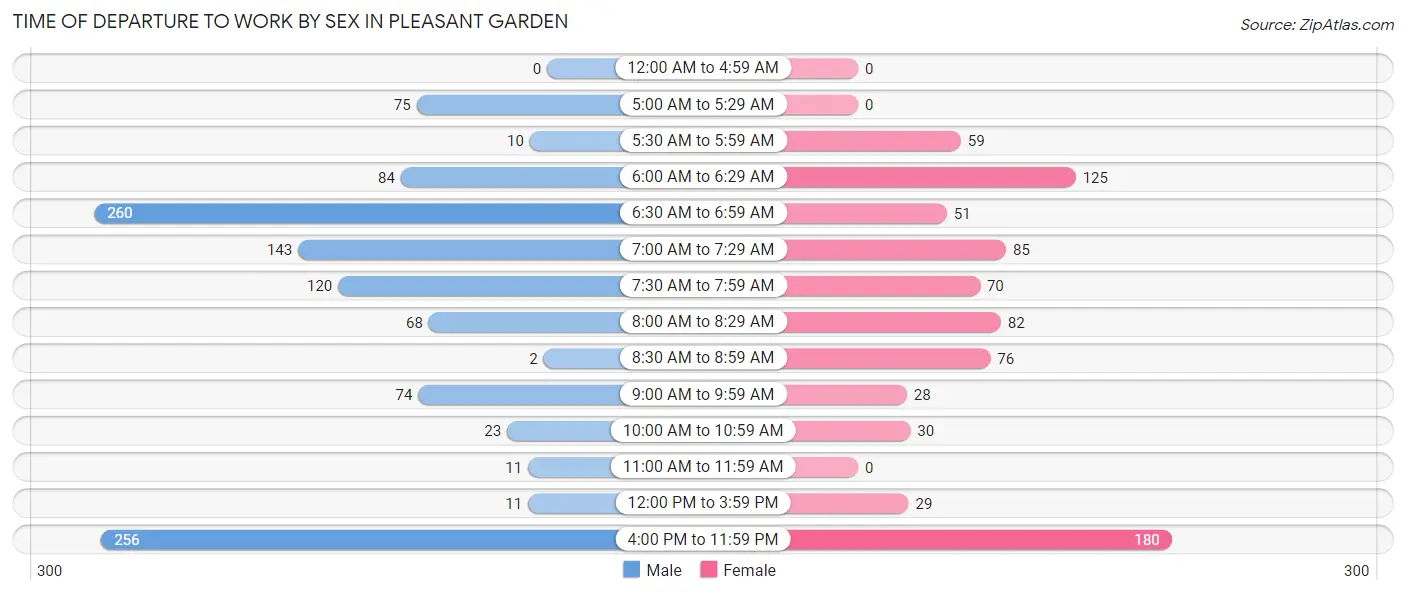
| Time of Departure | Male | Female |
| 12:00 AM to 4:59 AM | 0 (0.0%) | 0 (0.0%) |
| 5:00 AM to 5:29 AM | 75 (6.6%) | 0 (0.0%) |
| 5:30 AM to 5:59 AM | 10 (0.9%) | 59 (7.2%) |
| 6:00 AM to 6:29 AM | 84 (7.4%) | 125 (15.3%) |
| 6:30 AM to 6:59 AM | 260 (22.9%) | 51 (6.3%) |
| 7:00 AM to 7:29 AM | 143 (12.6%) | 85 (10.4%) |
| 7:30 AM to 7:59 AM | 120 (10.5%) | 70 (8.6%) |
| 8:00 AM to 8:29 AM | 68 (6.0%) | 82 (10.1%) |
| 8:30 AM to 8:59 AM | 2 (0.2%) | 76 (9.3%) |
| 9:00 AM to 9:59 AM | 74 (6.5%) | 28 (3.4%) |
| 10:00 AM to 10:59 AM | 23 (2.0%) | 30 (3.7%) |
| 11:00 AM to 11:59 AM | 11 (1.0%) | 0 (0.0%) |
| 12:00 PM to 3:59 PM | 11 (1.0%) | 29 (3.6%) |
| 4:00 PM to 11:59 PM | 256 (22.5%) | 180 (22.1%) |
| Total | 1,137 (100.0%) | 815 (100.0%) |
Housing Occupancy in Pleasant Garden
Occupancy by Ownership in Pleasant Garden
Of the total 1,677 dwellings in Pleasant Garden, owner-occupied units account for 1,352 (80.6%), while renter-occupied units make up 325 (19.4%).
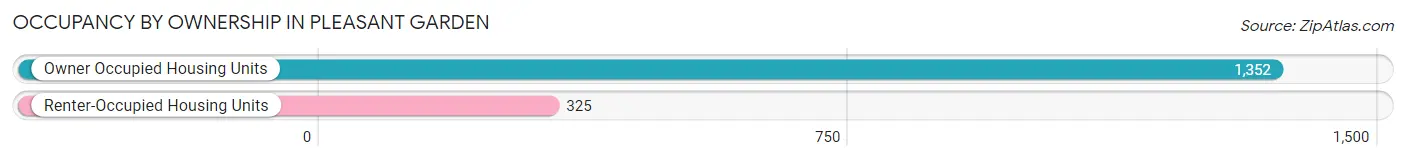
| Occupancy | # Housing Units | % Housing Units |
| Owner Occupied Housing Units | 1,352 | 80.6% |
| Renter-Occupied Housing Units | 325 | 19.4% |
| Total Occupied Housing Units | 1,677 | 100.0% |
Occupancy by Household Size in Pleasant Garden
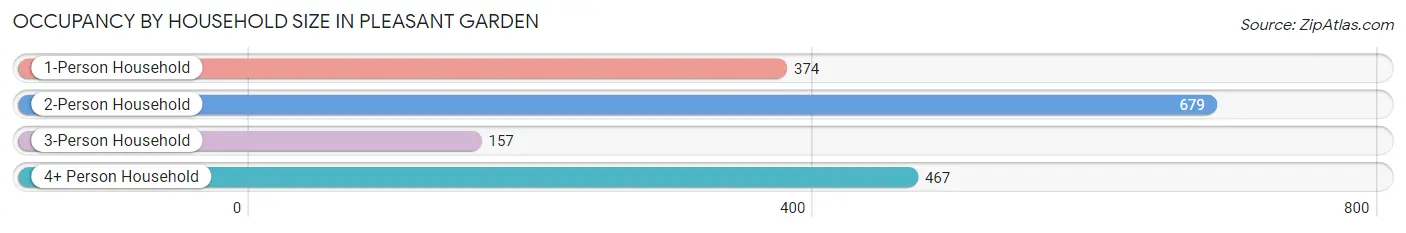
| Household Size | # Housing Units | % Housing Units |
| 1-Person Household | 374 | 22.3% |
| 2-Person Household | 679 | 40.5% |
| 3-Person Household | 157 | 9.4% |
| 4+ Person Household | 467 | 27.9% |
| Total Housing Units | 1,677 | 100.0% |
Occupancy by Ownership by Household Size in Pleasant Garden
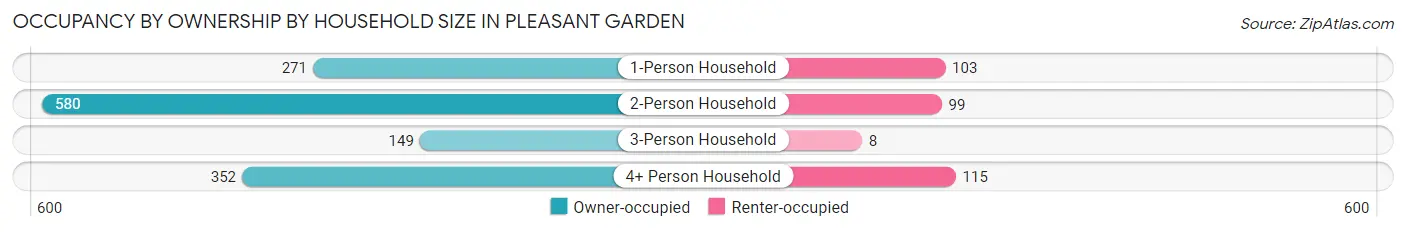
| Household Size | Owner-occupied | Renter-occupied |
| 1-Person Household | 271 (72.5%) | 103 (27.5%) |
| 2-Person Household | 580 (85.4%) | 99 (14.6%) |
| 3-Person Household | 149 (94.9%) | 8 (5.1%) |
| 4+ Person Household | 352 (75.4%) | 115 (24.6%) |
| Total Housing Units | 1,352 (80.6%) | 325 (19.4%) |
Occupancy by Educational Attainment in Pleasant Garden
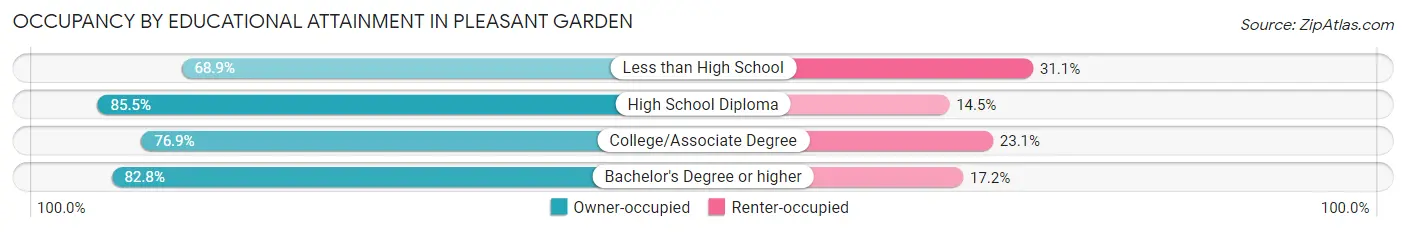
| Household Size | Owner-occupied | Renter-occupied |
| Less than High School | 31 (68.9%) | 14 (31.1%) |
| High School Diploma | 384 (85.5%) | 65 (14.5%) |
| College/Associate Degree | 548 (76.9%) | 165 (23.1%) |
| Bachelor's Degree or higher | 389 (82.8%) | 81 (17.2%) |
Occupancy by Age of Householder in Pleasant Garden
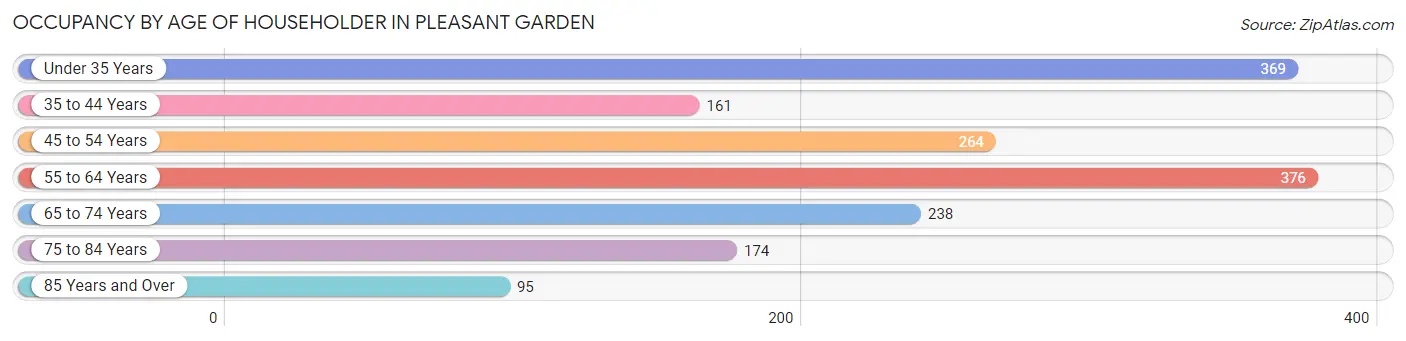
| Age Bracket | # Households | % Households |
| Under 35 Years | 369 | 22.0% |
| 35 to 44 Years | 161 | 9.6% |
| 45 to 54 Years | 264 | 15.7% |
| 55 to 64 Years | 376 | 22.4% |
| 65 to 74 Years | 238 | 14.2% |
| 75 to 84 Years | 174 | 10.4% |
| 85 Years and Over | 95 | 5.7% |
| Total | 1,677 | 100.0% |
Housing Finances in Pleasant Garden
Median Income by Occupancy in Pleasant Garden
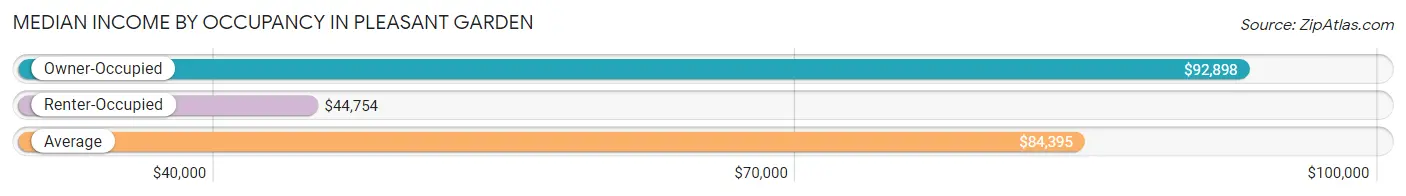
| Occupancy Type | # Households | Median Income |
| Owner-Occupied | 1,352 (80.6%) | $92,898 |
| Renter-Occupied | 325 (19.4%) | $44,754 |
| Average | 1,677 (100.0%) | $84,395 |
Occupancy by Householder Income Bracket in Pleasant Garden
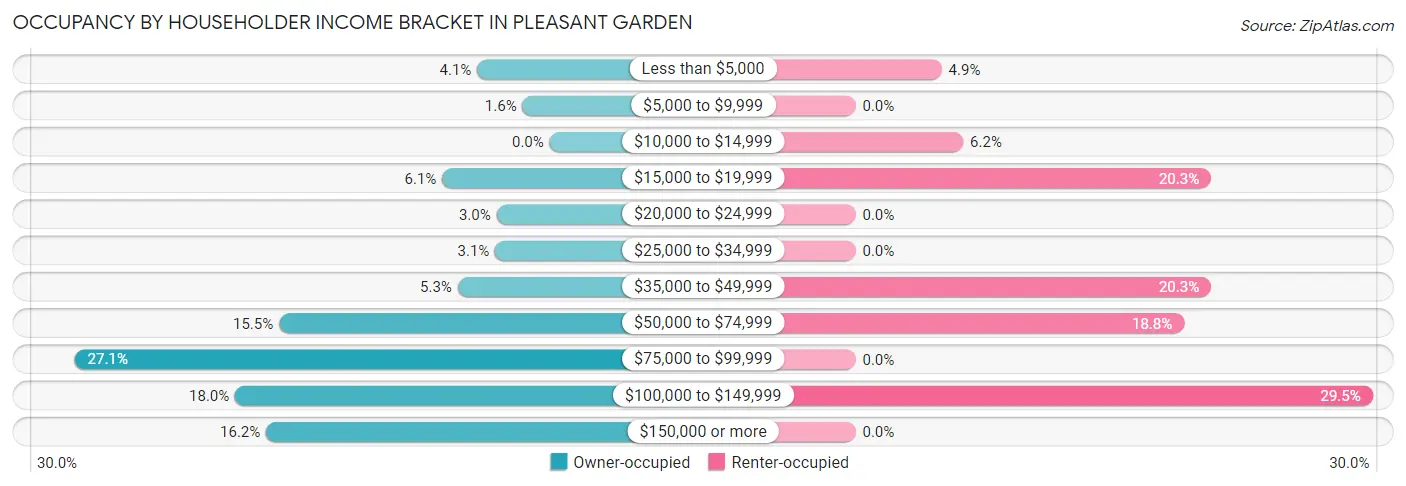
| Income Bracket | Owner-occupied | Renter-occupied |
| Less than $5,000 | 56 (4.1%) | 16 (4.9%) |
| $5,000 to $9,999 | 21 (1.5%) | 0 (0.0%) |
| $10,000 to $14,999 | 0 (0.0%) | 20 (6.1%) |
| $15,000 to $19,999 | 83 (6.1%) | 66 (20.3%) |
| $20,000 to $24,999 | 41 (3.0%) | 0 (0.0%) |
| $25,000 to $34,999 | 42 (3.1%) | 0 (0.0%) |
| $35,000 to $49,999 | 71 (5.2%) | 66 (20.3%) |
| $50,000 to $74,999 | 209 (15.5%) | 61 (18.8%) |
| $75,000 to $99,999 | 367 (27.1%) | 0 (0.0%) |
| $100,000 to $149,999 | 243 (18.0%) | 96 (29.5%) |
| $150,000 or more | 219 (16.2%) | 0 (0.0%) |
| Total | 1,352 (100.0%) | 325 (100.0%) |
Monthly Housing Cost Tiers in Pleasant Garden
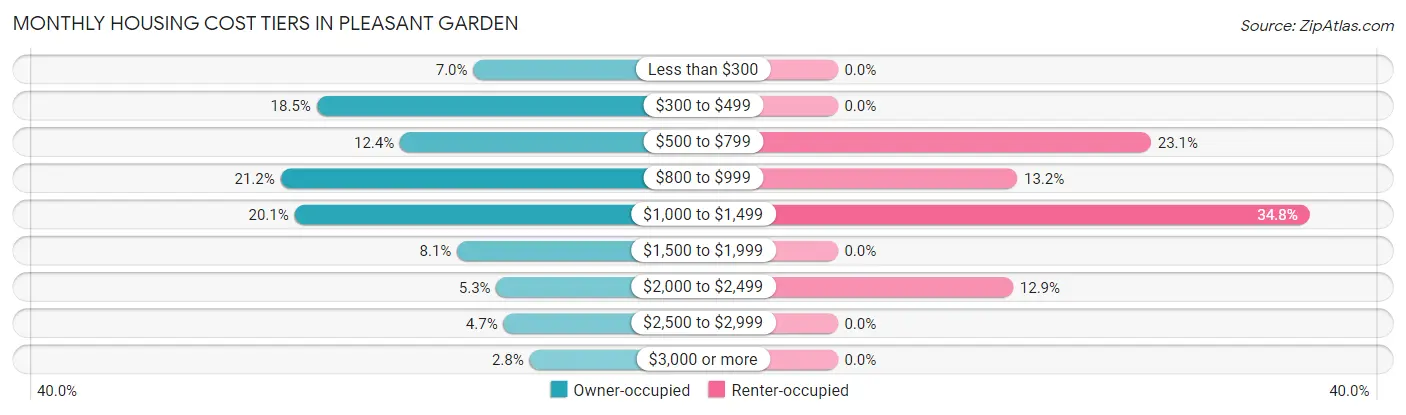
| Monthly Cost | Owner-occupied | Renter-occupied |
| Less than $300 | 94 (7.0%) | 0 (0.0%) |
| $300 to $499 | 250 (18.5%) | 0 (0.0%) |
| $500 to $799 | 167 (12.3%) | 75 (23.1%) |
| $800 to $999 | 286 (21.1%) | 43 (13.2%) |
| $1,000 to $1,499 | 272 (20.1%) | 113 (34.8%) |
| $1,500 to $1,999 | 110 (8.1%) | 0 (0.0%) |
| $2,000 to $2,499 | 71 (5.2%) | 42 (12.9%) |
| $2,500 to $2,999 | 64 (4.7%) | 0 (0.0%) |
| $3,000 or more | 38 (2.8%) | 0 (0.0%) |
| Total | 1,352 (100.0%) | 325 (100.0%) |
Physical Housing Characteristics in Pleasant Garden
Housing Structures in Pleasant Garden
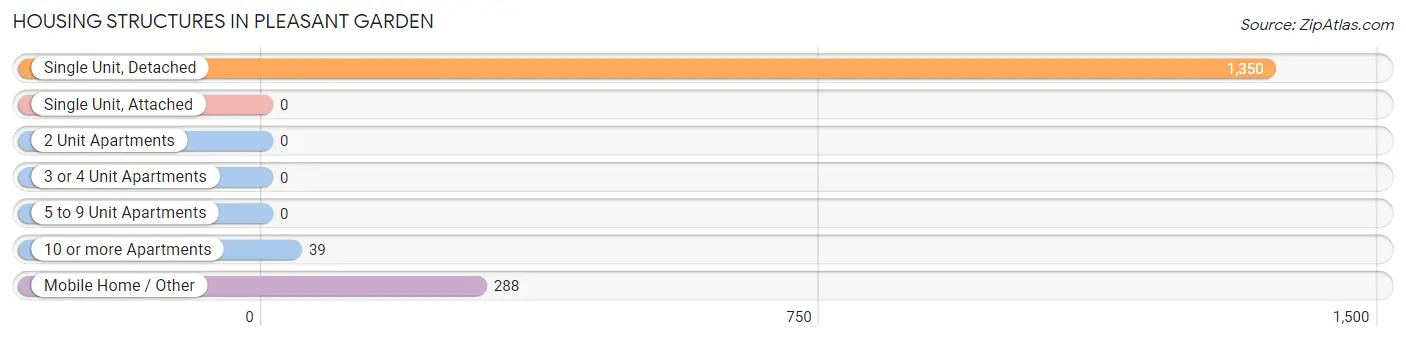
| Structure Type | # Housing Units | % Housing Units |
| Single Unit, Detached | 1,350 | 80.5% |
| Single Unit, Attached | 0 | 0.0% |
| 2 Unit Apartments | 0 | 0.0% |
| 3 or 4 Unit Apartments | 0 | 0.0% |
| 5 to 9 Unit Apartments | 0 | 0.0% |
| 10 or more Apartments | 39 | 2.3% |
| Mobile Home / Other | 288 | 17.2% |
| Total | 1,677 | 100.0% |
Housing Structures by Occupancy in Pleasant Garden
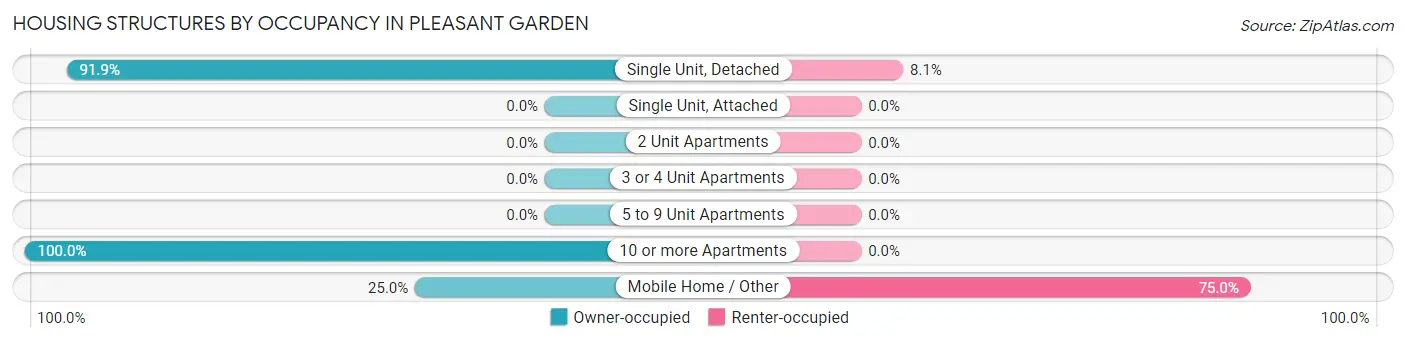
| Structure Type | Owner-occupied | Renter-occupied |
| Single Unit, Detached | 1,241 (91.9%) | 109 (8.1%) |
| Single Unit, Attached | 0 (0.0%) | 0 (0.0%) |
| 2 Unit Apartments | 0 (0.0%) | 0 (0.0%) |
| 3 or 4 Unit Apartments | 0 (0.0%) | 0 (0.0%) |
| 5 to 9 Unit Apartments | 0 (0.0%) | 0 (0.0%) |
| 10 or more Apartments | 39 (100.0%) | 0 (0.0%) |
| Mobile Home / Other | 72 (25.0%) | 216 (75.0%) |
| Total | 1,352 (80.6%) | 325 (19.4%) |
Housing Structures by Number of Rooms in Pleasant Garden
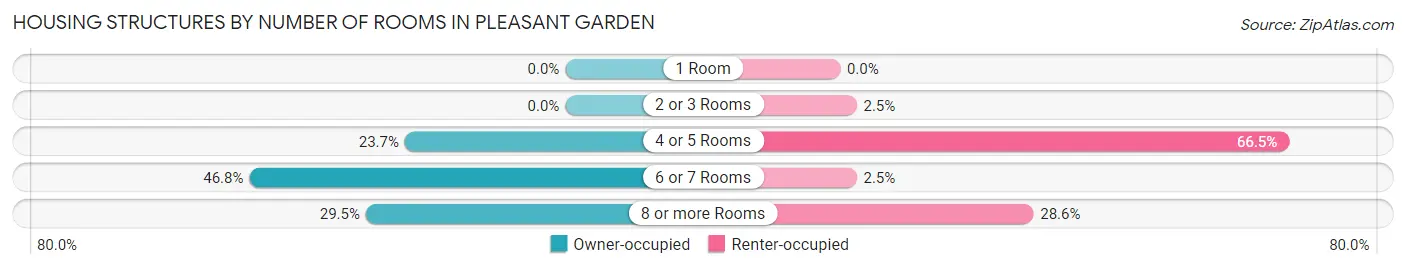
| Number of Rooms | Owner-occupied | Renter-occupied |
| 1 Room | 0 (0.0%) | 0 (0.0%) |
| 2 or 3 Rooms | 0 (0.0%) | 8 (2.5%) |
| 4 or 5 Rooms | 321 (23.7%) | 216 (66.5%) |
| 6 or 7 Rooms | 632 (46.8%) | 8 (2.5%) |
| 8 or more Rooms | 399 (29.5%) | 93 (28.6%) |
| Total | 1,352 (100.0%) | 325 (100.0%) |
Housing Structure by Heating Type in Pleasant Garden
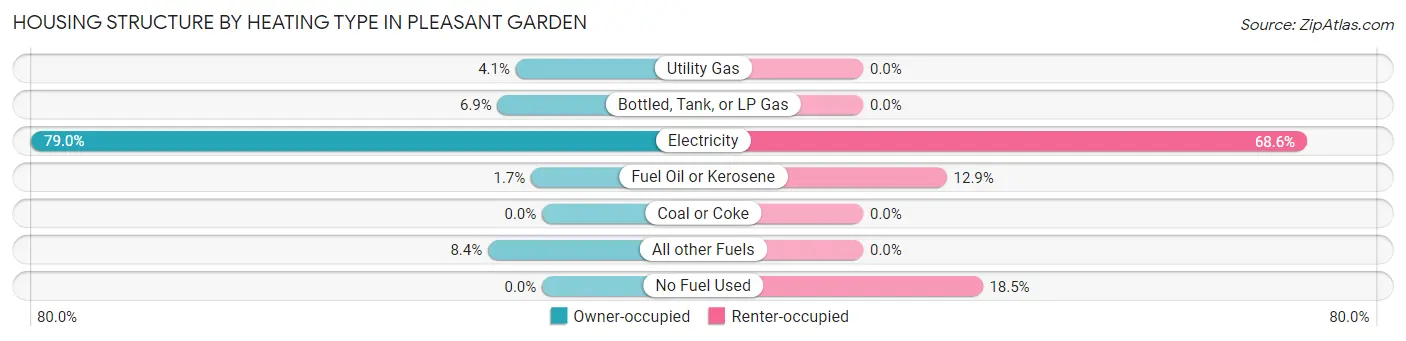
| Heating Type | Owner-occupied | Renter-occupied |
| Utility Gas | 55 (4.1%) | 0 (0.0%) |
| Bottled, Tank, or LP Gas | 93 (6.9%) | 0 (0.0%) |
| Electricity | 1,068 (79.0%) | 223 (68.6%) |
| Fuel Oil or Kerosene | 23 (1.7%) | 42 (12.9%) |
| Coal or Coke | 0 (0.0%) | 0 (0.0%) |
| All other Fuels | 113 (8.4%) | 0 (0.0%) |
| No Fuel Used | 0 (0.0%) | 60 (18.5%) |
| Total | 1,352 (100.0%) | 325 (100.0%) |
Household Vehicle Usage in Pleasant Garden
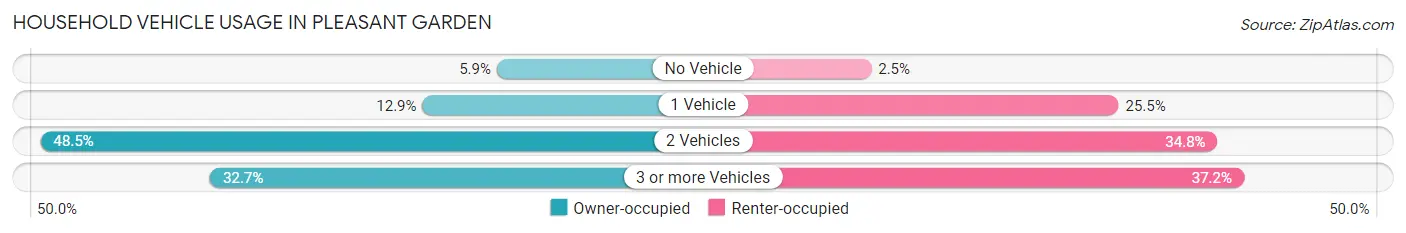
| Vehicles per Household | Owner-occupied | Renter-occupied |
| No Vehicle | 80 (5.9%) | 8 (2.5%) |
| 1 Vehicle | 174 (12.9%) | 83 (25.5%) |
| 2 Vehicles | 656 (48.5%) | 113 (34.8%) |
| 3 or more Vehicles | 442 (32.7%) | 121 (37.2%) |
| Total | 1,352 (100.0%) | 325 (100.0%) |
Real Estate & Mortgages in Pleasant Garden
Real Estate and Mortgage Overview in Pleasant Garden
| Characteristic | Without Mortgage | With Mortgage |
| Housing Units | 469 | 883 |
| Median Property Value | $191,900 | $179,400 |
| Median Household Income | $69,018 | $123 |
| Monthly Housing Costs | $430 | $38 |
| Real Estate Taxes | $1,477 | $0 |
Property Value by Mortgage Status in Pleasant Garden
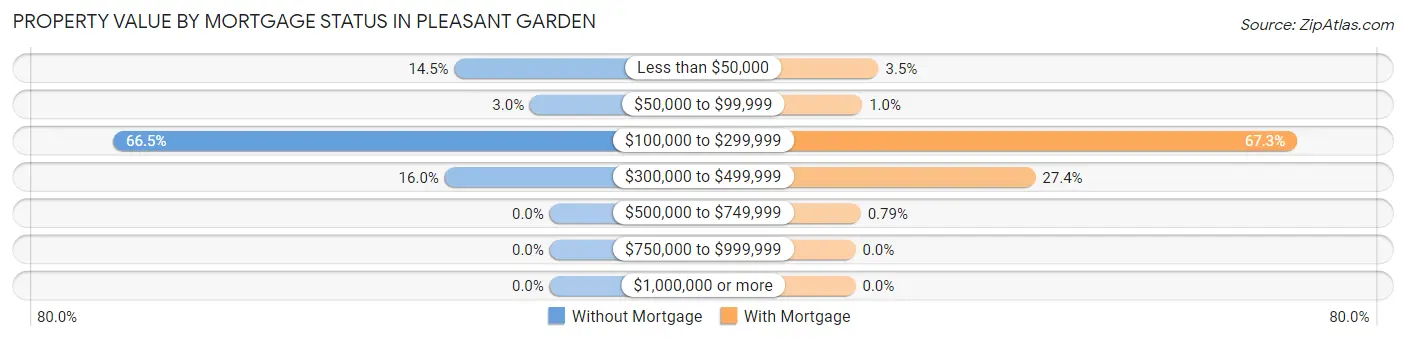
| Property Value | Without Mortgage | With Mortgage |
| Less than $50,000 | 68 (14.5%) | 31 (3.5%) |
| $50,000 to $99,999 | 14 (3.0%) | 9 (1.0%) |
| $100,000 to $299,999 | 312 (66.5%) | 594 (67.3%) |
| $300,000 to $499,999 | 75 (16.0%) | 242 (27.4%) |
| $500,000 to $749,999 | 0 (0.0%) | 7 (0.8%) |
| $750,000 to $999,999 | 0 (0.0%) | 0 (0.0%) |
| $1,000,000 or more | 0 (0.0%) | 0 (0.0%) |
| Total | 469 (100.0%) | 883 (100.0%) |
Household Income by Mortgage Status in Pleasant Garden
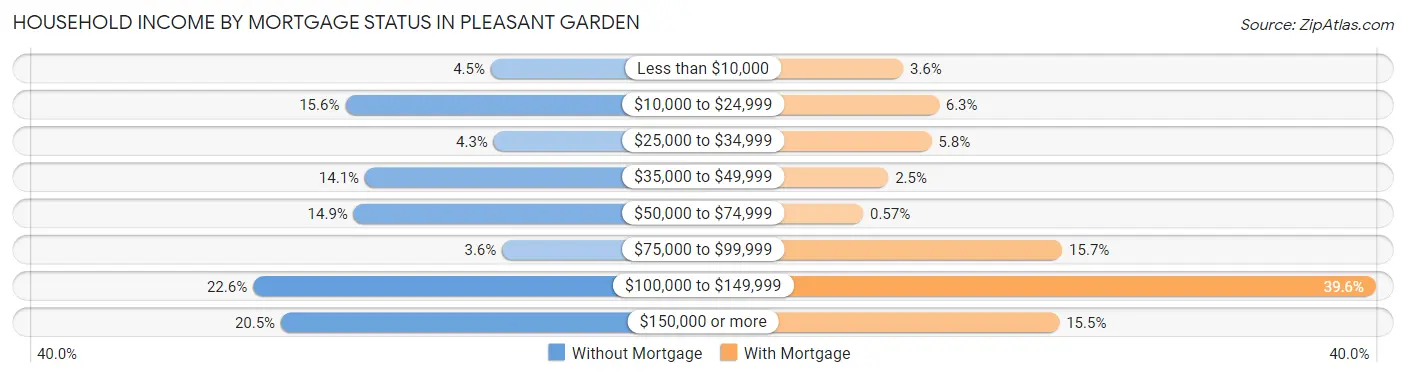
| Household Income | Without Mortgage | With Mortgage |
| Less than $10,000 | 21 (4.5%) | 32 (3.6%) |
| $10,000 to $24,999 | 73 (15.6%) | 56 (6.3%) |
| $25,000 to $34,999 | 20 (4.3%) | 51 (5.8%) |
| $35,000 to $49,999 | 66 (14.1%) | 22 (2.5%) |
| $50,000 to $74,999 | 70 (14.9%) | 5 (0.6%) |
| $75,000 to $99,999 | 17 (3.6%) | 139 (15.7%) |
| $100,000 to $149,999 | 106 (22.6%) | 350 (39.6%) |
| $150,000 or more | 96 (20.5%) | 137 (15.5%) |
| Total | 469 (100.0%) | 883 (100.0%) |
Property Value to Household Income Ratio in Pleasant Garden
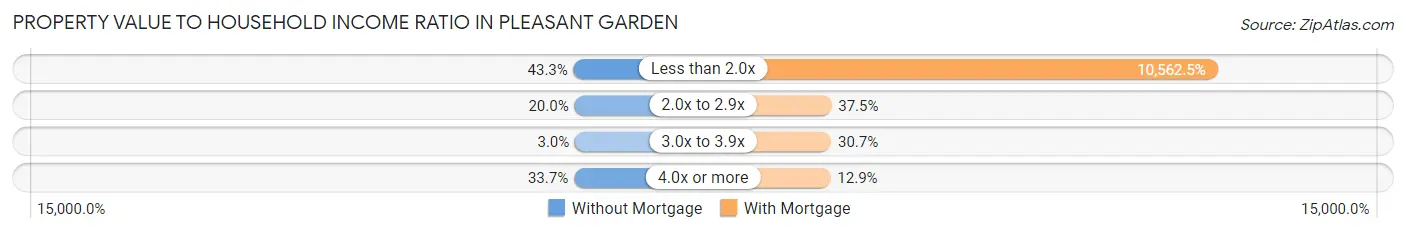
| Value-to-Income Ratio | Without Mortgage | With Mortgage |
| Less than 2.0x | 203 (43.3%) | 93,267 (10,562.5%) |
| 2.0x to 2.9x | 94 (20.0%) | 331 (37.5%) |
| 3.0x to 3.9x | 14 (3.0%) | 271 (30.7%) |
| 4.0x or more | 158 (33.7%) | 114 (12.9%) |
| Total | 469 (100.0%) | 883 (100.0%) |
Real Estate Taxes by Mortgage Status in Pleasant Garden
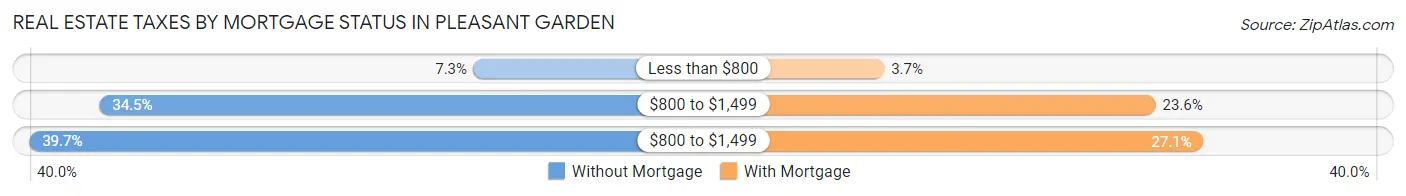
| Property Taxes | Without Mortgage | With Mortgage |
| Less than $800 | 34 (7.2%) | 33 (3.7%) |
| $800 to $1,499 | 162 (34.5%) | 208 (23.6%) |
| $800 to $1,499 | 186 (39.7%) | 239 (27.1%) |
| Total | 469 (100.0%) | 883 (100.0%) |
Health & Disability in Pleasant Garden
Health Insurance Coverage by Age in Pleasant Garden
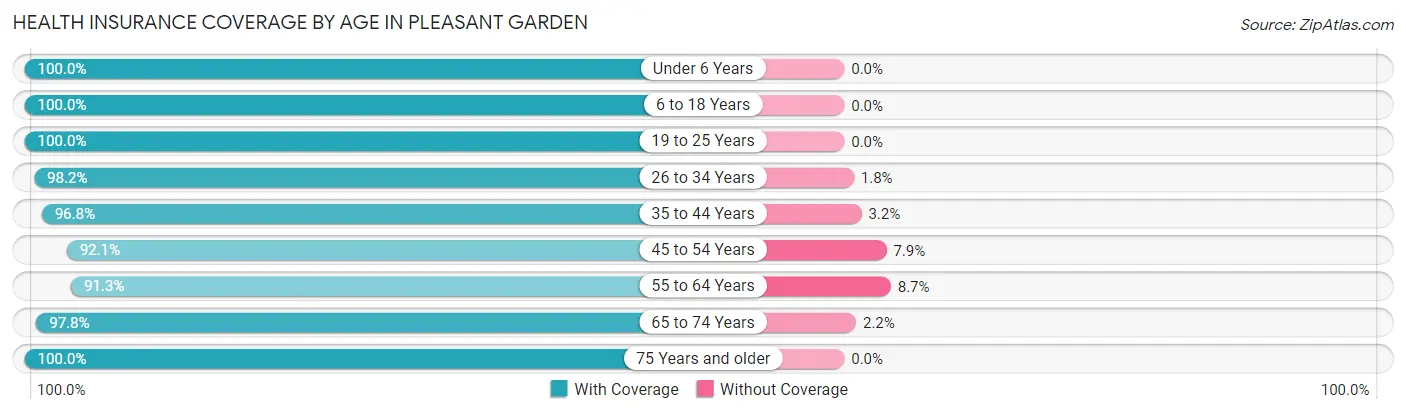
| Age Bracket | With Coverage | Without Coverage |
| Under 6 Years | 204 (100.0%) | 0 (0.0%) |
| 6 to 18 Years | 602 (100.0%) | 0 (0.0%) |
| 19 to 25 Years | 359 (100.0%) | 0 (0.0%) |
| 26 to 34 Years | 663 (98.2%) | 12 (1.8%) |
| 35 to 44 Years | 242 (96.8%) | 8 (3.2%) |
| 45 to 54 Years | 457 (92.1%) | 39 (7.9%) |
| 55 to 64 Years | 527 (91.3%) | 50 (8.7%) |
| 65 to 74 Years | 581 (97.8%) | 13 (2.2%) |
| 75 Years and older | 1,116 (100.0%) | 0 (0.0%) |
| Total | 4,751 (97.5%) | 122 (2.5%) |
Health Insurance Coverage by Citizenship Status in Pleasant Garden
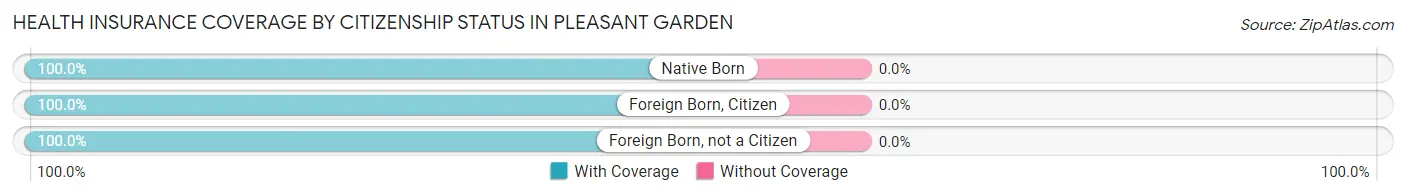
| Citizenship Status | With Coverage | Without Coverage |
| Native Born | 204 (100.0%) | 0 (0.0%) |
| Foreign Born, Citizen | 602 (100.0%) | 0 (0.0%) |
| Foreign Born, not a Citizen | 359 (100.0%) | 0 (0.0%) |
Health Insurance Coverage by Household Income in Pleasant Garden
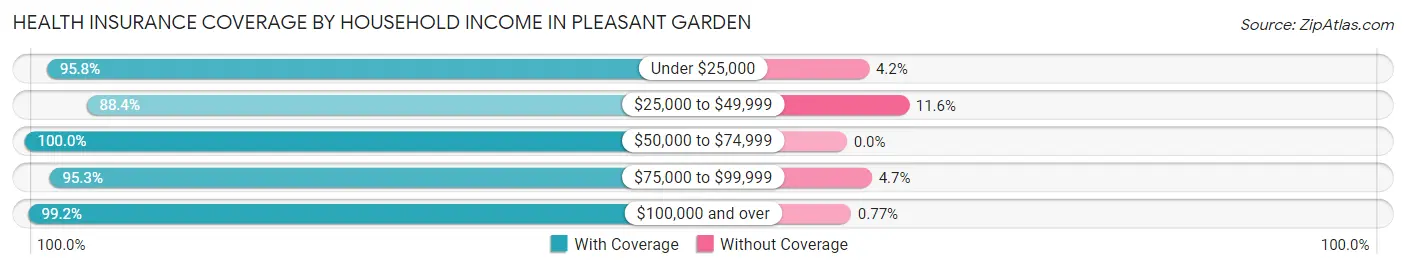
| Household Income | With Coverage | Without Coverage |
| Under $25,000 | 484 (95.8%) | 21 (4.2%) |
| $25,000 to $49,999 | 274 (88.4%) | 36 (11.6%) |
| $50,000 to $74,999 | 652 (100.0%) | 0 (0.0%) |
| $75,000 to $99,999 | 878 (95.3%) | 43 (4.7%) |
| $100,000 and over | 2,458 (99.2%) | 19 (0.8%) |
Public vs Private Health Insurance Coverage by Age in Pleasant Garden
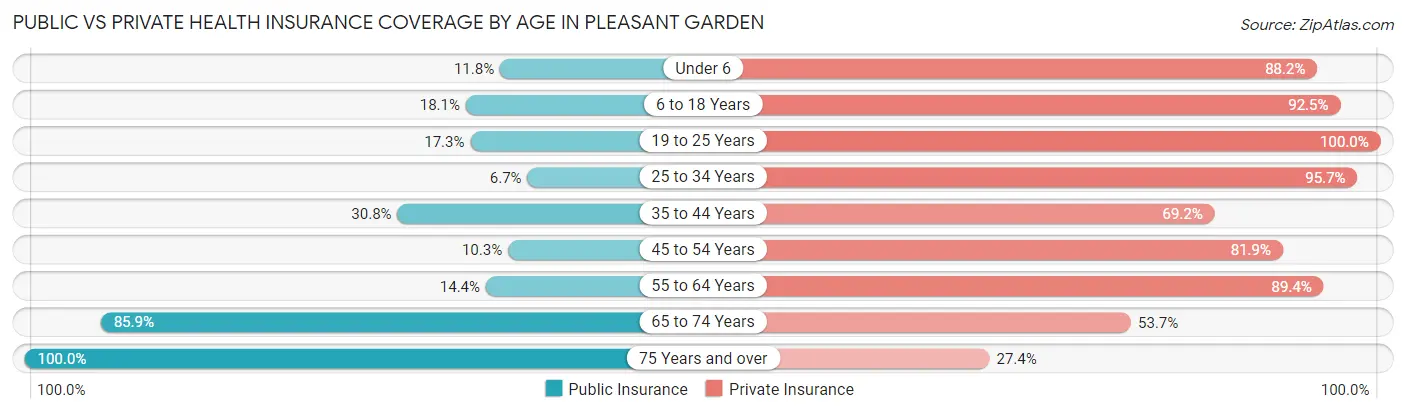
| Age Bracket | Public Insurance | Private Insurance |
| Under 6 | 24 (11.8%) | 180 (88.2%) |
| 6 to 18 Years | 109 (18.1%) | 557 (92.5%) |
| 19 to 25 Years | 62 (17.3%) | 359 (100.0%) |
| 25 to 34 Years | 45 (6.7%) | 646 (95.7%) |
| 35 to 44 Years | 77 (30.8%) | 173 (69.2%) |
| 45 to 54 Years | 51 (10.3%) | 406 (81.9%) |
| 55 to 64 Years | 83 (14.4%) | 516 (89.4%) |
| 65 to 74 Years | 510 (85.9%) | 319 (53.7%) |
| 75 Years and over | 1,116 (100.0%) | 306 (27.4%) |
| Total | 2,077 (42.6%) | 3,462 (71.0%) |
Disability Status by Sex by Age in Pleasant Garden
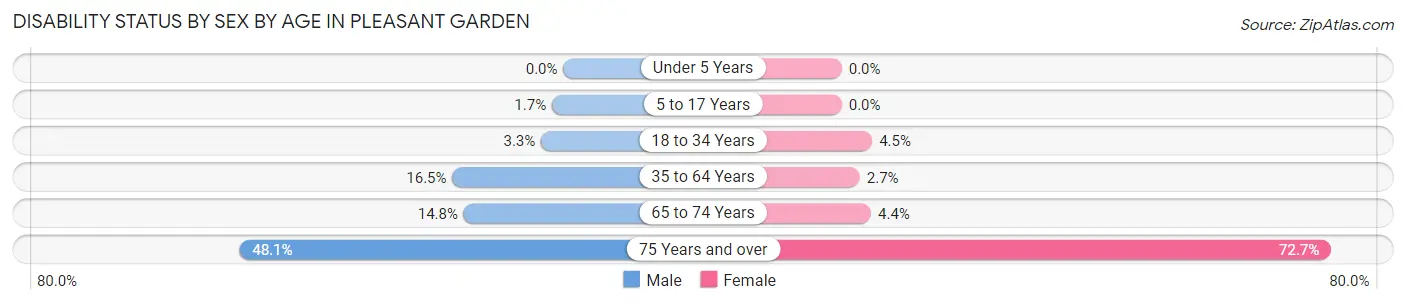
| Age Bracket | Male | Female |
| Under 5 Years | 0 (0.0%) | 0 (0.0%) |
| 5 to 17 Years | 7 (1.7%) | 0 (0.0%) |
| 18 to 34 Years | 21 (3.3%) | 18 (4.5%) |
| 35 to 64 Years | 101 (16.5%) | 19 (2.7%) |
| 65 to 74 Years | 30 (14.8%) | 17 (4.3%) |
| 75 Years and over | 141 (48.1%) | 598 (72.7%) |
Disability Class by Sex by Age in Pleasant Garden
Disability Class: Hearing Difficulty
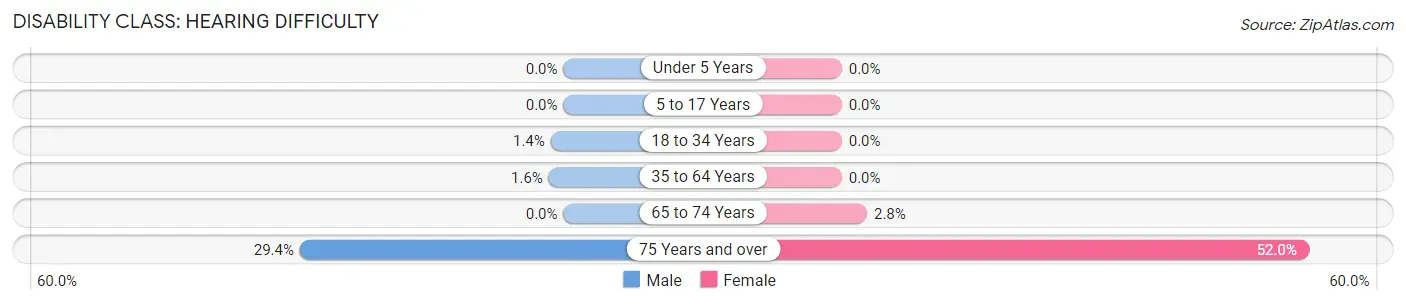
| Age Bracket | Male | Female |
| Under 5 Years | 0 (0.0%) | 0 (0.0%) |
| 5 to 17 Years | 0 (0.0%) | 0 (0.0%) |
| 18 to 34 Years | 9 (1.4%) | 0 (0.0%) |
| 35 to 64 Years | 10 (1.6%) | 0 (0.0%) |
| 65 to 74 Years | 0 (0.0%) | 11 (2.8%) |
| 75 Years and over | 86 (29.3%) | 428 (52.0%) |
Disability Class: Vision Difficulty
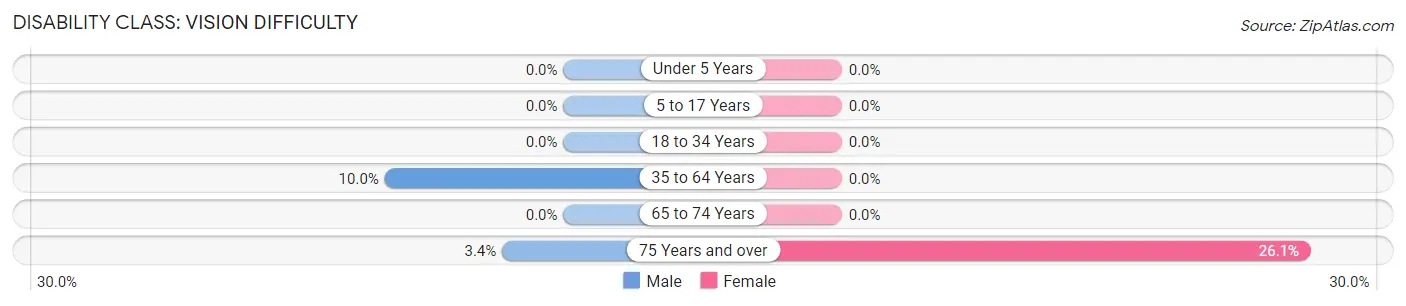
| Age Bracket | Male | Female |
| Under 5 Years | 0 (0.0%) | 0 (0.0%) |
| 5 to 17 Years | 0 (0.0%) | 0 (0.0%) |
| 18 to 34 Years | 0 (0.0%) | 0 (0.0%) |
| 35 to 64 Years | 61 (10.0%) | 0 (0.0%) |
| 65 to 74 Years | 0 (0.0%) | 0 (0.0%) |
| 75 Years and over | 10 (3.4%) | 215 (26.1%) |
Disability Class: Cognitive Difficulty
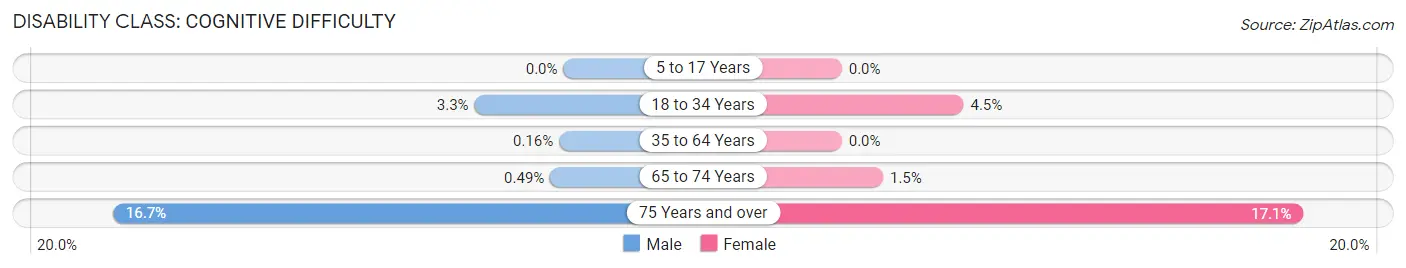
| Age Bracket | Male | Female |
| 5 to 17 Years | 0 (0.0%) | 0 (0.0%) |
| 18 to 34 Years | 21 (3.3%) | 18 (4.5%) |
| 35 to 64 Years | 1 (0.2%) | 0 (0.0%) |
| 65 to 74 Years | 1 (0.5%) | 6 (1.5%) |
| 75 Years and over | 49 (16.7%) | 141 (17.1%) |
Disability Class: Ambulatory Difficulty
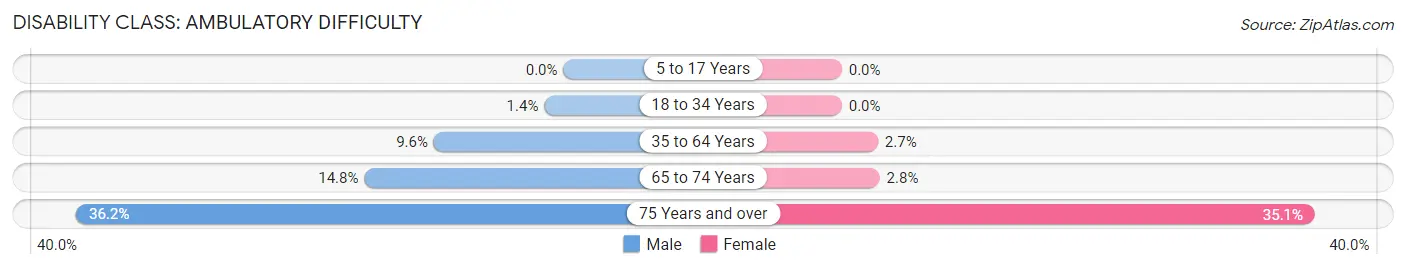
| Age Bracket | Male | Female |
| 5 to 17 Years | 0 (0.0%) | 0 (0.0%) |
| 18 to 34 Years | 9 (1.4%) | 0 (0.0%) |
| 35 to 64 Years | 59 (9.6%) | 19 (2.7%) |
| 65 to 74 Years | 30 (14.8%) | 11 (2.8%) |
| 75 Years and over | 106 (36.2%) | 289 (35.1%) |
Disability Class: Self-Care Difficulty
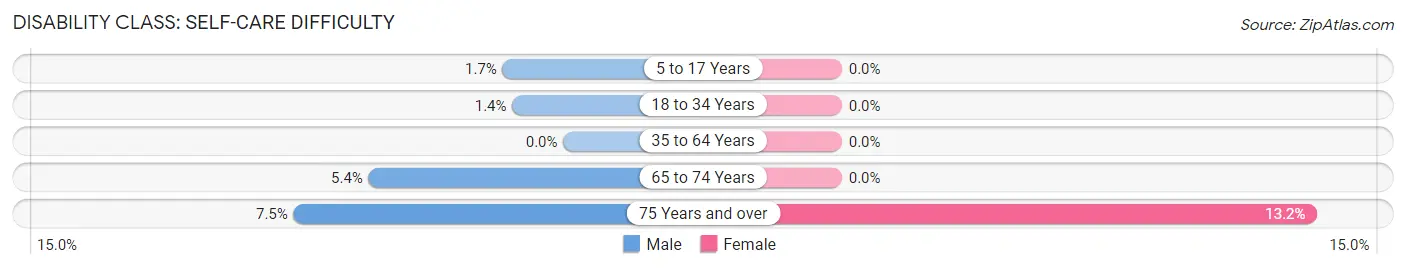
| Age Bracket | Male | Female |
| 5 to 17 Years | 7 (1.7%) | 0 (0.0%) |
| 18 to 34 Years | 9 (1.4%) | 0 (0.0%) |
| 35 to 64 Years | 0 (0.0%) | 0 (0.0%) |
| 65 to 74 Years | 11 (5.4%) | 0 (0.0%) |
| 75 Years and over | 22 (7.5%) | 109 (13.2%) |
Technology Access in Pleasant Garden
Computing Device Access in Pleasant Garden
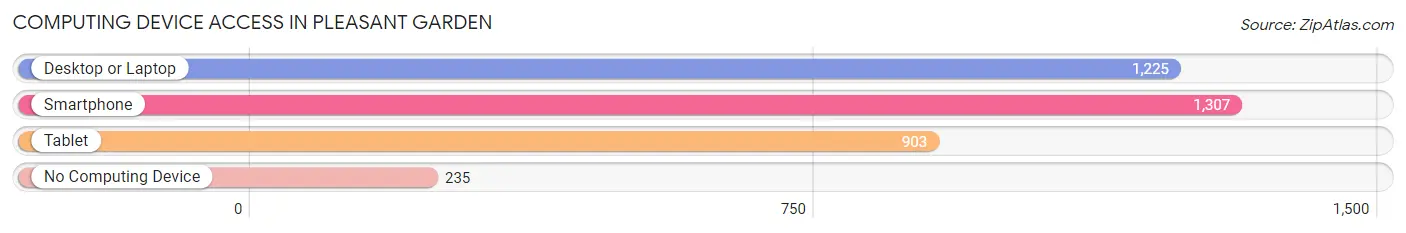
| Device Type | # Households | % Households |
| Desktop or Laptop | 1,225 | 73.1% |
| Smartphone | 1,307 | 77.9% |
| Tablet | 903 | 53.8% |
| No Computing Device | 235 | 14.0% |
| Total | 1,677 | 100.0% |
Internet Access in Pleasant Garden
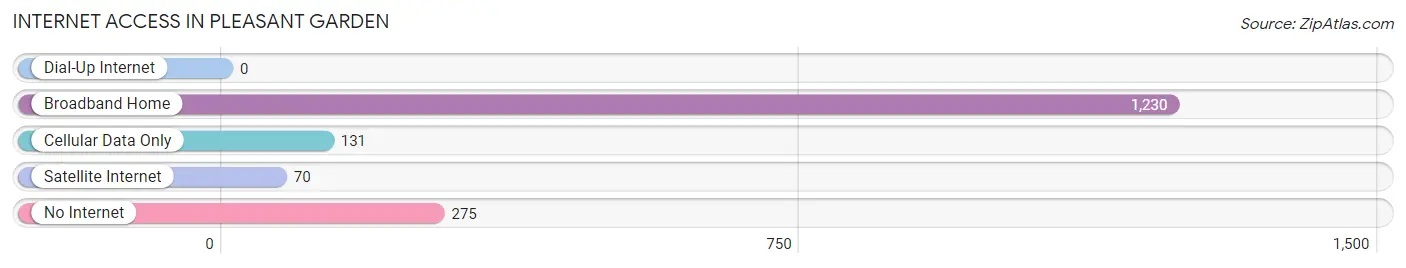
| Internet Type | # Households | % Households |
| Dial-Up Internet | 0 | 0.0% |
| Broadband Home | 1,230 | 73.4% |
| Cellular Data Only | 131 | 7.8% |
| Satellite Internet | 70 | 4.2% |
| No Internet | 275 | 16.4% |
| Total | 1,677 | 100.0% |
Pleasant Garden Summary
Pleasant Garden is a small town located in Guilford County, North Carolina. It is situated in the Piedmont region of the state, approximately 10 miles northeast of Greensboro. The town was founded in 1883 and has a population of approximately 2,000 people.
Geography
Pleasant Garden is located in the Piedmont region of North Carolina, which is characterized by rolling hills and valleys. The town is situated in the center of Guilford County, approximately 10 miles northeast of Greensboro. The town is bordered by the towns of Julian, McLeansville, and Stokesdale. The town is located at an elevation of 830 feet above sea level. The town is located in the Yadkin-Pee Dee River Basin, which is part of the larger Cape Fear River Basin. The town is located in the humid subtropical climate zone, which is characterized by hot, humid summers and mild winters.
Economy
Pleasant Garden’s economy is largely based on agriculture. The town is home to several farms, which produce a variety of crops, including corn, soybeans, wheat, and hay. The town is also home to several small businesses, including a grocery store, a hardware store, and a few restaurants. The town is also home to a few manufacturing companies, which produce a variety of products, including furniture, textiles, and automotive parts.
Demographics
As of the 2010 census, the population of Pleasant Garden was 2,000 people. The racial makeup of the town was 94.2% White, 2.2% African American, 0.7% Native American, 0.7% Asian, 0.2% Pacific Islander, and 1.9% from other races. The median household income in the town was $41,250, and the median family income was $50,000. The per capita income in the town was $20,000.
History
Pleasant Garden was founded in 1883 by a group of settlers from the nearby town of Julian. The town was named after a nearby plantation, which was owned by the family of one of the settlers. The town was originally a farming community, and the main crops grown in the area were corn, wheat, and hay. The town was also home to several small businesses, including a grocery store, a hardware store, and a few restaurants.
In the early 1900s, the town began to experience a period of growth and development. The town was connected to the nearby towns of Julian and McLeansville by a railroad line, which allowed for the transportation of goods and people. The town also experienced a period of industrial growth, with several manufacturing companies setting up shop in the area.
In the late 20th century, the town experienced a period of decline. Many of the manufacturing companies left the area, and the town’s population began to decline. In recent years, the town has experienced a period of revitalization, with several new businesses opening in the area. The town is also home to several parks and recreational facilities, which attract visitors from the surrounding area.
Common Questions
What is Per Capita Income in Pleasant Garden?
Per Capita income in Pleasant Garden is $34,270.
What is the Median Family Income in Pleasant Garden?
Median Family Income in Pleasant Garden is $93,682.
What is the Median Household income in Pleasant Garden?
Median Household Income in Pleasant Garden is $84,395.
What is Income or Wage Gap in Pleasant Garden?
Income or Wage Gap in Pleasant Garden is 44.2%.
Women in Pleasant Garden earn 55.8 cents for every dollar earned by a man.
What is Inequality or Gini Index in Pleasant Garden?
Inequality or Gini Index in Pleasant Garden is 0.43.
What is the Total Population of Pleasant Garden?
Total Population of Pleasant Garden is 4,987.
What is the Total Male Population of Pleasant Garden?
Total Male Population of Pleasant Garden is 2,369.
What is the Total Female Population of Pleasant Garden?
Total Female Population of Pleasant Garden is 2,618.
What is the Ratio of Males per 100 Females in Pleasant Garden?
There are 90.49 Males per 100 Females in Pleasant Garden.
What is the Ratio of Females per 100 Males in Pleasant Garden?
There are 110.51 Females per 100 Males in Pleasant Garden.
What is the Median Population Age in Pleasant Garden?
Median Population Age in Pleasant Garden is 53.7 Years.
What is the Average Family Size in Pleasant Garden
Average Family Size in Pleasant Garden is 2.8 People.
What is the Average Household Size in Pleasant Garden
Average Household Size in Pleasant Garden is 2.9 People.
How Large is the Labor Force in Pleasant Garden?
There are 2,276 People in the Labor Forcein in Pleasant Garden.
What is the Percentage of People in the Labor Force in Pleasant Garden?
53.1% of People are in the Labor Force in Pleasant Garden.
What is the Unemployment Rate in Pleasant Garden?
Unemployment Rate in Pleasant Garden is 1.2%.