Richfield, NC Map & Demographics
Richfield Map
Richfield Overview
$30,973
PER CAPITA INCOME
$74,913
AVG FAMILY INCOME
$74,651
AVG HOUSEHOLD INCOME
2.0%
WAGE / INCOME GAP [ % ]
98.0¢/ $1
WAGE / INCOME GAP [ $ ]
0.32
INEQUALITY / GINI INDEX
921
TOTAL POPULATION
481
MALE POPULATION
440
FEMALE POPULATION
109.32
MALES / 100 FEMALES
91.48
FEMALES / 100 MALES
40.1
MEDIAN AGE
3.4
AVG FAMILY SIZE
3.0
AVG HOUSEHOLD SIZE
515
LABOR FORCE [ PEOPLE ]
66.5%
PERCENT IN LABOR FORCE
1.8%
UNEMPLOYMENT RATE
Richfield Zip Codes
Income in Richfield
Income Overview in Richfield
Per Capita Income in Richfield is $30,973, while median incomes of families and households are $74,913 and $74,651 respectively.
| Characteristic | Number | Measure |
| Per Capita Income | 921 | $30,973 |
| Median Family Income | 237 | $74,913 |
| Mean Family Income | 237 | $87,781 |
| Median Household Income | 310 | $74,651 |
| Mean Household Income | 310 | $87,818 |
| Income Deficit | 237 | $0 |
| Wage / Income Gap (%) | 921 | 2.04% |
| Wage / Income Gap ($) | 921 | 97.96¢ per $1 |
| Gini / Inequality Index | 921 | 0.32 |
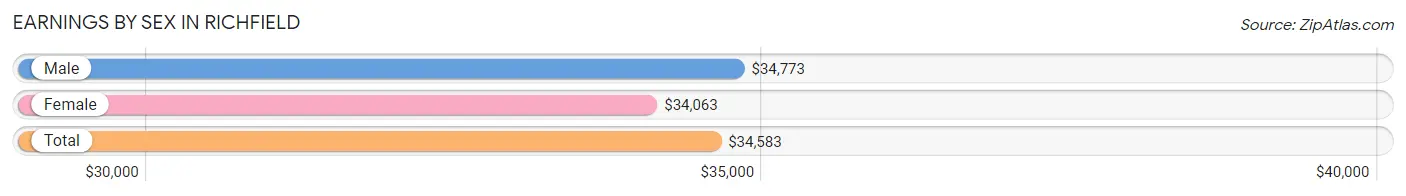
Earnings by Sex in Richfield
Average Earnings in Richfield are $34,583, $34,773 for men and $34,063 for women, a difference of 2.0%.
| Sex | Number | Average Earnings |
| Male | 344 (58.6%) | $34,773 |
| Female | 243 (41.4%) | $34,063 |
| Total | 587 (100.0%) | $34,583 |
Earnings by Sex by Income Bracket in Richfield
The most common earnings brackets in Richfield are $2,499 or less for men (60 | 17.4%) and $50,000 to $54,999 for women (72 | 29.6%).

| Income | Male | Female |
| $2,499 or less | 60 (17.4%) | 7 (2.9%) |
| $2,500 to $4,999 | 0 (0.0%) | 3 (1.2%) |
| $5,000 to $7,499 | 0 (0.0%) | 48 (19.8%) |
| $7,500 to $9,999 | 0 (0.0%) | 0 (0.0%) |
| $10,000 to $12,499 | 2 (0.6%) | 2 (0.8%) |
| $12,500 to $14,999 | 21 (6.1%) | 0 (0.0%) |
| $15,000 to $17,499 | 8 (2.3%) | 10 (4.1%) |
| $17,500 to $19,999 | 3 (0.9%) | 5 (2.1%) |
| $20,000 to $22,499 | 42 (12.2%) | 11 (4.5%) |
| $22,500 to $24,999 | 0 (0.0%) | 22 (9.0%) |
| $25,000 to $29,999 | 18 (5.2%) | 4 (1.7%) |
| $30,000 to $34,999 | 19 (5.5%) | 11 (4.5%) |
| $35,000 to $39,999 | 33 (9.6%) | 8 (3.3%) |
| $40,000 to $44,999 | 14 (4.1%) | 4 (1.7%) |
| $45,000 to $49,999 | 0 (0.0%) | 8 (3.3%) |
| $50,000 to $54,999 | 40 (11.6%) | 72 (29.6%) |
| $55,000 to $64,999 | 15 (4.4%) | 6 (2.5%) |
| $65,000 to $74,999 | 8 (2.3%) | 6 (2.5%) |
| $75,000 to $99,999 | 29 (8.4%) | 12 (4.9%) |
| $100,000+ | 32 (9.3%) | 4 (1.7%) |
| Total | 344 (100.0%) | 243 (100.0%) |
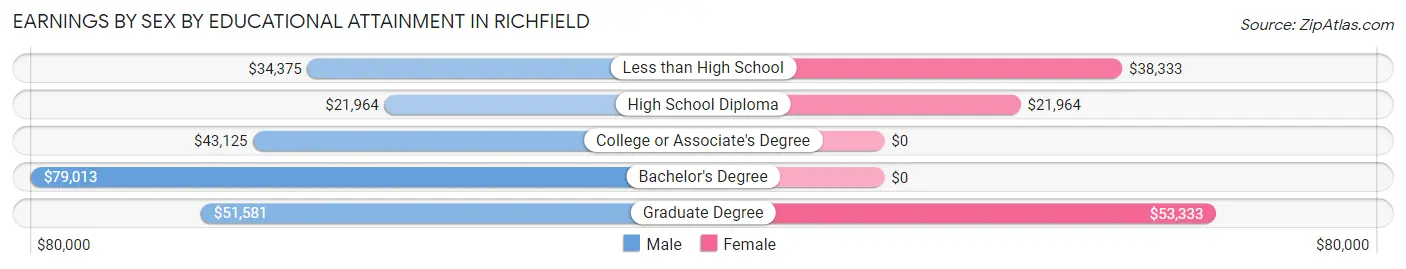
Earnings by Sex by Educational Attainment in Richfield
Average earnings in Richfield are $43,036 for men and $35,250 for women, a difference of 18.1%. Men with an educational attainment of bachelor's degree enjoy the highest average annual earnings of $79,013, while those with high school diploma education earn the least with $21,964. Women with an educational attainment of graduate degree earn the most with the average annual earnings of $53,333, while those with high school diploma education have the smallest earnings of $21,964.
| Educational Attainment | Male Income | Female Income |
| Less than High School | $34,375 | $38,333 |
| High School Diploma | $21,964 | $21,964 |
| College or Associate's Degree | $43,125 | $0 |
| Bachelor's Degree | $79,013 | $0 |
| Graduate Degree | $51,581 | $53,333 |
| Total | $43,036 | $35,250 |
Family Income in Richfield
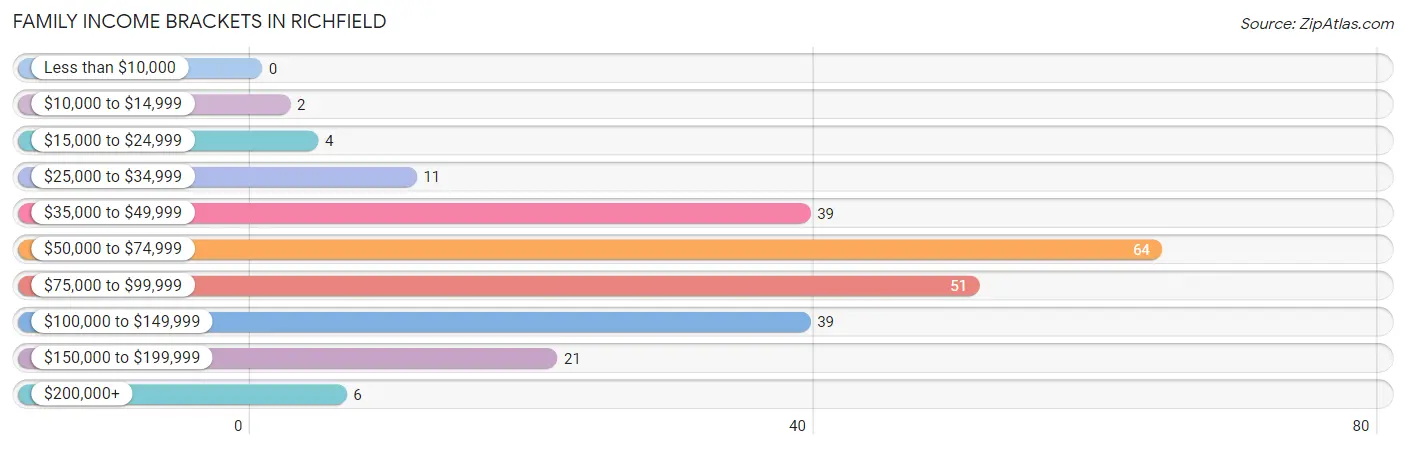
Family Income Brackets in Richfield
According to the Richfield family income data, there are 64 families falling into the $50,000 to $74,999 income range, which is the most common income bracket and makes up 27.0% of all families.
| Income Bracket | # Families | % Families |
| Less than $10,000 | 0 | 0.0% |
| $10,000 to $14,999 | 2 | 0.8% |
| $15,000 to $24,999 | 4 | 1.7% |
| $25,000 to $34,999 | 11 | 4.6% |
| $35,000 to $49,999 | 39 | 16.5% |
| $50,000 to $74,999 | 64 | 27.0% |
| $75,000 to $99,999 | 51 | 21.5% |
| $100,000 to $149,999 | 39 | 16.5% |
| $150,000 to $199,999 | 21 | 8.9% |
| $200,000+ | 6 | 2.5% |
Family Income by Famaliy Size in Richfield
4-person families (9 | 3.8%) account for the highest median family income in Richfield with $101,250 per family, while 2-person families (76 | 32.1%) have the highest median income of $41,875 per family member.
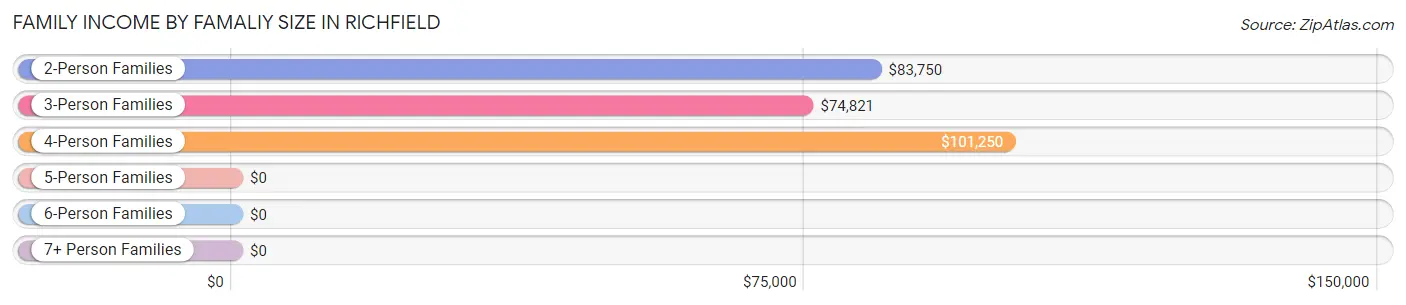
| Income Bracket | # Families | Median Income |
| 2-Person Families | 76 (32.1%) | $83,750 |
| 3-Person Families | 116 (48.9%) | $74,821 |
| 4-Person Families | 9 (3.8%) | $101,250 |
| 5-Person Families | 4 (1.7%) | $0 |
| 6-Person Families | 32 (13.5%) | $0 |
| 7+ Person Families | 0 (0.0%) | $0 |
| Total | 237 (100.0%) | $74,913 |
Family Income by Number of Earners in Richfield
The median family income in Richfield is $74,913, with families comprising 2 earners (111) having the highest median family income of $91,771, while families with 1 earner (53) have the lowest median family income of $39,213, accounting for 46.8% and 22.4% of families, respectively.
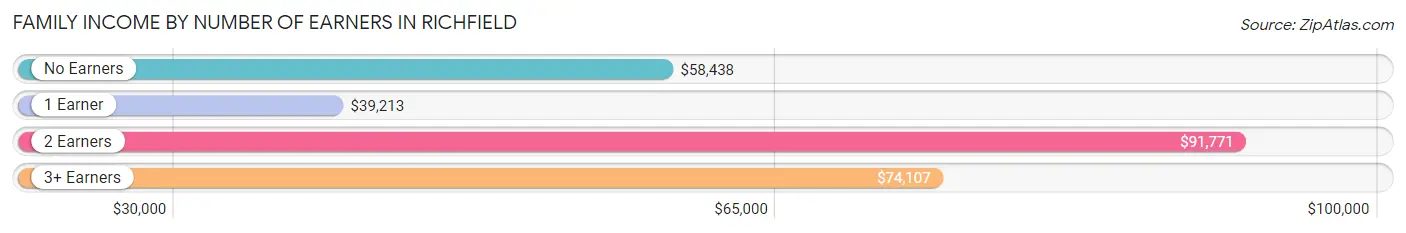
| Number of Earners | # Families | Median Income |
| No Earners | 19 (8.0%) | $58,438 |
| 1 Earner | 53 (22.4%) | $39,213 |
| 2 Earners | 111 (46.8%) | $91,771 |
| 3+ Earners | 54 (22.8%) | $74,107 |
| Total | 237 (100.0%) | $74,913 |
Household Income in Richfield
Household Income Brackets in Richfield
With 67 households falling in the category, the $50,000 to $74,999 income range is the most frequent in Richfield, accounting for 21.6% of all households. In contrast, only 2 households (0.6%) fall into the less than $10,000 income bracket, making it the least populous group.
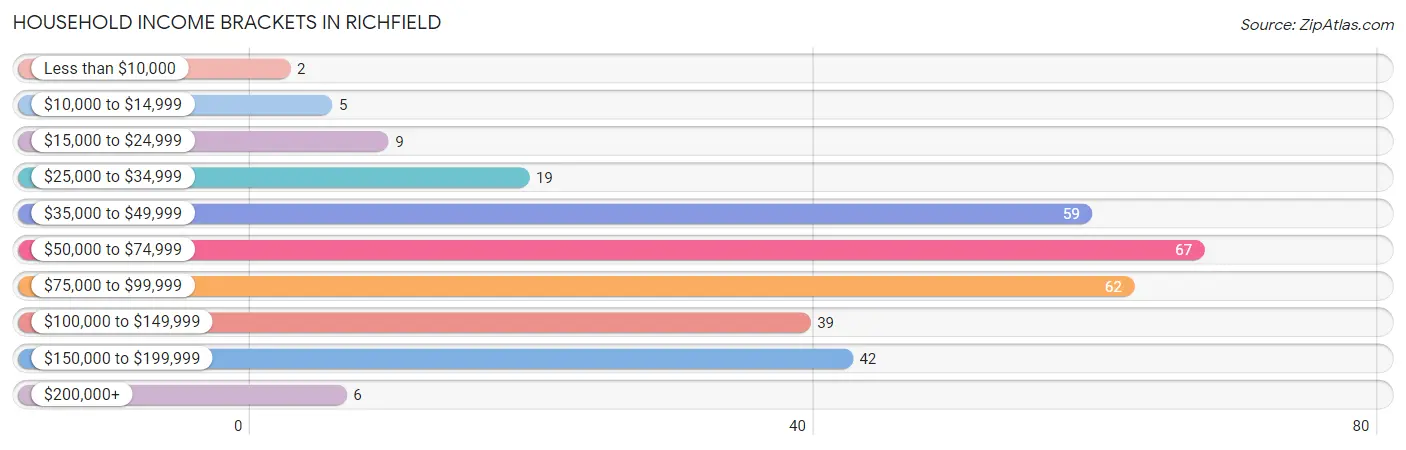
| Income Bracket | # Households | % Households |
| Less than $10,000 | 2 | 0.6% |
| $10,000 to $14,999 | 5 | 1.6% |
| $15,000 to $24,999 | 9 | 2.9% |
| $25,000 to $34,999 | 19 | 6.1% |
| $35,000 to $49,999 | 59 | 19.0% |
| $50,000 to $74,999 | 67 | 21.6% |
| $75,000 to $99,999 | 62 | 20.0% |
| $100,000 to $149,999 | 39 | 12.6% |
| $150,000 to $199,999 | 42 | 13.5% |
| $200,000+ | 6 | 1.9% |
Household Income by Householder Age in Richfield
The median household income in Richfield is $74,651, with the highest median household income of $90,451 found in the 45 to 64 years age bracket for the primary householder. A total of 179 households (57.7%) fall into this category. Meanwhile, the 15 to 24 years age bracket for the primary householder has the lowest median household income of $0, with 3 households (1.0%) in this group.
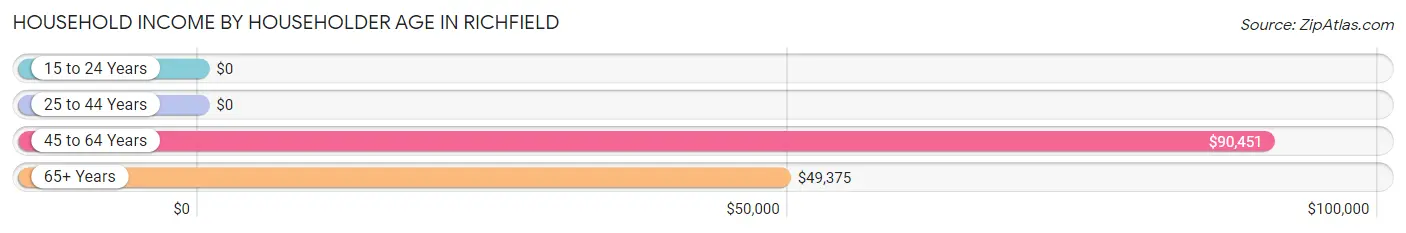
| Income Bracket | # Households | Median Income |
| 15 to 24 Years | 3 (1.0%) | $0 |
| 25 to 44 Years | 63 (20.3%) | $0 |
| 45 to 64 Years | 179 (57.7%) | $90,451 |
| 65+ Years | 65 (21.0%) | $49,375 |
| Total | 310 (100.0%) | $74,651 |
Poverty in Richfield
Income Below Poverty by Sex and Age in Richfield
With 4.6% poverty level for males and 2.9% for females among the residents of Richfield, 5 year old males and 6 to 11 year old females are the most vulnerable to poverty, with 1 males (100.0%) and 3 females (16.7%) in their respective age groups living below the poverty level.
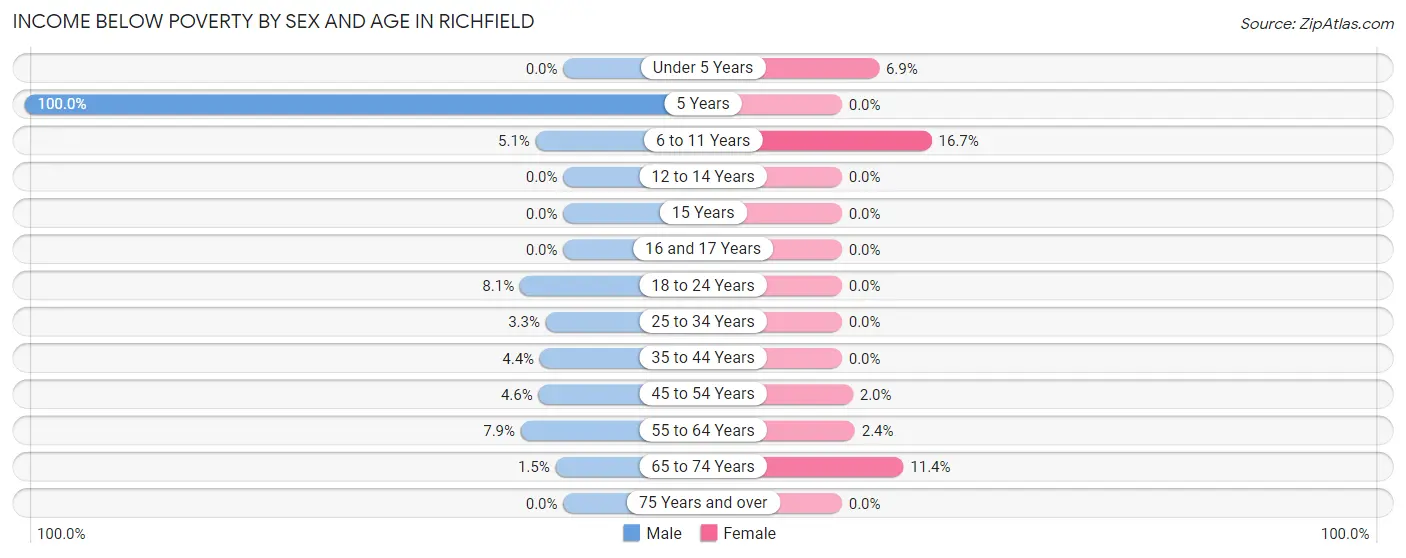
| Age Bracket | Male | Female |
| Under 5 Years | 0 (0.0%) | 2 (6.9%) |
| 5 Years | 1 (100.0%) | 0 (0.0%) |
| 6 to 11 Years | 2 (5.1%) | 3 (16.7%) |
| 12 to 14 Years | 0 (0.0%) | 0 (0.0%) |
| 15 Years | 0 (0.0%) | 0 (0.0%) |
| 16 and 17 Years | 0 (0.0%) | 0 (0.0%) |
| 18 to 24 Years | 7 (8.1%) | 0 (0.0%) |
| 25 to 34 Years | 3 (3.3%) | 0 (0.0%) |
| 35 to 44 Years | 1 (4.3%) | 0 (0.0%) |
| 45 to 54 Years | 4 (4.6%) | 2 (2.0%) |
| 55 to 64 Years | 3 (7.9%) | 2 (2.4%) |
| 65 to 74 Years | 1 (1.5%) | 4 (11.4%) |
| 75 Years and over | 0 (0.0%) | 0 (0.0%) |
| Total | 22 (4.6%) | 13 (2.9%) |
Income Above Poverty by Sex and Age in Richfield
According to the poverty statistics in Richfield, males aged under 5 years and females aged 12 to 14 years are the age groups that are most secure financially, with 100.0% of males and 100.0% of females in these age groups living above the poverty line.
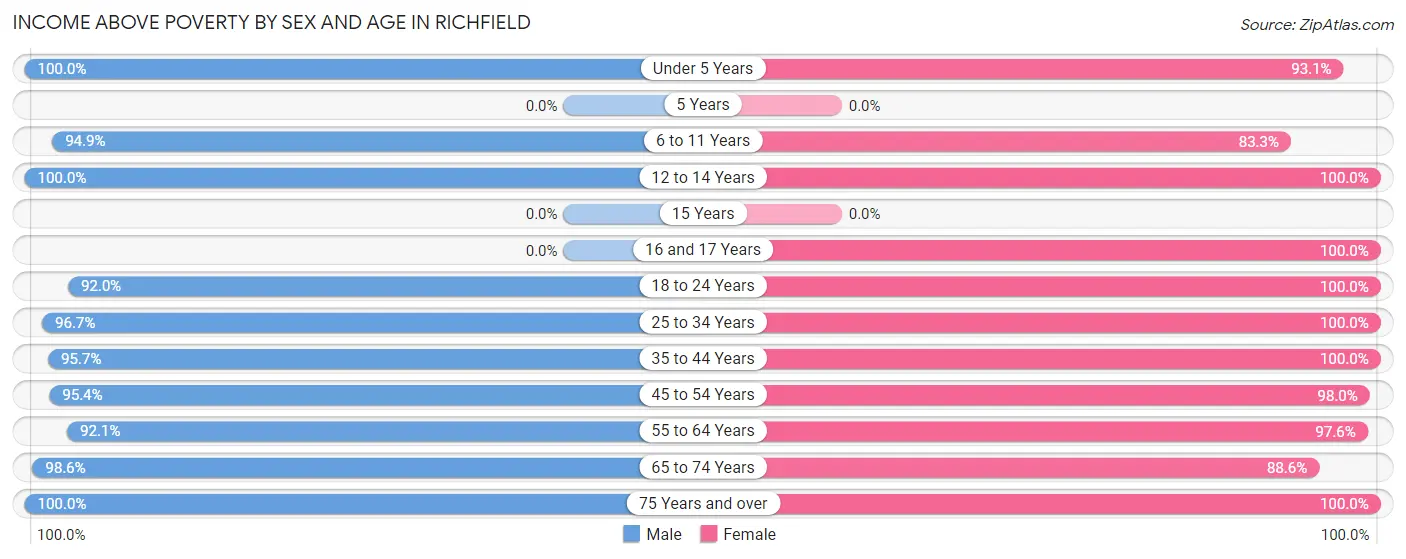
| Age Bracket | Male | Female |
| Under 5 Years | 36 (100.0%) | 27 (93.1%) |
| 5 Years | 0 (0.0%) | 0 (0.0%) |
| 6 to 11 Years | 37 (94.9%) | 15 (83.3%) |
| 12 to 14 Years | 2 (100.0%) | 22 (100.0%) |
| 15 Years | 0 (0.0%) | 0 (0.0%) |
| 16 and 17 Years | 0 (0.0%) | 2 (100.0%) |
| 18 to 24 Years | 80 (91.9%) | 4 (100.0%) |
| 25 to 34 Years | 89 (96.7%) | 116 (100.0%) |
| 35 to 44 Years | 22 (95.7%) | 13 (100.0%) |
| 45 to 54 Years | 83 (95.4%) | 96 (98.0%) |
| 55 to 64 Years | 35 (92.1%) | 81 (97.6%) |
| 65 to 74 Years | 68 (98.6%) | 31 (88.6%) |
| 75 Years and over | 7 (100.0%) | 20 (100.0%) |
| Total | 459 (95.4%) | 427 (97.1%) |
Income Below Poverty Among Married-Couple Families in Richfield
The poverty statistics for married-couple families in Richfield show that 1.3% or 3 of the total 223 families live below the poverty line. Families with no children have the highest poverty rate of 1.8%, comprising of 3 families. On the other hand, families with 1 or 2 children have the lowest poverty rate of 0.0%, which includes 0 families.
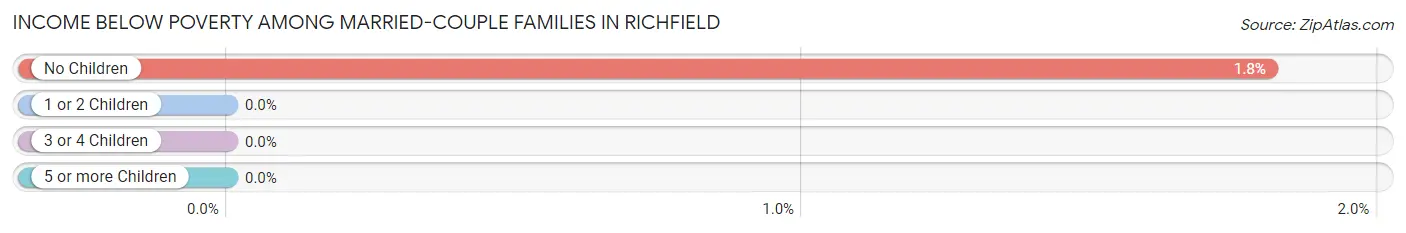
| Children | Above Poverty | Below Poverty |
| No Children | 163 (98.2%) | 3 (1.8%) |
| 1 or 2 Children | 23 (100.0%) | 0 (0.0%) |
| 3 or 4 Children | 34 (100.0%) | 0 (0.0%) |
| 5 or more Children | 0 (0.0%) | 0 (0.0%) |
| Total | 220 (98.7%) | 3 (1.3%) |
Income Below Poverty Among Single-Parent Households in Richfield
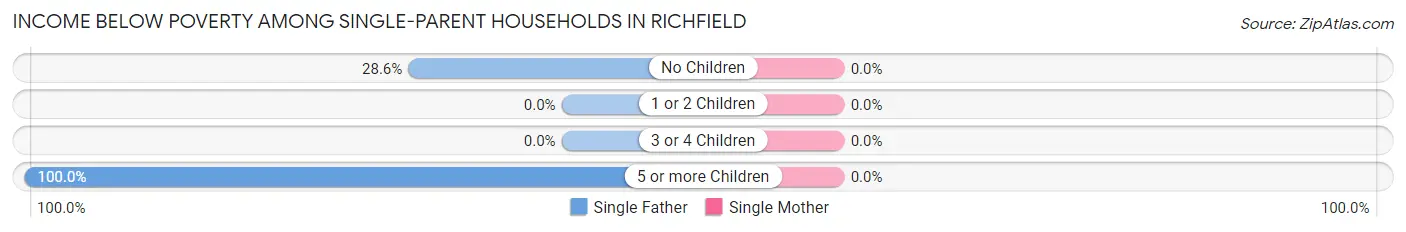
| Children | Single Father | Single Mother |
| No Children | 2 (28.6%) | 0 (0.0%) |
| 1 or 2 Children | 0 (0.0%) | 0 (0.0%) |
| 3 or 4 Children | 0 (0.0%) | 0 (0.0%) |
| 5 or more Children | 1 (100.0%) | 0 (0.0%) |
| Total | 3 (37.5%) | 0 (0.0%) |
Income Below Poverty Among Married-Couple vs Single-Parent Households in Richfield
The poverty data for Richfield shows that 3 of the married-couple family households (1.3%) and 3 of the single-parent households (21.4%) are living below the poverty level. Within the married-couple family households, those with no children have the highest poverty rate, with 3 households (1.8%) falling below the poverty line. Among the single-parent households, those with 5 or more children have the highest poverty rate, with 1 household (100.0%) living below poverty.
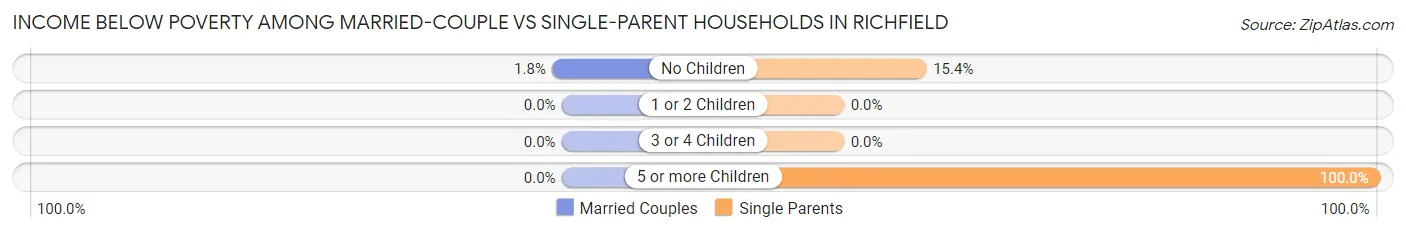
| Children | Married-Couple Families | Single-Parent Households |
| No Children | 3 (1.8%) | 2 (15.4%) |
| 1 or 2 Children | 0 (0.0%) | 0 (0.0%) |
| 3 or 4 Children | 0 (0.0%) | 0 (0.0%) |
| 5 or more Children | 0 (0.0%) | 1 (100.0%) |
| Total | 3 (1.3%) | 3 (21.4%) |
Race in Richfield
The most populous races in Richfield are White / Caucasian (857 | 93.0%), Asian (28 | 3.0%), and Black / African American (18 | 1.9%).
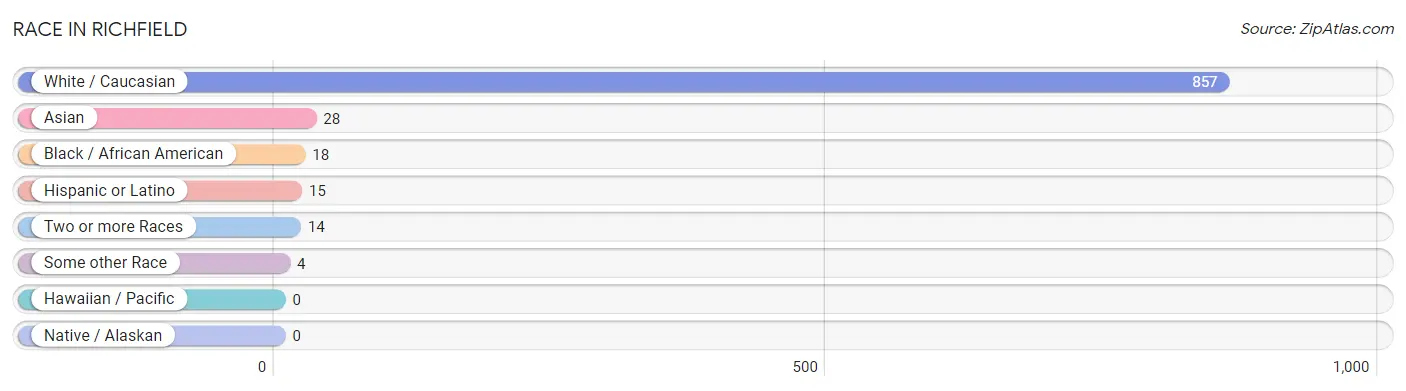
| Race | # Population | % Population |
| Asian | 28 | 3.0% |
| Black / African American | 18 | 1.9% |
| Hawaiian / Pacific | 0 | 0.0% |
| Hispanic or Latino | 15 | 1.6% |
| Native / Alaskan | 0 | 0.0% |
| White / Caucasian | 857 | 93.0% |
| Two or more Races | 14 | 1.5% |
| Some other Race | 4 | 0.4% |
| Total | 921 | 100.0% |
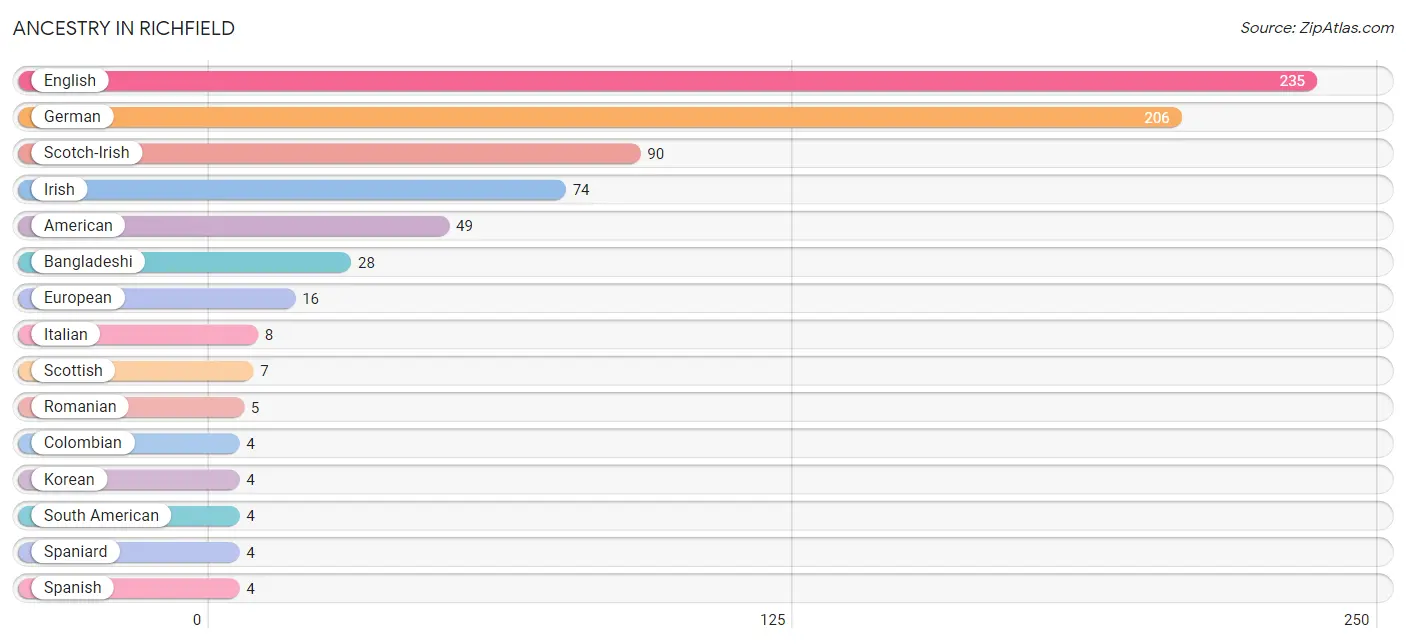
Ancestry in Richfield
The most populous ancestries reported in Richfield are English (235 | 25.5%), German (206 | 22.4%), Scotch-Irish (90 | 9.8%), Irish (74 | 8.0%), and American (49 | 5.3%), together accounting for 71.0% of all Richfield residents.
| Ancestry | # Population | % Population |
| American | 49 | 5.3% |
| Austrian | 1 | 0.1% |
| Bangladeshi | 28 | 3.0% |
| British | 1 | 0.1% |
| Colombian | 4 | 0.4% |
| English | 235 | 25.5% |
| European | 16 | 1.7% |
| French | 2 | 0.2% |
| German | 206 | 22.4% |
| Greek | 1 | 0.1% |
| Irish | 74 | 8.0% |
| Italian | 8 | 0.9% |
| Korean | 4 | 0.4% |
| Polish | 2 | 0.2% |
| Puerto Rican | 3 | 0.3% |
| Romanian | 5 | 0.5% |
| Scotch-Irish | 90 | 9.8% |
| Scottish | 7 | 0.8% |
| South American | 4 | 0.4% |
| Spaniard | 4 | 0.4% |
| Spanish | 4 | 0.4% | View All 21 Rows |
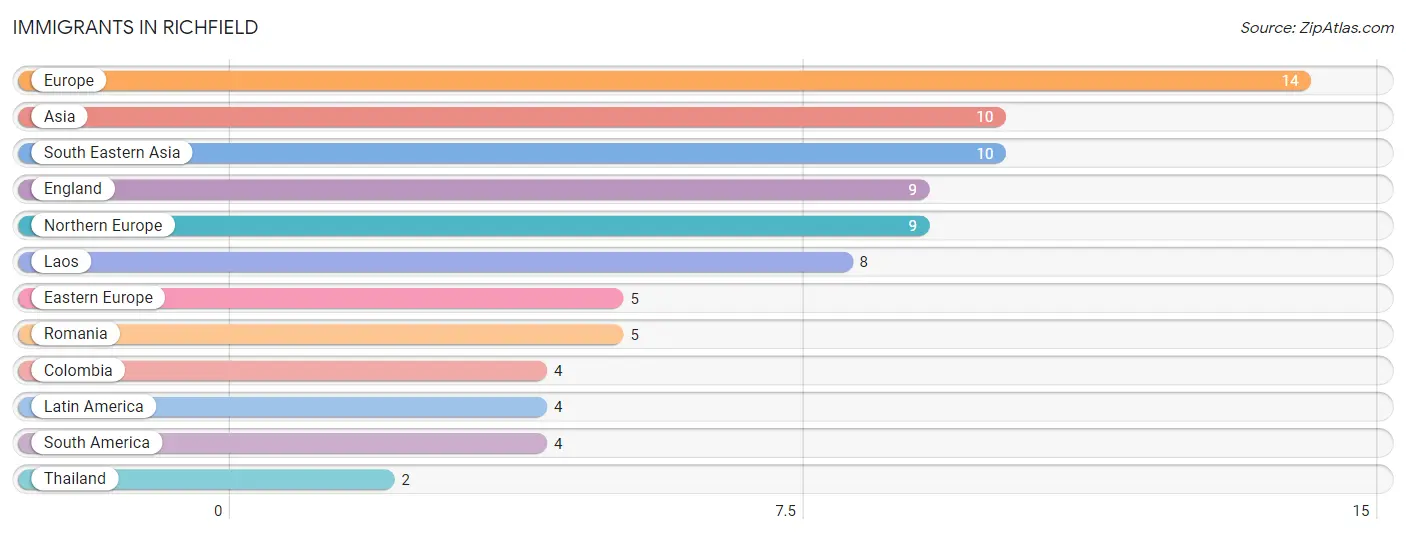
Immigrants in Richfield
The most numerous immigrant groups reported in Richfield came from Europe (14 | 1.5%), Asia (10 | 1.1%), South Eastern Asia (10 | 1.1%), England (9 | 1.0%), and Northern Europe (9 | 1.0%), together accounting for 5.7% of all Richfield residents.
| Immigration Origin | # Population | % Population |
| Asia | 10 | 1.1% |
| Colombia | 4 | 0.4% |
| Eastern Europe | 5 | 0.5% |
| England | 9 | 1.0% |
| Europe | 14 | 1.5% |
| Laos | 8 | 0.9% |
| Latin America | 4 | 0.4% |
| Northern Europe | 9 | 1.0% |
| Romania | 5 | 0.5% |
| South America | 4 | 0.4% |
| South Eastern Asia | 10 | 1.1% |
| Thailand | 2 | 0.2% | View All 12 Rows |
Sex and Age in Richfield
Sex and Age in Richfield
The most populous age groups in Richfield are 20 to 24 Years (87 | 18.1%) for men and 25 to 29 Years (83 | 18.9%) for women.
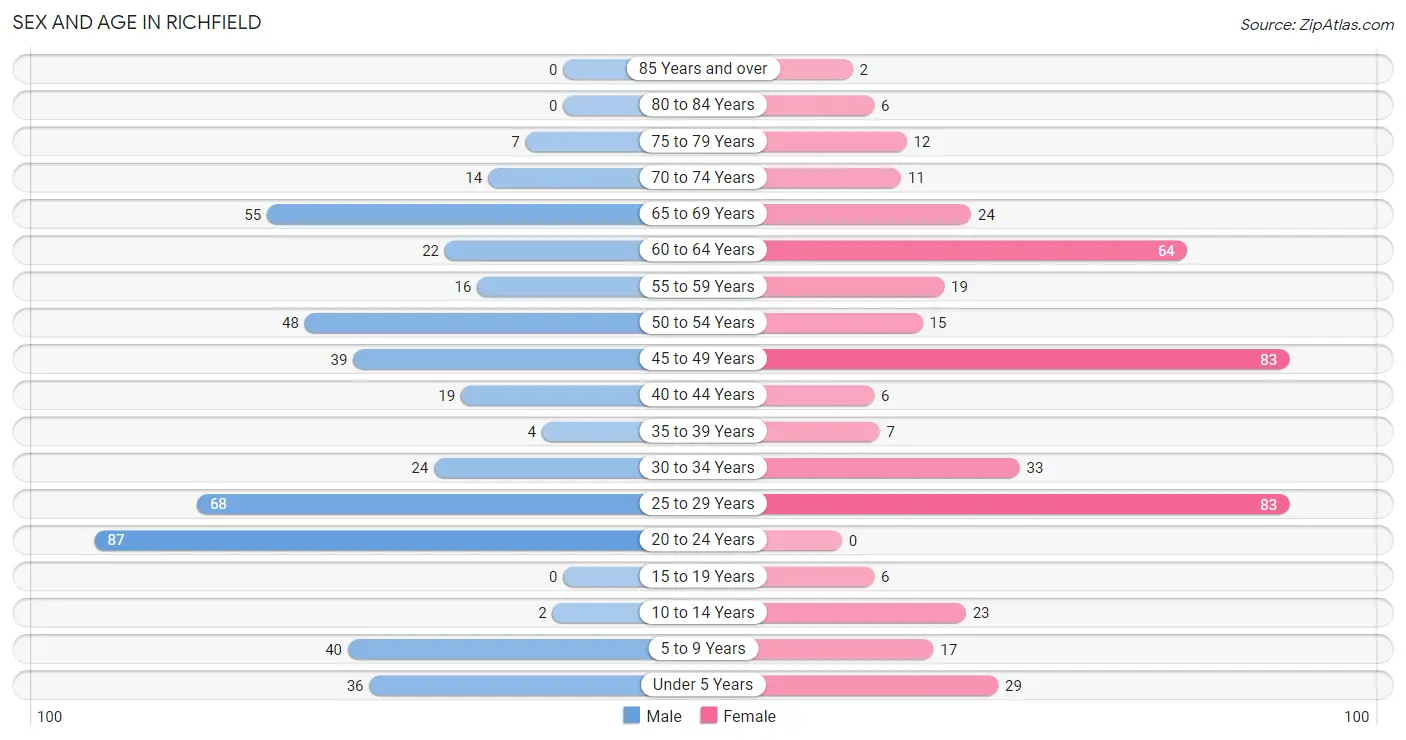
| Age Bracket | Male | Female |
| Under 5 Years | 36 (7.5%) | 29 (6.6%) |
| 5 to 9 Years | 40 (8.3%) | 17 (3.9%) |
| 10 to 14 Years | 2 (0.4%) | 23 (5.2%) |
| 15 to 19 Years | 0 (0.0%) | 6 (1.4%) |
| 20 to 24 Years | 87 (18.1%) | 0 (0.0%) |
| 25 to 29 Years | 68 (14.1%) | 83 (18.9%) |
| 30 to 34 Years | 24 (5.0%) | 33 (7.5%) |
| 35 to 39 Years | 4 (0.8%) | 7 (1.6%) |
| 40 to 44 Years | 19 (4.0%) | 6 (1.4%) |
| 45 to 49 Years | 39 (8.1%) | 83 (18.9%) |
| 50 to 54 Years | 48 (10.0%) | 15 (3.4%) |
| 55 to 59 Years | 16 (3.3%) | 19 (4.3%) |
| 60 to 64 Years | 22 (4.6%) | 64 (14.5%) |
| 65 to 69 Years | 55 (11.4%) | 24 (5.4%) |
| 70 to 74 Years | 14 (2.9%) | 11 (2.5%) |
| 75 to 79 Years | 7 (1.5%) | 12 (2.7%) |
| 80 to 84 Years | 0 (0.0%) | 6 (1.4%) |
| 85 Years and over | 0 (0.0%) | 2 (0.4%) |
| Total | 481 (100.0%) | 440 (100.0%) |
Families and Households in Richfield
Median Family Size in Richfield
The median family size in Richfield is 3.41 persons per family, with single male/father families (8 | 3.4%) accounting for the largest median family size of 4.13 persons per family. On the other hand, single female/mother families (6 | 2.5%) represent the smallest median family size with 1.83 persons per family.
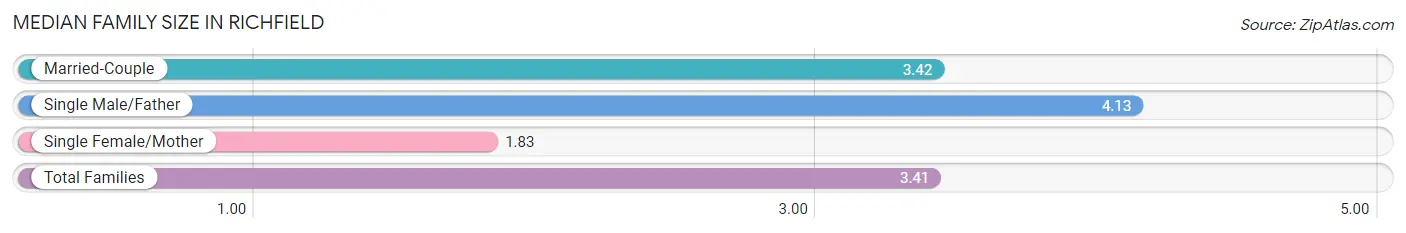
| Family Type | # Families | Family Size |
| Married-Couple | 223 (94.1%) | 3.42 |
| Single Male/Father | 8 (3.4%) | 4.13 |
| Single Female/Mother | 6 (2.5%) | 1.83 |
| Total Families | 237 (100.0%) | 3.41 |
Median Household Size in Richfield
The median household size in Richfield is 2.97 persons per household, with single male/father households (8 | 2.6%) accounting for the largest median household size of 4.13 persons per household. non-family households (73 | 23.5%) represent the smallest median household size with 1.52 persons per household.
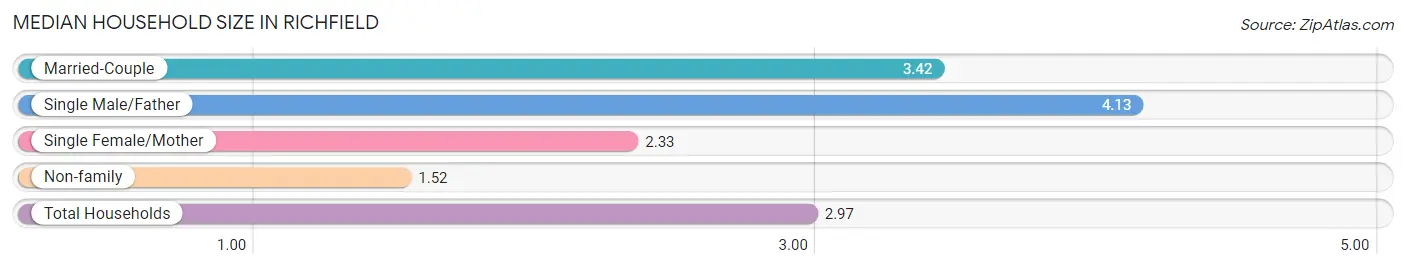
| Household Type | # Households | Household Size |
| Married-Couple | 223 (71.9%) | 3.42 |
| Single Male/Father | 8 (2.6%) | 4.13 |
| Single Female/Mother | 6 (1.9%) | 2.33 |
| Non-family | 73 (23.5%) | 1.52 |
| Total Households | 310 (100.0%) | 2.97 |
Household Size by Marriage Status in Richfield
Out of a total of 310 households in Richfield, 237 (76.4%) are family households, while 73 (23.5%) are nonfamily households. The most numerous type of family households are 3-person households, comprising 122, and the most common type of nonfamily households are 1-person households, comprising 41.
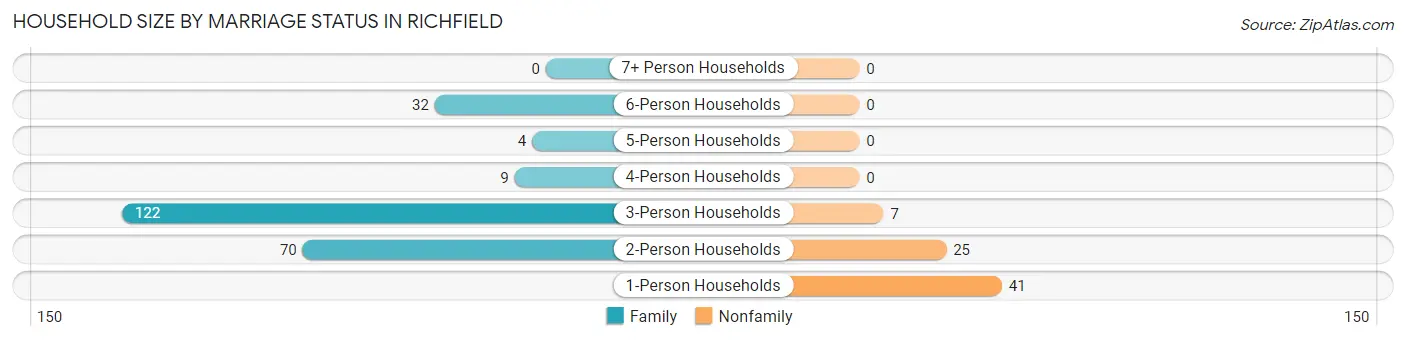
| Household Size | Family Households | Nonfamily Households |
| 1-Person Households | - | 41 (13.2%) |
| 2-Person Households | 70 (22.6%) | 25 (8.1%) |
| 3-Person Households | 122 (39.4%) | 7 (2.3%) |
| 4-Person Households | 9 (2.9%) | 0 (0.0%) |
| 5-Person Households | 4 (1.3%) | 0 (0.0%) |
| 6-Person Households | 32 (10.3%) | 0 (0.0%) |
| 7+ Person Households | 0 (0.0%) | 0 (0.0%) |
| Total | 237 (76.4%) | 73 (23.5%) |
Female Fertility in Richfield
Fertility by Age in Richfield
Average fertility rate in Richfield is 132.0 births per 1,000 women. Women in the age bracket of 20 to 34 years have the highest fertility rate with 250.0 births per 1,000 women. Women in the age bracket of 20 to 34 years acount for 100.0% of all women with births.
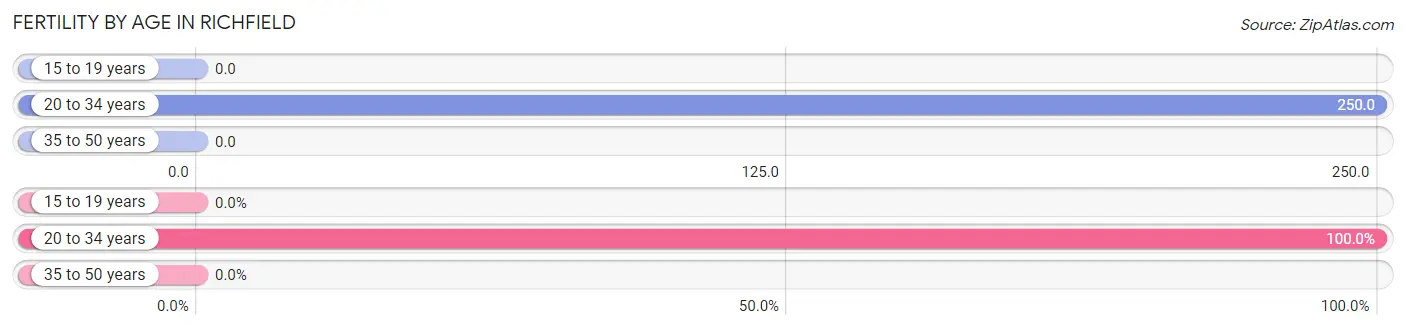
| Age Bracket | Women with Births | Births / 1,000 Women |
| 15 to 19 years | 0 (0.0%) | 0.0 |
| 20 to 34 years | 29 (100.0%) | 250.0 |
| 35 to 50 years | 0 (0.0%) | 0.0 |
| Total | 29 (100.0%) | 132.0 |
Fertility by Age by Marriage Status in Richfield
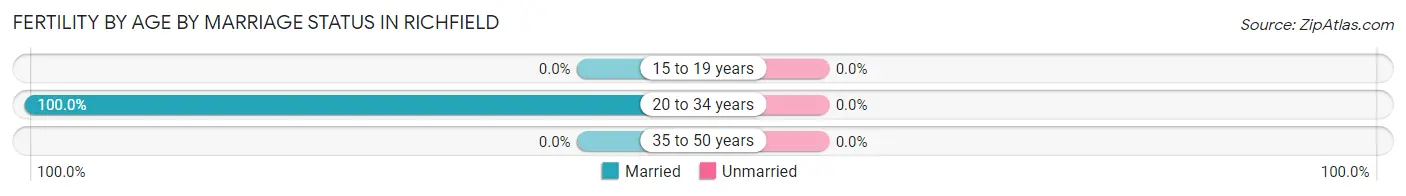
| Age Bracket | Married | Unmarried |
| 15 to 19 years | 0 (0.0%) | 0 (0.0%) |
| 20 to 34 years | 29 (100.0%) | 0 (0.0%) |
| 35 to 50 years | 0 (0.0%) | 0 (0.0%) |
| Total | 29 (100.0%) | 0 (0.0%) |
Fertility by Education in Richfield
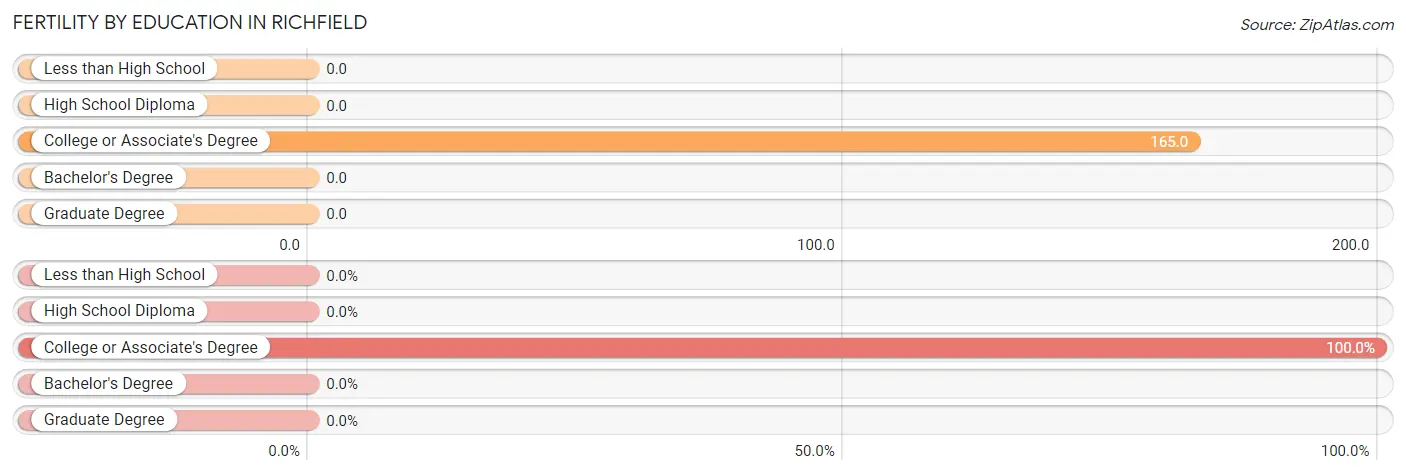
| Educational Attainment | Women with Births | Births / 1,000 Women |
| Less than High School | 0 (0.0%) | 0.0 |
| High School Diploma | 0 (0.0%) | 0.0 |
| College or Associate's Degree | 29 (100.0%) | 165.0 |
| Bachelor's Degree | 0 (0.0%) | 0.0 |
| Graduate Degree | 0 (0.0%) | 0.0 |
| Total | 29 (100.0%) | 132.0 |
Fertility by Education by Marriage Status in Richfield
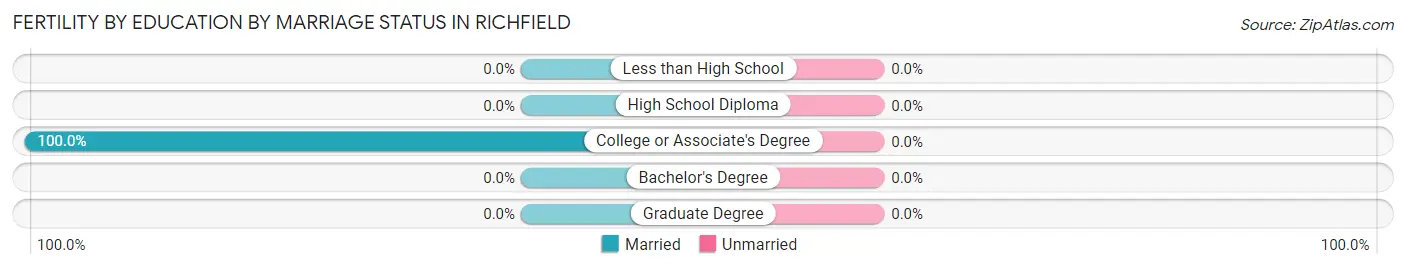
| Educational Attainment | Married | Unmarried |
| Less than High School | 0 (0.0%) | 0 (0.0%) |
| High School Diploma | 0 (0.0%) | 0 (0.0%) |
| College or Associate's Degree | 29 (100.0%) | 0 (0.0%) |
| Bachelor's Degree | 0 (0.0%) | 0 (0.0%) |
| Graduate Degree | 0 (0.0%) | 0 (0.0%) |
| Total | 29 (100.0%) | 0 (0.0%) |
Employment Characteristics in Richfield
Employment by Class of Employer in Richfield
Among the 503 employed individuals in Richfield, private company employees (344 | 68.4%), local government employees (60 | 11.9%), and self-employed (not incorporated) (41 | 8.2%) make up the most common classes of employment.
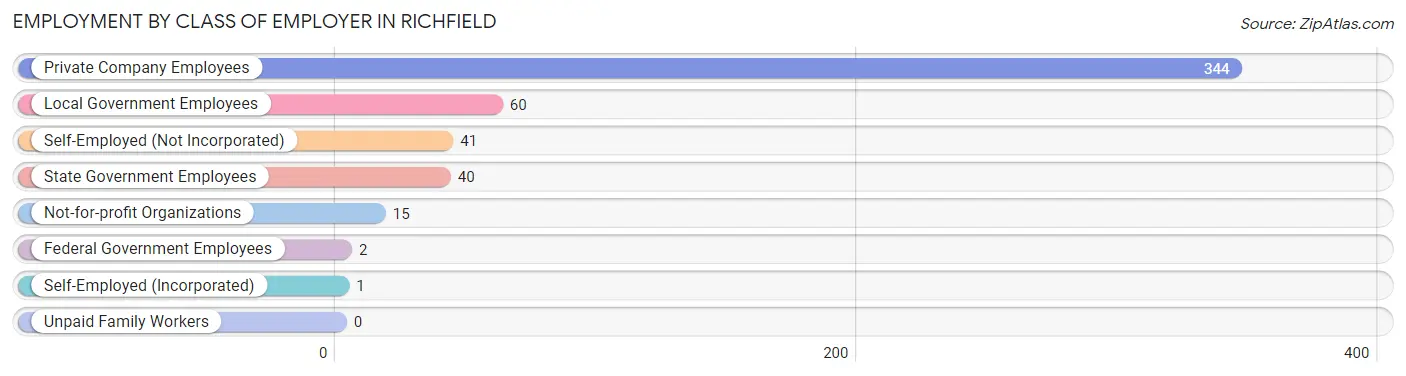
| Employer Class | # Employees | % Employees |
| Private Company Employees | 344 | 68.4% |
| Self-Employed (Incorporated) | 1 | 0.2% |
| Self-Employed (Not Incorporated) | 41 | 8.2% |
| Not-for-profit Organizations | 15 | 3.0% |
| Local Government Employees | 60 | 11.9% |
| State Government Employees | 40 | 8.0% |
| Federal Government Employees | 2 | 0.4% |
| Unpaid Family Workers | 0 | 0.0% |
| Total | 503 | 100.0% |
Employment Status by Age in Richfield
According to the labor force statistics for Richfield, out of the total population over 16 years of age (774), 66.5% or 515 individuals are in the labor force, with 1.8% or 9 of them unemployed. The age group with the highest labor force participation rate is 55 to 59 years, with 100.0% or 35 individuals in the labor force. Within the labor force, the 20 to 24 years age range has the highest percentage of unemployed individuals, with 20.8% or 5 of them being unemployed.
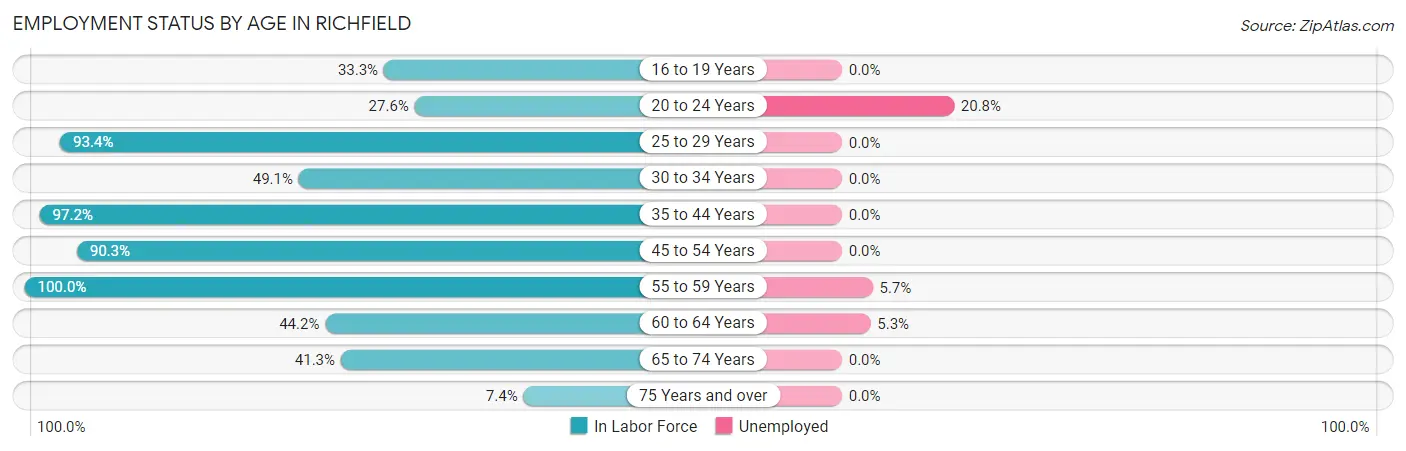
| Age Bracket | In Labor Force | Unemployed |
| 16 to 19 Years | 2 (33.3%) | 0 (0.0%) |
| 20 to 24 Years | 24 (27.6%) | 5 (20.8%) |
| 25 to 29 Years | 141 (93.4%) | 0 (0.0%) |
| 30 to 34 Years | 28 (49.1%) | 0 (0.0%) |
| 35 to 44 Years | 35 (97.2%) | 0 (0.0%) |
| 45 to 54 Years | 167 (90.3%) | 0 (0.0%) |
| 55 to 59 Years | 35 (100.0%) | 2 (5.7%) |
| 60 to 64 Years | 38 (44.2%) | 2 (5.3%) |
| 65 to 74 Years | 43 (41.3%) | 0 (0.0%) |
| 75 Years and over | 2 (7.4%) | 0 (0.0%) |
| Total | 515 (66.5%) | 9 (1.8%) |
Employment Status by Educational Attainment in Richfield
According to labor force statistics for Richfield, 80.7% of individuals (444) out of the total population between 25 and 64 years of age (550) are in the labor force, with 0.9% or 4 of them being unemployed. The group with the highest labor force participation rate are those with the educational attainment of college / associate degree, with 85.1% or 239 individuals in the labor force. Within the labor force, individuals with high school diploma education have the highest percentage of unemployment, with 4.0% or 4 of them being unemployed.
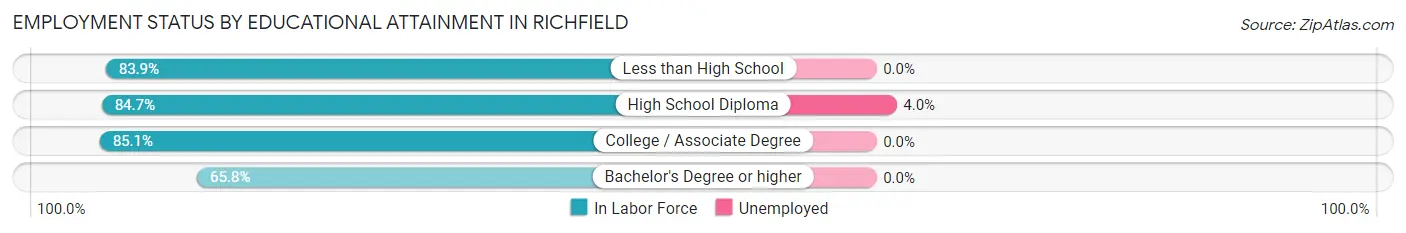
| Educational Attainment | In Labor Force | Unemployed |
| Less than High School | 26 (83.9%) | 0 (0.0%) |
| High School Diploma | 100 (84.7%) | 5 (4.0%) |
| College / Associate Degree | 239 (85.1%) | 0 (0.0%) |
| Bachelor's Degree or higher | 79 (65.8%) | 0 (0.0%) |
| Total | 444 (80.7%) | 5 (0.9%) |
Employment Occupations by Sex in Richfield
Management, Business, Science and Arts Occupations
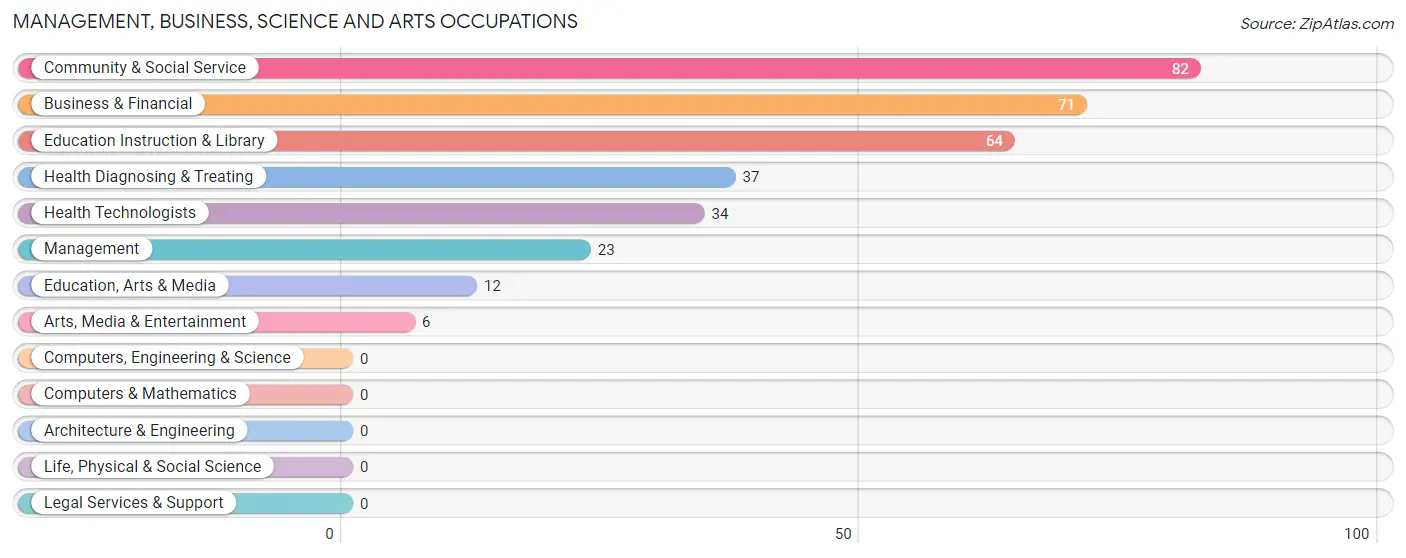
The most common Management, Business, Science and Arts occupations in Richfield are Community & Social Service (82 | 16.3%), Business & Financial (71 | 14.1%), Education Instruction & Library (64 | 12.7%), Health Diagnosing & Treating (37 | 7.3%), and Health Technologists (34 | 6.8%).
Management, Business, Science and Arts Occupations by Sex
Within the Management, Business, Science and Arts occupations in Richfield, the most male-oriented occupations are Education Instruction & Library (73.4%), Community & Social Service (63.4%), and Management (60.9%), while the most female-oriented occupations are Arts, Media & Entertainment (100.0%), Business & Financial (90.1%), and Education, Arts & Media (58.3%).
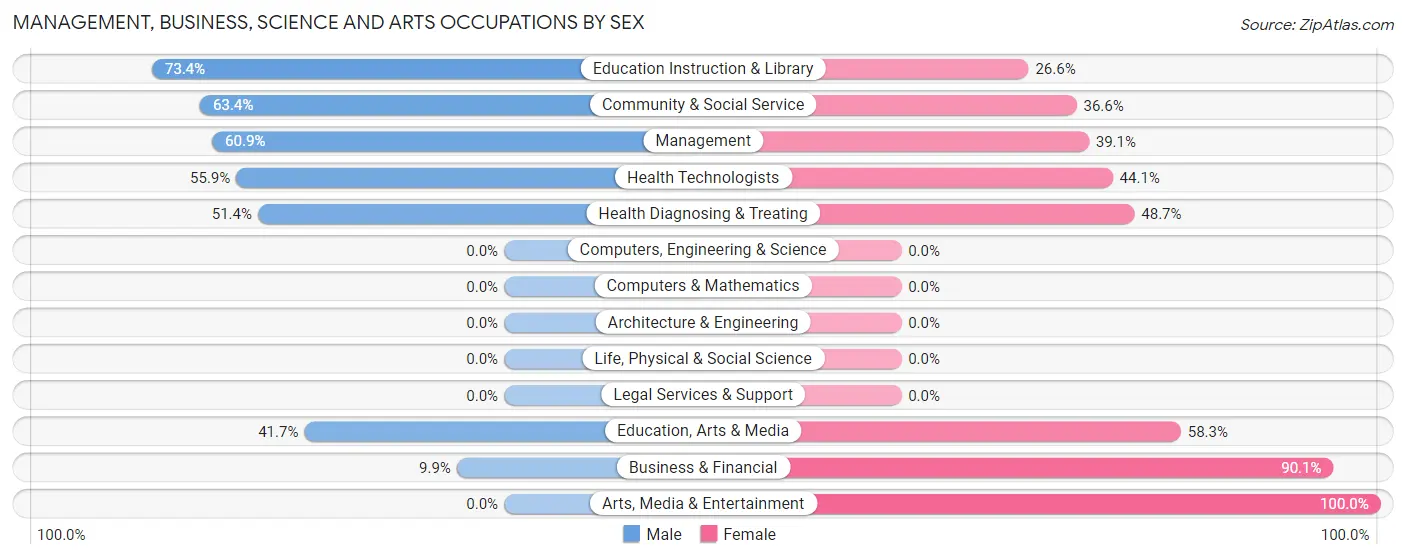
| Occupation | Male | Female |
| Management | 14 (60.9%) | 9 (39.1%) |
| Business & Financial | 7 (9.9%) | 64 (90.1%) |
| Computers, Engineering & Science | 0 (0.0%) | 0 (0.0%) |
| Computers & Mathematics | 0 (0.0%) | 0 (0.0%) |
| Architecture & Engineering | 0 (0.0%) | 0 (0.0%) |
| Life, Physical & Social Science | 0 (0.0%) | 0 (0.0%) |
| Community & Social Service | 52 (63.4%) | 30 (36.6%) |
| Education, Arts & Media | 5 (41.7%) | 7 (58.3%) |
| Legal Services & Support | 0 (0.0%) | 0 (0.0%) |
| Education Instruction & Library | 47 (73.4%) | 17 (26.6%) |
| Arts, Media & Entertainment | 0 (0.0%) | 6 (100.0%) |
| Health Diagnosing & Treating | 19 (51.3%) | 18 (48.6%) |
| Health Technologists | 19 (55.9%) | 15 (44.1%) |
| Total (Category) | 92 (43.2%) | 121 (56.8%) |
| Total (Overall) | 270 (53.6%) | 234 (46.4%) |
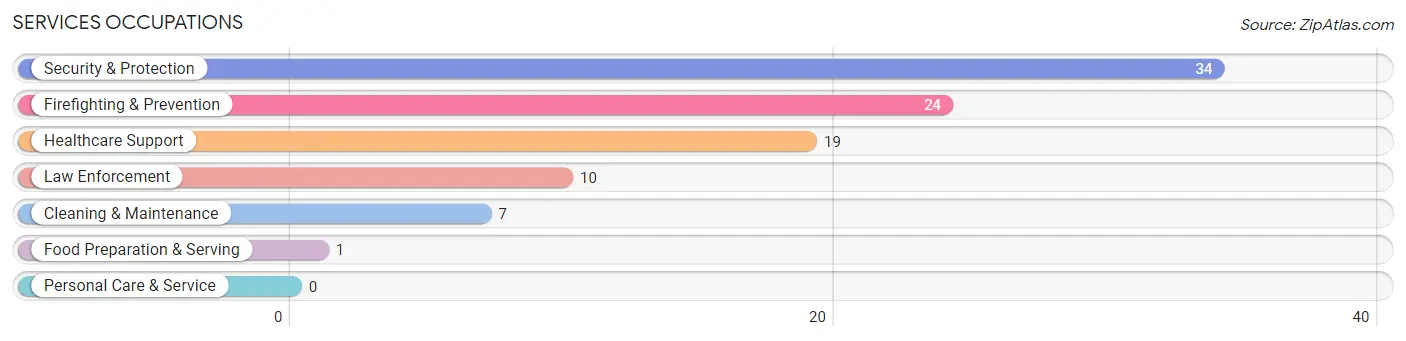
Services Occupations
The most common Services occupations in Richfield are Security & Protection (34 | 6.8%), Firefighting & Prevention (24 | 4.8%), Healthcare Support (19 | 3.8%), Law Enforcement (10 | 2.0%), and Cleaning & Maintenance (7 | 1.4%).
Services Occupations by Sex
Within the Services occupations in Richfield, the most male-oriented occupations are Firefighting & Prevention (100.0%), Security & Protection (91.2%), and Cleaning & Maintenance (71.4%), while the most female-oriented occupations are Healthcare Support (100.0%), Food Preparation & Serving (100.0%), and Law Enforcement (30.0%).
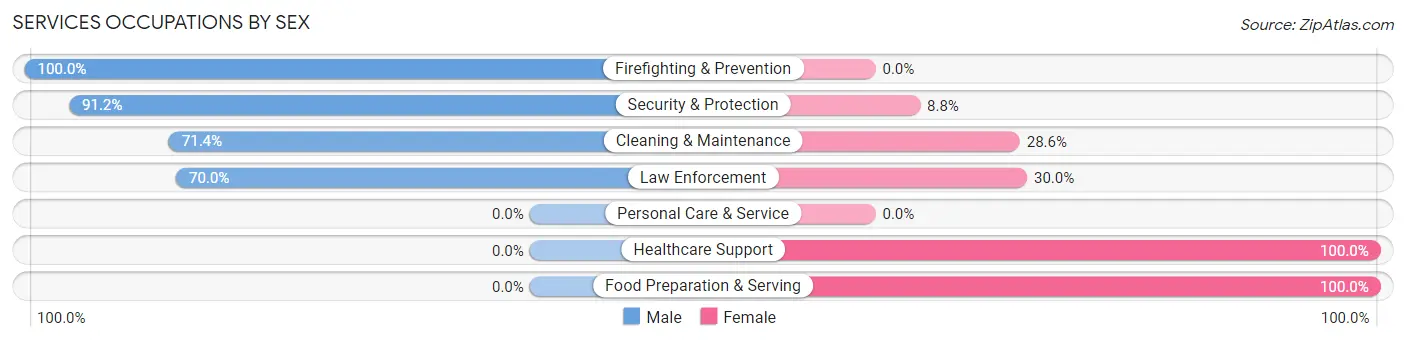
| Occupation | Male | Female |
| Healthcare Support | 0 (0.0%) | 19 (100.0%) |
| Security & Protection | 31 (91.2%) | 3 (8.8%) |
| Firefighting & Prevention | 24 (100.0%) | 0 (0.0%) |
| Law Enforcement | 7 (70.0%) | 3 (30.0%) |
| Food Preparation & Serving | 0 (0.0%) | 1 (100.0%) |
| Cleaning & Maintenance | 5 (71.4%) | 2 (28.6%) |
| Personal Care & Service | 0 (0.0%) | 0 (0.0%) |
| Total (Category) | 36 (59.0%) | 25 (41.0%) |
| Total (Overall) | 270 (53.6%) | 234 (46.4%) |
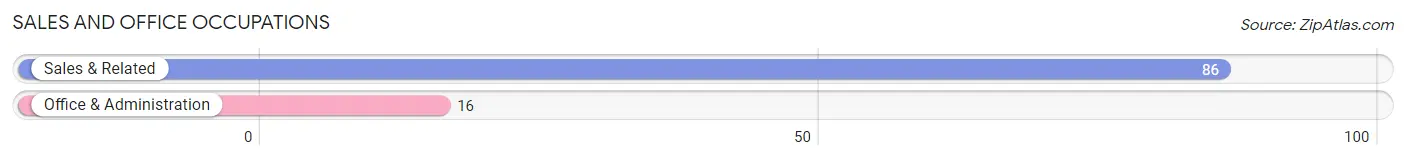
Sales and Office Occupations
The most common Sales and Office occupations in Richfield are Sales & Related (86 | 17.1%), and Office & Administration (16 | 3.2%).
Sales and Office Occupations by Sex
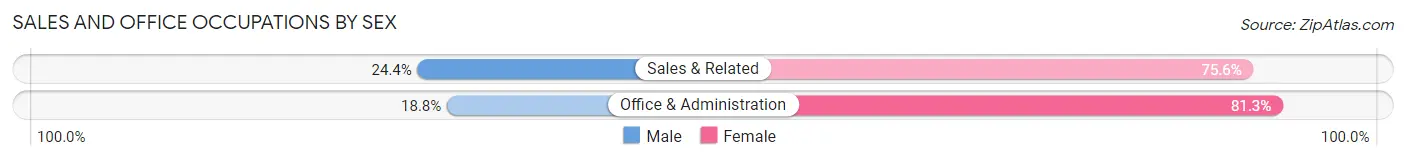
| Occupation | Male | Female |
| Sales & Related | 21 (24.4%) | 65 (75.6%) |
| Office & Administration | 3 (18.8%) | 13 (81.2%) |
| Total (Category) | 24 (23.5%) | 78 (76.5%) |
| Total (Overall) | 270 (53.6%) | 234 (46.4%) |
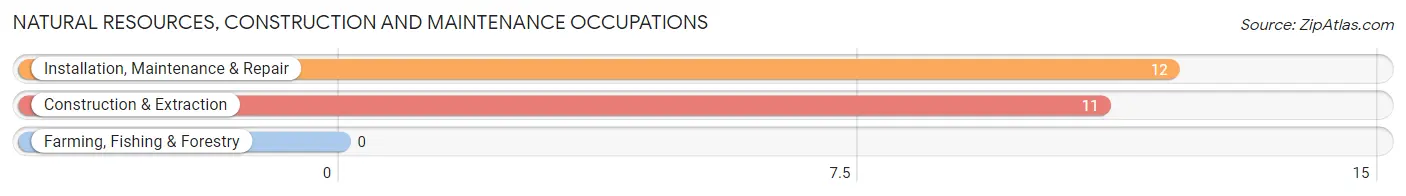
Natural Resources, Construction and Maintenance Occupations
The most common Natural Resources, Construction and Maintenance occupations in Richfield are Installation, Maintenance & Repair (12 | 2.4%), and Construction & Extraction (11 | 2.2%).
Natural Resources, Construction and Maintenance Occupations by Sex
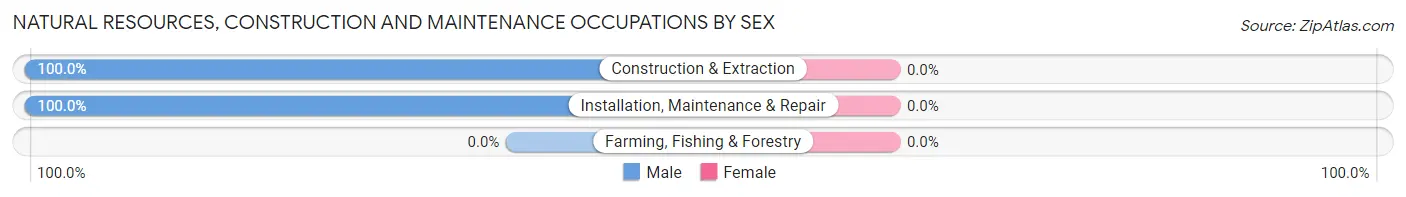
| Occupation | Male | Female |
| Farming, Fishing & Forestry | 0 (0.0%) | 0 (0.0%) |
| Construction & Extraction | 11 (100.0%) | 0 (0.0%) |
| Installation, Maintenance & Repair | 12 (100.0%) | 0 (0.0%) |
| Total (Category) | 23 (100.0%) | 0 (0.0%) |
| Total (Overall) | 270 (53.6%) | 234 (46.4%) |
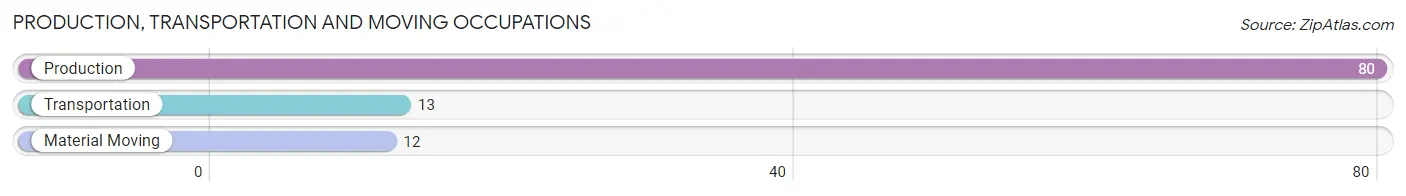
Production, Transportation and Moving Occupations
The most common Production, Transportation and Moving occupations in Richfield are Production (80 | 15.9%), Transportation (13 | 2.6%), and Material Moving (12 | 2.4%).
Production, Transportation and Moving Occupations by Sex
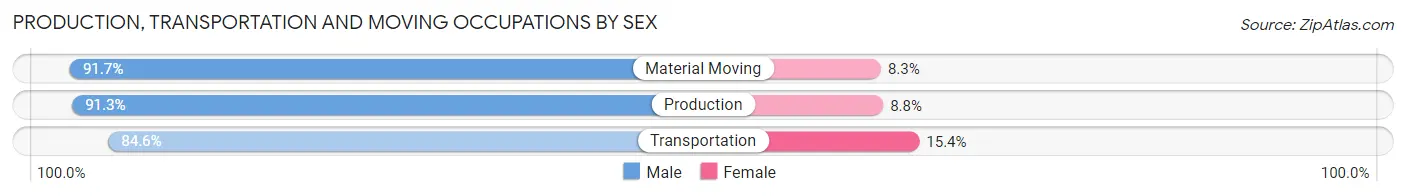
| Occupation | Male | Female |
| Production | 73 (91.2%) | 7 (8.7%) |
| Transportation | 11 (84.6%) | 2 (15.4%) |
| Material Moving | 11 (91.7%) | 1 (8.3%) |
| Total (Category) | 95 (90.5%) | 10 (9.5%) |
| Total (Overall) | 270 (53.6%) | 234 (46.4%) |
Employment Industries by Sex in Richfield
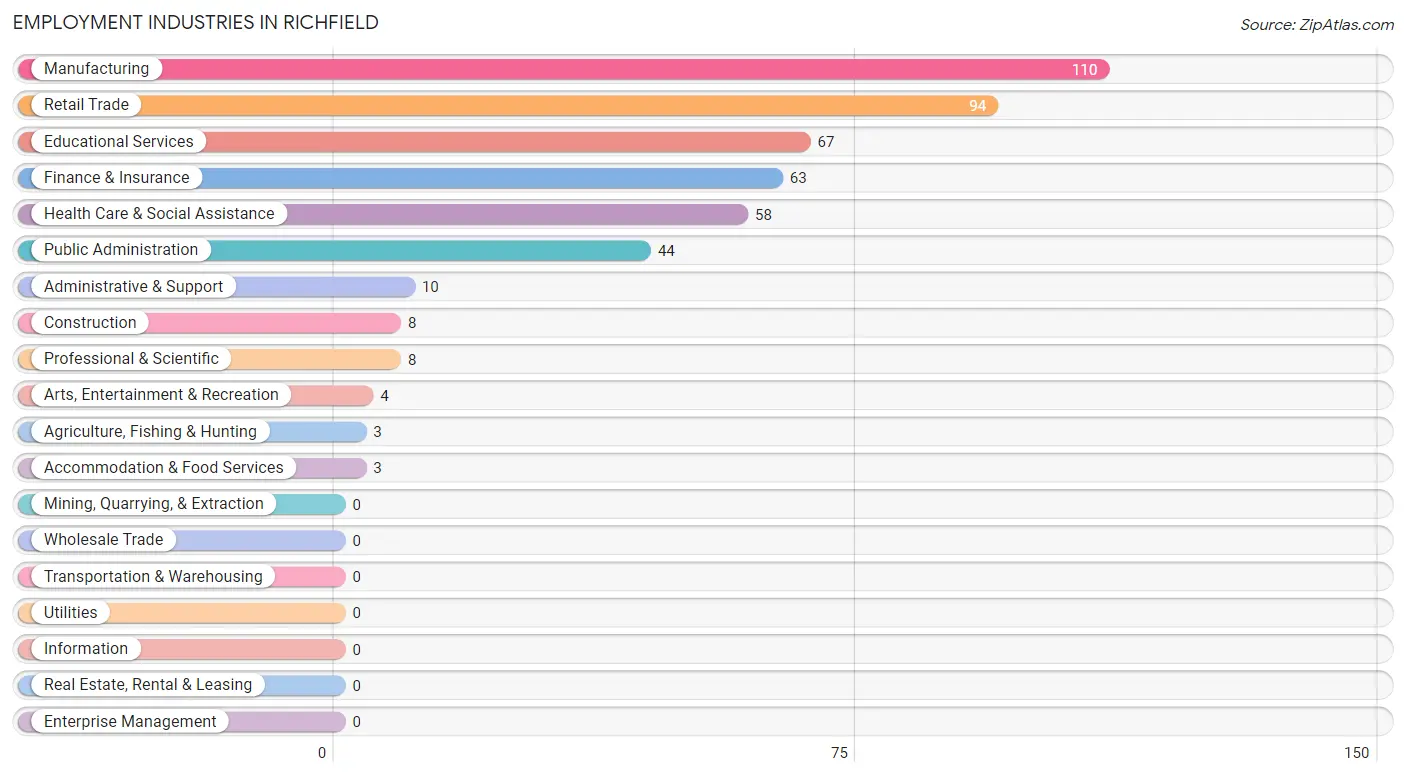
Employment Industries in Richfield
The major employment industries in Richfield include Manufacturing (110 | 21.8%), Retail Trade (94 | 18.6%), Educational Services (67 | 13.3%), Finance & Insurance (63 | 12.5%), and Health Care & Social Assistance (58 | 11.5%).
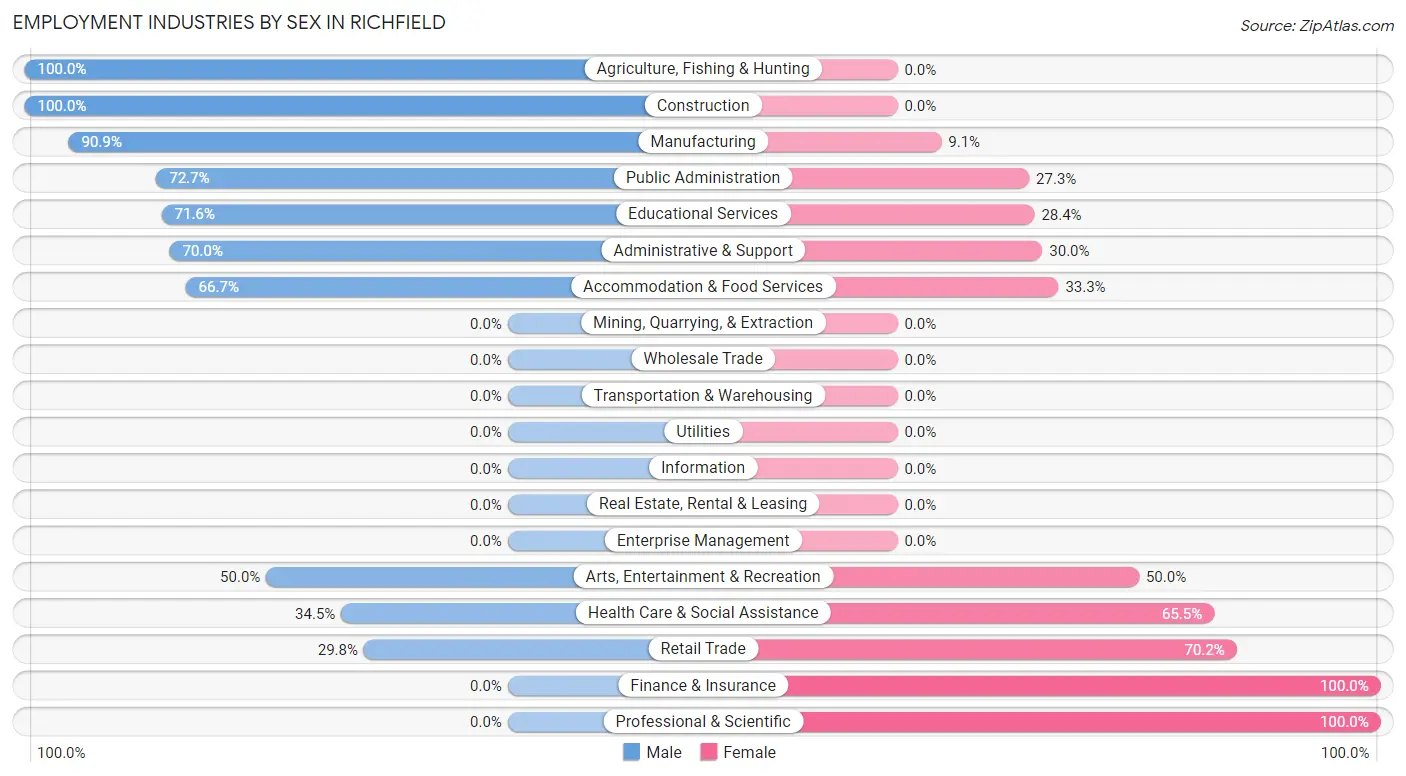
Employment Industries by Sex in Richfield
The Richfield industries that see more men than women are Agriculture, Fishing & Hunting (100.0%), Construction (100.0%), and Manufacturing (90.9%), whereas the industries that tend to have a higher number of women are Finance & Insurance (100.0%), Professional & Scientific (100.0%), and Retail Trade (70.2%).
| Industry | Male | Female |
| Agriculture, Fishing & Hunting | 3 (100.0%) | 0 (0.0%) |
| Mining, Quarrying, & Extraction | 0 (0.0%) | 0 (0.0%) |
| Construction | 8 (100.0%) | 0 (0.0%) |
| Manufacturing | 100 (90.9%) | 10 (9.1%) |
| Wholesale Trade | 0 (0.0%) | 0 (0.0%) |
| Retail Trade | 28 (29.8%) | 66 (70.2%) |
| Transportation & Warehousing | 0 (0.0%) | 0 (0.0%) |
| Utilities | 0 (0.0%) | 0 (0.0%) |
| Information | 0 (0.0%) | 0 (0.0%) |
| Finance & Insurance | 0 (0.0%) | 63 (100.0%) |
| Real Estate, Rental & Leasing | 0 (0.0%) | 0 (0.0%) |
| Professional & Scientific | 0 (0.0%) | 8 (100.0%) |
| Enterprise Management | 0 (0.0%) | 0 (0.0%) |
| Administrative & Support | 7 (70.0%) | 3 (30.0%) |
| Educational Services | 48 (71.6%) | 19 (28.4%) |
| Health Care & Social Assistance | 20 (34.5%) | 38 (65.5%) |
| Arts, Entertainment & Recreation | 2 (50.0%) | 2 (50.0%) |
| Accommodation & Food Services | 2 (66.7%) | 1 (33.3%) |
| Public Administration | 32 (72.7%) | 12 (27.3%) |
| Total | 270 (53.6%) | 234 (46.4%) |
Education in Richfield
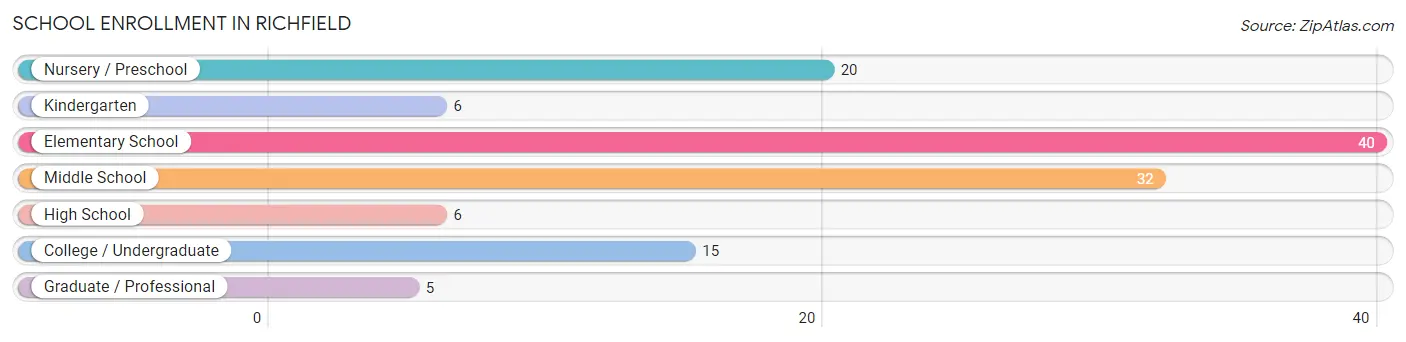
School Enrollment in Richfield
The most common levels of schooling among the 124 students in Richfield are elementary school (40 | 32.3%), middle school (32 | 25.8%), and nursery / preschool (20 | 16.1%).
| School Level | # Students | % Students |
| Nursery / Preschool | 20 | 16.1% |
| Kindergarten | 6 | 4.8% |
| Elementary School | 40 | 32.3% |
| Middle School | 32 | 25.8% |
| High School | 6 | 4.8% |
| College / Undergraduate | 15 | 12.1% |
| Graduate / Professional | 5 | 4.0% |
| Total | 124 | 100.0% |
School Enrollment by Age by Funding Source in Richfield
Out of a total of 124 students who are enrolled in schools in Richfield, 24 (19.4%) attend a private institution, while the remaining 100 (80.6%) are enrolled in public schools. The age group of 3 to 4 year olds has the highest likelihood of being enrolled in private schools, with 17 (85.0% in the age bracket) enrolled. Conversely, the age group of 10 to 14 year olds has the lowest likelihood of being enrolled in a private school, with 25 (100.0% in the age bracket) attending a public institution.
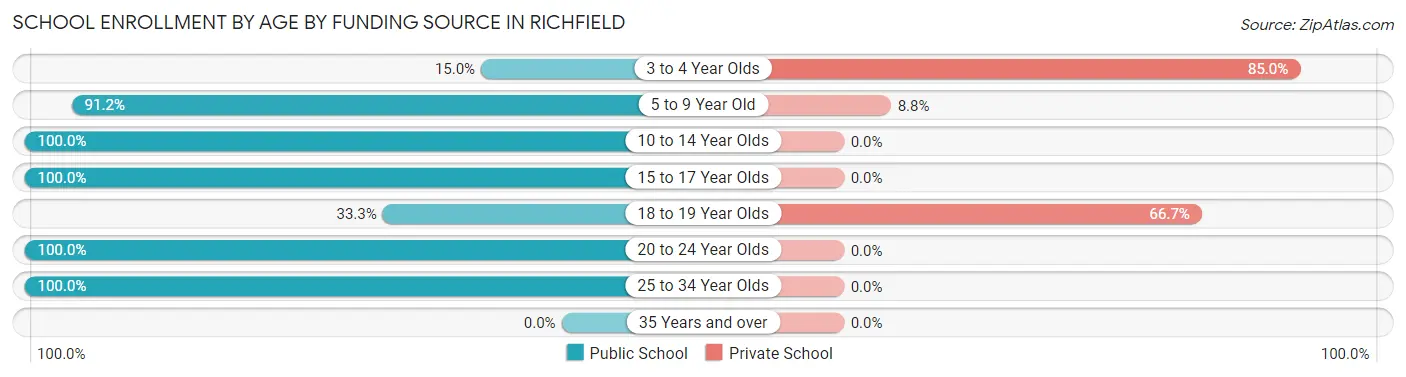
| Age Bracket | Public School | Private School |
| 3 to 4 Year Olds | 3 (15.0%) | 17 (85.0%) |
| 5 to 9 Year Old | 52 (91.2%) | 5 (8.8%) |
| 10 to 14 Year Olds | 25 (100.0%) | 0 (0.0%) |
| 15 to 17 Year Olds | 2 (100.0%) | 0 (0.0%) |
| 18 to 19 Year Olds | 1 (33.3%) | 2 (66.7%) |
| 20 to 24 Year Olds | 3 (100.0%) | 0 (0.0%) |
| 25 to 34 Year Olds | 14 (100.0%) | 0 (0.0%) |
| 35 Years and over | 0 (0.0%) | 0 (0.0%) |
| Total | 100 (80.6%) | 24 (19.4%) |
Educational Attainment by Field of Study in Richfield
Education (51 | 26.8%), business (47 | 24.7%), science & technology (36 | 19.0%), arts & humanities (20 | 10.5%), and computers & mathematics (10 | 5.3%) are the most common fields of study among 190 individuals in Richfield who have obtained a bachelor's degree or higher.
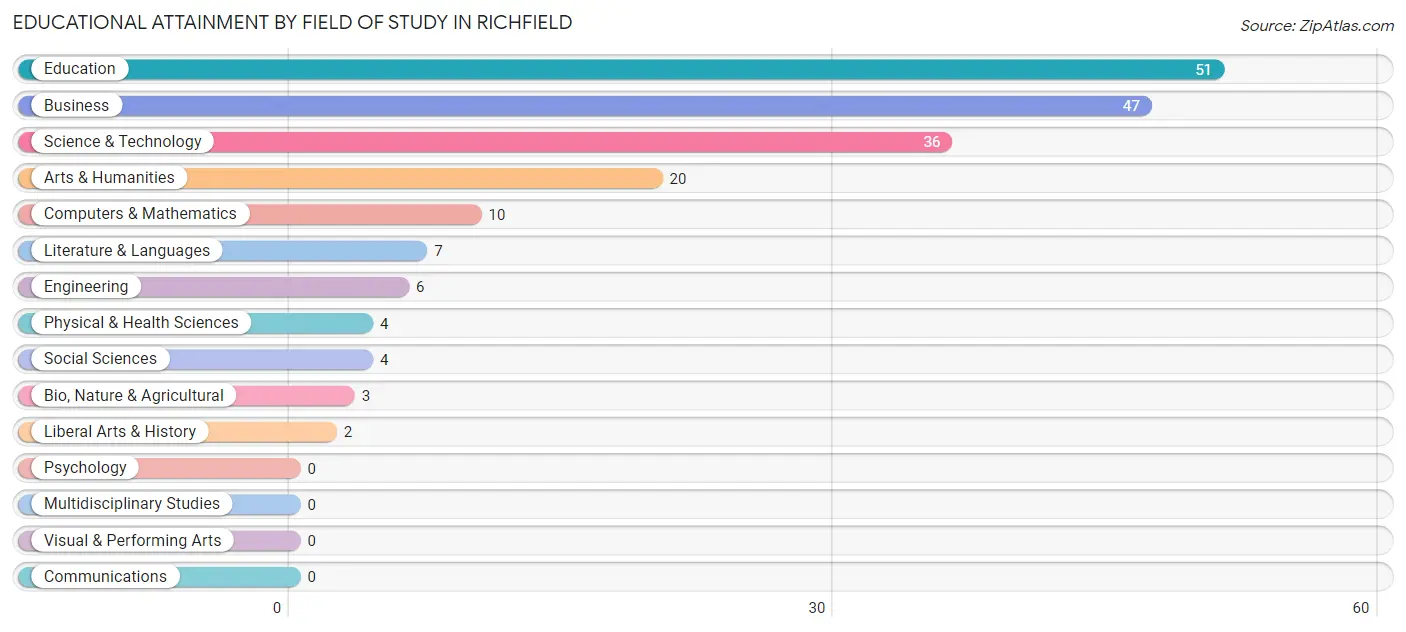
| Field of Study | # Graduates | % Graduates |
| Computers & Mathematics | 10 | 5.3% |
| Bio, Nature & Agricultural | 3 | 1.6% |
| Physical & Health Sciences | 4 | 2.1% |
| Psychology | 0 | 0.0% |
| Social Sciences | 4 | 2.1% |
| Engineering | 6 | 3.2% |
| Multidisciplinary Studies | 0 | 0.0% |
| Science & Technology | 36 | 19.0% |
| Business | 47 | 24.7% |
| Education | 51 | 26.8% |
| Literature & Languages | 7 | 3.7% |
| Liberal Arts & History | 2 | 1.1% |
| Visual & Performing Arts | 0 | 0.0% |
| Communications | 0 | 0.0% |
| Arts & Humanities | 20 | 10.5% |
| Total | 190 | 100.0% |
Transportation & Commute in Richfield
Vehicle Availability by Sex in Richfield
The most prevalent vehicle ownership categories in Richfield are males with 3 vehicles (111, accounting for 40.8%) and females with 3 vehicles (100, making up 48.0%).
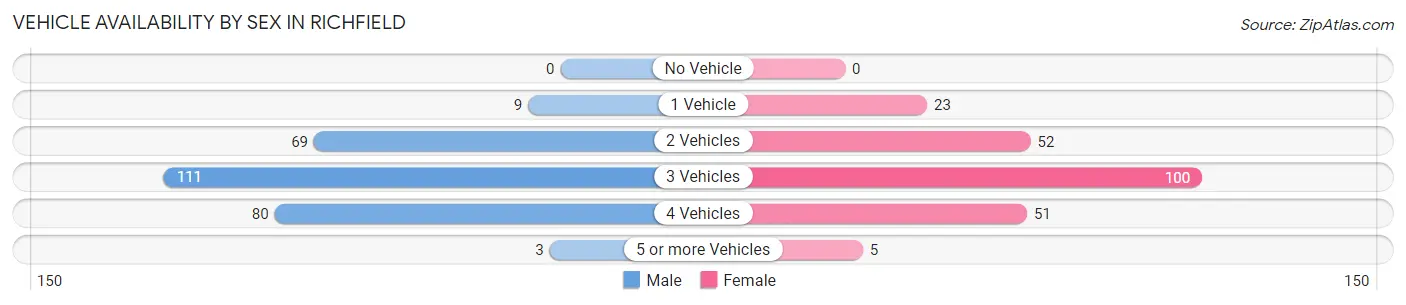
| Vehicles Available | Male | Female |
| No Vehicle | 0 (0.0%) | 0 (0.0%) |
| 1 Vehicle | 9 (3.3%) | 23 (10.0%) |
| 2 Vehicles | 69 (25.4%) | 52 (22.5%) |
| 3 Vehicles | 111 (40.8%) | 100 (43.3%) |
| 4 Vehicles | 80 (29.4%) | 51 (22.1%) |
| 5 or more Vehicles | 3 (1.1%) | 5 (2.2%) |
| Total | 272 (100.0%) | 231 (100.0%) |
Commute Time in Richfield
The most frequently occuring commute durations in Richfield are 15 to 19 minutes (144 commuters, 28.9%), 20 to 24 minutes (85 commuters, 17.0%), and 40 to 44 minutes (63 commuters, 12.6%).
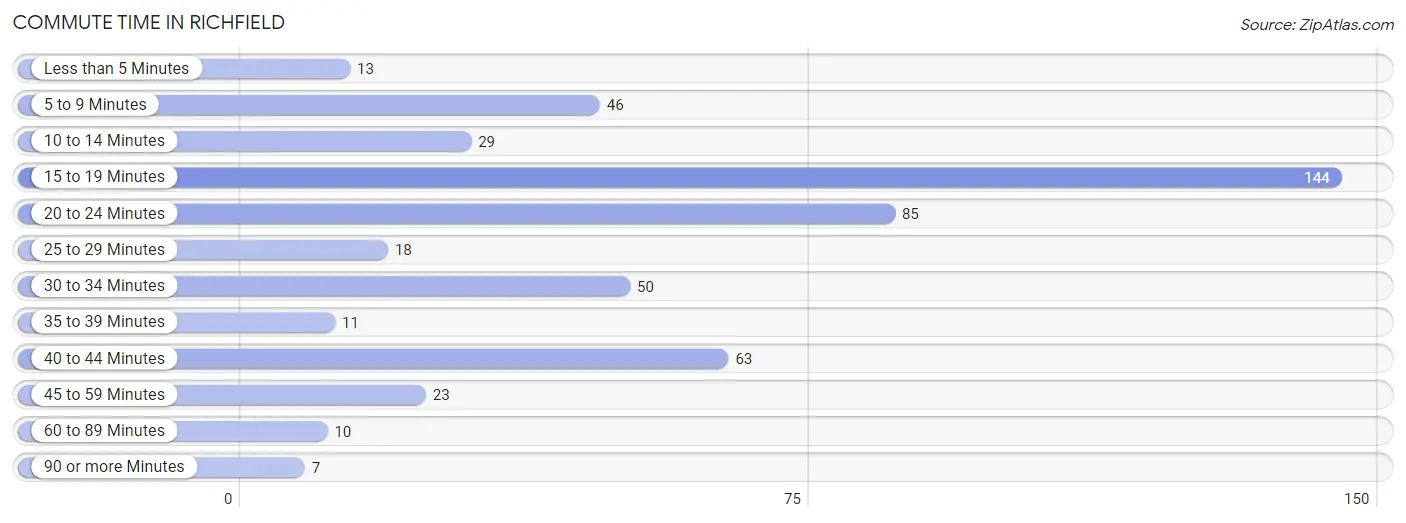
| Commute Time | # Commuters | % Commuters |
| Less than 5 Minutes | 13 | 2.6% |
| 5 to 9 Minutes | 46 | 9.2% |
| 10 to 14 Minutes | 29 | 5.8% |
| 15 to 19 Minutes | 144 | 28.9% |
| 20 to 24 Minutes | 85 | 17.0% |
| 25 to 29 Minutes | 18 | 3.6% |
| 30 to 34 Minutes | 50 | 10.0% |
| 35 to 39 Minutes | 11 | 2.2% |
| 40 to 44 Minutes | 63 | 12.6% |
| 45 to 59 Minutes | 23 | 4.6% |
| 60 to 89 Minutes | 10 | 2.0% |
| 90 or more Minutes | 7 | 1.4% |
Commute Time by Sex in Richfield
The most common commute times in Richfield are 15 to 19 minutes (124 commuters, 45.9%) for males and 20 to 24 minutes (71 commuters, 31.0%) for females.
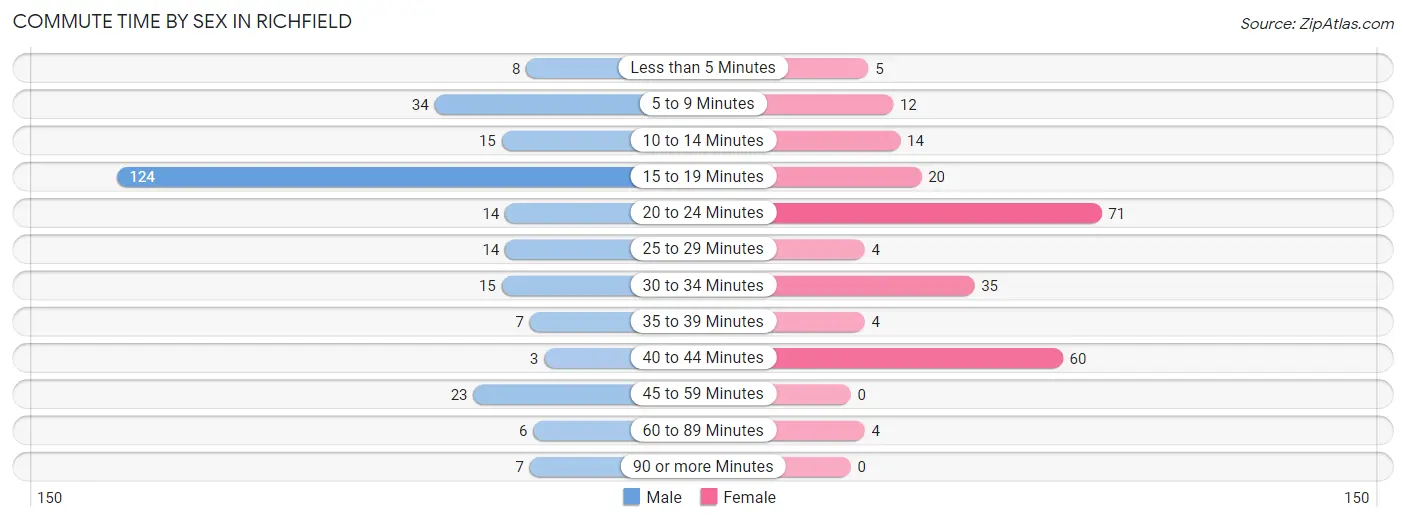
| Commute Time | Male | Female |
| Less than 5 Minutes | 8 (3.0%) | 5 (2.2%) |
| 5 to 9 Minutes | 34 (12.6%) | 12 (5.2%) |
| 10 to 14 Minutes | 15 (5.6%) | 14 (6.1%) |
| 15 to 19 Minutes | 124 (45.9%) | 20 (8.7%) |
| 20 to 24 Minutes | 14 (5.2%) | 71 (31.0%) |
| 25 to 29 Minutes | 14 (5.2%) | 4 (1.8%) |
| 30 to 34 Minutes | 15 (5.6%) | 35 (15.3%) |
| 35 to 39 Minutes | 7 (2.6%) | 4 (1.8%) |
| 40 to 44 Minutes | 3 (1.1%) | 60 (26.2%) |
| 45 to 59 Minutes | 23 (8.5%) | 0 (0.0%) |
| 60 to 89 Minutes | 6 (2.2%) | 4 (1.8%) |
| 90 or more Minutes | 7 (2.6%) | 0 (0.0%) |
Time of Departure to Work by Sex in Richfield
The most frequent times of departure to work in Richfield are 6:30 AM to 6:59 AM (52, 19.3%) for males and 7:30 AM to 7:59 AM (74, 32.3%) for females.
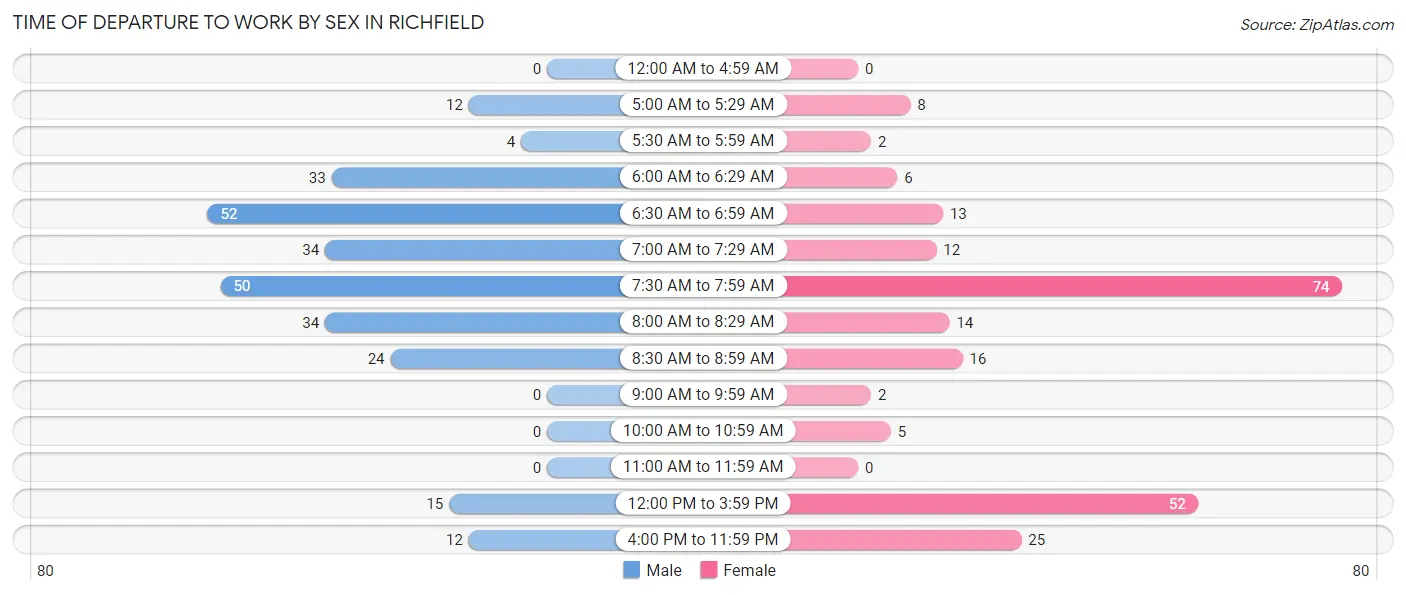
| Time of Departure | Male | Female |
| 12:00 AM to 4:59 AM | 0 (0.0%) | 0 (0.0%) |
| 5:00 AM to 5:29 AM | 12 (4.4%) | 8 (3.5%) |
| 5:30 AM to 5:59 AM | 4 (1.5%) | 2 (0.9%) |
| 6:00 AM to 6:29 AM | 33 (12.2%) | 6 (2.6%) |
| 6:30 AM to 6:59 AM | 52 (19.3%) | 13 (5.7%) |
| 7:00 AM to 7:29 AM | 34 (12.6%) | 12 (5.2%) |
| 7:30 AM to 7:59 AM | 50 (18.5%) | 74 (32.3%) |
| 8:00 AM to 8:29 AM | 34 (12.6%) | 14 (6.1%) |
| 8:30 AM to 8:59 AM | 24 (8.9%) | 16 (7.0%) |
| 9:00 AM to 9:59 AM | 0 (0.0%) | 2 (0.9%) |
| 10:00 AM to 10:59 AM | 0 (0.0%) | 5 (2.2%) |
| 11:00 AM to 11:59 AM | 0 (0.0%) | 0 (0.0%) |
| 12:00 PM to 3:59 PM | 15 (5.6%) | 52 (22.7%) |
| 4:00 PM to 11:59 PM | 12 (4.4%) | 25 (10.9%) |
| Total | 270 (100.0%) | 229 (100.0%) |
Housing Occupancy in Richfield
Occupancy by Ownership in Richfield
Of the total 310 dwellings in Richfield, owner-occupied units account for 252 (81.3%), while renter-occupied units make up 58 (18.7%).
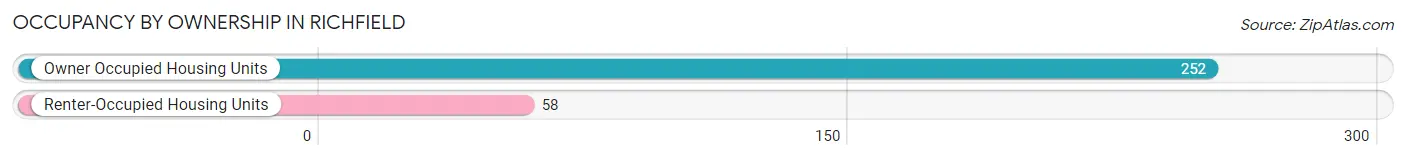
| Occupancy | # Housing Units | % Housing Units |
| Owner Occupied Housing Units | 252 | 81.3% |
| Renter-Occupied Housing Units | 58 | 18.7% |
| Total Occupied Housing Units | 310 | 100.0% |
Occupancy by Household Size in Richfield
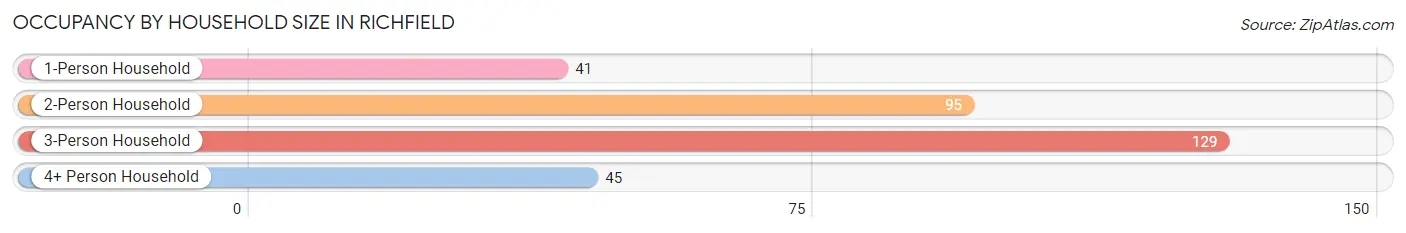
| Household Size | # Housing Units | % Housing Units |
| 1-Person Household | 41 | 13.2% |
| 2-Person Household | 95 | 30.6% |
| 3-Person Household | 129 | 41.6% |
| 4+ Person Household | 45 | 14.5% |
| Total Housing Units | 310 | 100.0% |
Occupancy by Ownership by Household Size in Richfield
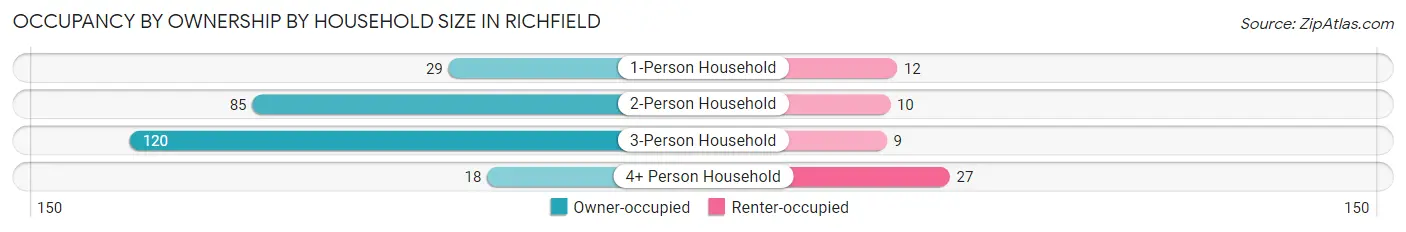
| Household Size | Owner-occupied | Renter-occupied |
| 1-Person Household | 29 (70.7%) | 12 (29.3%) |
| 2-Person Household | 85 (89.5%) | 10 (10.5%) |
| 3-Person Household | 120 (93.0%) | 9 (7.0%) |
| 4+ Person Household | 18 (40.0%) | 27 (60.0%) |
| Total Housing Units | 252 (81.3%) | 58 (18.7%) |
Occupancy by Educational Attainment in Richfield
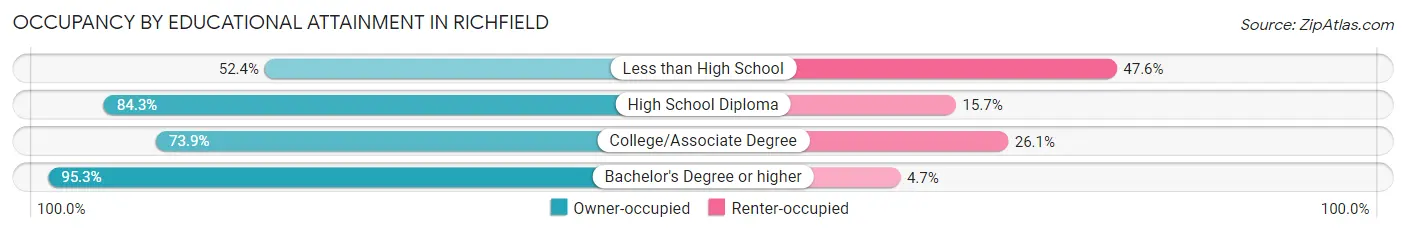
| Household Size | Owner-occupied | Renter-occupied |
| Less than High School | 11 (52.4%) | 10 (47.6%) |
| High School Diploma | 75 (84.3%) | 14 (15.7%) |
| College/Associate Degree | 85 (73.9%) | 30 (26.1%) |
| Bachelor's Degree or higher | 81 (95.3%) | 4 (4.7%) |
Occupancy by Age of Householder in Richfield
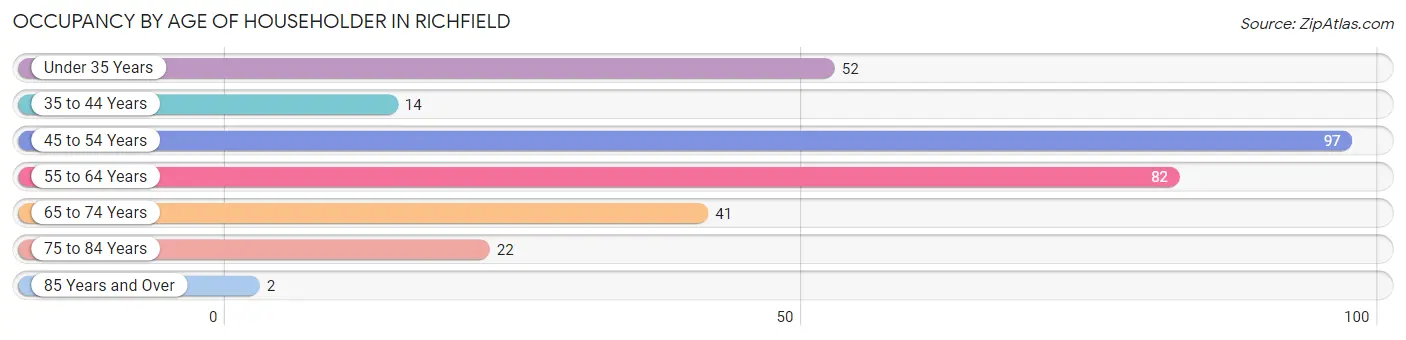
| Age Bracket | # Households | % Households |
| Under 35 Years | 52 | 16.8% |
| 35 to 44 Years | 14 | 4.5% |
| 45 to 54 Years | 97 | 31.3% |
| 55 to 64 Years | 82 | 26.5% |
| 65 to 74 Years | 41 | 13.2% |
| 75 to 84 Years | 22 | 7.1% |
| 85 Years and Over | 2 | 0.6% |
| Total | 310 | 100.0% |
Housing Finances in Richfield
Median Income by Occupancy in Richfield
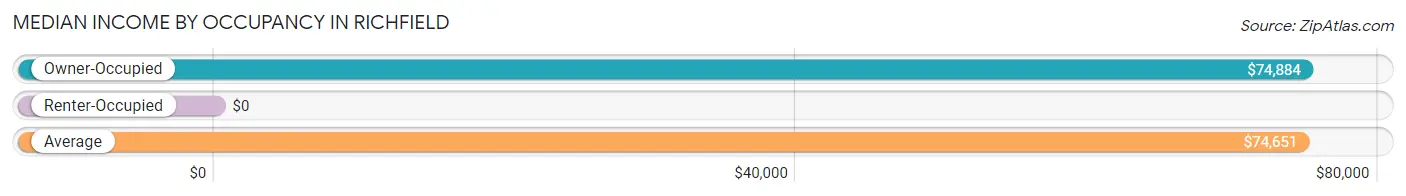
| Occupancy Type | # Households | Median Income |
| Owner-Occupied | 252 (81.3%) | $74,884 |
| Renter-Occupied | 58 (18.7%) | $0 |
| Average | 310 (100.0%) | $74,651 |
Occupancy by Householder Income Bracket in Richfield
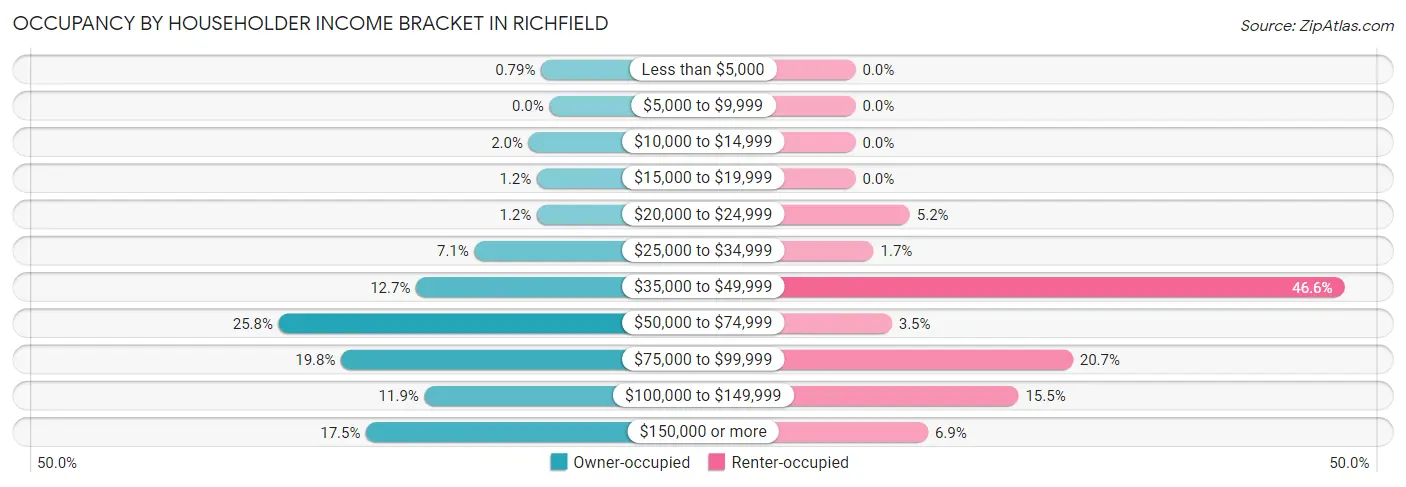
| Income Bracket | Owner-occupied | Renter-occupied |
| Less than $5,000 | 2 (0.8%) | 0 (0.0%) |
| $5,000 to $9,999 | 0 (0.0%) | 0 (0.0%) |
| $10,000 to $14,999 | 5 (2.0%) | 0 (0.0%) |
| $15,000 to $19,999 | 3 (1.2%) | 0 (0.0%) |
| $20,000 to $24,999 | 3 (1.2%) | 3 (5.2%) |
| $25,000 to $34,999 | 18 (7.1%) | 1 (1.7%) |
| $35,000 to $49,999 | 32 (12.7%) | 27 (46.6%) |
| $50,000 to $74,999 | 65 (25.8%) | 2 (3.5%) |
| $75,000 to $99,999 | 50 (19.8%) | 12 (20.7%) |
| $100,000 to $149,999 | 30 (11.9%) | 9 (15.5%) |
| $150,000 or more | 44 (17.5%) | 4 (6.9%) |
| Total | 252 (100.0%) | 58 (100.0%) |
Monthly Housing Cost Tiers in Richfield
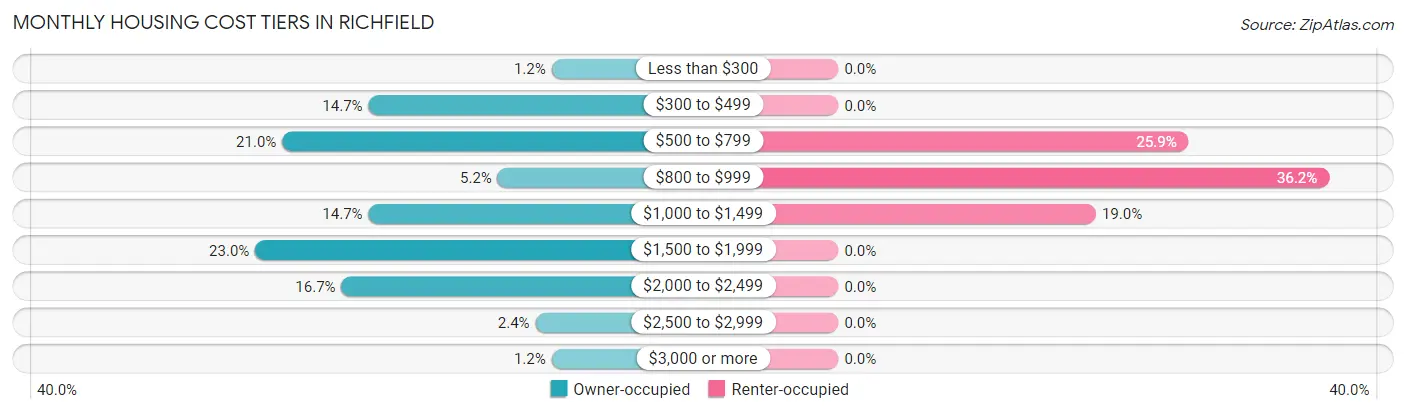
| Monthly Cost | Owner-occupied | Renter-occupied |
| Less than $300 | 3 (1.2%) | 0 (0.0%) |
| $300 to $499 | 37 (14.7%) | 0 (0.0%) |
| $500 to $799 | 53 (21.0%) | 15 (25.9%) |
| $800 to $999 | 13 (5.2%) | 21 (36.2%) |
| $1,000 to $1,499 | 37 (14.7%) | 11 (19.0%) |
| $1,500 to $1,999 | 58 (23.0%) | 0 (0.0%) |
| $2,000 to $2,499 | 42 (16.7%) | 0 (0.0%) |
| $2,500 to $2,999 | 6 (2.4%) | 0 (0.0%) |
| $3,000 or more | 3 (1.2%) | 0 (0.0%) |
| Total | 252 (100.0%) | 58 (100.0%) |
Physical Housing Characteristics in Richfield
Housing Structures in Richfield
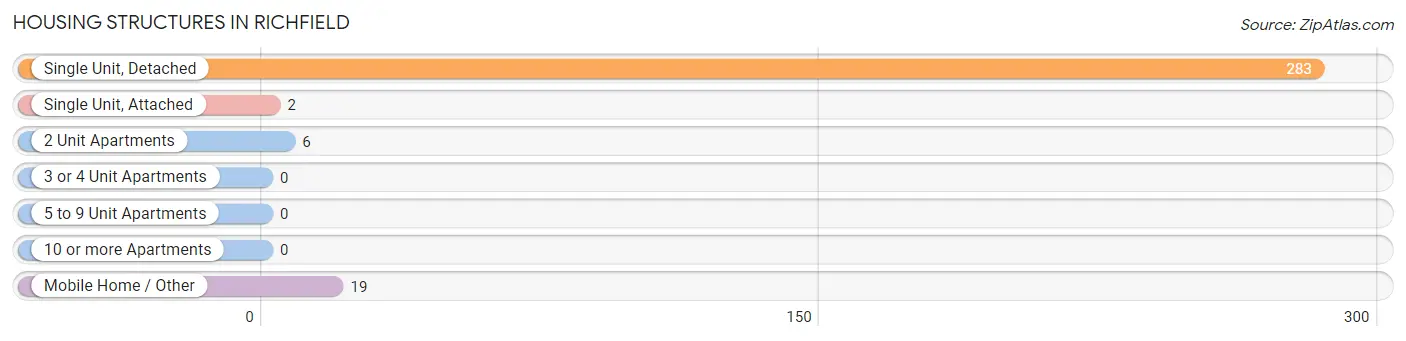
| Structure Type | # Housing Units | % Housing Units |
| Single Unit, Detached | 283 | 91.3% |
| Single Unit, Attached | 2 | 0.6% |
| 2 Unit Apartments | 6 | 1.9% |
| 3 or 4 Unit Apartments | 0 | 0.0% |
| 5 to 9 Unit Apartments | 0 | 0.0% |
| 10 or more Apartments | 0 | 0.0% |
| Mobile Home / Other | 19 | 6.1% |
| Total | 310 | 100.0% |
Housing Structures by Occupancy in Richfield
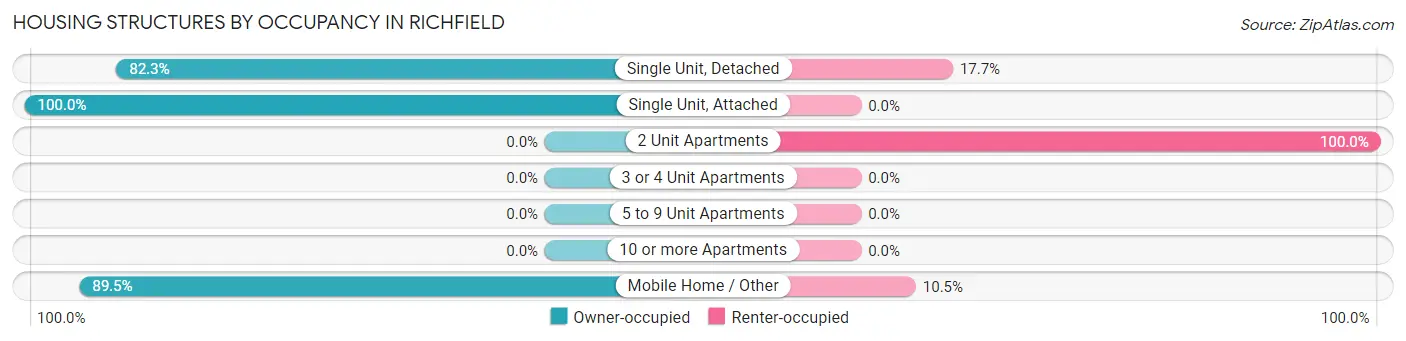
| Structure Type | Owner-occupied | Renter-occupied |
| Single Unit, Detached | 233 (82.3%) | 50 (17.7%) |
| Single Unit, Attached | 2 (100.0%) | 0 (0.0%) |
| 2 Unit Apartments | 0 (0.0%) | 6 (100.0%) |
| 3 or 4 Unit Apartments | 0 (0.0%) | 0 (0.0%) |
| 5 to 9 Unit Apartments | 0 (0.0%) | 0 (0.0%) |
| 10 or more Apartments | 0 (0.0%) | 0 (0.0%) |
| Mobile Home / Other | 17 (89.5%) | 2 (10.5%) |
| Total | 252 (81.3%) | 58 (18.7%) |
Housing Structures by Number of Rooms in Richfield
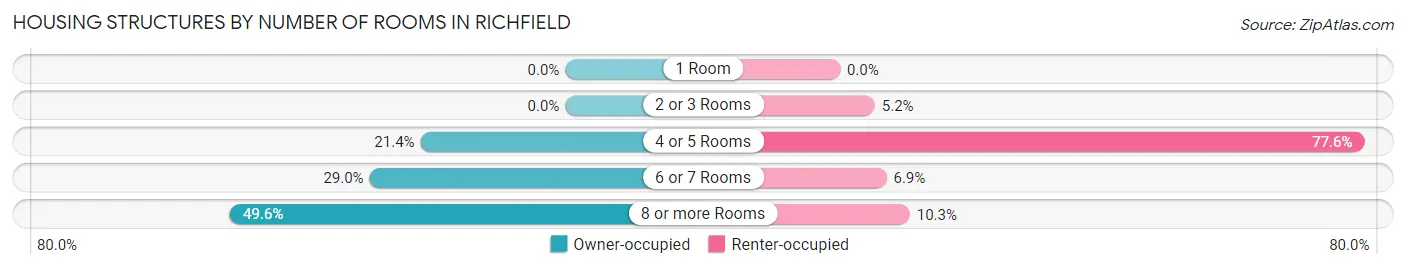
| Number of Rooms | Owner-occupied | Renter-occupied |
| 1 Room | 0 (0.0%) | 0 (0.0%) |
| 2 or 3 Rooms | 0 (0.0%) | 3 (5.2%) |
| 4 or 5 Rooms | 54 (21.4%) | 45 (77.6%) |
| 6 or 7 Rooms | 73 (29.0%) | 4 (6.9%) |
| 8 or more Rooms | 125 (49.6%) | 6 (10.3%) |
| Total | 252 (100.0%) | 58 (100.0%) |
Housing Structure by Heating Type in Richfield
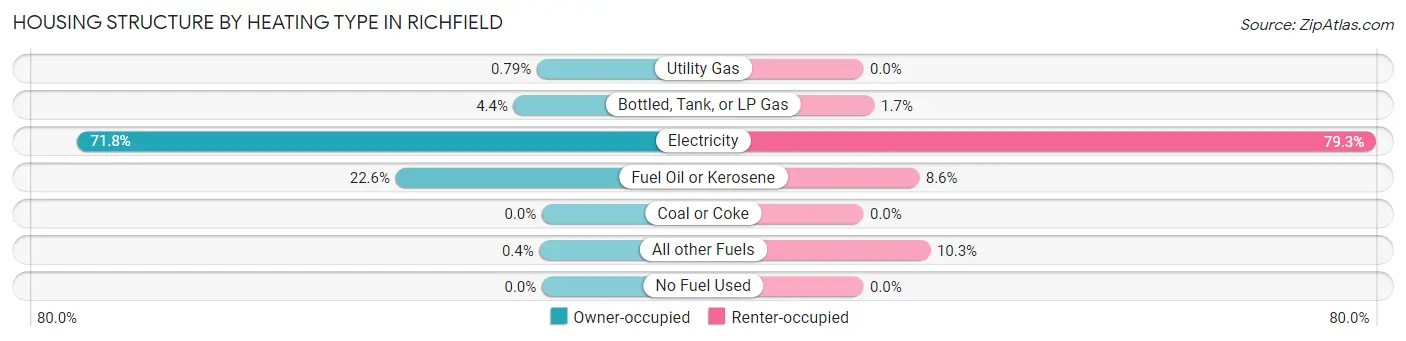
| Heating Type | Owner-occupied | Renter-occupied |
| Utility Gas | 2 (0.8%) | 0 (0.0%) |
| Bottled, Tank, or LP Gas | 11 (4.4%) | 1 (1.7%) |
| Electricity | 181 (71.8%) | 46 (79.3%) |
| Fuel Oil or Kerosene | 57 (22.6%) | 5 (8.6%) |
| Coal or Coke | 0 (0.0%) | 0 (0.0%) |
| All other Fuels | 1 (0.4%) | 6 (10.3%) |
| No Fuel Used | 0 (0.0%) | 0 (0.0%) |
| Total | 252 (100.0%) | 58 (100.0%) |
Household Vehicle Usage in Richfield
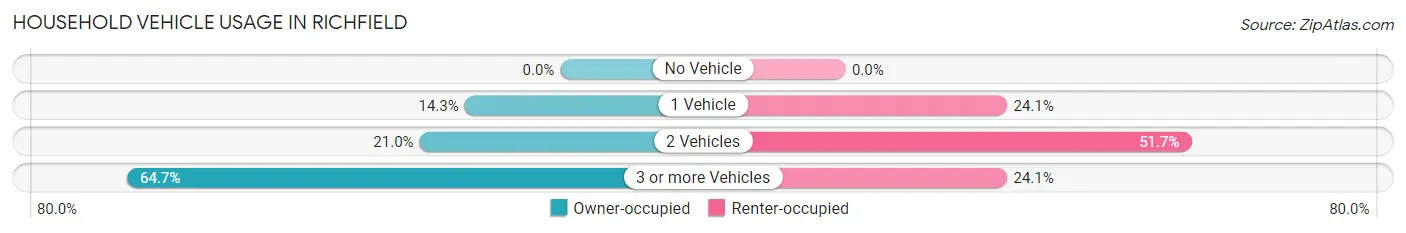
| Vehicles per Household | Owner-occupied | Renter-occupied |
| No Vehicle | 0 (0.0%) | 0 (0.0%) |
| 1 Vehicle | 36 (14.3%) | 14 (24.1%) |
| 2 Vehicles | 53 (21.0%) | 30 (51.7%) |
| 3 or more Vehicles | 163 (64.7%) | 14 (24.1%) |
| Total | 252 (100.0%) | 58 (100.0%) |
Real Estate & Mortgages in Richfield
Real Estate and Mortgage Overview in Richfield
| Characteristic | Without Mortgage | With Mortgage |
| Housing Units | 82 | 170 |
| Median Property Value | $241,700 | $258,300 |
| Median Household Income | $53,750 | $22 |
| Monthly Housing Costs | $520 | $0 |
| Real Estate Taxes | $1,339 | $4 |
Property Value by Mortgage Status in Richfield
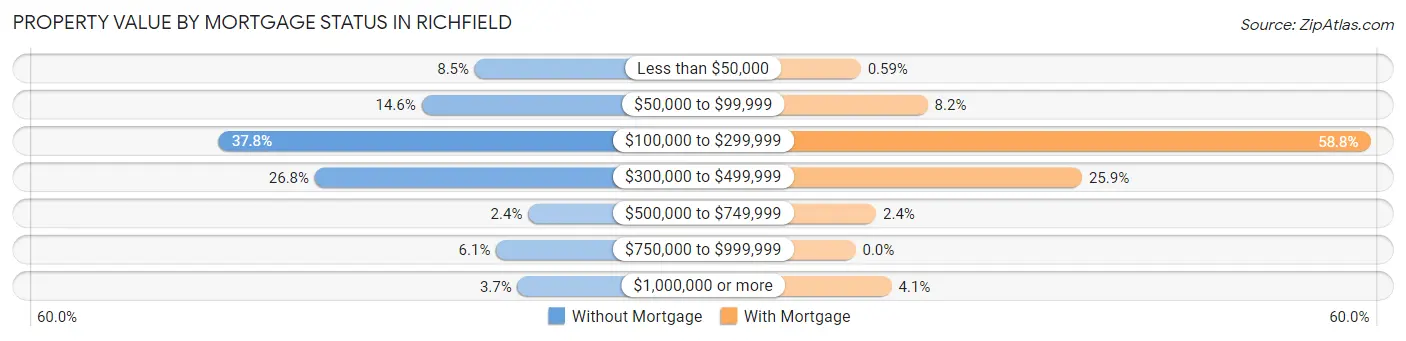
| Property Value | Without Mortgage | With Mortgage |
| Less than $50,000 | 7 (8.5%) | 1 (0.6%) |
| $50,000 to $99,999 | 12 (14.6%) | 14 (8.2%) |
| $100,000 to $299,999 | 31 (37.8%) | 100 (58.8%) |
| $300,000 to $499,999 | 22 (26.8%) | 44 (25.9%) |
| $500,000 to $749,999 | 2 (2.4%) | 4 (2.4%) |
| $750,000 to $999,999 | 5 (6.1%) | 0 (0.0%) |
| $1,000,000 or more | 3 (3.7%) | 7 (4.1%) |
| Total | 82 (100.0%) | 170 (100.0%) |
Household Income by Mortgage Status in Richfield
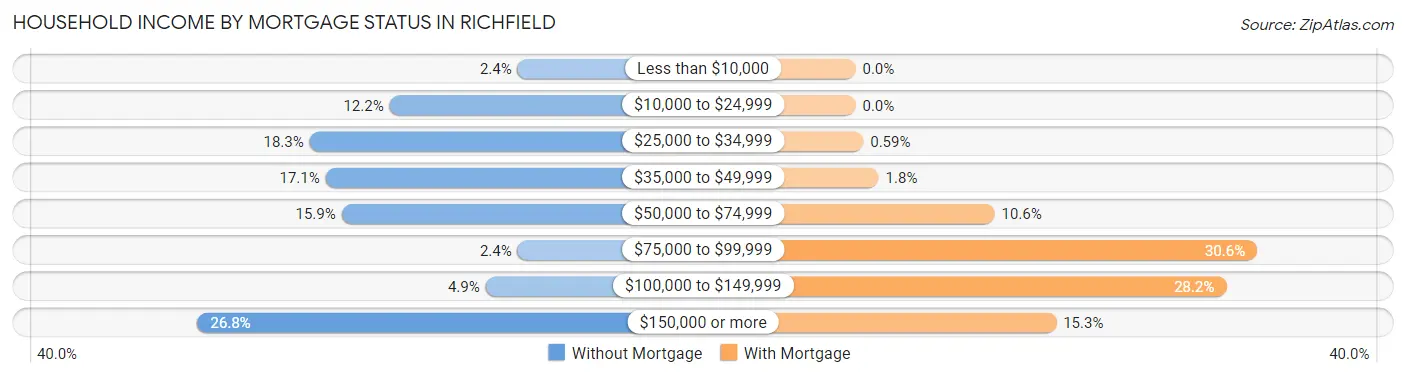
| Household Income | Without Mortgage | With Mortgage |
| Less than $10,000 | 2 (2.4%) | 0 (0.0%) |
| $10,000 to $24,999 | 10 (12.2%) | 0 (0.0%) |
| $25,000 to $34,999 | 15 (18.3%) | 1 (0.6%) |
| $35,000 to $49,999 | 14 (17.1%) | 3 (1.8%) |
| $50,000 to $74,999 | 13 (15.9%) | 18 (10.6%) |
| $75,000 to $99,999 | 2 (2.4%) | 52 (30.6%) |
| $100,000 to $149,999 | 4 (4.9%) | 48 (28.2%) |
| $150,000 or more | 22 (26.8%) | 26 (15.3%) |
| Total | 82 (100.0%) | 170 (100.0%) |
Property Value to Household Income Ratio in Richfield
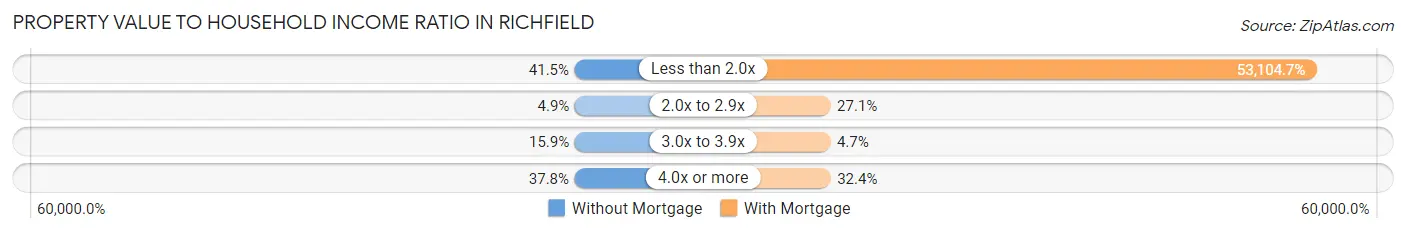
| Value-to-Income Ratio | Without Mortgage | With Mortgage |
| Less than 2.0x | 34 (41.5%) | 90,278 (53,104.7%) |
| 2.0x to 2.9x | 4 (4.9%) | 46 (27.1%) |
| 3.0x to 3.9x | 13 (15.9%) | 8 (4.7%) |
| 4.0x or more | 31 (37.8%) | 55 (32.4%) |
| Total | 82 (100.0%) | 170 (100.0%) |
Real Estate Taxes by Mortgage Status in Richfield
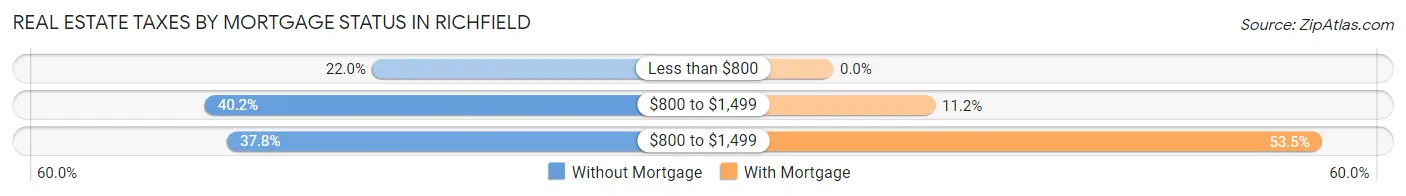
| Property Taxes | Without Mortgage | With Mortgage |
| Less than $800 | 18 (22.0%) | 0 (0.0%) |
| $800 to $1,499 | 33 (40.2%) | 19 (11.2%) |
| $800 to $1,499 | 31 (37.8%) | 91 (53.5%) |
| Total | 82 (100.0%) | 170 (100.0%) |
Health & Disability in Richfield
Health Insurance Coverage by Age in Richfield
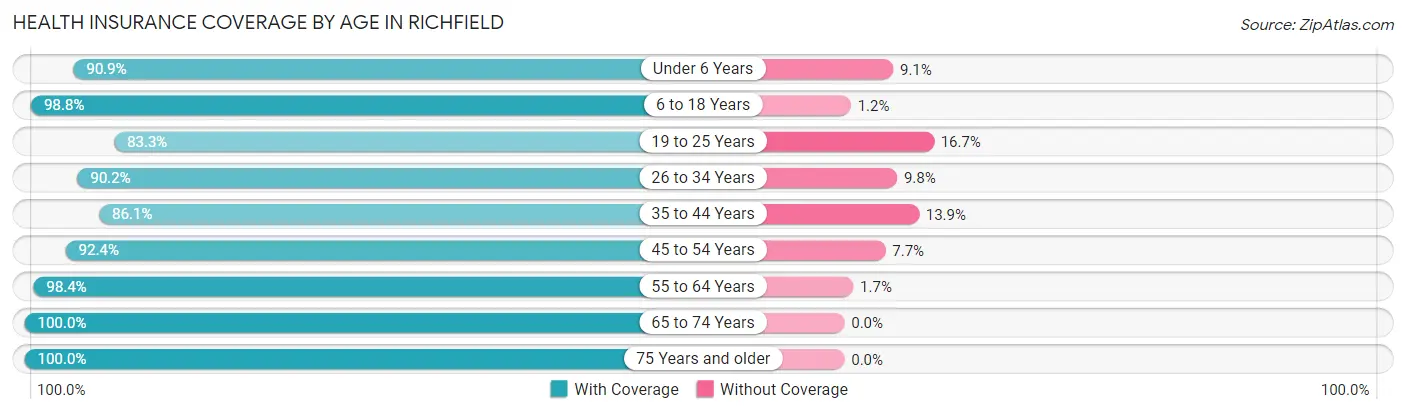
| Age Bracket | With Coverage | Without Coverage |
| Under 6 Years | 60 (90.9%) | 6 (9.1%) |
| 6 to 18 Years | 82 (98.8%) | 1 (1.2%) |
| 19 to 25 Years | 105 (83.3%) | 21 (16.7%) |
| 26 to 34 Years | 156 (90.2%) | 17 (9.8%) |
| 35 to 44 Years | 31 (86.1%) | 5 (13.9%) |
| 45 to 54 Years | 169 (92.3%) | 14 (7.6%) |
| 55 to 64 Years | 119 (98.4%) | 2 (1.7%) |
| 65 to 74 Years | 104 (100.0%) | 0 (0.0%) |
| 75 Years and older | 27 (100.0%) | 0 (0.0%) |
| Total | 853 (92.8%) | 66 (7.2%) |
Health Insurance Coverage by Citizenship Status in Richfield
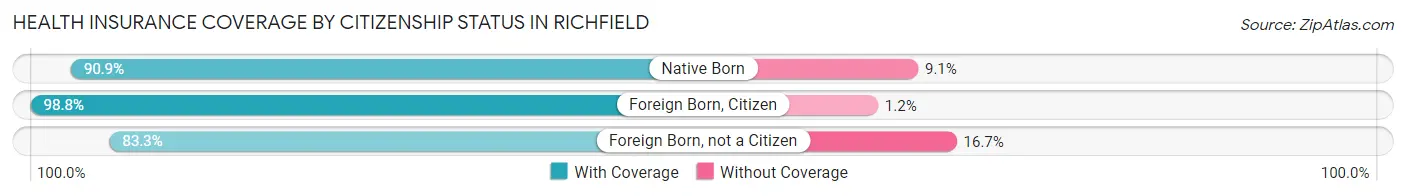
| Citizenship Status | With Coverage | Without Coverage |
| Native Born | 60 (90.9%) | 6 (9.1%) |
| Foreign Born, Citizen | 82 (98.8%) | 1 (1.2%) |
| Foreign Born, not a Citizen | 105 (83.3%) | 21 (16.7%) |
Health Insurance Coverage by Household Income in Richfield
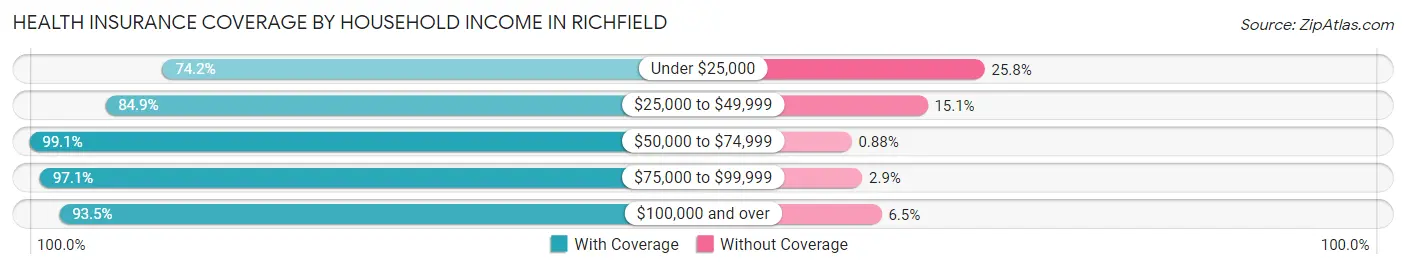
| Household Income | With Coverage | Without Coverage |
| Under $25,000 | 23 (74.2%) | 8 (25.8%) |
| $25,000 to $49,999 | 191 (84.9%) | 34 (15.1%) |
| $50,000 to $74,999 | 225 (99.1%) | 2 (0.9%) |
| $75,000 to $99,999 | 169 (97.1%) | 5 (2.9%) |
| $100,000 and over | 245 (93.5%) | 17 (6.5%) |
Public vs Private Health Insurance Coverage by Age in Richfield
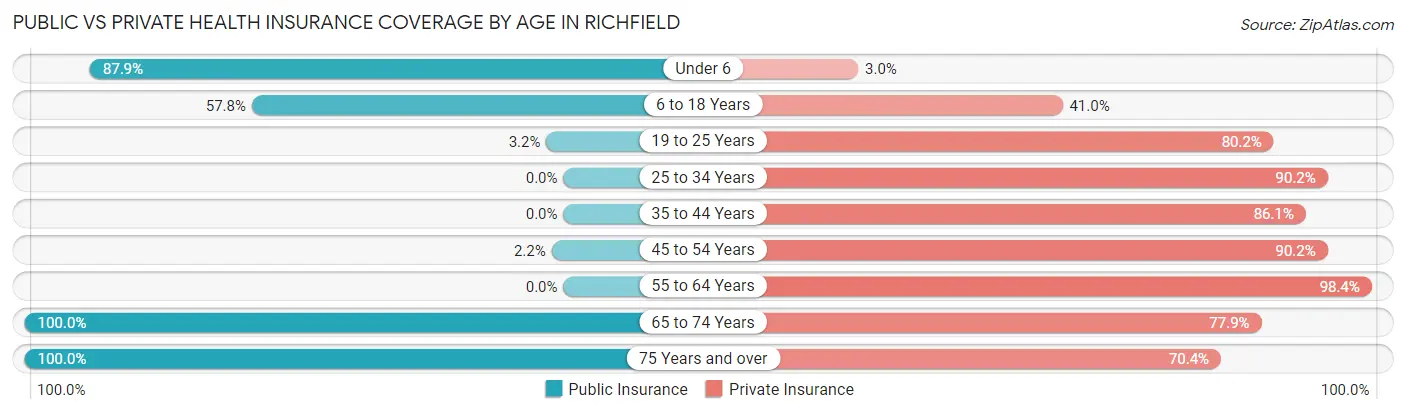
| Age Bracket | Public Insurance | Private Insurance |
| Under 6 | 58 (87.9%) | 2 (3.0%) |
| 6 to 18 Years | 48 (57.8%) | 34 (41.0%) |
| 19 to 25 Years | 4 (3.2%) | 101 (80.2%) |
| 25 to 34 Years | 0 (0.0%) | 156 (90.2%) |
| 35 to 44 Years | 0 (0.0%) | 31 (86.1%) |
| 45 to 54 Years | 4 (2.2%) | 165 (90.2%) |
| 55 to 64 Years | 0 (0.0%) | 119 (98.4%) |
| 65 to 74 Years | 104 (100.0%) | 81 (77.9%) |
| 75 Years and over | 27 (100.0%) | 19 (70.4%) |
| Total | 245 (26.7%) | 708 (77.0%) |
Disability Status by Sex by Age in Richfield
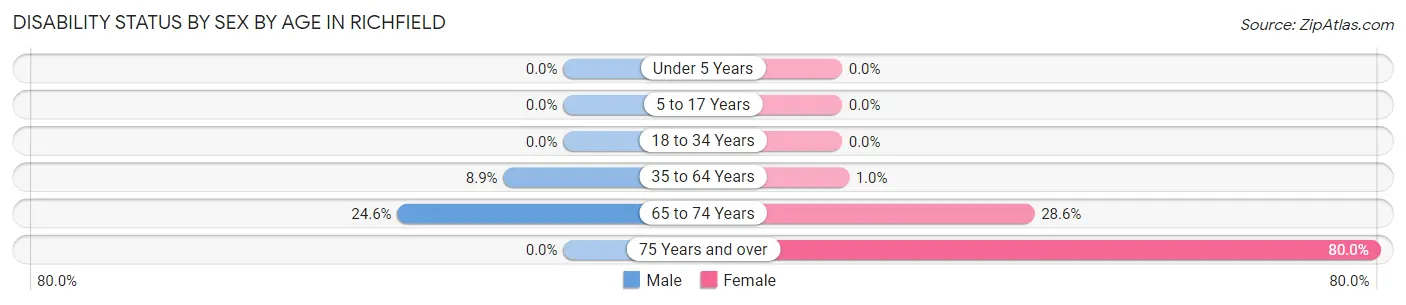
| Age Bracket | Male | Female |
| Under 5 Years | 0 (0.0%) | 0 (0.0%) |
| 5 to 17 Years | 0 (0.0%) | 0 (0.0%) |
| 18 to 34 Years | 0 (0.0%) | 0 (0.0%) |
| 35 to 64 Years | 13 (8.9%) | 2 (1.0%) |
| 65 to 74 Years | 17 (24.6%) | 10 (28.6%) |
| 75 Years and over | 0 (0.0%) | 16 (80.0%) |
Disability Class by Sex by Age in Richfield
Disability Class: Hearing Difficulty
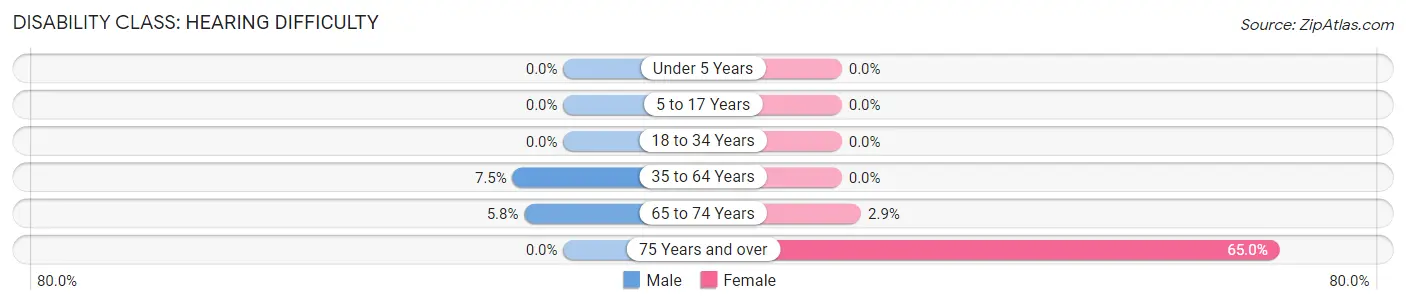
| Age Bracket | Male | Female |
| Under 5 Years | 0 (0.0%) | 0 (0.0%) |
| 5 to 17 Years | 0 (0.0%) | 0 (0.0%) |
| 18 to 34 Years | 0 (0.0%) | 0 (0.0%) |
| 35 to 64 Years | 11 (7.5%) | 0 (0.0%) |
| 65 to 74 Years | 4 (5.8%) | 1 (2.9%) |
| 75 Years and over | 0 (0.0%) | 13 (65.0%) |
Disability Class: Vision Difficulty
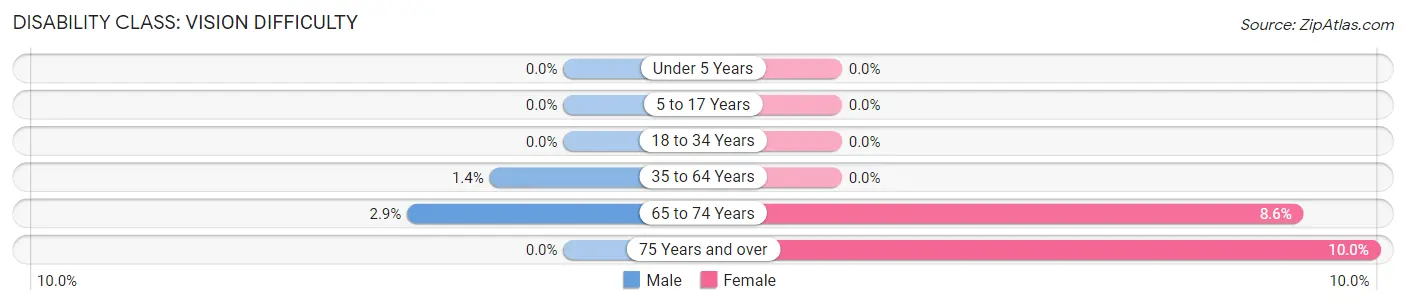
| Age Bracket | Male | Female |
| Under 5 Years | 0 (0.0%) | 0 (0.0%) |
| 5 to 17 Years | 0 (0.0%) | 0 (0.0%) |
| 18 to 34 Years | 0 (0.0%) | 0 (0.0%) |
| 35 to 64 Years | 2 (1.4%) | 0 (0.0%) |
| 65 to 74 Years | 2 (2.9%) | 3 (8.6%) |
| 75 Years and over | 0 (0.0%) | 2 (10.0%) |
Disability Class: Cognitive Difficulty
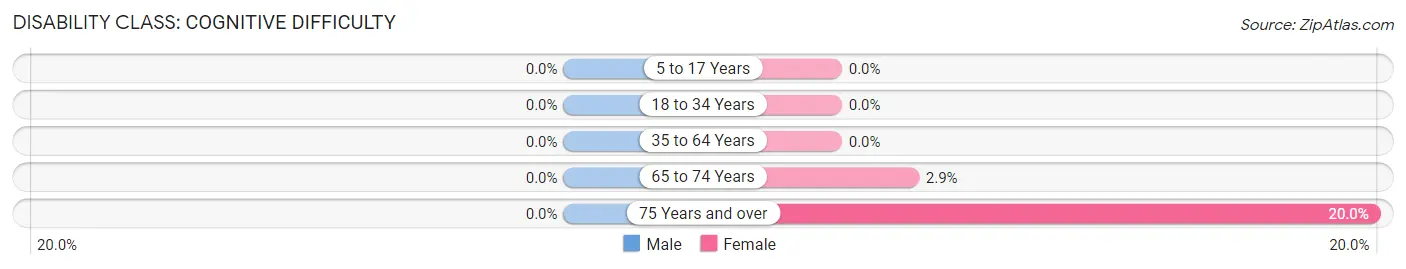
| Age Bracket | Male | Female |
| 5 to 17 Years | 0 (0.0%) | 0 (0.0%) |
| 18 to 34 Years | 0 (0.0%) | 0 (0.0%) |
| 35 to 64 Years | 0 (0.0%) | 0 (0.0%) |
| 65 to 74 Years | 0 (0.0%) | 1 (2.9%) |
| 75 Years and over | 0 (0.0%) | 4 (20.0%) |
Disability Class: Ambulatory Difficulty
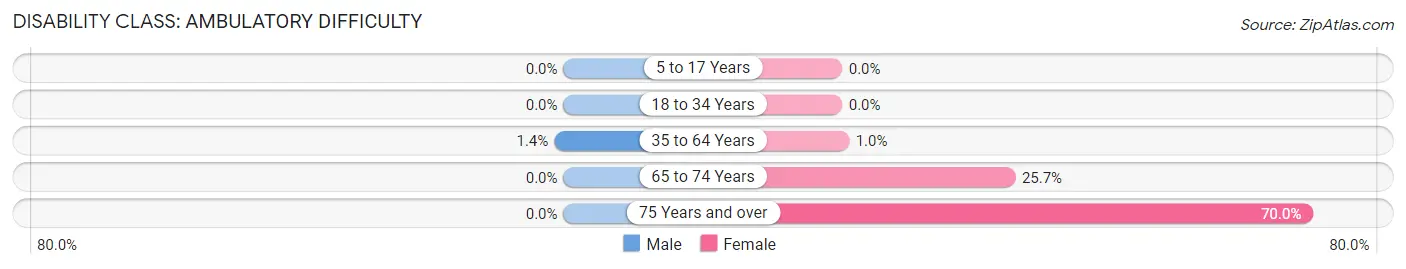
| Age Bracket | Male | Female |
| 5 to 17 Years | 0 (0.0%) | 0 (0.0%) |
| 18 to 34 Years | 0 (0.0%) | 0 (0.0%) |
| 35 to 64 Years | 2 (1.4%) | 2 (1.0%) |
| 65 to 74 Years | 0 (0.0%) | 9 (25.7%) |
| 75 Years and over | 0 (0.0%) | 14 (70.0%) |
Disability Class: Self-Care Difficulty
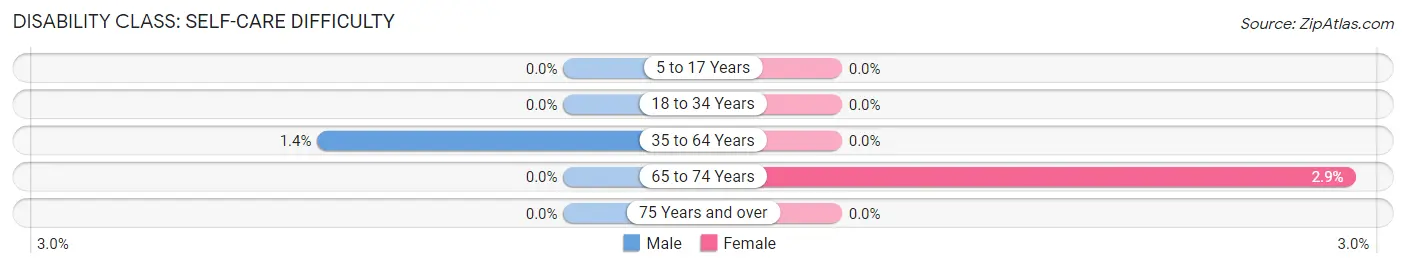
| Age Bracket | Male | Female |
| 5 to 17 Years | 0 (0.0%) | 0 (0.0%) |
| 18 to 34 Years | 0 (0.0%) | 0 (0.0%) |
| 35 to 64 Years | 2 (1.4%) | 0 (0.0%) |
| 65 to 74 Years | 0 (0.0%) | 1 (2.9%) |
| 75 Years and over | 0 (0.0%) | 0 (0.0%) |
Technology Access in Richfield
Computing Device Access in Richfield
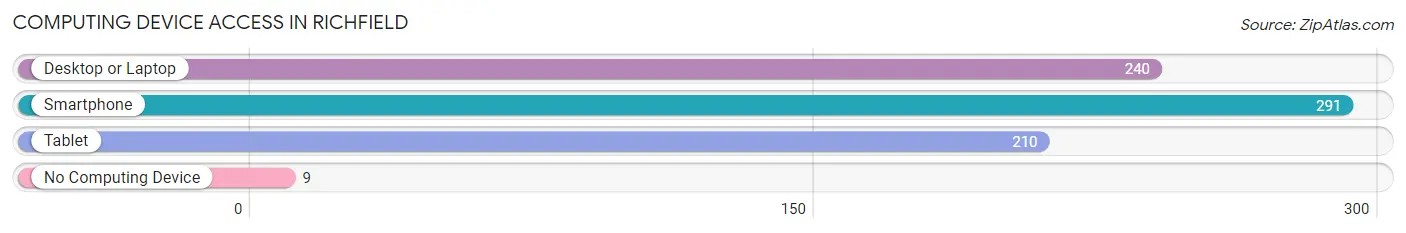
| Device Type | # Households | % Households |
| Desktop or Laptop | 240 | 77.4% |
| Smartphone | 291 | 93.9% |
| Tablet | 210 | 67.7% |
| No Computing Device | 9 | 2.9% |
| Total | 310 | 100.0% |
Internet Access in Richfield
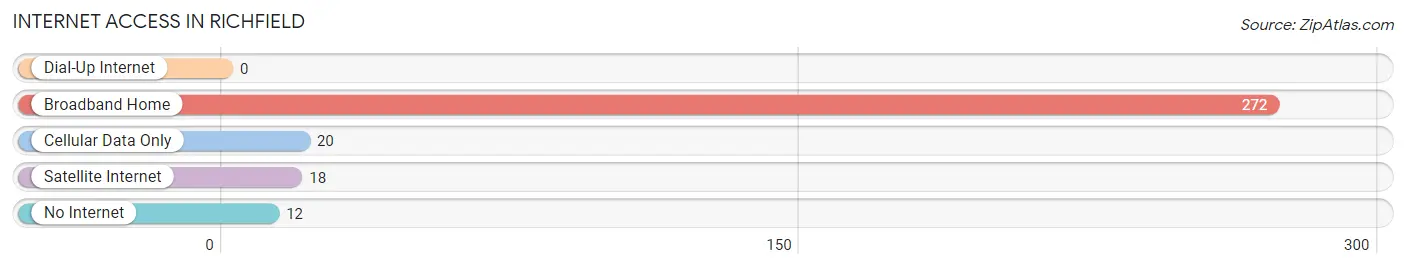
| Internet Type | # Households | % Households |
| Dial-Up Internet | 0 | 0.0% |
| Broadband Home | 272 | 87.7% |
| Cellular Data Only | 20 | 6.5% |
| Satellite Internet | 18 | 5.8% |
| No Internet | 12 | 3.9% |
| Total | 310 | 100.0% |
Richfield Summary
Richfield is a small town located in Stanly County, North Carolina. It is situated in the Piedmont region of the state, approximately 40 miles east of Charlotte. The town has a population of approximately 1,500 people and is part of the Charlotte-Gastonia-Concord Metropolitan Statistical Area.
History
Richfield was founded in 1887 by a group of settlers from the nearby town of Albemarle. The town was named after the rich soil in the area, which was ideal for farming. The town quickly grew and by the early 1900s, it had become a thriving agricultural center. The town was home to several cotton mills, a cannery, and a furniture factory.
In the 1950s, Richfield began to experience a decline in its economy. The cotton mills and other industries began to close, leaving many of the town’s residents without jobs. In the 1970s, the town began to experience a resurgence as new businesses began to move into the area. Today, Richfield is a small but vibrant community with a diverse economy.
Geography
Richfield is located in the Piedmont region of North Carolina. The town is situated in the Yadkin-Pee Dee River Basin, which is part of the larger Catawba River Basin. The town is located approximately 40 miles east of Charlotte and is bordered by the towns of Albemarle, Oakboro, and Norwood.
The town is situated on a plateau, with an elevation of approximately 800 feet. The terrain is mostly flat, with some rolling hills. The town is located in a humid subtropical climate zone, with hot, humid summers and mild winters.
Economy
Richfield’s economy is largely based on agriculture and manufacturing. The town is home to several farms, which produce a variety of crops, including corn, soybeans, and tobacco. The town is also home to several manufacturing companies, which produce a variety of products, including furniture, textiles, and automotive parts.
In addition to agriculture and manufacturing, Richfield is home to several small businesses, including restaurants, retail stores, and service providers. The town is also home to several educational institutions, including Stanly Community College and the University of North Carolina at Charlotte.
Demographics
As of the 2010 census, Richfield had a population of 1,500 people. The town is predominantly white, with approximately 85% of the population identifying as white. The remaining 15% of the population is made up of African Americans, Hispanics, and other ethnicities.
The median household income in Richfield is approximately $35,000, which is slightly lower than the national average. The town has a poverty rate of approximately 15%, which is slightly higher than the national average. The town’s unemployment rate is also slightly higher than the national average.
Conclusion
Richfield is a small town located in Stanly County, North Carolina. The town has a population of approximately 1,500 people and is part of the Charlotte-Gastonia-Concord Metropolitan Statistical Area. The town’s economy is largely based on agriculture and manufacturing, and it is home to several small businesses, educational institutions, and service providers. The town is predominantly white, with a median household income of approximately $35,000 and a poverty rate of approximately 15%.
Common Questions
What is Per Capita Income in Richfield?
Per Capita income in Richfield is $30,973.
What is the Median Family Income in Richfield?
Median Family Income in Richfield is $74,913.
What is the Median Household income in Richfield?
Median Household Income in Richfield is $74,651.
What is Income or Wage Gap in Richfield?
Income or Wage Gap in Richfield is 2.0%.
Women in Richfield earn 98.0 cents for every dollar earned by a man.
What is Inequality or Gini Index in Richfield?
Inequality or Gini Index in Richfield is 0.32.
What is the Total Population of Richfield?
Total Population of Richfield is 921.
What is the Total Male Population of Richfield?
Total Male Population of Richfield is 481.
What is the Total Female Population of Richfield?
Total Female Population of Richfield is 440.
What is the Ratio of Males per 100 Females in Richfield?
There are 109.32 Males per 100 Females in Richfield.
What is the Ratio of Females per 100 Males in Richfield?
There are 91.48 Females per 100 Males in Richfield.
What is the Median Population Age in Richfield?
Median Population Age in Richfield is 40.1 Years.
What is the Average Family Size in Richfield
Average Family Size in Richfield is 3.4 People.
What is the Average Household Size in Richfield
Average Household Size in Richfield is 3.0 People.
How Large is the Labor Force in Richfield?
There are 515 People in the Labor Forcein in Richfield.
What is the Percentage of People in the Labor Force in Richfield?
66.5% of People are in the Labor Force in Richfield.
What is the Unemployment Rate in Richfield?
Unemployment Rate in Richfield is 1.8%.