Polkville, NC Map & Demographics
Polkville Map
Polkville Overview
$25,488
PER CAPITA INCOME
$62,917
AVG FAMILY INCOME
$53,194
AVG HOUSEHOLD INCOME
10.4%
WAGE / INCOME GAP [ % ]
89.6¢/ $1
WAGE / INCOME GAP [ $ ]
0.37
INEQUALITY / GINI INDEX
500
TOTAL POPULATION
238
MALE POPULATION
262
FEMALE POPULATION
90.84
MALES / 100 FEMALES
110.08
FEMALES / 100 MALES
47.4
MEDIAN AGE
3.3
AVG FAMILY SIZE
2.6
AVG HOUSEHOLD SIZE
249
LABOR FORCE [ PEOPLE ]
59.7%
PERCENT IN LABOR FORCE
4.8%
UNEMPLOYMENT RATE
Polkville Zip Codes
Polkville Area Codes
Income in Polkville
Income Overview in Polkville
Per Capita Income in Polkville is $25,488, while median incomes of families and households are $62,917 and $53,194 respectively.
| Characteristic | Number | Measure |
| Per Capita Income | 500 | $25,488 |
| Median Family Income | 128 | $62,917 |
| Mean Family Income | 128 | $68,901 |
| Median Household Income | 191 | $53,194 |
| Mean Household Income | 191 | $61,837 |
| Income Deficit | 128 | $0 |
| Wage / Income Gap (%) | 500 | 10.35% |
| Wage / Income Gap ($) | 500 | 89.65¢ per $1 |
| Gini / Inequality Index | 500 | 0.37 |
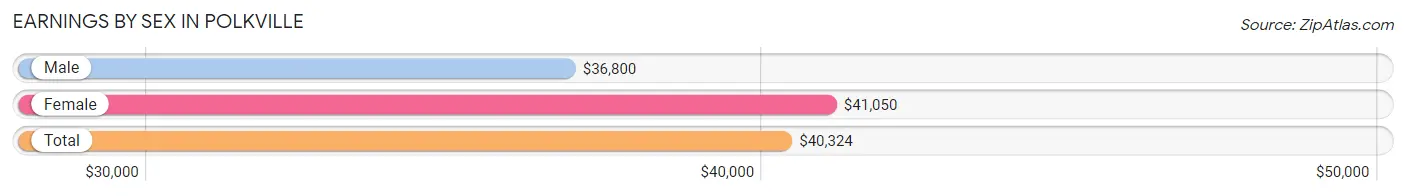
Earnings by Sex in Polkville
Average Earnings in Polkville are $40,324, $36,800 for men and $41,050 for women, a difference of 10.3%.
| Sex | Number | Average Earnings |
| Male | 126 (51.4%) | $36,800 |
| Female | 119 (48.6%) | $41,050 |
| Total | 245 (100.0%) | $40,324 |
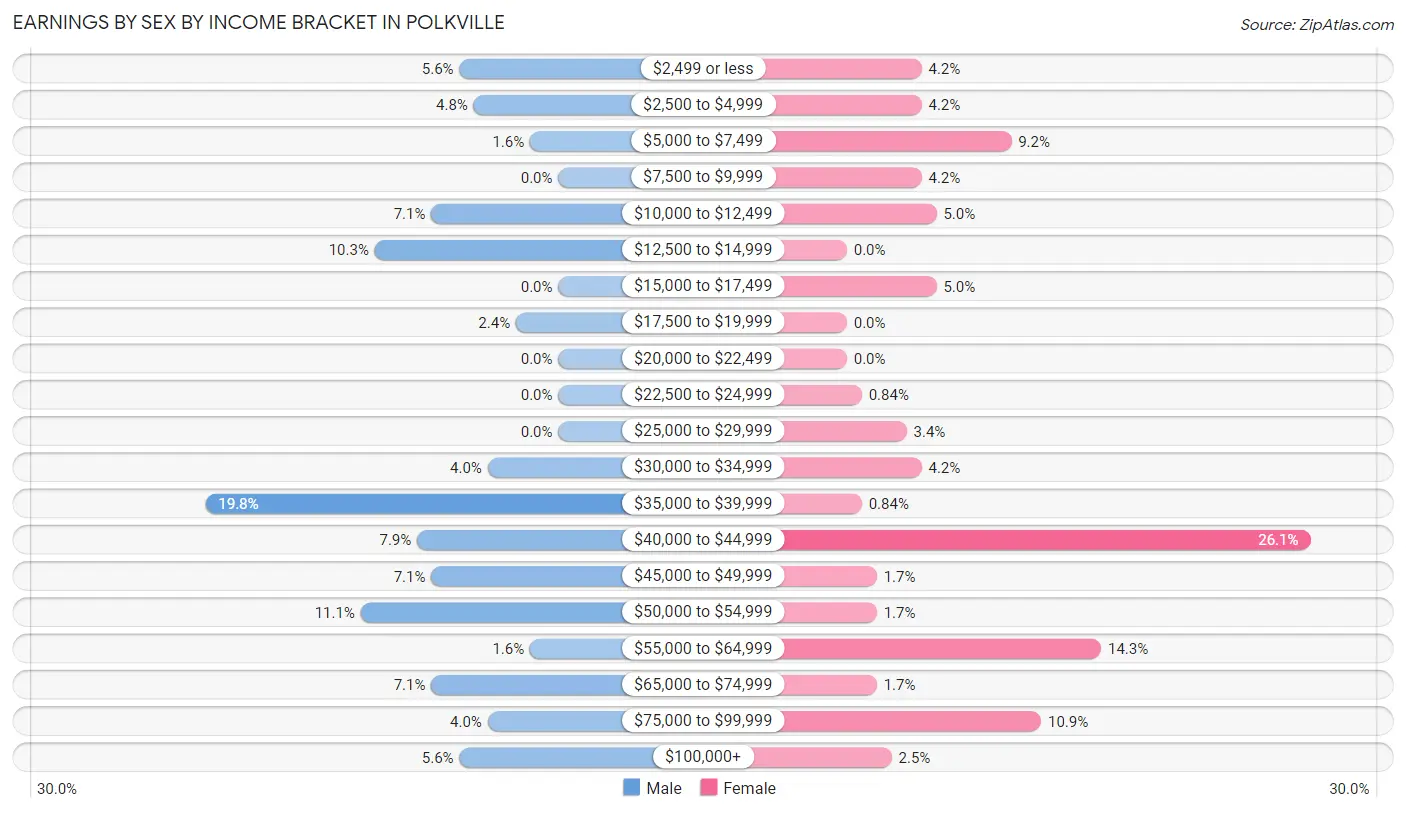
Earnings by Sex by Income Bracket in Polkville
The most common earnings brackets in Polkville are $35,000 to $39,999 for men (25 | 19.8%) and $40,000 to $44,999 for women (31 | 26.1%).
| Income | Male | Female |
| $2,499 or less | 7 (5.6%) | 5 (4.2%) |
| $2,500 to $4,999 | 6 (4.8%) | 5 (4.2%) |
| $5,000 to $7,499 | 2 (1.6%) | 11 (9.2%) |
| $7,500 to $9,999 | 0 (0.0%) | 5 (4.2%) |
| $10,000 to $12,499 | 9 (7.1%) | 6 (5.0%) |
| $12,500 to $14,999 | 13 (10.3%) | 0 (0.0%) |
| $15,000 to $17,499 | 0 (0.0%) | 6 (5.0%) |
| $17,500 to $19,999 | 3 (2.4%) | 0 (0.0%) |
| $20,000 to $22,499 | 0 (0.0%) | 0 (0.0%) |
| $22,500 to $24,999 | 0 (0.0%) | 1 (0.8%) |
| $25,000 to $29,999 | 0 (0.0%) | 4 (3.4%) |
| $30,000 to $34,999 | 5 (4.0%) | 5 (4.2%) |
| $35,000 to $39,999 | 25 (19.8%) | 1 (0.8%) |
| $40,000 to $44,999 | 10 (7.9%) | 31 (26.1%) |
| $45,000 to $49,999 | 9 (7.1%) | 2 (1.7%) |
| $50,000 to $54,999 | 14 (11.1%) | 2 (1.7%) |
| $55,000 to $64,999 | 2 (1.6%) | 17 (14.3%) |
| $65,000 to $74,999 | 9 (7.1%) | 2 (1.7%) |
| $75,000 to $99,999 | 5 (4.0%) | 13 (10.9%) |
| $100,000+ | 7 (5.6%) | 3 (2.5%) |
| Total | 126 (100.0%) | 119 (100.0%) |
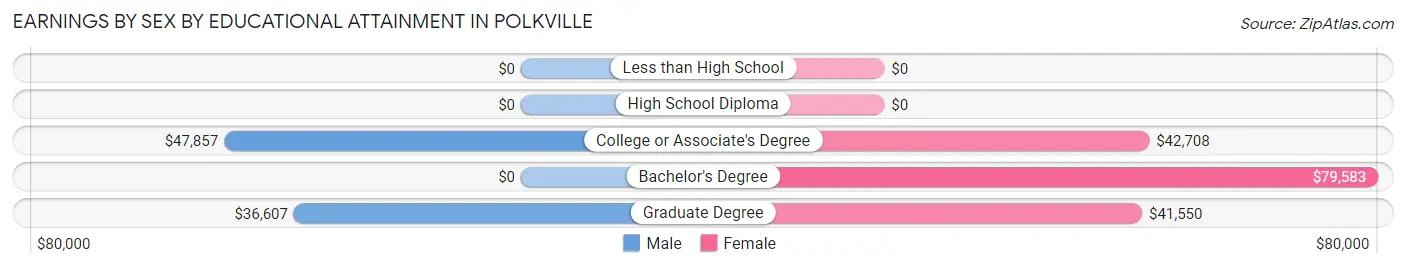
Earnings by Sex by Educational Attainment in Polkville
Average earnings in Polkville are $37,250 for men and $41,600 for women, a difference of 10.5%. Men with an educational attainment of college or associate's degree enjoy the highest average annual earnings of $47,857, while those with graduate degree education earn the least with $36,607. Women with an educational attainment of bachelor's degree earn the most with the average annual earnings of $79,583, while those with graduate degree education have the smallest earnings of $41,550.
| Educational Attainment | Male Income | Female Income |
| Less than High School | - | - |
| High School Diploma | - | - |
| College or Associate's Degree | $47,857 | $42,708 |
| Bachelor's Degree | - | - |
| Graduate Degree | $36,607 | $41,550 |
| Total | $37,250 | $41,600 |
Family Income in Polkville
Family Income Brackets in Polkville
According to the Polkville family income data, there are 27 families falling into the $50,000 to $74,999 income range, which is the most common income bracket and makes up 21.1% of all families. Conversely, the $10,000 to $14,999 income bracket is the least frequent group with only 2 families (1.6%) belonging to this category.
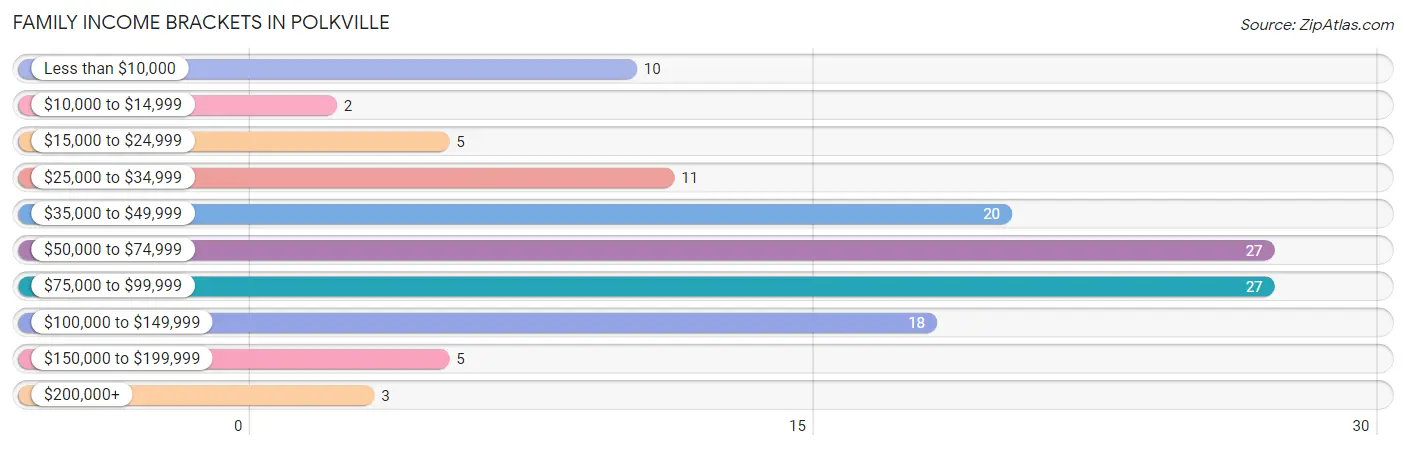
| Income Bracket | # Families | % Families |
| Less than $10,000 | 10 | 7.8% |
| $10,000 to $14,999 | 2 | 1.6% |
| $15,000 to $24,999 | 5 | 3.9% |
| $25,000 to $34,999 | 11 | 8.6% |
| $35,000 to $49,999 | 20 | 15.6% |
| $50,000 to $74,999 | 27 | 21.1% |
| $75,000 to $99,999 | 27 | 21.1% |
| $100,000 to $149,999 | 18 | 14.1% |
| $150,000 to $199,999 | 5 | 3.9% |
| $200,000+ | 3 | 2.3% |
Family Income by Famaliy Size in Polkville
3-person families (31 | 24.2%) account for the highest median family income in Polkville with $94,375 per family, while 3-person families (31 | 24.2%) have the highest median income of $31,458 per family member.
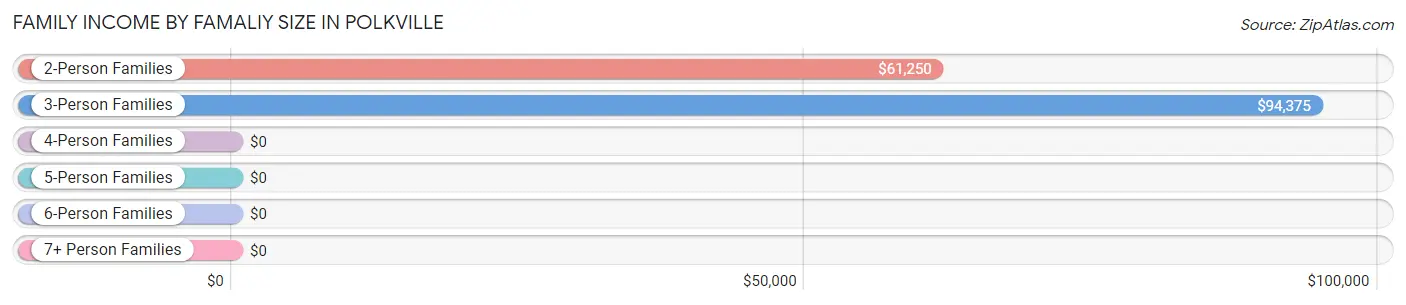
| Income Bracket | # Families | Median Income |
| 2-Person Families | 74 (57.8%) | $61,250 |
| 3-Person Families | 31 (24.2%) | $94,375 |
| 4-Person Families | 12 (9.4%) | $0 |
| 5-Person Families | 11 (8.6%) | $0 |
| 6-Person Families | 0 (0.0%) | $0 |
| 7+ Person Families | 0 (0.0%) | $0 |
| Total | 128 (100.0%) | $62,917 |
Family Income by Number of Earners in Polkville
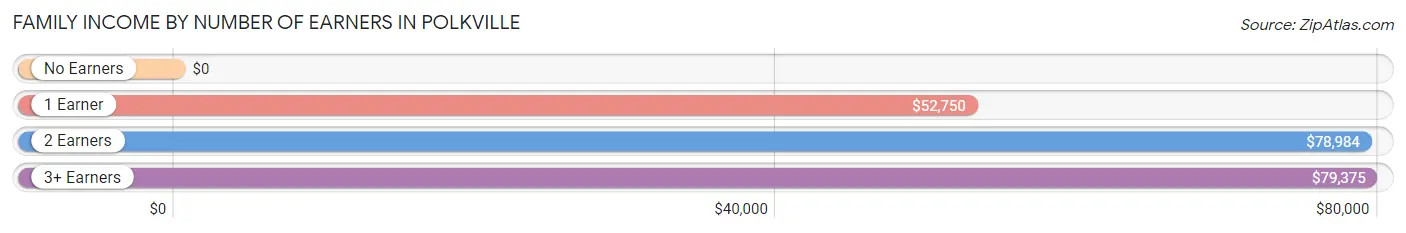
| Number of Earners | # Families | Median Income |
| No Earners | 23 (18.0%) | $0 |
| 1 Earner | 47 (36.7%) | $52,750 |
| 2 Earners | 49 (38.3%) | $78,984 |
| 3+ Earners | 9 (7.0%) | $79,375 |
| Total | 128 (100.0%) | $62,917 |
Household Income in Polkville
Household Income Brackets in Polkville
With 38 households falling in the category, the $75,000 to $99,999 income range is the most frequent in Polkville, accounting for 19.9% of all households. In contrast, only 3 households (1.6%) fall into the $200,000+ income bracket, making it the least populous group.
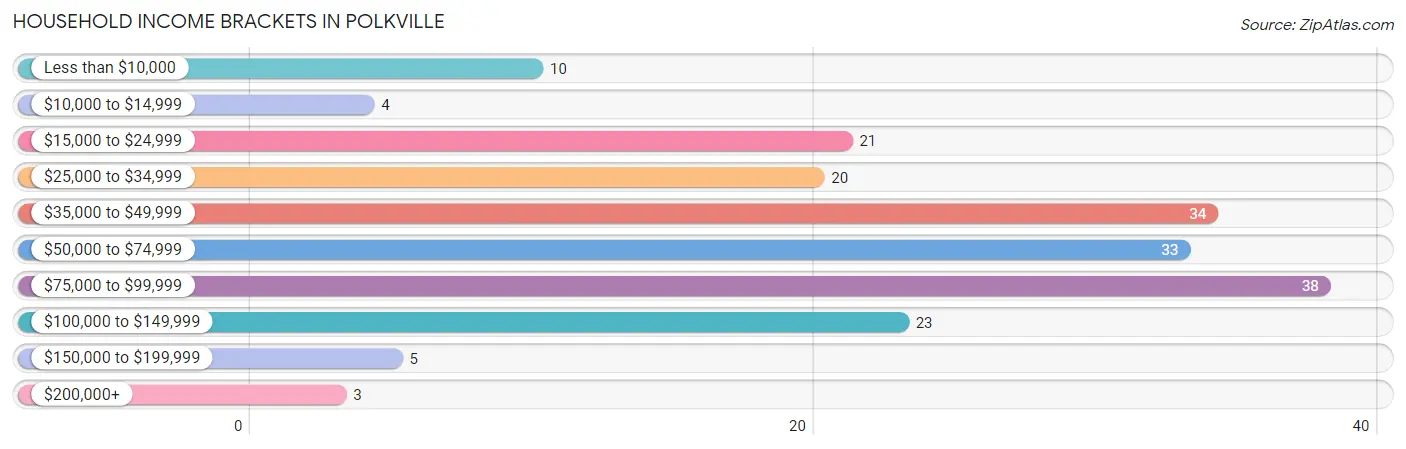
| Income Bracket | # Households | % Households |
| Less than $10,000 | 10 | 5.2% |
| $10,000 to $14,999 | 4 | 2.1% |
| $15,000 to $24,999 | 21 | 11.0% |
| $25,000 to $34,999 | 20 | 10.5% |
| $35,000 to $49,999 | 34 | 17.8% |
| $50,000 to $74,999 | 33 | 17.3% |
| $75,000 to $99,999 | 38 | 19.9% |
| $100,000 to $149,999 | 23 | 12.0% |
| $150,000 to $199,999 | 5 | 2.6% |
| $200,000+ | 3 | 1.6% |
Household Income by Householder Age in Polkville
The median household income in Polkville is $53,194, with the highest median household income of $77,685 found in the 45 to 64 years age bracket for the primary householder. A total of 74 households (38.7%) fall into this category.
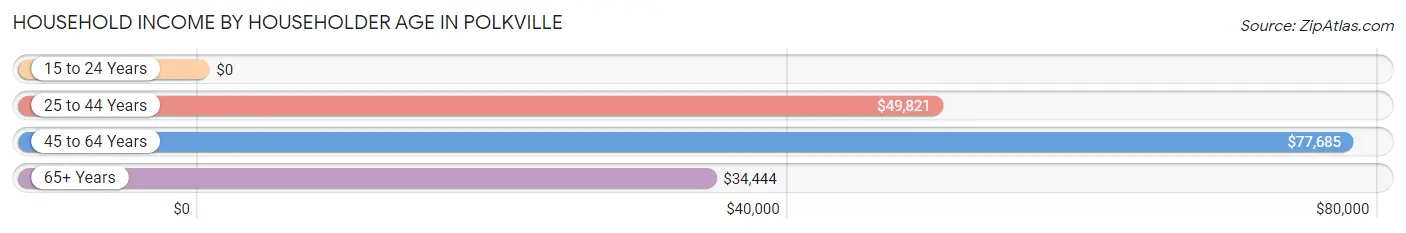
| Income Bracket | # Households | Median Income |
| 15 to 24 Years | 0 (0.0%) | $0 |
| 25 to 44 Years | 53 (27.8%) | $49,821 |
| 45 to 64 Years | 74 (38.7%) | $77,685 |
| 65+ Years | 64 (33.5%) | $34,444 |
| Total | 191 (100.0%) | $53,194 |
Poverty in Polkville
Income Below Poverty by Sex and Age in Polkville
With 16.5% poverty level for males and 12.6% for females among the residents of Polkville, 15 year old males and 6 to 11 year old females are the most vulnerable to poverty, with 6 males (66.7%) and 6 females (66.7%) in their respective age groups living below the poverty level.
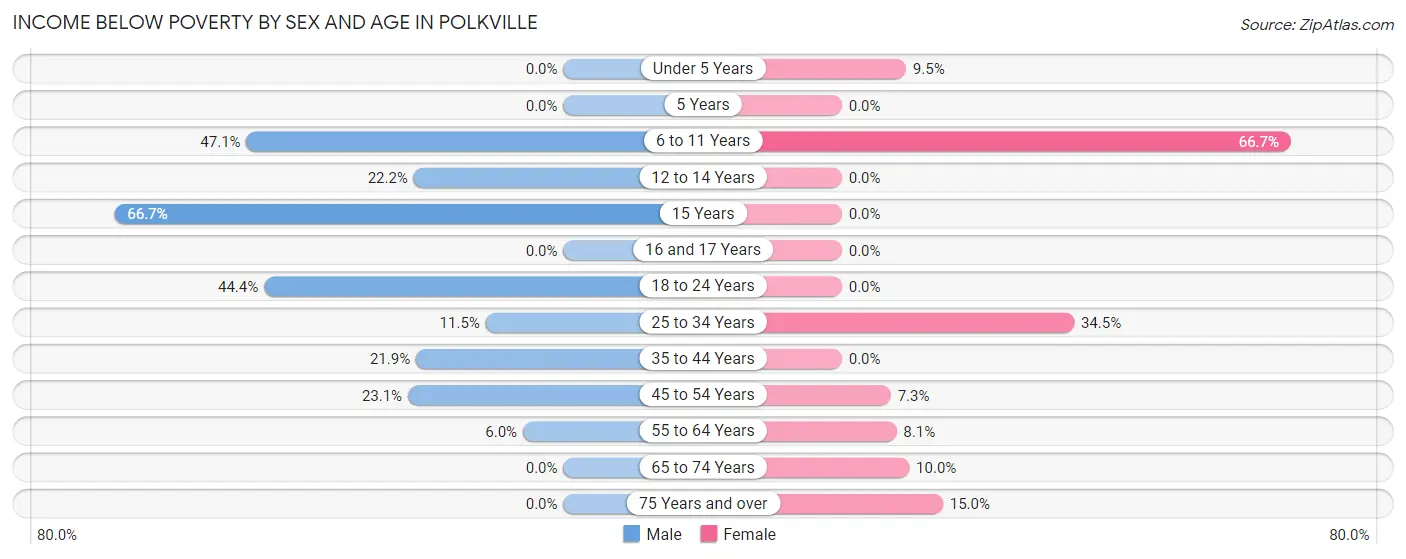
| Age Bracket | Male | Female |
| Under 5 Years | 0 (0.0%) | 2 (9.5%) |
| 5 Years | 0 (0.0%) | 0 (0.0%) |
| 6 to 11 Years | 8 (47.1%) | 6 (66.7%) |
| 12 to 14 Years | 2 (22.2%) | 0 (0.0%) |
| 15 Years | 6 (66.7%) | 0 (0.0%) |
| 16 and 17 Years | 0 (0.0%) | 0 (0.0%) |
| 18 to 24 Years | 4 (44.4%) | 0 (0.0%) |
| 25 to 34 Years | 3 (11.5%) | 10 (34.5%) |
| 35 to 44 Years | 7 (21.9%) | 0 (0.0%) |
| 45 to 54 Years | 6 (23.1%) | 4 (7.3%) |
| 55 to 64 Years | 3 (6.0%) | 3 (8.1%) |
| 65 to 74 Years | 0 (0.0%) | 2 (10.0%) |
| 75 Years and over | 0 (0.0%) | 6 (15.0%) |
| Total | 39 (16.5%) | 33 (12.6%) |
Income Above Poverty by Sex and Age in Polkville
According to the poverty statistics in Polkville, males aged under 5 years and females aged 5 years are the age groups that are most secure financially, with 100.0% of males and 100.0% of females in these age groups living above the poverty line.
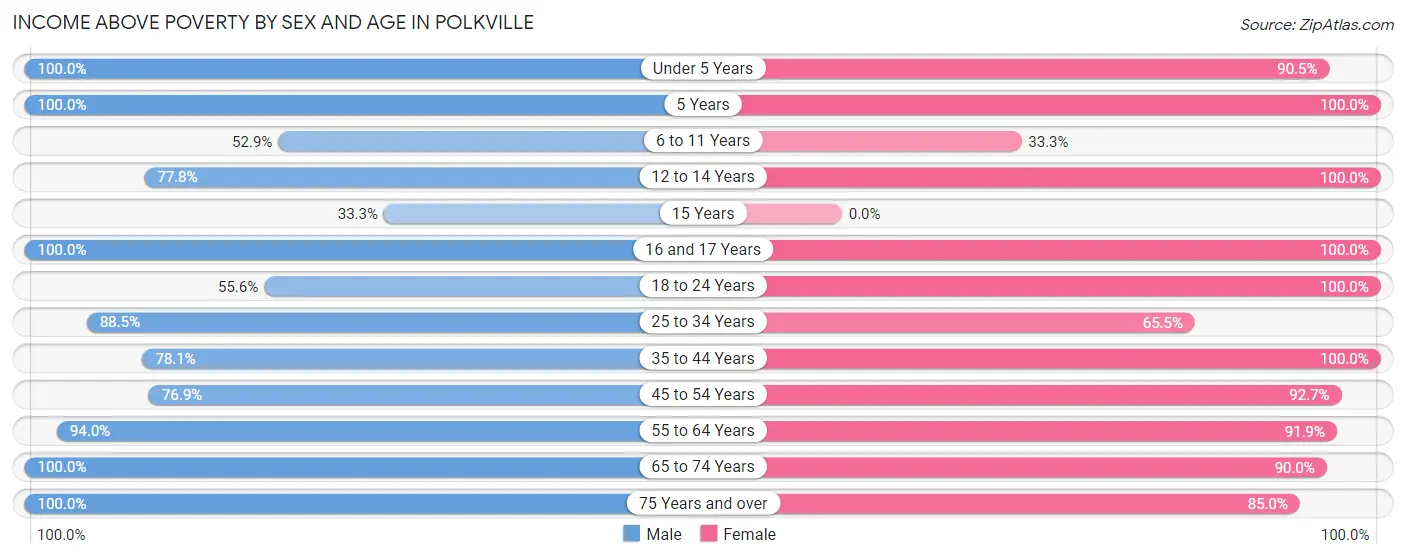
| Age Bracket | Male | Female |
| Under 5 Years | 5 (100.0%) | 19 (90.5%) |
| 5 Years | 3 (100.0%) | 2 (100.0%) |
| 6 to 11 Years | 9 (52.9%) | 3 (33.3%) |
| 12 to 14 Years | 7 (77.8%) | 6 (100.0%) |
| 15 Years | 3 (33.3%) | 0 (0.0%) |
| 16 and 17 Years | 12 (100.0%) | 7 (100.0%) |
| 18 to 24 Years | 5 (55.6%) | 12 (100.0%) |
| 25 to 34 Years | 23 (88.5%) | 19 (65.5%) |
| 35 to 44 Years | 25 (78.1%) | 24 (100.0%) |
| 45 to 54 Years | 20 (76.9%) | 51 (92.7%) |
| 55 to 64 Years | 47 (94.0%) | 34 (91.9%) |
| 65 to 74 Years | 21 (100.0%) | 18 (90.0%) |
| 75 Years and over | 17 (100.0%) | 34 (85.0%) |
| Total | 197 (83.5%) | 229 (87.4%) |
Income Below Poverty Among Married-Couple Families in Polkville
The poverty statistics for married-couple families in Polkville show that 7.0% or 6 of the total 86 families live below the poverty line. Families with 3 or 4 children have the highest poverty rate of 22.2%, comprising of 2 families. On the other hand, families with no children have the lowest poverty rate of 0.0%, which includes 0 families.
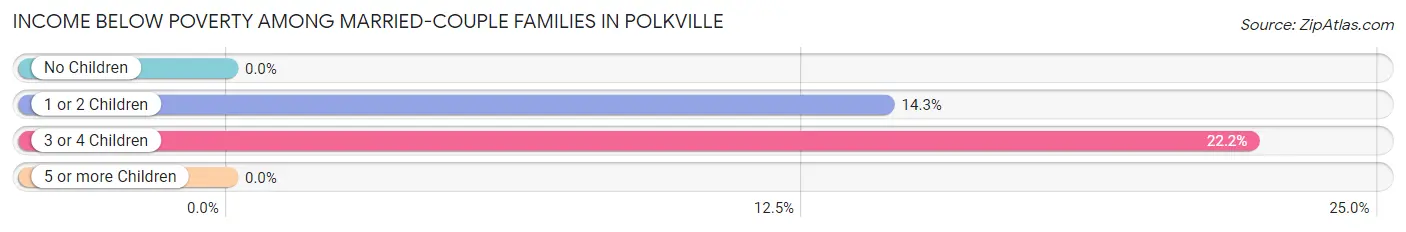
| Children | Above Poverty | Below Poverty |
| No Children | 49 (100.0%) | 0 (0.0%) |
| 1 or 2 Children | 24 (85.7%) | 4 (14.3%) |
| 3 or 4 Children | 7 (77.8%) | 2 (22.2%) |
| 5 or more Children | 0 (0.0%) | 0 (0.0%) |
| Total | 80 (93.0%) | 6 (7.0%) |
Income Below Poverty Among Single-Parent Households in Polkville
According to the poverty data in Polkville, 17.6% or 6 single-father households and 62.5% or 5 single-mother households are living below the poverty line. Among single-father households, those with 1 or 2 children have the highest poverty rate, with 6 households (66.7%) experiencing poverty. Likewise, among single-mother households, those with no children have the highest poverty rate, with 5 households (62.5%) falling below the poverty line.
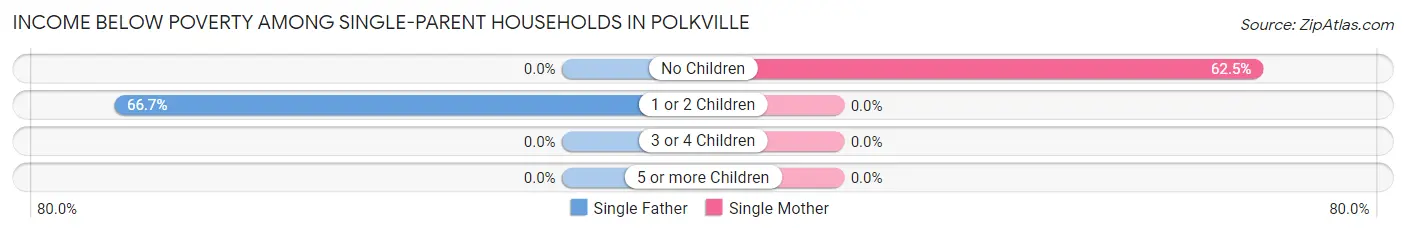
| Children | Single Father | Single Mother |
| No Children | 0 (0.0%) | 5 (62.5%) |
| 1 or 2 Children | 6 (66.7%) | 0 (0.0%) |
| 3 or 4 Children | 0 (0.0%) | 0 (0.0%) |
| 5 or more Children | 0 (0.0%) | 0 (0.0%) |
| Total | 6 (17.6%) | 5 (62.5%) |
Income Below Poverty Among Married-Couple vs Single-Parent Households in Polkville
The poverty data for Polkville shows that 6 of the married-couple family households (7.0%) and 11 of the single-parent households (26.2%) are living below the poverty level. Within the married-couple family households, those with 3 or 4 children have the highest poverty rate, with 2 households (22.2%) falling below the poverty line. Among the single-parent households, those with 1 or 2 children have the highest poverty rate, with 6 household (66.7%) living below poverty.
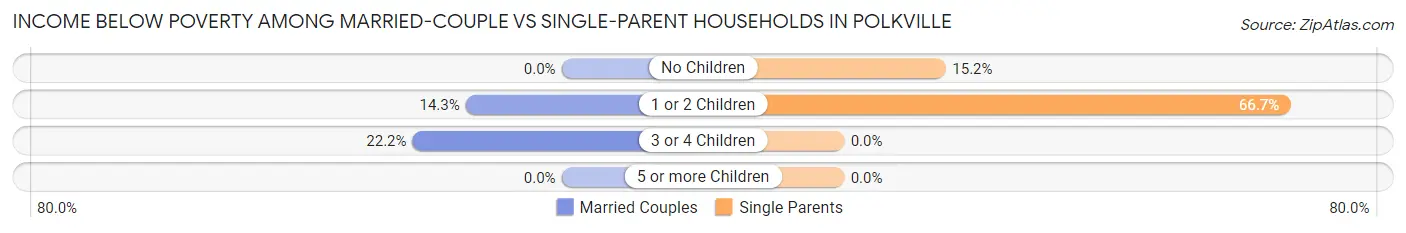
| Children | Married-Couple Families | Single-Parent Households |
| No Children | 0 (0.0%) | 5 (15.1%) |
| 1 or 2 Children | 4 (14.3%) | 6 (66.7%) |
| 3 or 4 Children | 2 (22.2%) | 0 (0.0%) |
| 5 or more Children | 0 (0.0%) | 0 (0.0%) |
| Total | 6 (7.0%) | 11 (26.2%) |
Race in Polkville
The most populous races in Polkville are White / Caucasian (496 | 99.2%), and Two or more Races (4 | 0.8%).
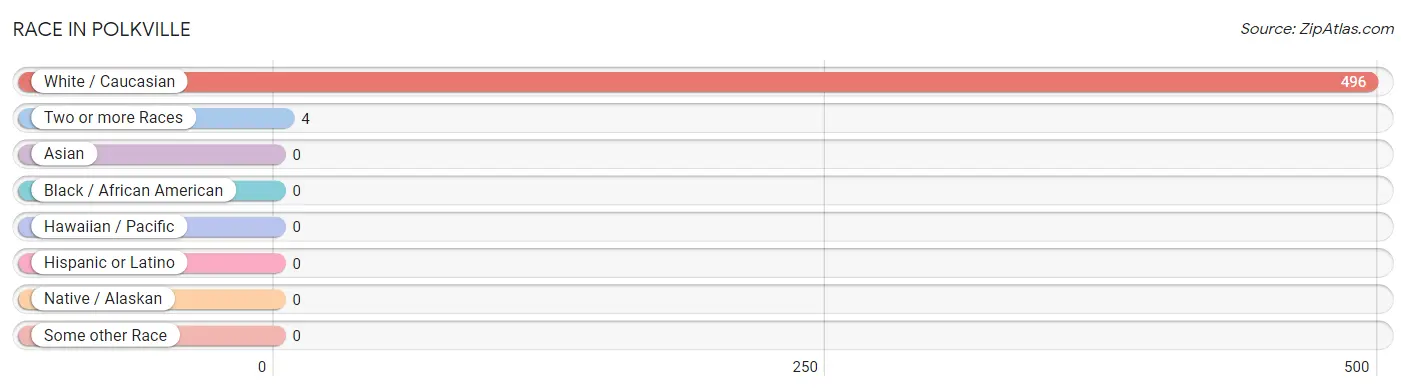
| Race | # Population | % Population |
| Asian | 0 | 0.0% |
| Black / African American | 0 | 0.0% |
| Hawaiian / Pacific | 0 | 0.0% |
| Hispanic or Latino | 0 | 0.0% |
| Native / Alaskan | 0 | 0.0% |
| White / Caucasian | 496 | 99.2% |
| Two or more Races | 4 | 0.8% |
| Some other Race | 0 | 0.0% |
| Total | 500 | 100.0% |
Ancestry in Polkville
The most populous ancestries reported in Polkville are American (158 | 31.6%), English (77 | 15.4%), French (40 | 8.0%), Scottish (31 | 6.2%), and Irish (30 | 6.0%), together accounting for 67.2% of all Polkville residents.
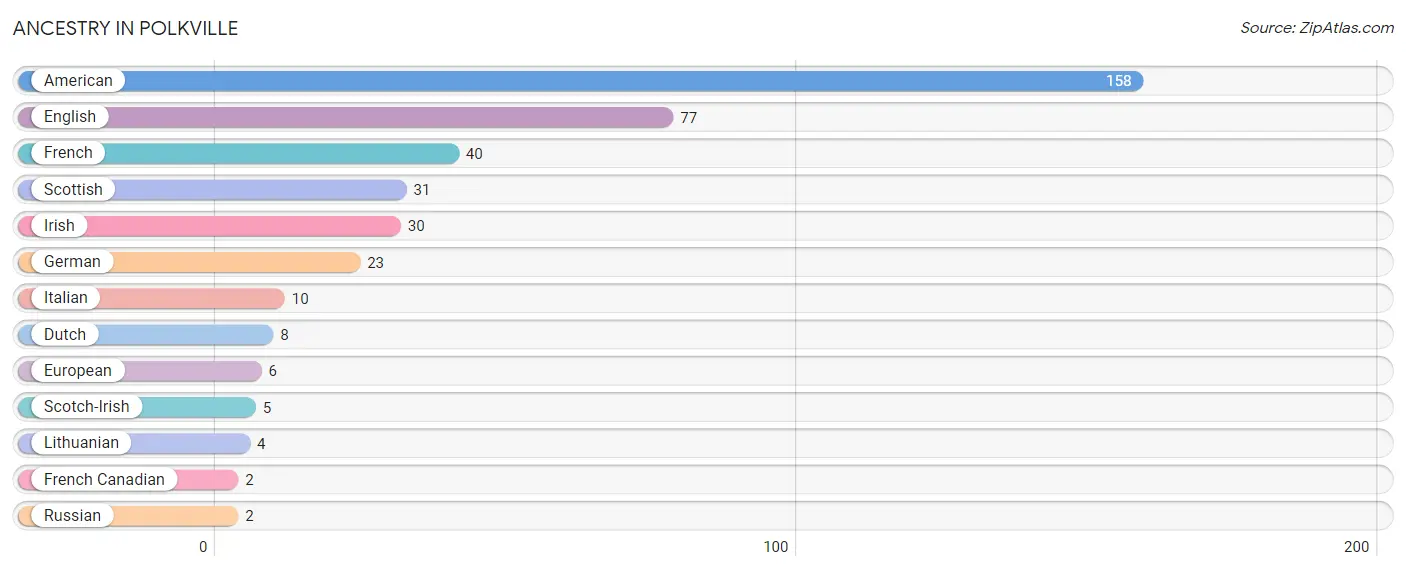
| Ancestry | # Population | % Population |
| American | 158 | 31.6% |
| Dutch | 8 | 1.6% |
| English | 77 | 15.4% |
| European | 6 | 1.2% |
| French | 40 | 8.0% |
| French Canadian | 2 | 0.4% |
| German | 23 | 4.6% |
| Irish | 30 | 6.0% |
| Italian | 10 | 2.0% |
| Lithuanian | 4 | 0.8% |
| Russian | 2 | 0.4% |
| Scotch-Irish | 5 | 1.0% |
| Scottish | 31 | 6.2% | View All 13 Rows |
Immigrants in Polkville

| Immigration Origin | # Population | % Population | View All 0 Rows |
Sex and Age in Polkville
Sex and Age in Polkville
The most populous age groups in Polkville are 55 to 59 Years (36 | 15.1%) for men and 55 to 59 Years (37 | 14.1%) for women.
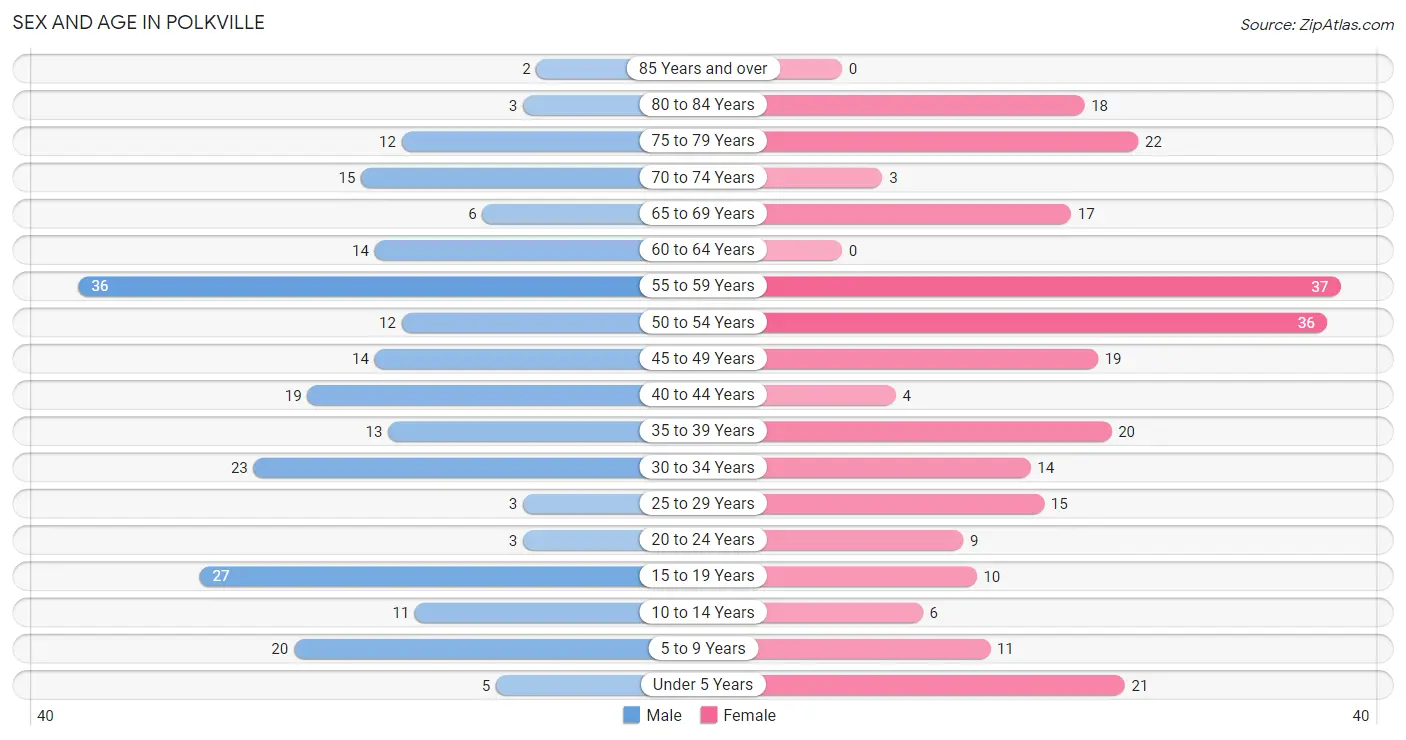
| Age Bracket | Male | Female |
| Under 5 Years | 5 (2.1%) | 21 (8.0%) |
| 5 to 9 Years | 20 (8.4%) | 11 (4.2%) |
| 10 to 14 Years | 11 (4.6%) | 6 (2.3%) |
| 15 to 19 Years | 27 (11.3%) | 10 (3.8%) |
| 20 to 24 Years | 3 (1.3%) | 9 (3.4%) |
| 25 to 29 Years | 3 (1.3%) | 15 (5.7%) |
| 30 to 34 Years | 23 (9.7%) | 14 (5.3%) |
| 35 to 39 Years | 13 (5.5%) | 20 (7.6%) |
| 40 to 44 Years | 19 (8.0%) | 4 (1.5%) |
| 45 to 49 Years | 14 (5.9%) | 19 (7.2%) |
| 50 to 54 Years | 12 (5.0%) | 36 (13.7%) |
| 55 to 59 Years | 36 (15.1%) | 37 (14.1%) |
| 60 to 64 Years | 14 (5.9%) | 0 (0.0%) |
| 65 to 69 Years | 6 (2.5%) | 17 (6.5%) |
| 70 to 74 Years | 15 (6.3%) | 3 (1.1%) |
| 75 to 79 Years | 12 (5.0%) | 22 (8.4%) |
| 80 to 84 Years | 3 (1.3%) | 18 (6.9%) |
| 85 Years and over | 2 (0.8%) | 0 (0.0%) |
| Total | 238 (100.0%) | 262 (100.0%) |
Families and Households in Polkville
Median Family Size in Polkville
The median family size in Polkville is 3.29 persons per family, with single female/mother families (8 | 6.2%) accounting for the largest median family size of 5 persons per family. On the other hand, single male/father families (34 | 26.6%) represent the smallest median family size with 2.62 persons per family.
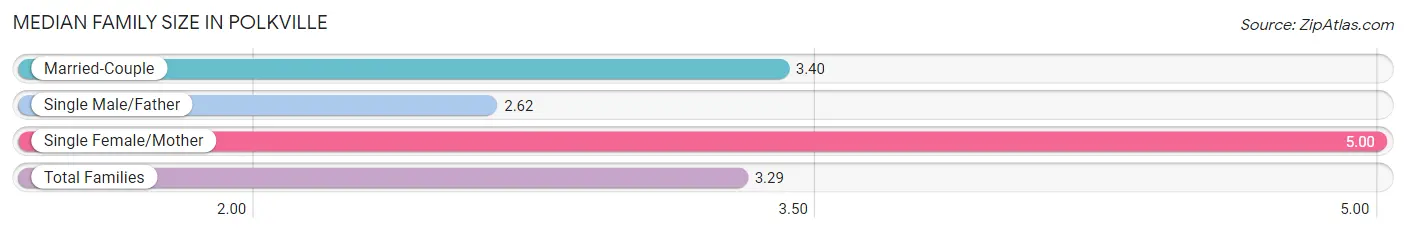
| Family Type | # Families | Family Size |
| Married-Couple | 86 (67.2%) | 3.40 |
| Single Male/Father | 34 (26.6%) | 2.62 |
| Single Female/Mother | 8 (6.2%) | 5.00 |
| Total Families | 128 (100.0%) | 3.29 |
Median Household Size in Polkville
The median household size in Polkville is 2.62 persons per household, with single female/mother households (8 | 4.2%) accounting for the largest median household size of 5 persons per household. non-family households (63 | 33.0%) represent the smallest median household size with 1.16 persons per household.
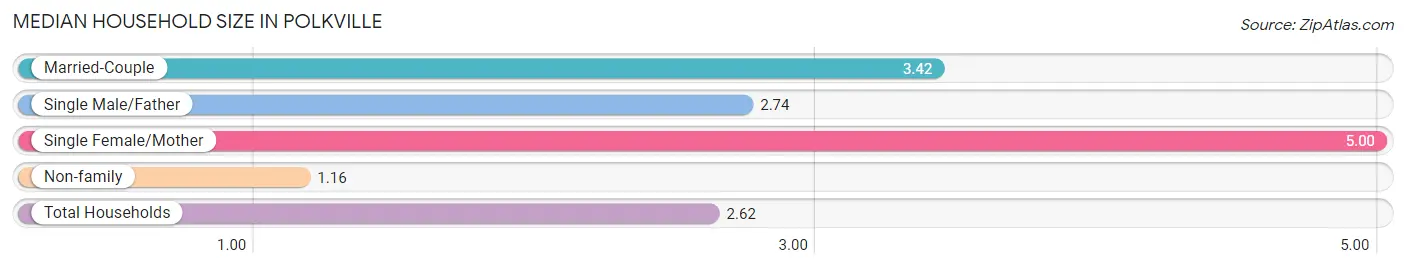
| Household Type | # Households | Household Size |
| Married-Couple | 86 (45.0%) | 3.42 |
| Single Male/Father | 34 (17.8%) | 2.74 |
| Single Female/Mother | 8 (4.2%) | 5.00 |
| Non-family | 63 (33.0%) | 1.16 |
| Total Households | 191 (100.0%) | 2.62 |
Household Size by Marriage Status in Polkville
Out of a total of 191 households in Polkville, 128 (67.0%) are family households, while 63 (33.0%) are nonfamily households. The most numerous type of family households are 2-person households, comprising 71, and the most common type of nonfamily households are 1-person households, comprising 55.
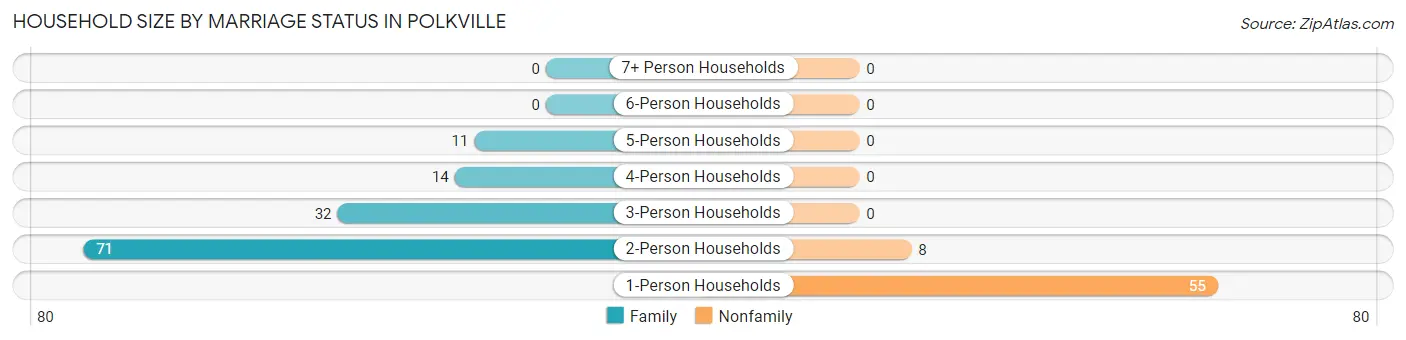
| Household Size | Family Households | Nonfamily Households |
| 1-Person Households | - | 55 (28.8%) |
| 2-Person Households | 71 (37.2%) | 8 (4.2%) |
| 3-Person Households | 32 (16.8%) | 0 (0.0%) |
| 4-Person Households | 14 (7.3%) | 0 (0.0%) |
| 5-Person Households | 11 (5.8%) | 0 (0.0%) |
| 6-Person Households | 0 (0.0%) | 0 (0.0%) |
| 7+ Person Households | 0 (0.0%) | 0 (0.0%) |
| Total | 128 (67.0%) | 63 (33.0%) |
Female Fertility in Polkville
Fertility by Age in Polkville
Average fertility rate in Polkville is 22.0 births per 1,000 women. Women in the age bracket of 20 to 34 years have the highest fertility rate with 53.0 births per 1,000 women. Women in the age bracket of 20 to 34 years acount for 100.0% of all women with births.
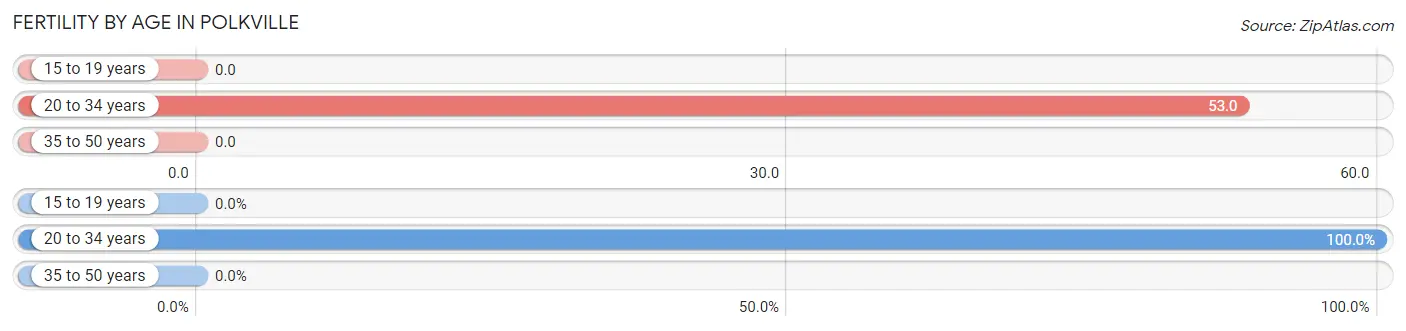
| Age Bracket | Women with Births | Births / 1,000 Women |
| 15 to 19 years | 0 (0.0%) | 0.0 |
| 20 to 34 years | 2 (100.0%) | 53.0 |
| 35 to 50 years | 0 (0.0%) | 0.0 |
| Total | 2 (100.0%) | 22.0 |
Fertility by Age by Marriage Status in Polkville
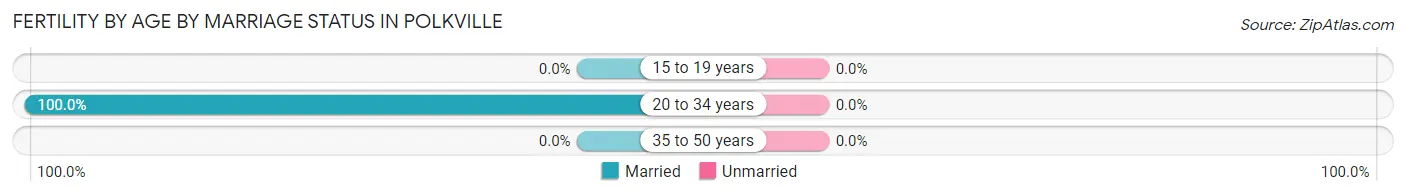
| Age Bracket | Married | Unmarried |
| 15 to 19 years | 0 (0.0%) | 0 (0.0%) |
| 20 to 34 years | 2 (100.0%) | 0 (0.0%) |
| 35 to 50 years | 0 (0.0%) | 0 (0.0%) |
| Total | 2 (100.0%) | 0 (0.0%) |
Fertility by Education in Polkville
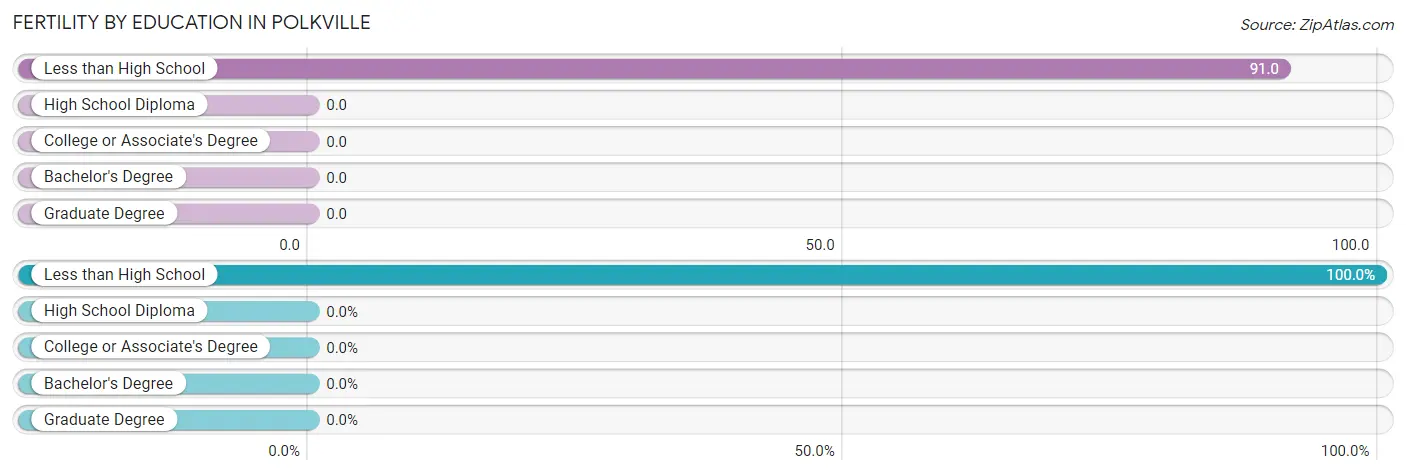
| Educational Attainment | Women with Births | Births / 1,000 Women |
| Less than High School | 2 (100.0%) | 91.0 |
| High School Diploma | 0 (0.0%) | 0.0 |
| College or Associate's Degree | 0 (0.0%) | 0.0 |
| Bachelor's Degree | 0 (0.0%) | 0.0 |
| Graduate Degree | 0 (0.0%) | 0.0 |
| Total | 2 (100.0%) | 22.0 |
Fertility by Education by Marriage Status in Polkville
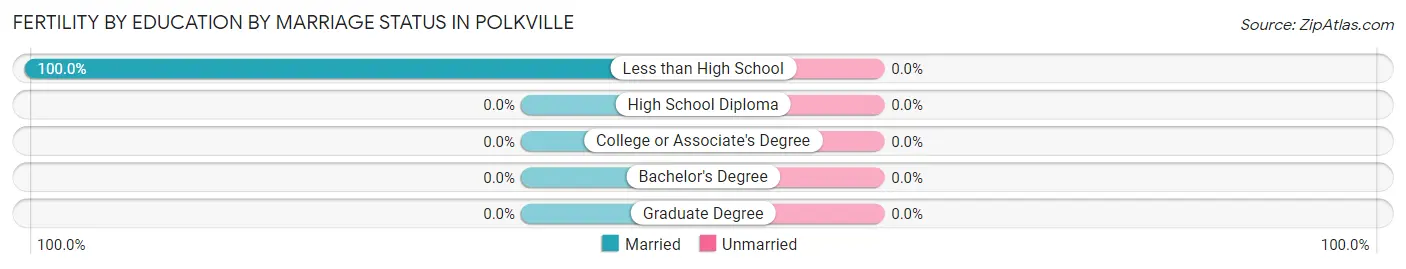
| Educational Attainment | Married | Unmarried |
| Less than High School | 2 (100.0%) | 0 (0.0%) |
| High School Diploma | 0 (0.0%) | 0 (0.0%) |
| College or Associate's Degree | 0 (0.0%) | 0 (0.0%) |
| Bachelor's Degree | 0 (0.0%) | 0 (0.0%) |
| Graduate Degree | 0 (0.0%) | 0 (0.0%) |
| Total | 2 (100.0%) | 0 (0.0%) |
Employment Characteristics in Polkville
Employment by Class of Employer in Polkville
Among the 233 employed individuals in Polkville, private company employees (124 | 53.2%), not-for-profit organizations (44 | 18.9%), and local government employees (24 | 10.3%) make up the most common classes of employment.
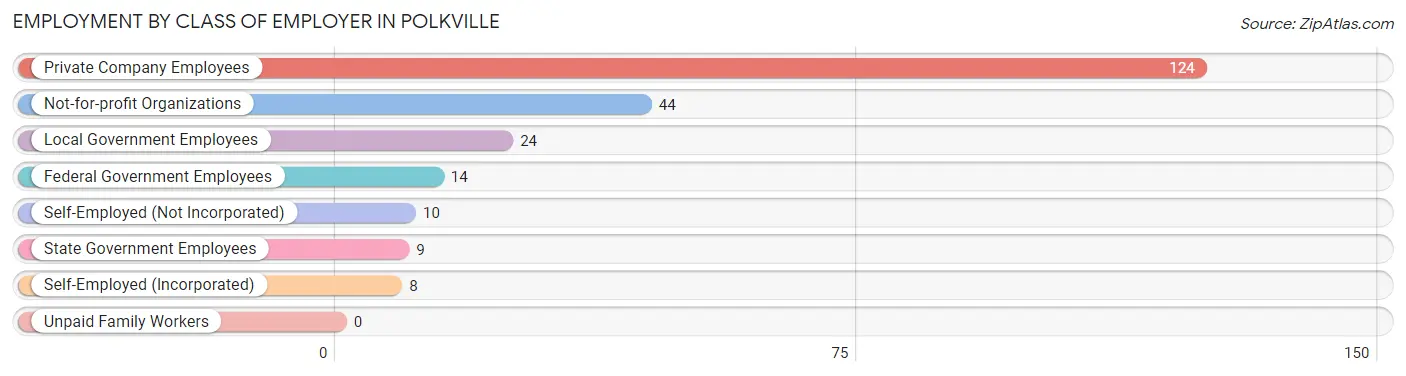
| Employer Class | # Employees | % Employees |
| Private Company Employees | 124 | 53.2% |
| Self-Employed (Incorporated) | 8 | 3.4% |
| Self-Employed (Not Incorporated) | 10 | 4.3% |
| Not-for-profit Organizations | 44 | 18.9% |
| Local Government Employees | 24 | 10.3% |
| State Government Employees | 9 | 3.9% |
| Federal Government Employees | 14 | 6.0% |
| Unpaid Family Workers | 0 | 0.0% |
| Total | 233 | 100.0% |
Employment Status by Age in Polkville
According to the labor force statistics for Polkville, out of the total population over 16 years of age (417), 59.7% or 249 individuals are in the labor force, with 4.8% or 12 of them unemployed. The age group with the highest labor force participation rate is 35 to 44 years, with 91.1% or 51 individuals in the labor force. Within the labor force, the 16 to 19 years age range has the highest percentage of unemployed individuals, with 45.0% or 9 of them being unemployed.
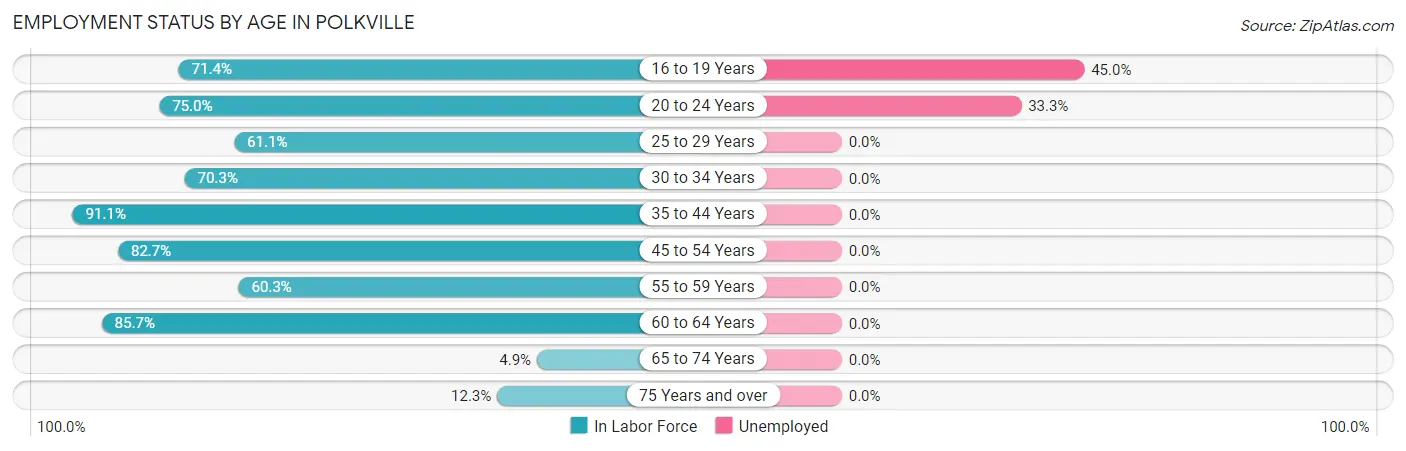
| Age Bracket | In Labor Force | Unemployed |
| 16 to 19 Years | 20 (71.4%) | 9 (45.0%) |
| 20 to 24 Years | 9 (75.0%) | 3 (33.3%) |
| 25 to 29 Years | 11 (61.1%) | 0 (0.0%) |
| 30 to 34 Years | 26 (70.3%) | 0 (0.0%) |
| 35 to 44 Years | 51 (91.1%) | 0 (0.0%) |
| 45 to 54 Years | 67 (82.7%) | 0 (0.0%) |
| 55 to 59 Years | 44 (60.3%) | 0 (0.0%) |
| 60 to 64 Years | 12 (85.7%) | 0 (0.0%) |
| 65 to 74 Years | 2 (4.9%) | 0 (0.0%) |
| 75 Years and over | 7 (12.3%) | 0 (0.0%) |
| Total | 249 (59.7%) | 12 (4.8%) |
Employment Status by Educational Attainment in Polkville
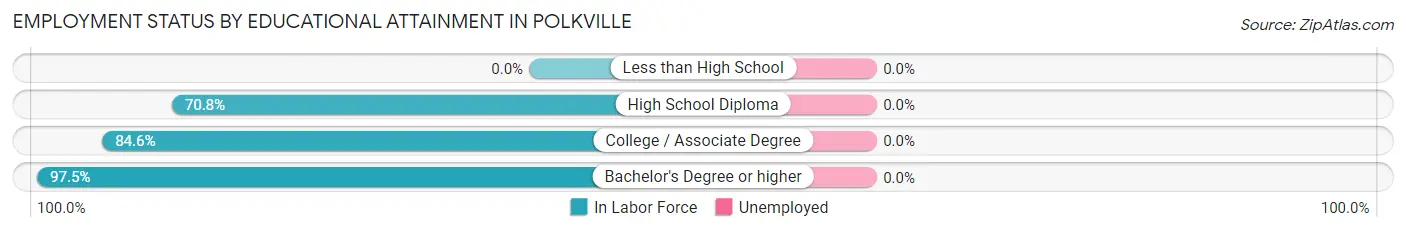
| Educational Attainment | In Labor Force | Unemployed |
| Less than High School | 0 (0.0%) | 0 (0.0%) |
| High School Diploma | 68 (70.8%) | 0 (0.0%) |
| College / Associate Degree | 66 (84.6%) | 0 (0.0%) |
| Bachelor's Degree or higher | 77 (97.5%) | 0 (0.0%) |
| Total | 211 (75.6%) | 0 (0.0%) |
Employment Occupations by Sex in Polkville
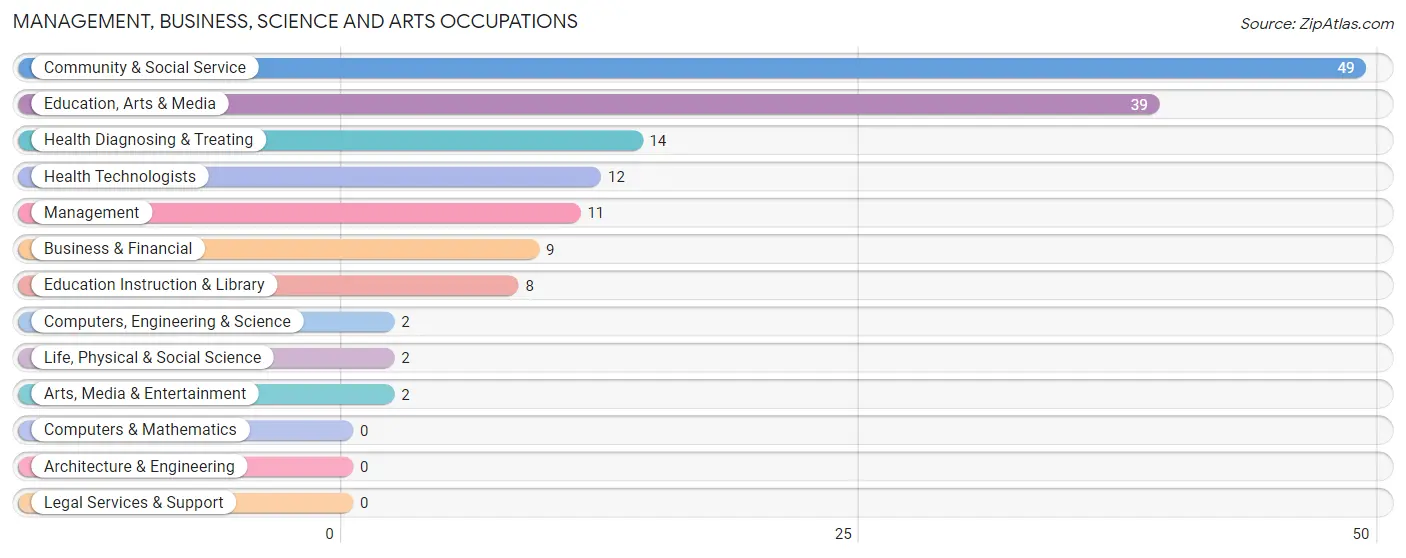
Management, Business, Science and Arts Occupations
The most common Management, Business, Science and Arts occupations in Polkville are Community & Social Service (49 | 20.7%), Education, Arts & Media (39 | 16.5%), Health Diagnosing & Treating (14 | 5.9%), Health Technologists (12 | 5.1%), and Management (11 | 4.6%).
Management, Business, Science and Arts Occupations by Sex
Within the Management, Business, Science and Arts occupations in Polkville, the most male-oriented occupations are Computers, Engineering & Science (100.0%), Life, Physical & Social Science (100.0%), and Arts, Media & Entertainment (100.0%), while the most female-oriented occupations are Business & Financial (100.0%), Education Instruction & Library (100.0%), and Health Diagnosing & Treating (100.0%).
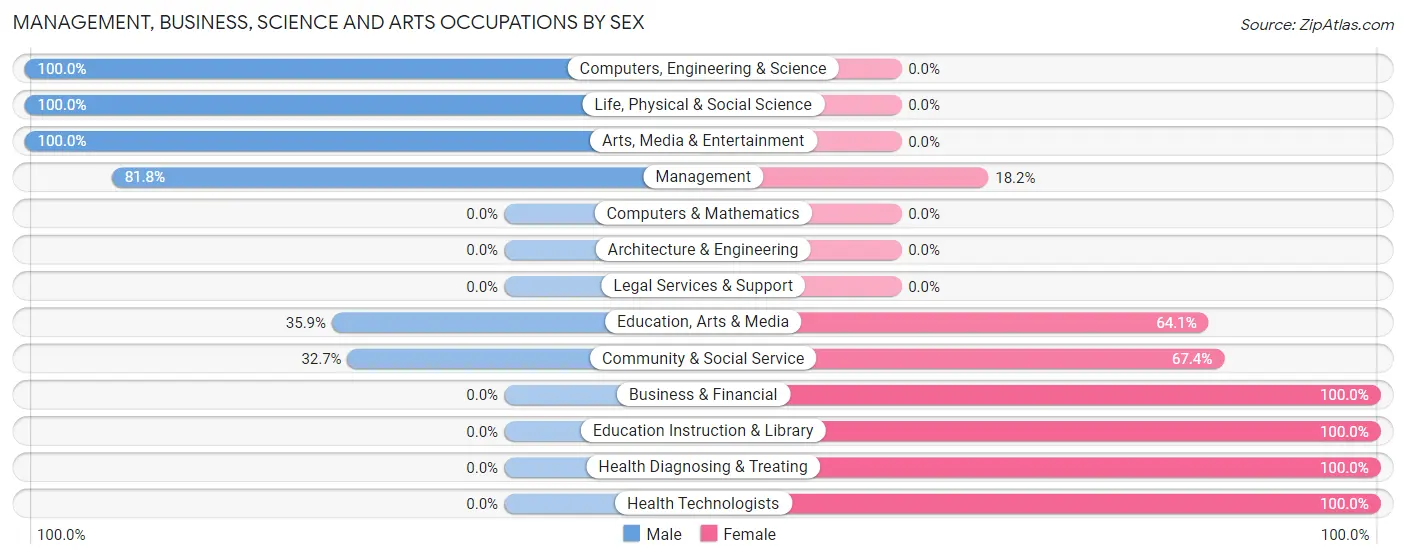
| Occupation | Male | Female |
| Management | 9 (81.8%) | 2 (18.2%) |
| Business & Financial | 0 (0.0%) | 9 (100.0%) |
| Computers, Engineering & Science | 2 (100.0%) | 0 (0.0%) |
| Computers & Mathematics | 0 (0.0%) | 0 (0.0%) |
| Architecture & Engineering | 0 (0.0%) | 0 (0.0%) |
| Life, Physical & Social Science | 2 (100.0%) | 0 (0.0%) |
| Community & Social Service | 16 (32.7%) | 33 (67.3%) |
| Education, Arts & Media | 14 (35.9%) | 25 (64.1%) |
| Legal Services & Support | 0 (0.0%) | 0 (0.0%) |
| Education Instruction & Library | 0 (0.0%) | 8 (100.0%) |
| Arts, Media & Entertainment | 2 (100.0%) | 0 (0.0%) |
| Health Diagnosing & Treating | 0 (0.0%) | 14 (100.0%) |
| Health Technologists | 0 (0.0%) | 12 (100.0%) |
| Total (Category) | 27 (31.8%) | 58 (68.2%) |
| Total (Overall) | 126 (53.2%) | 111 (46.8%) |
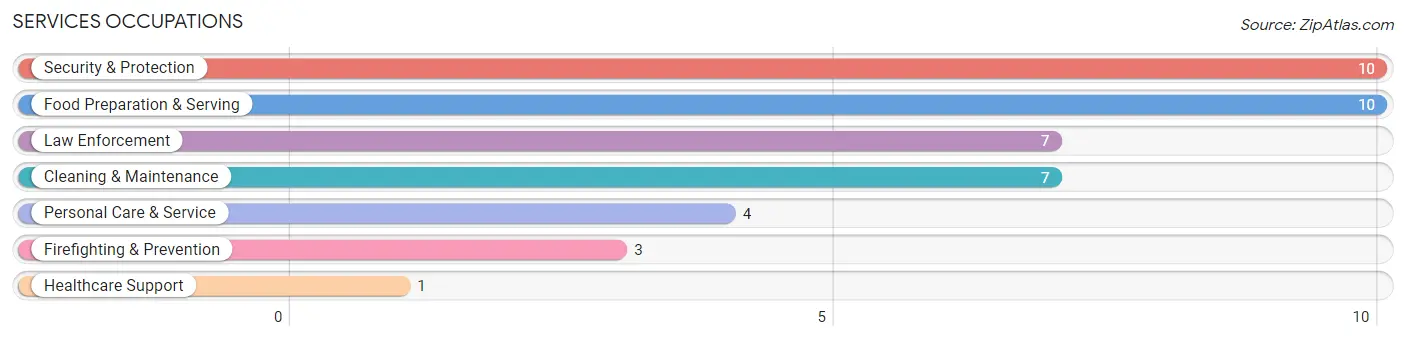
Services Occupations
The most common Services occupations in Polkville are Security & Protection (10 | 4.2%), Food Preparation & Serving (10 | 4.2%), Law Enforcement (7 | 2.9%), Cleaning & Maintenance (7 | 2.9%), and Personal Care & Service (4 | 1.7%).
Services Occupations by Sex
Within the Services occupations in Polkville, the most male-oriented occupations are Law Enforcement (100.0%), Cleaning & Maintenance (100.0%), and Security & Protection (70.0%), while the most female-oriented occupations are Healthcare Support (100.0%), Firefighting & Prevention (100.0%), and Personal Care & Service (100.0%).
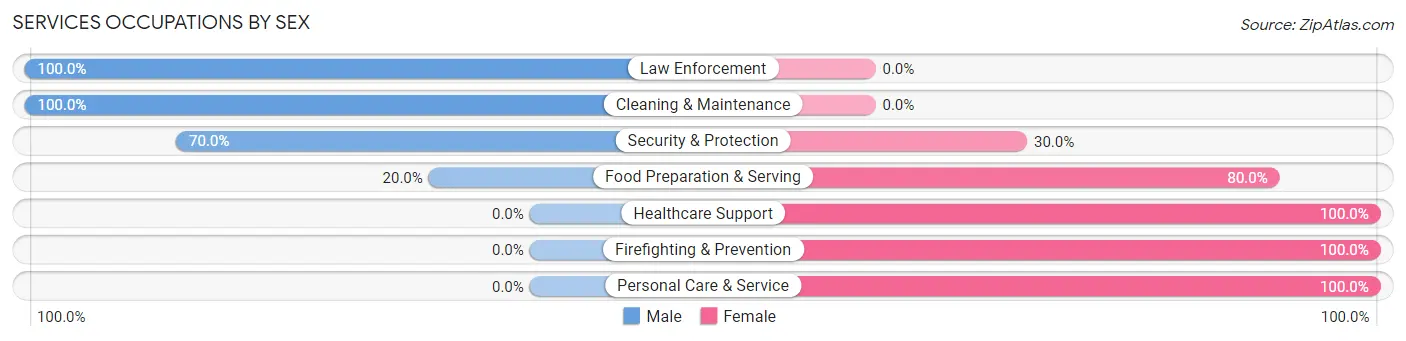
| Occupation | Male | Female |
| Healthcare Support | 0 (0.0%) | 1 (100.0%) |
| Security & Protection | 7 (70.0%) | 3 (30.0%) |
| Firefighting & Prevention | 0 (0.0%) | 3 (100.0%) |
| Law Enforcement | 7 (100.0%) | 0 (0.0%) |
| Food Preparation & Serving | 2 (20.0%) | 8 (80.0%) |
| Cleaning & Maintenance | 7 (100.0%) | 0 (0.0%) |
| Personal Care & Service | 0 (0.0%) | 4 (100.0%) |
| Total (Category) | 16 (50.0%) | 16 (50.0%) |
| Total (Overall) | 126 (53.2%) | 111 (46.8%) |
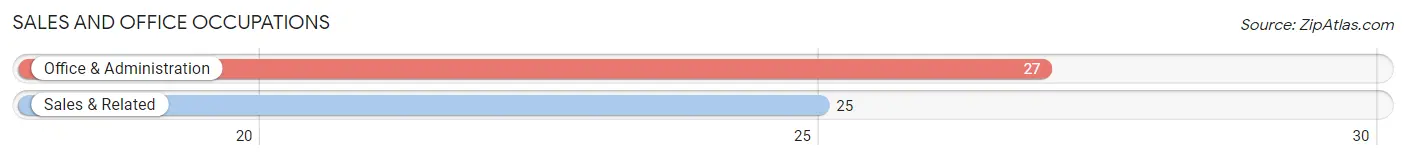
Sales and Office Occupations
The most common Sales and Office occupations in Polkville are Office & Administration (27 | 11.4%), and Sales & Related (25 | 10.5%).
Sales and Office Occupations by Sex
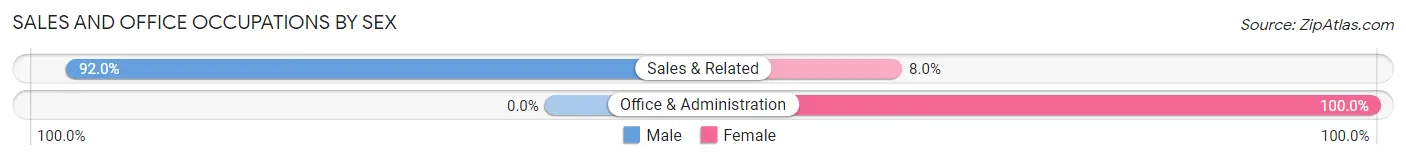
| Occupation | Male | Female |
| Sales & Related | 23 (92.0%) | 2 (8.0%) |
| Office & Administration | 0 (0.0%) | 27 (100.0%) |
| Total (Category) | 23 (44.2%) | 29 (55.8%) |
| Total (Overall) | 126 (53.2%) | 111 (46.8%) |
Natural Resources, Construction and Maintenance Occupations
The most common Natural Resources, Construction and Maintenance occupations in Polkville are Construction & Extraction (9 | 3.8%), and Installation, Maintenance & Repair (7 | 2.9%).

Natural Resources, Construction and Maintenance Occupations by Sex
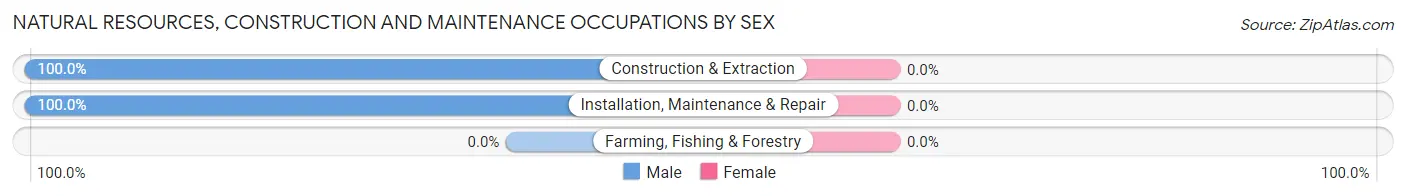
| Occupation | Male | Female |
| Farming, Fishing & Forestry | 0 (0.0%) | 0 (0.0%) |
| Construction & Extraction | 9 (100.0%) | 0 (0.0%) |
| Installation, Maintenance & Repair | 7 (100.0%) | 0 (0.0%) |
| Total (Category) | 16 (100.0%) | 0 (0.0%) |
| Total (Overall) | 126 (53.2%) | 111 (46.8%) |
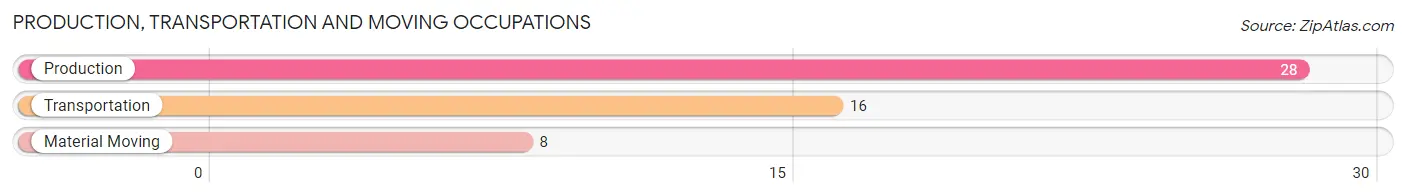
Production, Transportation and Moving Occupations
The most common Production, Transportation and Moving occupations in Polkville are Production (28 | 11.8%), Transportation (16 | 6.8%), and Material Moving (8 | 3.4%).
Production, Transportation and Moving Occupations by Sex
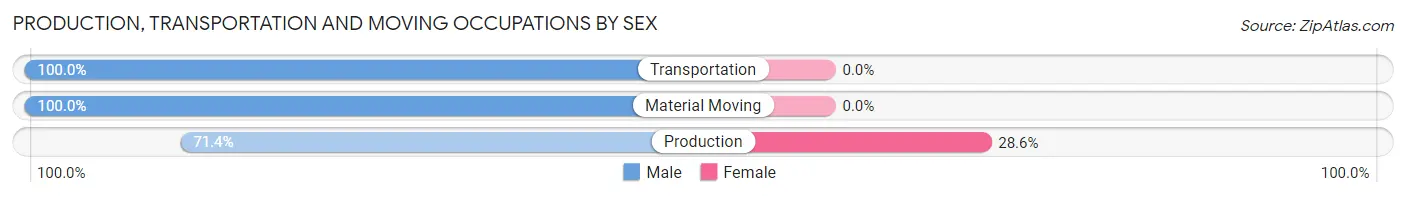
| Occupation | Male | Female |
| Production | 20 (71.4%) | 8 (28.6%) |
| Transportation | 16 (100.0%) | 0 (0.0%) |
| Material Moving | 8 (100.0%) | 0 (0.0%) |
| Total (Category) | 44 (84.6%) | 8 (15.4%) |
| Total (Overall) | 126 (53.2%) | 111 (46.8%) |
Employment Industries by Sex in Polkville
Employment Industries in Polkville
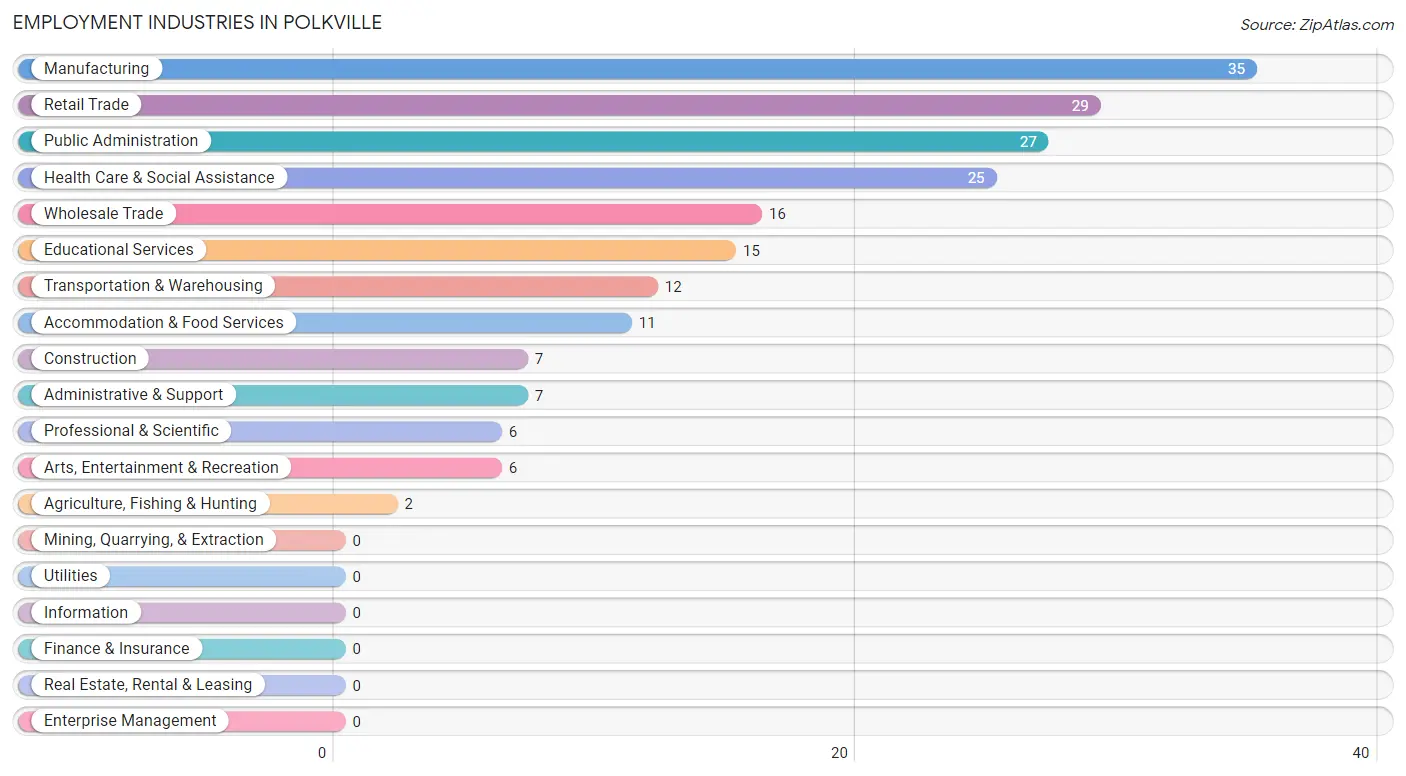
The major employment industries in Polkville include Manufacturing (35 | 14.8%), Retail Trade (29 | 12.2%), Public Administration (27 | 11.4%), Health Care & Social Assistance (25 | 10.5%), and Wholesale Trade (16 | 6.8%).
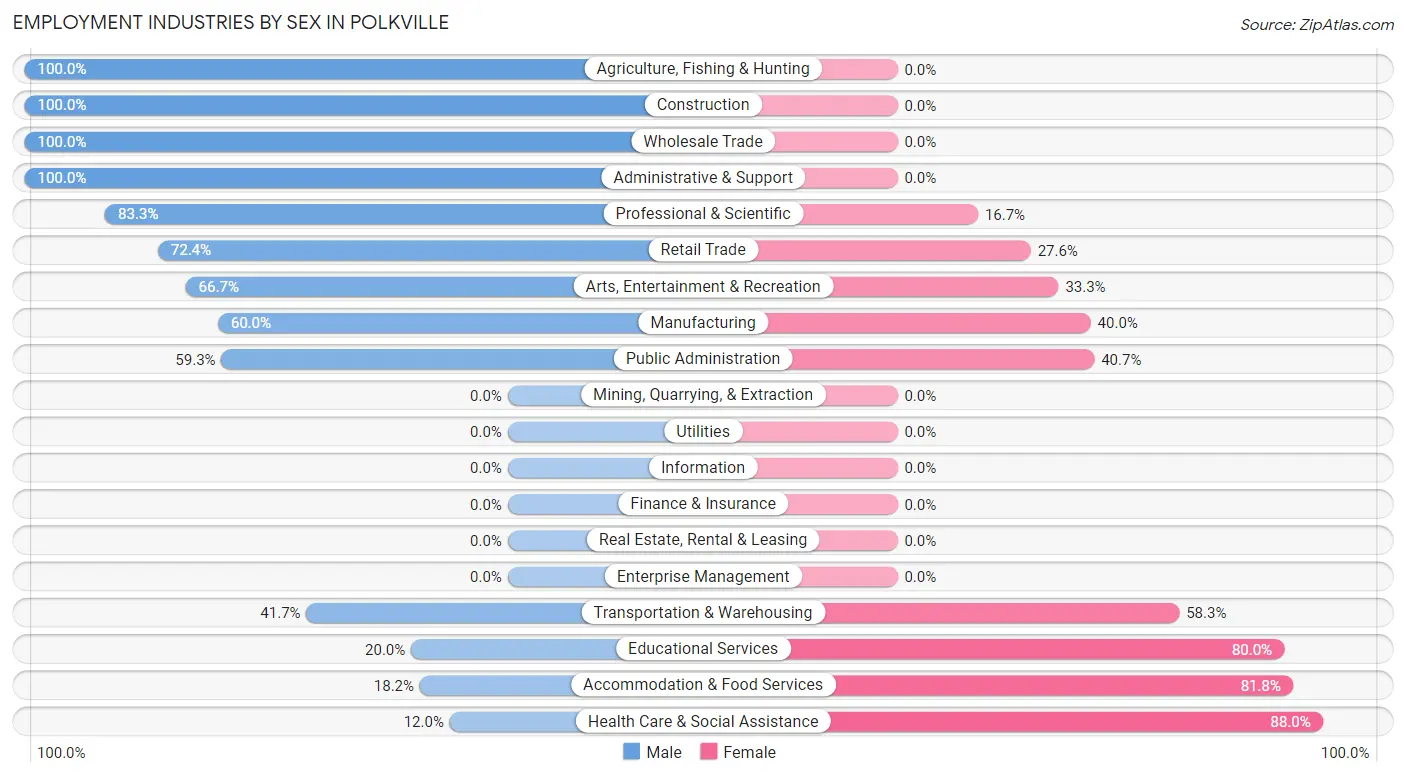
Employment Industries by Sex in Polkville
The Polkville industries that see more men than women are Agriculture, Fishing & Hunting (100.0%), Construction (100.0%), and Wholesale Trade (100.0%), whereas the industries that tend to have a higher number of women are Health Care & Social Assistance (88.0%), Accommodation & Food Services (81.8%), and Educational Services (80.0%).
| Industry | Male | Female |
| Agriculture, Fishing & Hunting | 2 (100.0%) | 0 (0.0%) |
| Mining, Quarrying, & Extraction | 0 (0.0%) | 0 (0.0%) |
| Construction | 7 (100.0%) | 0 (0.0%) |
| Manufacturing | 21 (60.0%) | 14 (40.0%) |
| Wholesale Trade | 16 (100.0%) | 0 (0.0%) |
| Retail Trade | 21 (72.4%) | 8 (27.6%) |
| Transportation & Warehousing | 5 (41.7%) | 7 (58.3%) |
| Utilities | 0 (0.0%) | 0 (0.0%) |
| Information | 0 (0.0%) | 0 (0.0%) |
| Finance & Insurance | 0 (0.0%) | 0 (0.0%) |
| Real Estate, Rental & Leasing | 0 (0.0%) | 0 (0.0%) |
| Professional & Scientific | 5 (83.3%) | 1 (16.7%) |
| Enterprise Management | 0 (0.0%) | 0 (0.0%) |
| Administrative & Support | 7 (100.0%) | 0 (0.0%) |
| Educational Services | 3 (20.0%) | 12 (80.0%) |
| Health Care & Social Assistance | 3 (12.0%) | 22 (88.0%) |
| Arts, Entertainment & Recreation | 4 (66.7%) | 2 (33.3%) |
| Accommodation & Food Services | 2 (18.2%) | 9 (81.8%) |
| Public Administration | 16 (59.3%) | 11 (40.7%) |
| Total | 126 (53.2%) | 111 (46.8%) |
Education in Polkville
School Enrollment in Polkville
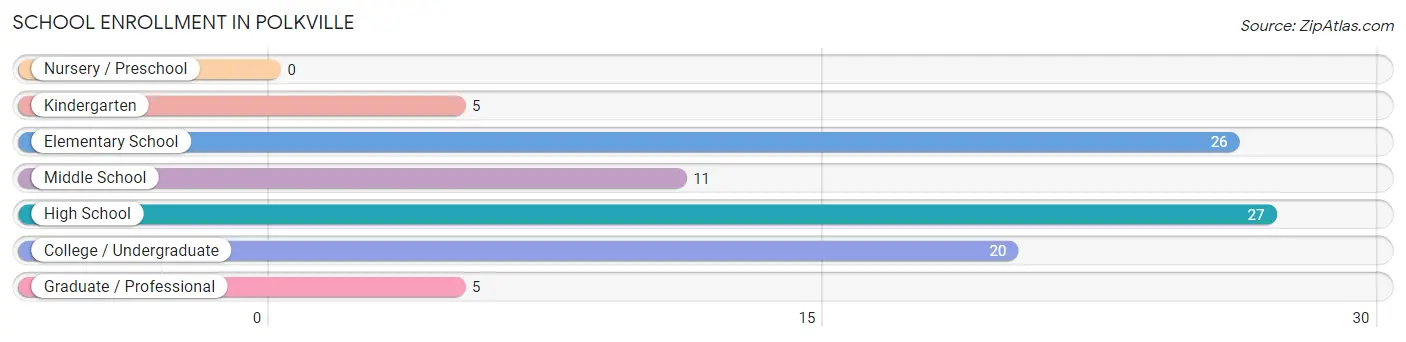
The most common levels of schooling among the 94 students in Polkville are high school (27 | 28.7%), elementary school (26 | 27.7%), and college / undergraduate (20 | 21.3%).
| School Level | # Students | % Students |
| Nursery / Preschool | 0 | 0.0% |
| Kindergarten | 5 | 5.3% |
| Elementary School | 26 | 27.7% |
| Middle School | 11 | 11.7% |
| High School | 27 | 28.7% |
| College / Undergraduate | 20 | 21.3% |
| Graduate / Professional | 5 | 5.3% |
| Total | 94 | 100.0% |
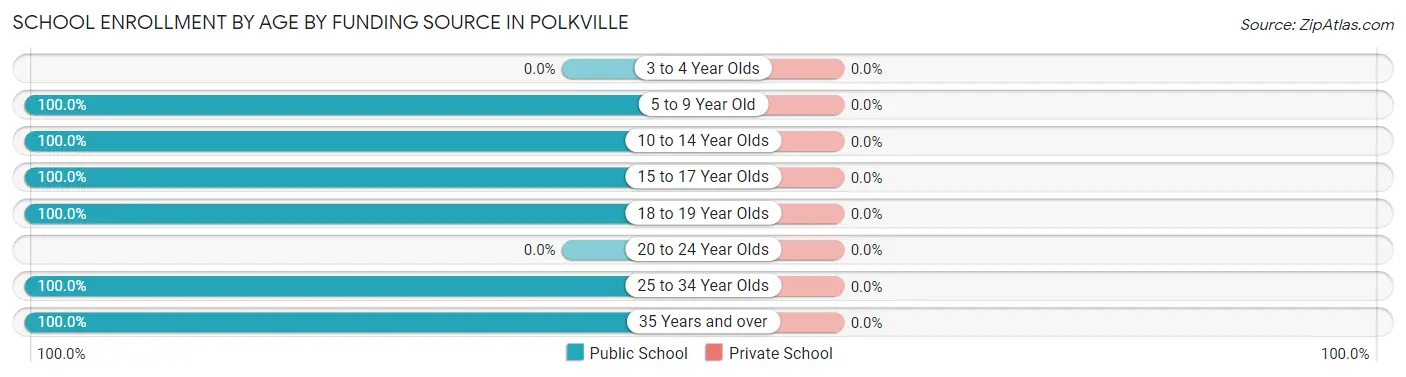
School Enrollment by Age by Funding Source in Polkville
| Age Bracket | Public School | Private School |
| 3 to 4 Year Olds | 0 (0.0%) | 0 (0.0%) |
| 5 to 9 Year Old | 31 (100.0%) | 0 (0.0%) |
| 10 to 14 Year Olds | 17 (100.0%) | 0 (0.0%) |
| 15 to 17 Year Olds | 26 (100.0%) | 0 (0.0%) |
| 18 to 19 Year Olds | 5 (100.0%) | 0 (0.0%) |
| 20 to 24 Year Olds | 0 (0.0%) | 0 (0.0%) |
| 25 to 34 Year Olds | 9 (100.0%) | 0 (0.0%) |
| 35 Years and over | 6 (100.0%) | 0 (0.0%) |
| Total | 94 (100.0%) | 0 (0.0%) |
Educational Attainment by Field of Study in Polkville
Education (29 | 33.7%), business (17 | 19.8%), liberal arts & history (14 | 16.3%), engineering (7 | 8.1%), and science & technology (4 | 4.6%) are the most common fields of study among 86 individuals in Polkville who have obtained a bachelor's degree or higher.
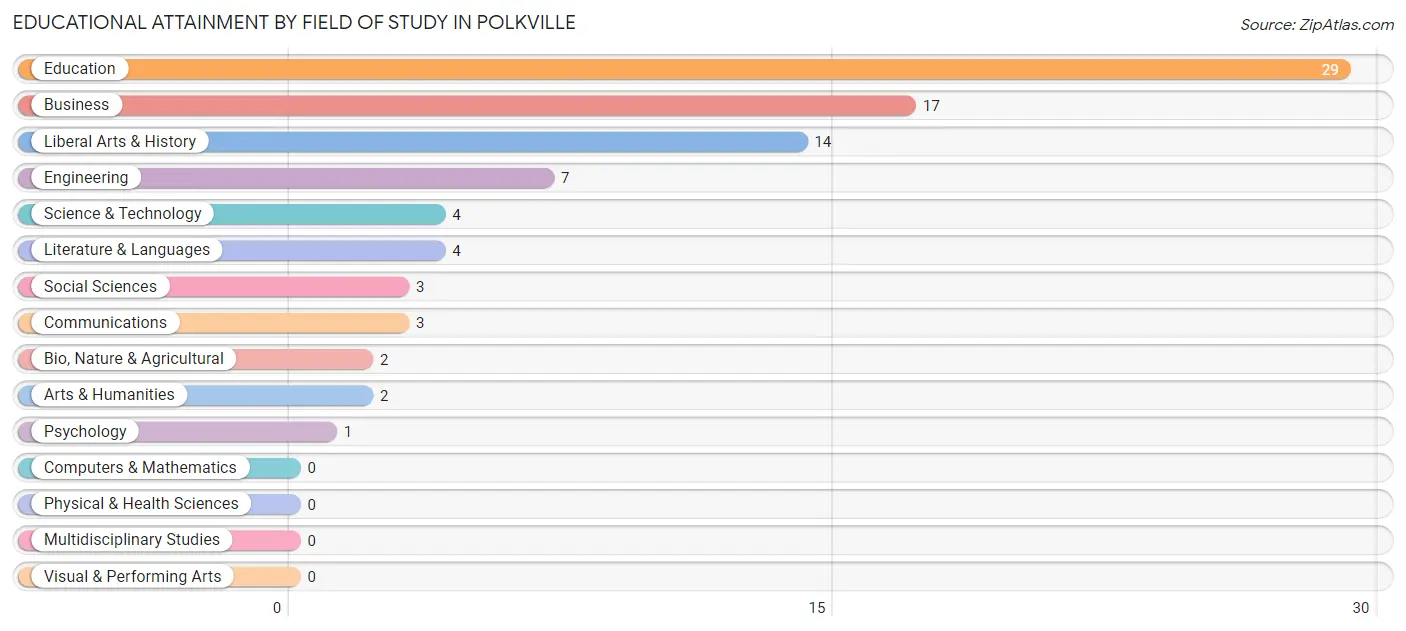
| Field of Study | # Graduates | % Graduates |
| Computers & Mathematics | 0 | 0.0% |
| Bio, Nature & Agricultural | 2 | 2.3% |
| Physical & Health Sciences | 0 | 0.0% |
| Psychology | 1 | 1.2% |
| Social Sciences | 3 | 3.5% |
| Engineering | 7 | 8.1% |
| Multidisciplinary Studies | 0 | 0.0% |
| Science & Technology | 4 | 4.6% |
| Business | 17 | 19.8% |
| Education | 29 | 33.7% |
| Literature & Languages | 4 | 4.6% |
| Liberal Arts & History | 14 | 16.3% |
| Visual & Performing Arts | 0 | 0.0% |
| Communications | 3 | 3.5% |
| Arts & Humanities | 2 | 2.3% |
| Total | 86 | 100.0% |
Transportation & Commute in Polkville
Vehicle Availability by Sex in Polkville
The most prevalent vehicle ownership categories in Polkville are males with 2 vehicles (44, accounting for 34.9%) and females with 2 vehicles (46, making up 41.1%).
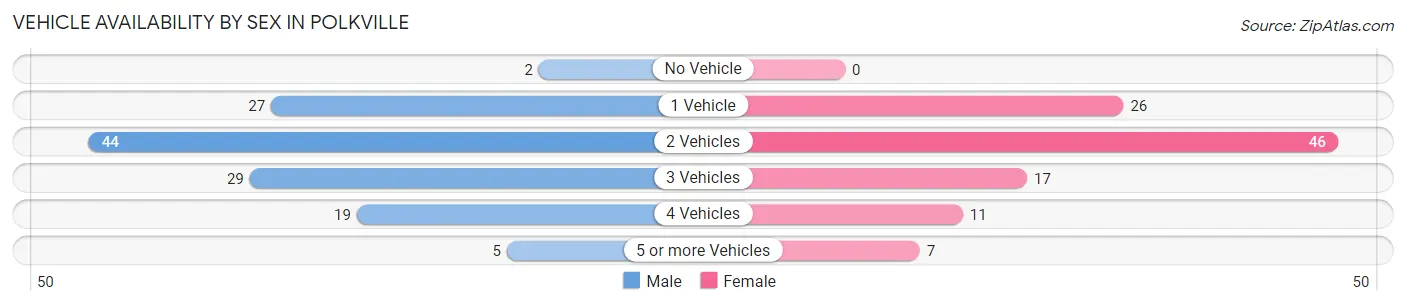
| Vehicles Available | Male | Female |
| No Vehicle | 2 (1.6%) | 0 (0.0%) |
| 1 Vehicle | 27 (21.4%) | 26 (24.3%) |
| 2 Vehicles | 44 (34.9%) | 46 (43.0%) |
| 3 Vehicles | 29 (23.0%) | 17 (15.9%) |
| 4 Vehicles | 19 (15.1%) | 11 (10.3%) |
| 5 or more Vehicles | 5 (4.0%) | 7 (6.5%) |
| Total | 126 (100.0%) | 107 (100.0%) |
Commute Time in Polkville
The most frequently occuring commute durations in Polkville are 20 to 24 minutes (43 commuters, 19.0%), 45 to 59 minutes (41 commuters, 18.1%), and 5 to 9 minutes (30 commuters, 13.3%).
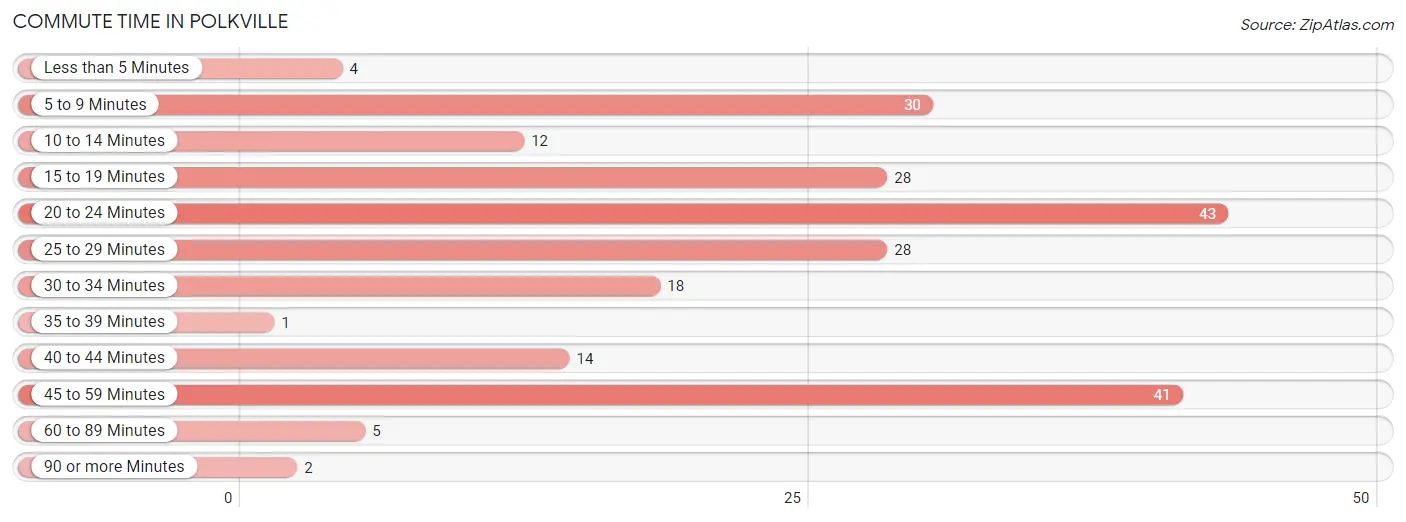
| Commute Time | # Commuters | % Commuters |
| Less than 5 Minutes | 4 | 1.8% |
| 5 to 9 Minutes | 30 | 13.3% |
| 10 to 14 Minutes | 12 | 5.3% |
| 15 to 19 Minutes | 28 | 12.4% |
| 20 to 24 Minutes | 43 | 19.0% |
| 25 to 29 Minutes | 28 | 12.4% |
| 30 to 34 Minutes | 18 | 8.0% |
| 35 to 39 Minutes | 1 | 0.4% |
| 40 to 44 Minutes | 14 | 6.2% |
| 45 to 59 Minutes | 41 | 18.1% |
| 60 to 89 Minutes | 5 | 2.2% |
| 90 or more Minutes | 2 | 0.9% |
Commute Time by Sex in Polkville
The most common commute times in Polkville are 5 to 9 minutes (30 commuters, 23.8%) for males and 45 to 59 minutes (36 commuters, 36.0%) for females.
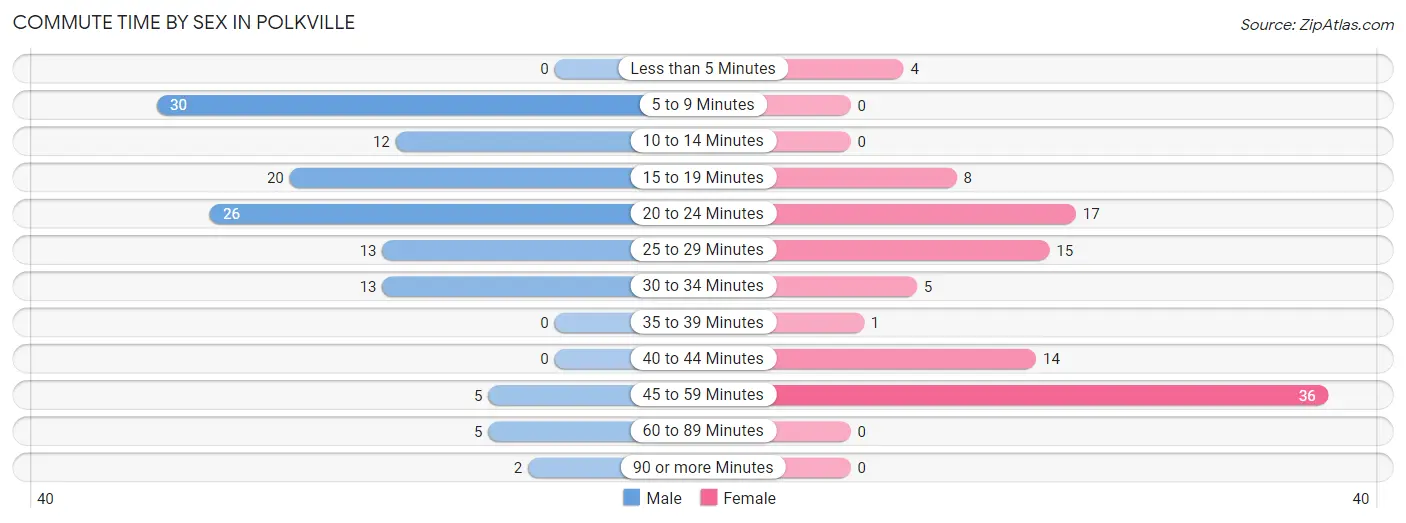
| Commute Time | Male | Female |
| Less than 5 Minutes | 0 (0.0%) | 4 (4.0%) |
| 5 to 9 Minutes | 30 (23.8%) | 0 (0.0%) |
| 10 to 14 Minutes | 12 (9.5%) | 0 (0.0%) |
| 15 to 19 Minutes | 20 (15.9%) | 8 (8.0%) |
| 20 to 24 Minutes | 26 (20.6%) | 17 (17.0%) |
| 25 to 29 Minutes | 13 (10.3%) | 15 (15.0%) |
| 30 to 34 Minutes | 13 (10.3%) | 5 (5.0%) |
| 35 to 39 Minutes | 0 (0.0%) | 1 (1.0%) |
| 40 to 44 Minutes | 0 (0.0%) | 14 (14.0%) |
| 45 to 59 Minutes | 5 (4.0%) | 36 (36.0%) |
| 60 to 89 Minutes | 5 (4.0%) | 0 (0.0%) |
| 90 or more Minutes | 2 (1.6%) | 0 (0.0%) |
Time of Departure to Work by Sex in Polkville
The most frequent times of departure to work in Polkville are 7:30 AM to 7:59 AM (23, 18.2%) for males and 7:00 AM to 7:29 AM (50, 50.0%) for females.
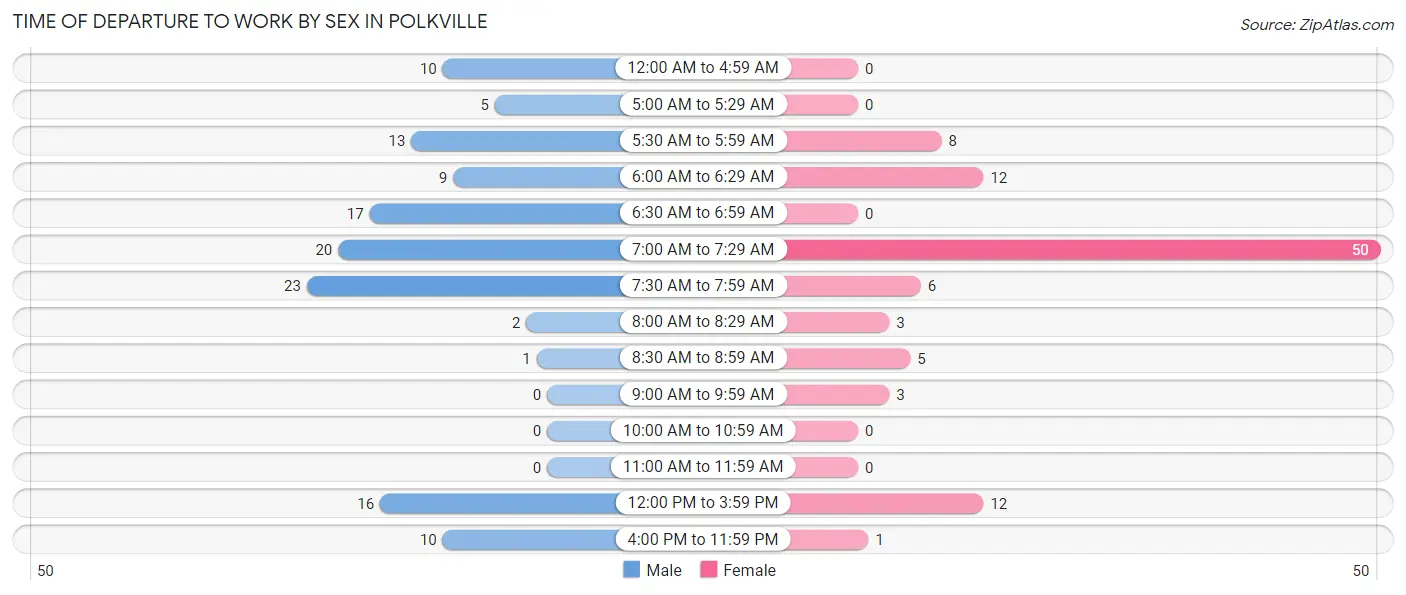
| Time of Departure | Male | Female |
| 12:00 AM to 4:59 AM | 10 (7.9%) | 0 (0.0%) |
| 5:00 AM to 5:29 AM | 5 (4.0%) | 0 (0.0%) |
| 5:30 AM to 5:59 AM | 13 (10.3%) | 8 (8.0%) |
| 6:00 AM to 6:29 AM | 9 (7.1%) | 12 (12.0%) |
| 6:30 AM to 6:59 AM | 17 (13.5%) | 0 (0.0%) |
| 7:00 AM to 7:29 AM | 20 (15.9%) | 50 (50.0%) |
| 7:30 AM to 7:59 AM | 23 (18.2%) | 6 (6.0%) |
| 8:00 AM to 8:29 AM | 2 (1.6%) | 3 (3.0%) |
| 8:30 AM to 8:59 AM | 1 (0.8%) | 5 (5.0%) |
| 9:00 AM to 9:59 AM | 0 (0.0%) | 3 (3.0%) |
| 10:00 AM to 10:59 AM | 0 (0.0%) | 0 (0.0%) |
| 11:00 AM to 11:59 AM | 0 (0.0%) | 0 (0.0%) |
| 12:00 PM to 3:59 PM | 16 (12.7%) | 12 (12.0%) |
| 4:00 PM to 11:59 PM | 10 (7.9%) | 1 (1.0%) |
| Total | 126 (100.0%) | 100 (100.0%) |
Housing Occupancy in Polkville
Occupancy by Ownership in Polkville
Of the total 191 dwellings in Polkville, owner-occupied units account for 146 (76.4%), while renter-occupied units make up 45 (23.6%).
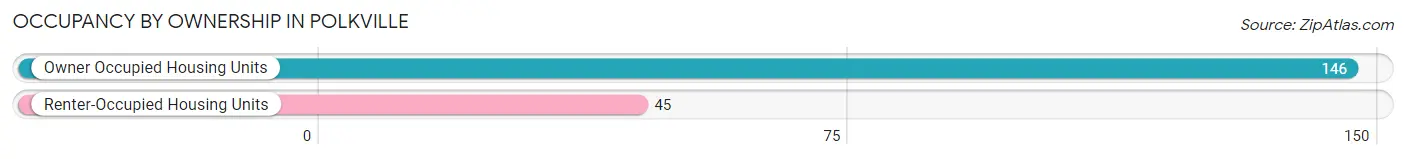
| Occupancy | # Housing Units | % Housing Units |
| Owner Occupied Housing Units | 146 | 76.4% |
| Renter-Occupied Housing Units | 45 | 23.6% |
| Total Occupied Housing Units | 191 | 100.0% |
Occupancy by Household Size in Polkville
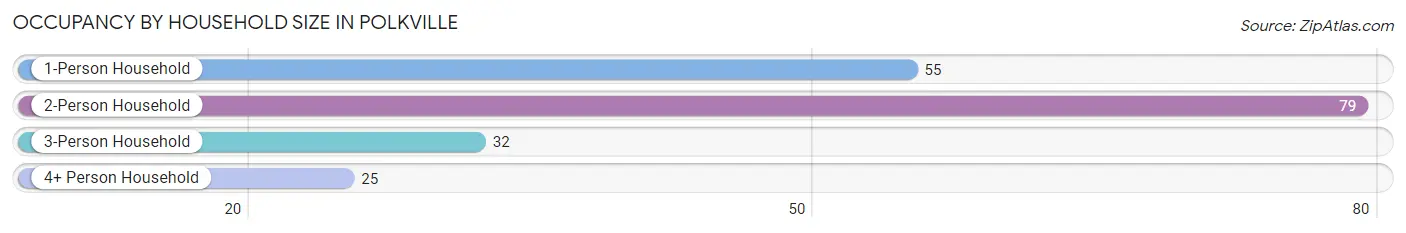
| Household Size | # Housing Units | % Housing Units |
| 1-Person Household | 55 | 28.8% |
| 2-Person Household | 79 | 41.4% |
| 3-Person Household | 32 | 16.8% |
| 4+ Person Household | 25 | 13.1% |
| Total Housing Units | 191 | 100.0% |
Occupancy by Ownership by Household Size in Polkville
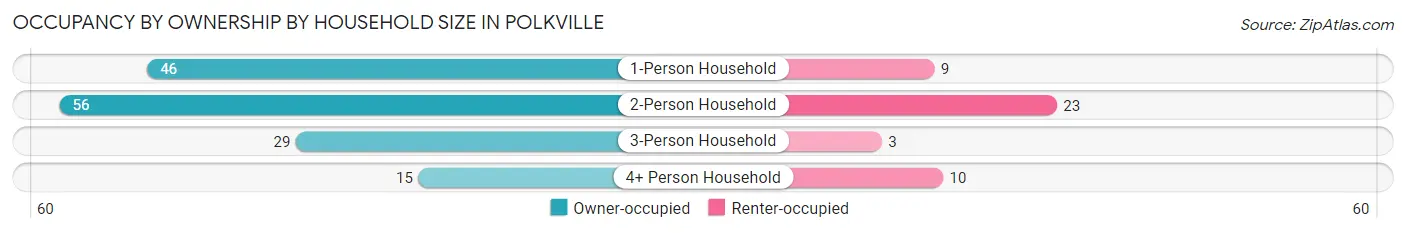
| Household Size | Owner-occupied | Renter-occupied |
| 1-Person Household | 46 (83.6%) | 9 (16.4%) |
| 2-Person Household | 56 (70.9%) | 23 (29.1%) |
| 3-Person Household | 29 (90.6%) | 3 (9.4%) |
| 4+ Person Household | 15 (60.0%) | 10 (40.0%) |
| Total Housing Units | 146 (76.4%) | 45 (23.6%) |
Occupancy by Educational Attainment in Polkville
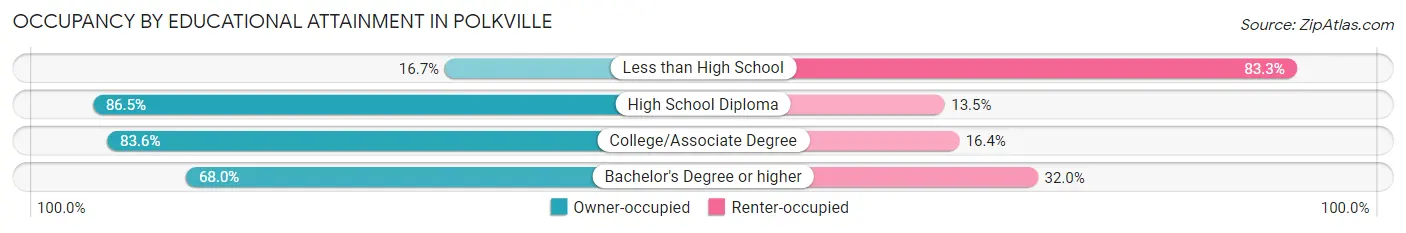
| Household Size | Owner-occupied | Renter-occupied |
| Less than High School | 2 (16.7%) | 10 (83.3%) |
| High School Diploma | 64 (86.5%) | 10 (13.5%) |
| College/Associate Degree | 46 (83.6%) | 9 (16.4%) |
| Bachelor's Degree or higher | 34 (68.0%) | 16 (32.0%) |
Occupancy by Age of Householder in Polkville
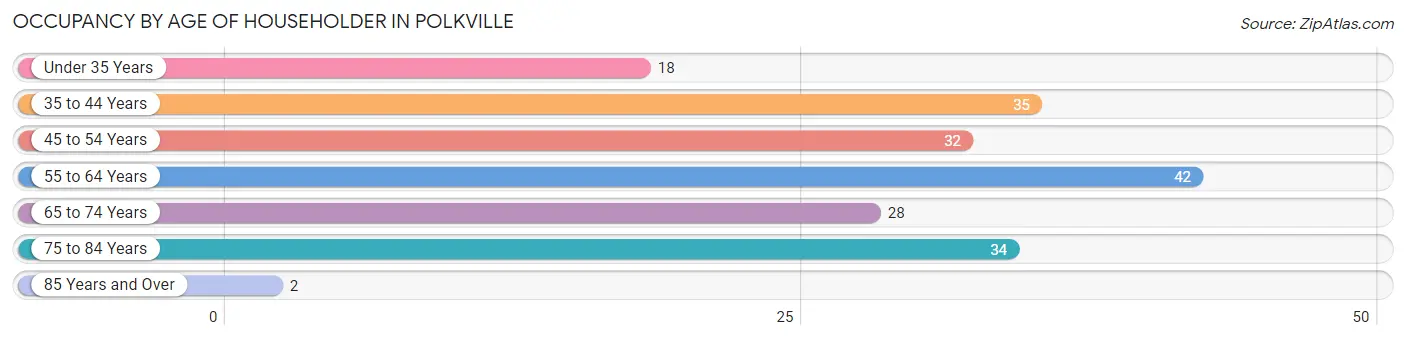
| Age Bracket | # Households | % Households |
| Under 35 Years | 18 | 9.4% |
| 35 to 44 Years | 35 | 18.3% |
| 45 to 54 Years | 32 | 16.8% |
| 55 to 64 Years | 42 | 22.0% |
| 65 to 74 Years | 28 | 14.7% |
| 75 to 84 Years | 34 | 17.8% |
| 85 Years and Over | 2 | 1.1% |
| Total | 191 | 100.0% |
Housing Finances in Polkville
Median Income by Occupancy in Polkville
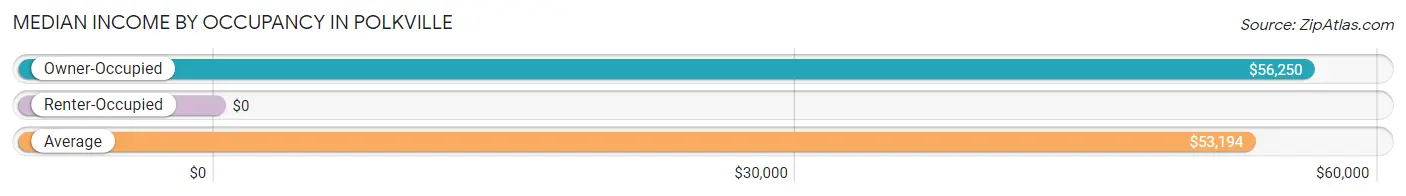
| Occupancy Type | # Households | Median Income |
| Owner-Occupied | 146 (76.4%) | $56,250 |
| Renter-Occupied | 45 (23.6%) | $0 |
| Average | 191 (100.0%) | $53,194 |
Occupancy by Householder Income Bracket in Polkville
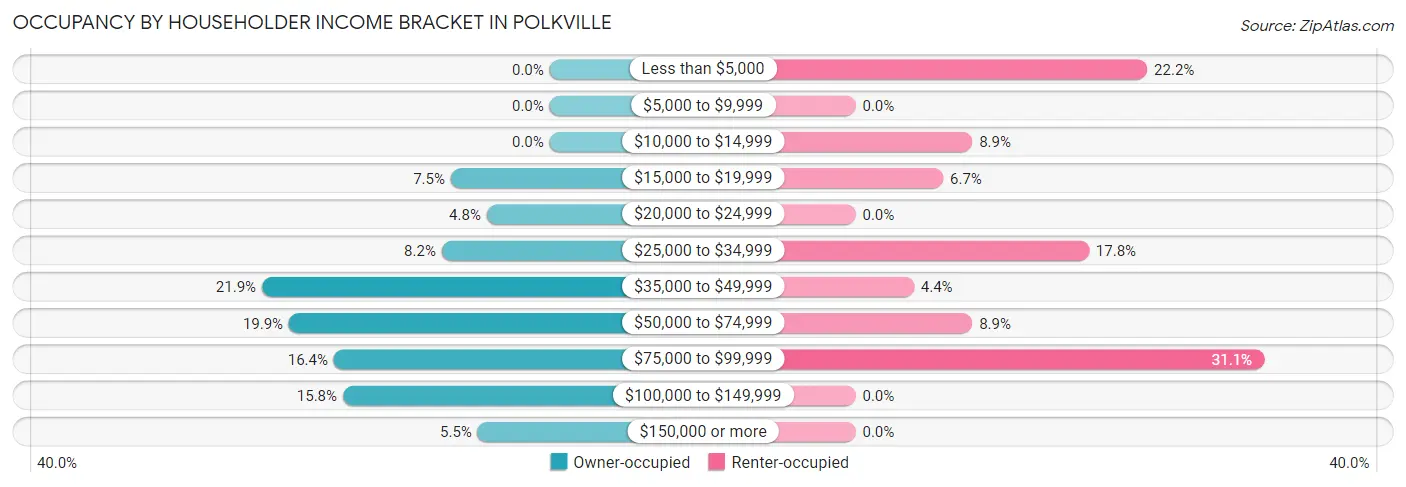
| Income Bracket | Owner-occupied | Renter-occupied |
| Less than $5,000 | 0 (0.0%) | 10 (22.2%) |
| $5,000 to $9,999 | 0 (0.0%) | 0 (0.0%) |
| $10,000 to $14,999 | 0 (0.0%) | 4 (8.9%) |
| $15,000 to $19,999 | 11 (7.5%) | 3 (6.7%) |
| $20,000 to $24,999 | 7 (4.8%) | 0 (0.0%) |
| $25,000 to $34,999 | 12 (8.2%) | 8 (17.8%) |
| $35,000 to $49,999 | 32 (21.9%) | 2 (4.4%) |
| $50,000 to $74,999 | 29 (19.9%) | 4 (8.9%) |
| $75,000 to $99,999 | 24 (16.4%) | 14 (31.1%) |
| $100,000 to $149,999 | 23 (15.8%) | 0 (0.0%) |
| $150,000 or more | 8 (5.5%) | 0 (0.0%) |
| Total | 146 (100.0%) | 45 (100.0%) |
Monthly Housing Cost Tiers in Polkville
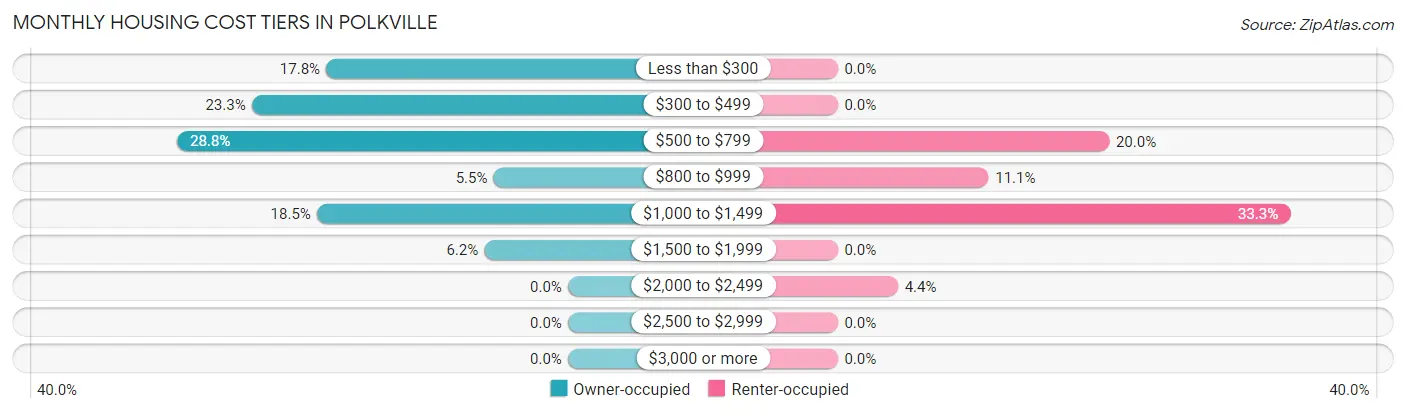
| Monthly Cost | Owner-occupied | Renter-occupied |
| Less than $300 | 26 (17.8%) | 0 (0.0%) |
| $300 to $499 | 34 (23.3%) | 0 (0.0%) |
| $500 to $799 | 42 (28.8%) | 9 (20.0%) |
| $800 to $999 | 8 (5.5%) | 5 (11.1%) |
| $1,000 to $1,499 | 27 (18.5%) | 15 (33.3%) |
| $1,500 to $1,999 | 9 (6.2%) | 0 (0.0%) |
| $2,000 to $2,499 | 0 (0.0%) | 2 (4.4%) |
| $2,500 to $2,999 | 0 (0.0%) | 0 (0.0%) |
| $3,000 or more | 0 (0.0%) | 0 (0.0%) |
| Total | 146 (100.0%) | 45 (100.0%) |
Physical Housing Characteristics in Polkville
Housing Structures in Polkville
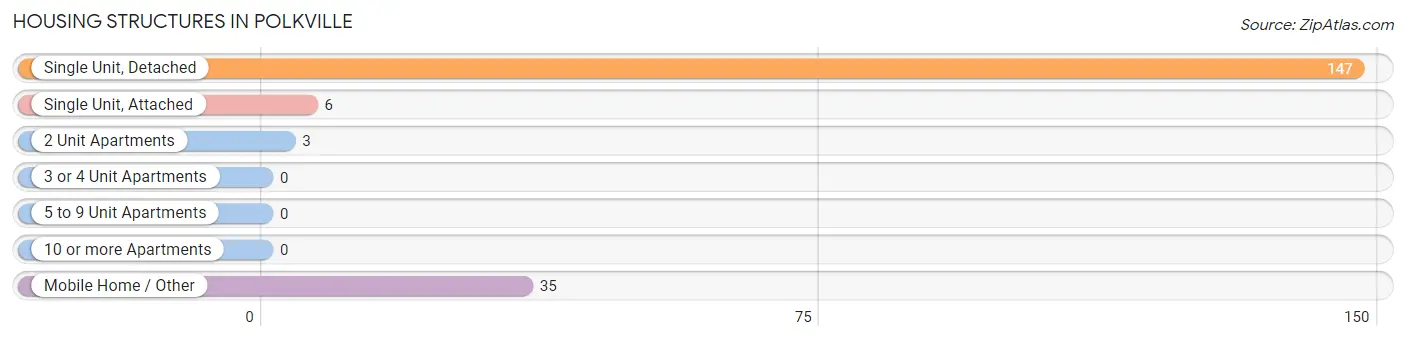
| Structure Type | # Housing Units | % Housing Units |
| Single Unit, Detached | 147 | 77.0% |
| Single Unit, Attached | 6 | 3.1% |
| 2 Unit Apartments | 3 | 1.6% |
| 3 or 4 Unit Apartments | 0 | 0.0% |
| 5 to 9 Unit Apartments | 0 | 0.0% |
| 10 or more Apartments | 0 | 0.0% |
| Mobile Home / Other | 35 | 18.3% |
| Total | 191 | 100.0% |
Housing Structures by Occupancy in Polkville
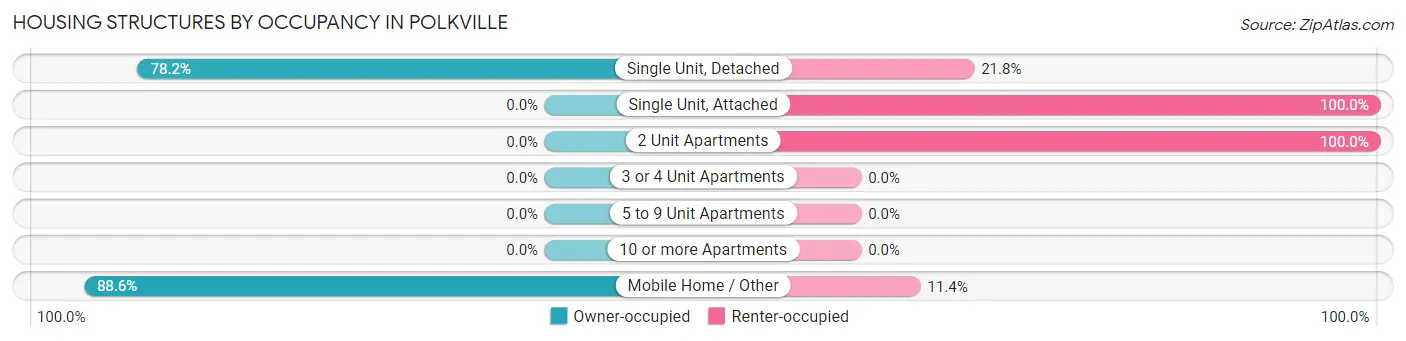
| Structure Type | Owner-occupied | Renter-occupied |
| Single Unit, Detached | 115 (78.2%) | 32 (21.8%) |
| Single Unit, Attached | 0 (0.0%) | 6 (100.0%) |
| 2 Unit Apartments | 0 (0.0%) | 3 (100.0%) |
| 3 or 4 Unit Apartments | 0 (0.0%) | 0 (0.0%) |
| 5 to 9 Unit Apartments | 0 (0.0%) | 0 (0.0%) |
| 10 or more Apartments | 0 (0.0%) | 0 (0.0%) |
| Mobile Home / Other | 31 (88.6%) | 4 (11.4%) |
| Total | 146 (76.4%) | 45 (23.6%) |
Housing Structures by Number of Rooms in Polkville
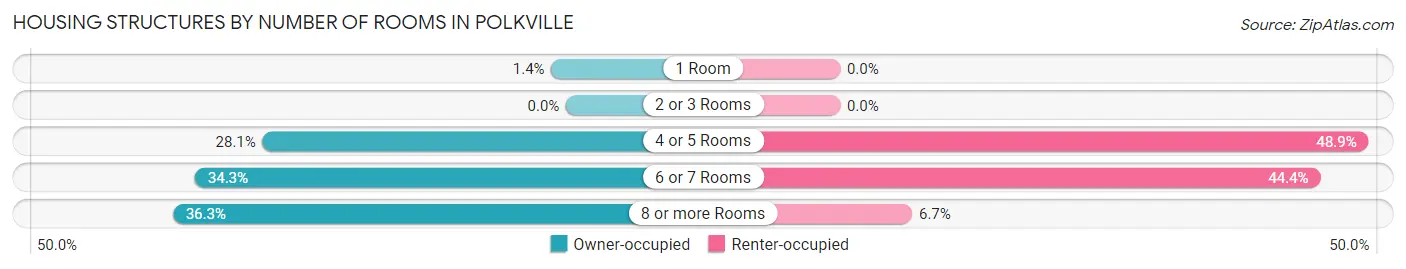
| Number of Rooms | Owner-occupied | Renter-occupied |
| 1 Room | 2 (1.4%) | 0 (0.0%) |
| 2 or 3 Rooms | 0 (0.0%) | 0 (0.0%) |
| 4 or 5 Rooms | 41 (28.1%) | 22 (48.9%) |
| 6 or 7 Rooms | 50 (34.3%) | 20 (44.4%) |
| 8 or more Rooms | 53 (36.3%) | 3 (6.7%) |
| Total | 146 (100.0%) | 45 (100.0%) |
Housing Structure by Heating Type in Polkville
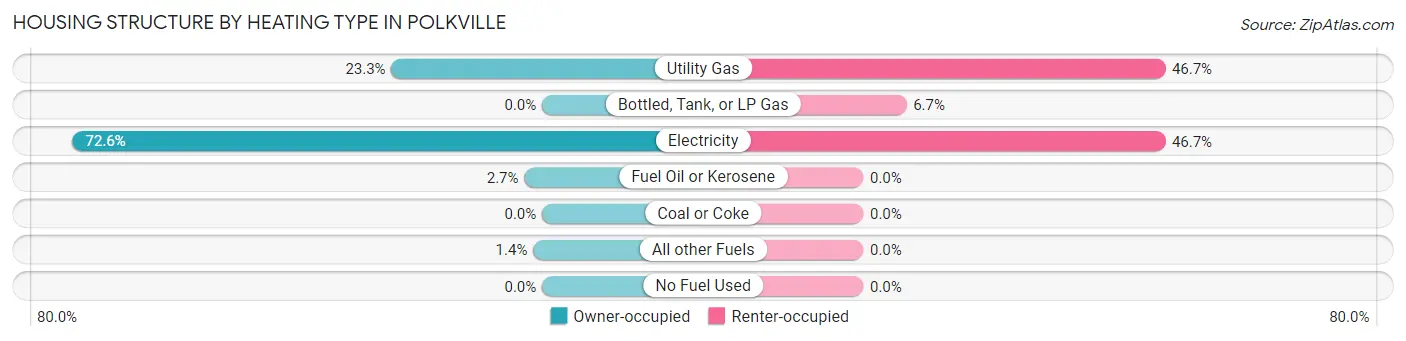
| Heating Type | Owner-occupied | Renter-occupied |
| Utility Gas | 34 (23.3%) | 21 (46.7%) |
| Bottled, Tank, or LP Gas | 0 (0.0%) | 3 (6.7%) |
| Electricity | 106 (72.6%) | 21 (46.7%) |
| Fuel Oil or Kerosene | 4 (2.7%) | 0 (0.0%) |
| Coal or Coke | 0 (0.0%) | 0 (0.0%) |
| All other Fuels | 2 (1.4%) | 0 (0.0%) |
| No Fuel Used | 0 (0.0%) | 0 (0.0%) |
| Total | 146 (100.0%) | 45 (100.0%) |
Household Vehicle Usage in Polkville
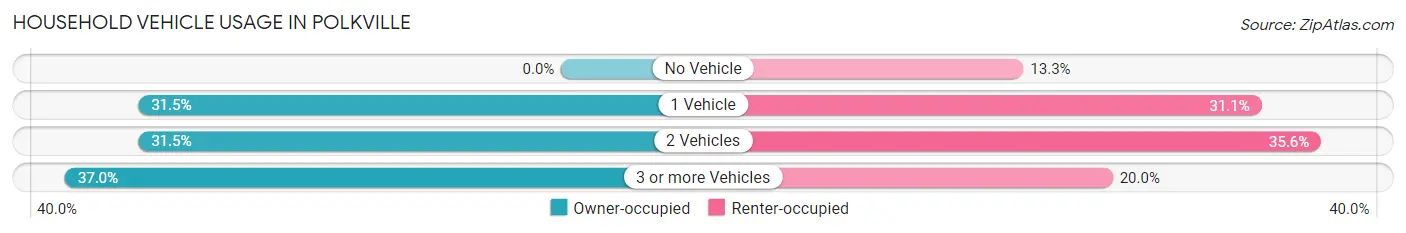
| Vehicles per Household | Owner-occupied | Renter-occupied |
| No Vehicle | 0 (0.0%) | 6 (13.3%) |
| 1 Vehicle | 46 (31.5%) | 14 (31.1%) |
| 2 Vehicles | 46 (31.5%) | 16 (35.6%) |
| 3 or more Vehicles | 54 (37.0%) | 9 (20.0%) |
| Total | 146 (100.0%) | 45 (100.0%) |
Real Estate & Mortgages in Polkville
Real Estate and Mortgage Overview in Polkville
| Characteristic | Without Mortgage | With Mortgage |
| Housing Units | 81 | 65 |
| Median Property Value | $105,500 | $162,500 |
| Median Household Income | $49,464 | $5 |
| Monthly Housing Costs | $336 | $0 |
| Real Estate Taxes | $1,000 | $0 |
Property Value by Mortgage Status in Polkville
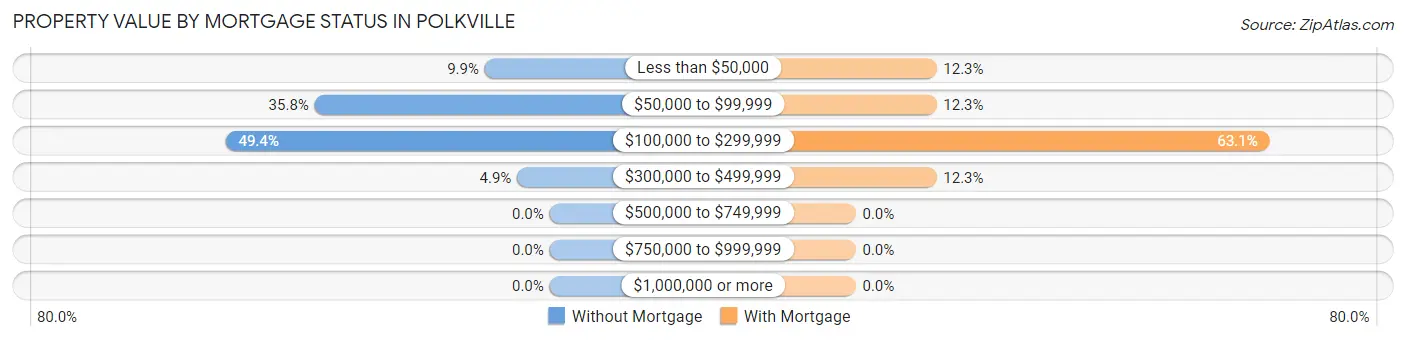
| Property Value | Without Mortgage | With Mortgage |
| Less than $50,000 | 8 (9.9%) | 8 (12.3%) |
| $50,000 to $99,999 | 29 (35.8%) | 8 (12.3%) |
| $100,000 to $299,999 | 40 (49.4%) | 41 (63.1%) |
| $300,000 to $499,999 | 4 (4.9%) | 8 (12.3%) |
| $500,000 to $749,999 | 0 (0.0%) | 0 (0.0%) |
| $750,000 to $999,999 | 0 (0.0%) | 0 (0.0%) |
| $1,000,000 or more | 0 (0.0%) | 0 (0.0%) |
| Total | 81 (100.0%) | 65 (100.0%) |
Household Income by Mortgage Status in Polkville
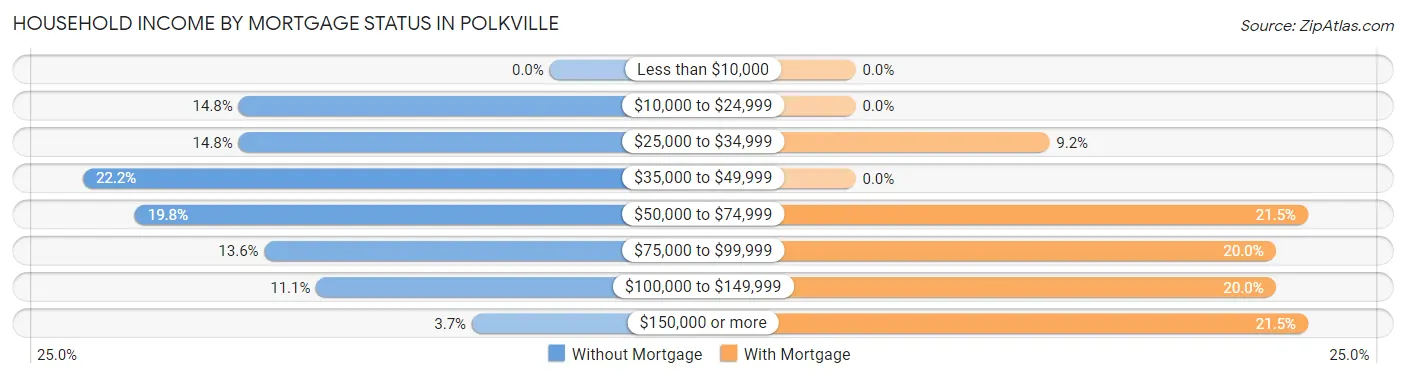
| Household Income | Without Mortgage | With Mortgage |
| Less than $10,000 | 0 (0.0%) | 0 (0.0%) |
| $10,000 to $24,999 | 12 (14.8%) | 0 (0.0%) |
| $25,000 to $34,999 | 12 (14.8%) | 6 (9.2%) |
| $35,000 to $49,999 | 18 (22.2%) | 0 (0.0%) |
| $50,000 to $74,999 | 16 (19.8%) | 14 (21.5%) |
| $75,000 to $99,999 | 11 (13.6%) | 13 (20.0%) |
| $100,000 to $149,999 | 9 (11.1%) | 13 (20.0%) |
| $150,000 or more | 3 (3.7%) | 14 (21.5%) |
| Total | 81 (100.0%) | 65 (100.0%) |
Property Value to Household Income Ratio in Polkville
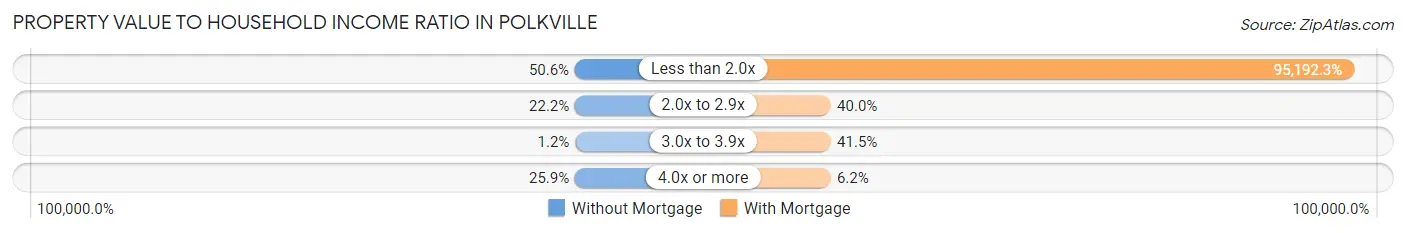
| Value-to-Income Ratio | Without Mortgage | With Mortgage |
| Less than 2.0x | 41 (50.6%) | 61,875 (95,192.3%) |
| 2.0x to 2.9x | 18 (22.2%) | 26 (40.0%) |
| 3.0x to 3.9x | 1 (1.2%) | 27 (41.5%) |
| 4.0x or more | 21 (25.9%) | 4 (6.1%) |
| Total | 81 (100.0%) | 65 (100.0%) |
Real Estate Taxes by Mortgage Status in Polkville
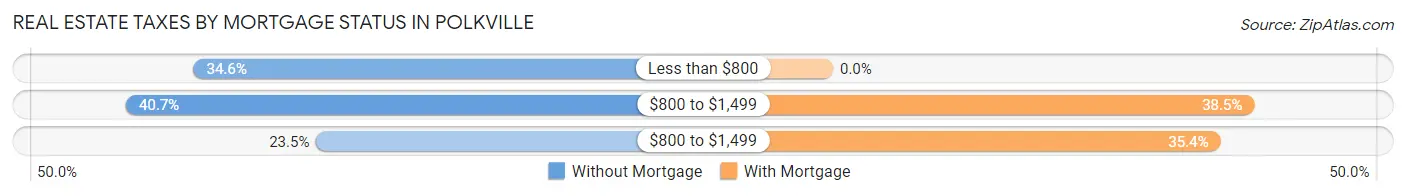
| Property Taxes | Without Mortgage | With Mortgage |
| Less than $800 | 28 (34.6%) | 0 (0.0%) |
| $800 to $1,499 | 33 (40.7%) | 25 (38.5%) |
| $800 to $1,499 | 19 (23.5%) | 23 (35.4%) |
| Total | 81 (100.0%) | 65 (100.0%) |
Health & Disability in Polkville
Health Insurance Coverage by Age in Polkville
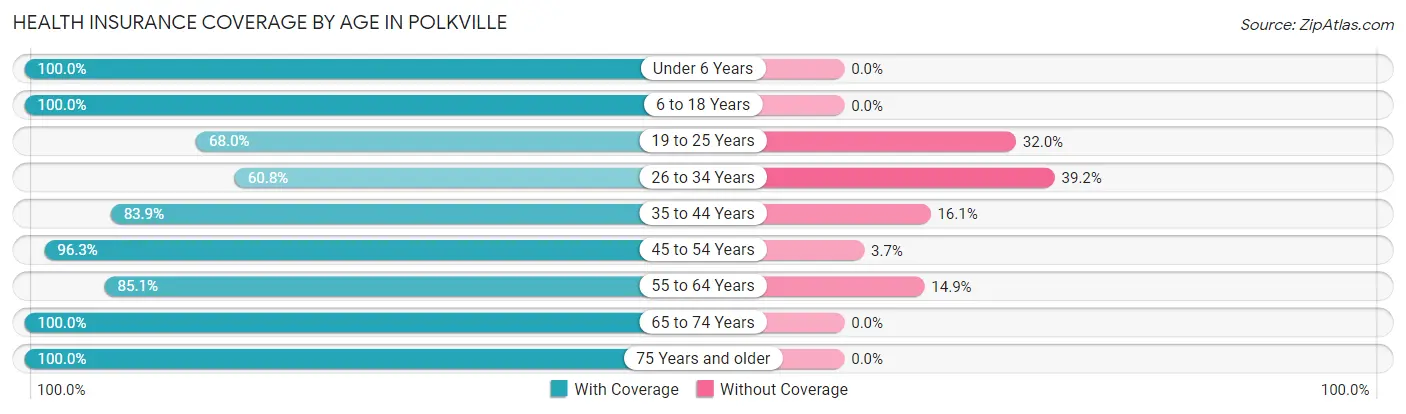
| Age Bracket | With Coverage | Without Coverage |
| Under 6 Years | 31 (100.0%) | 0 (0.0%) |
| 6 to 18 Years | 71 (100.0%) | 0 (0.0%) |
| 19 to 25 Years | 17 (68.0%) | 8 (32.0%) |
| 26 to 34 Years | 31 (60.8%) | 20 (39.2%) |
| 35 to 44 Years | 47 (83.9%) | 9 (16.1%) |
| 45 to 54 Years | 78 (96.3%) | 3 (3.7%) |
| 55 to 64 Years | 74 (85.1%) | 13 (14.9%) |
| 65 to 74 Years | 41 (100.0%) | 0 (0.0%) |
| 75 Years and older | 57 (100.0%) | 0 (0.0%) |
| Total | 447 (89.4%) | 53 (10.6%) |
Health Insurance Coverage by Citizenship Status in Polkville

| Citizenship Status | With Coverage | Without Coverage |
| Native Born | 31 (100.0%) | 0 (0.0%) |
| Foreign Born, Citizen | 71 (100.0%) | 0 (0.0%) |
| Foreign Born, not a Citizen | 17 (68.0%) | 8 (32.0%) |
Health Insurance Coverage by Household Income in Polkville
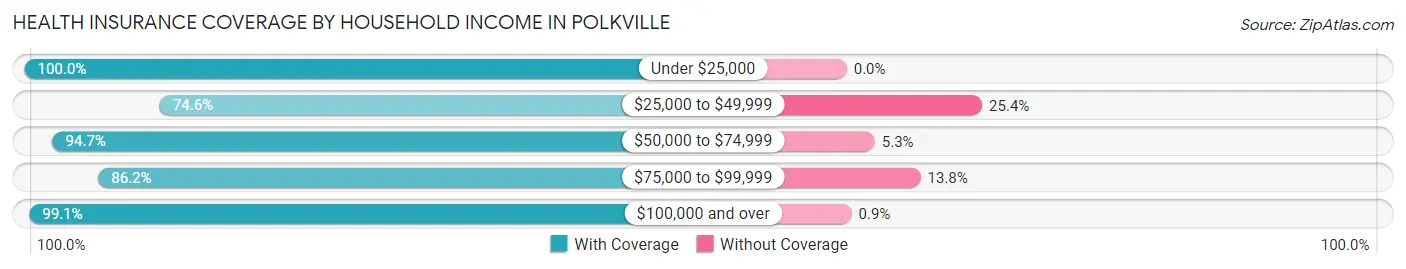
| Household Income | With Coverage | Without Coverage |
| Under $25,000 | 81 (100.0%) | 0 (0.0%) |
| $25,000 to $49,999 | 103 (74.6%) | 35 (25.4%) |
| $50,000 to $74,999 | 72 (94.7%) | 4 (5.3%) |
| $75,000 to $99,999 | 81 (86.2%) | 13 (13.8%) |
| $100,000 and over | 110 (99.1%) | 1 (0.9%) |
Public vs Private Health Insurance Coverage by Age in Polkville
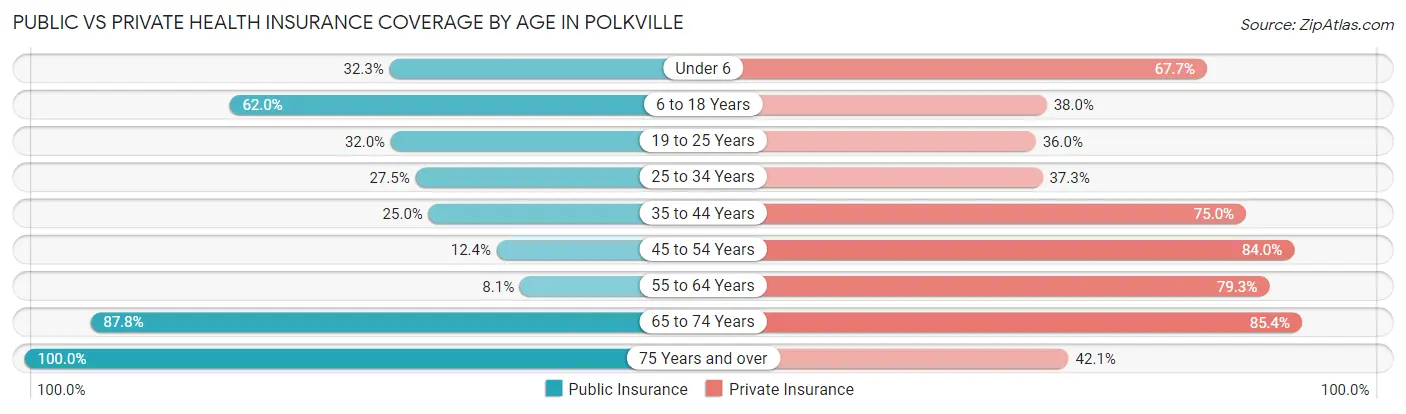
| Age Bracket | Public Insurance | Private Insurance |
| Under 6 | 10 (32.3%) | 21 (67.7%) |
| 6 to 18 Years | 44 (62.0%) | 27 (38.0%) |
| 19 to 25 Years | 8 (32.0%) | 9 (36.0%) |
| 25 to 34 Years | 14 (27.5%) | 19 (37.2%) |
| 35 to 44 Years | 14 (25.0%) | 42 (75.0%) |
| 45 to 54 Years | 10 (12.3%) | 68 (84.0%) |
| 55 to 64 Years | 7 (8.1%) | 69 (79.3%) |
| 65 to 74 Years | 36 (87.8%) | 35 (85.4%) |
| 75 Years and over | 57 (100.0%) | 24 (42.1%) |
| Total | 200 (40.0%) | 314 (62.8%) |
Disability Status by Sex by Age in Polkville
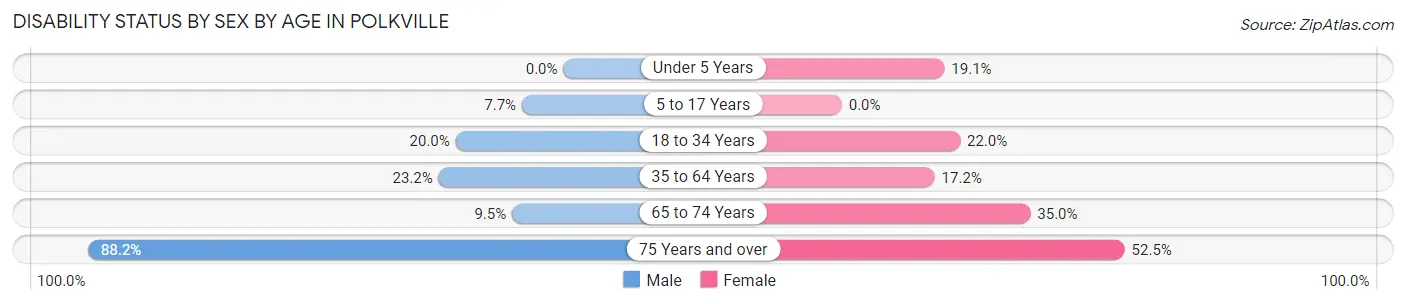
| Age Bracket | Male | Female |
| Under 5 Years | 0 (0.0%) | 4 (19.1%) |
| 5 to 17 Years | 4 (7.7%) | 0 (0.0%) |
| 18 to 34 Years | 7 (20.0%) | 9 (22.0%) |
| 35 to 64 Years | 25 (23.2%) | 20 (17.2%) |
| 65 to 74 Years | 2 (9.5%) | 7 (35.0%) |
| 75 Years and over | 15 (88.2%) | 21 (52.5%) |
Disability Class by Sex by Age in Polkville
Disability Class: Hearing Difficulty
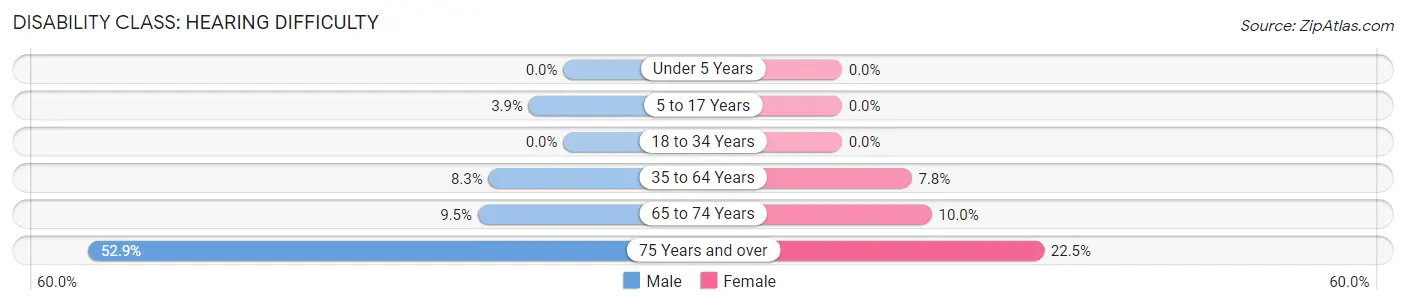
| Age Bracket | Male | Female |
| Under 5 Years | 0 (0.0%) | 0 (0.0%) |
| 5 to 17 Years | 2 (3.8%) | 0 (0.0%) |
| 18 to 34 Years | 0 (0.0%) | 0 (0.0%) |
| 35 to 64 Years | 9 (8.3%) | 9 (7.8%) |
| 65 to 74 Years | 2 (9.5%) | 2 (10.0%) |
| 75 Years and over | 9 (52.9%) | 9 (22.5%) |
Disability Class: Vision Difficulty
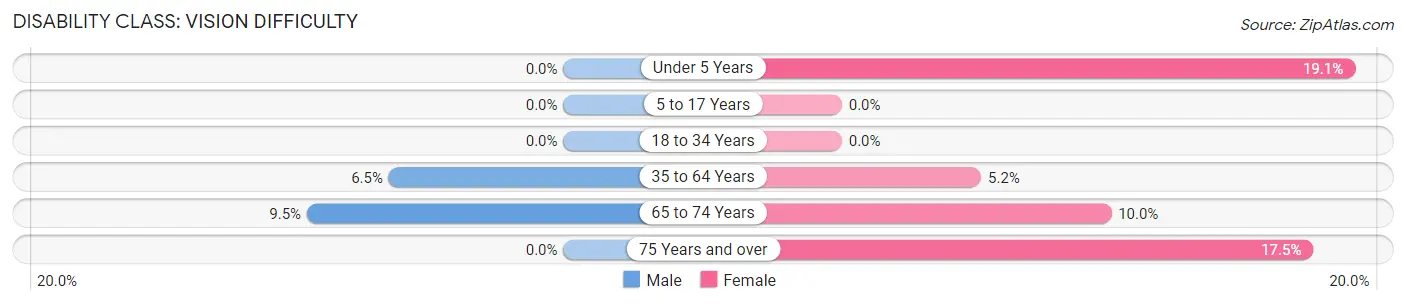
| Age Bracket | Male | Female |
| Under 5 Years | 0 (0.0%) | 4 (19.1%) |
| 5 to 17 Years | 0 (0.0%) | 0 (0.0%) |
| 18 to 34 Years | 0 (0.0%) | 0 (0.0%) |
| 35 to 64 Years | 7 (6.5%) | 6 (5.2%) |
| 65 to 74 Years | 2 (9.5%) | 2 (10.0%) |
| 75 Years and over | 0 (0.0%) | 7 (17.5%) |
Disability Class: Cognitive Difficulty
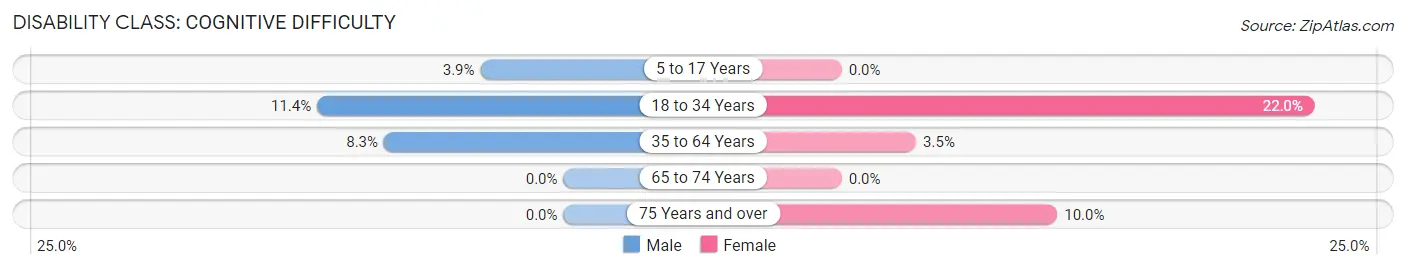
| Age Bracket | Male | Female |
| 5 to 17 Years | 2 (3.8%) | 0 (0.0%) |
| 18 to 34 Years | 4 (11.4%) | 9 (22.0%) |
| 35 to 64 Years | 9 (8.3%) | 4 (3.5%) |
| 65 to 74 Years | 0 (0.0%) | 0 (0.0%) |
| 75 Years and over | 0 (0.0%) | 4 (10.0%) |
Disability Class: Ambulatory Difficulty
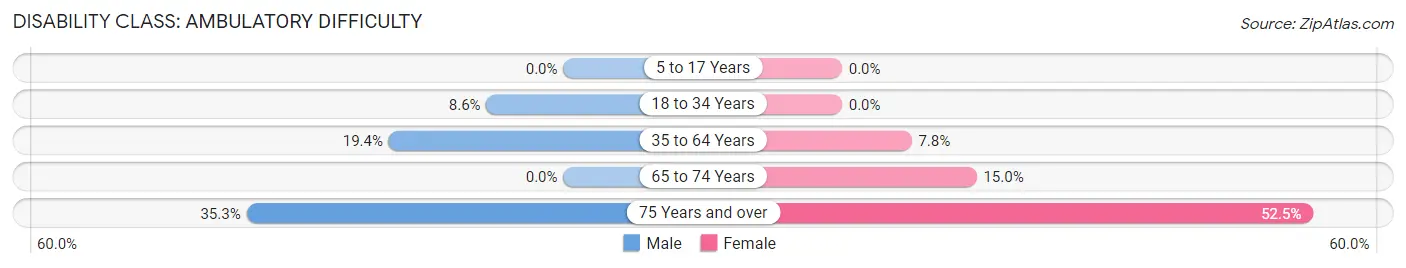
| Age Bracket | Male | Female |
| 5 to 17 Years | 0 (0.0%) | 0 (0.0%) |
| 18 to 34 Years | 3 (8.6%) | 0 (0.0%) |
| 35 to 64 Years | 21 (19.4%) | 9 (7.8%) |
| 65 to 74 Years | 0 (0.0%) | 3 (15.0%) |
| 75 Years and over | 6 (35.3%) | 21 (52.5%) |
Disability Class: Self-Care Difficulty
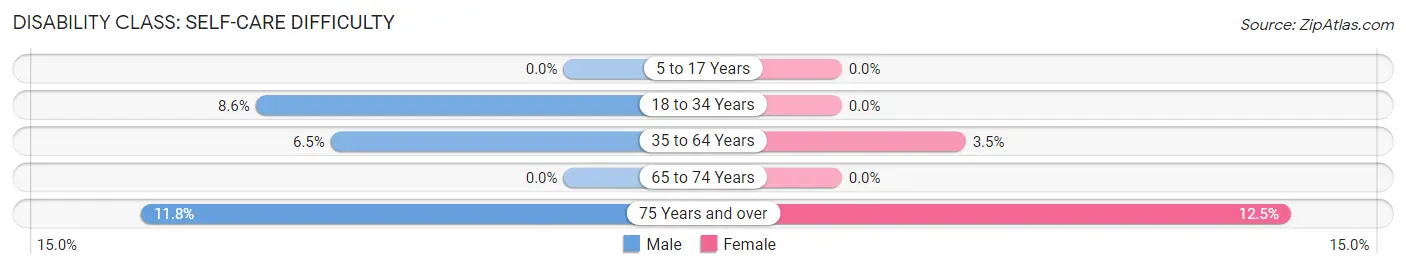
| Age Bracket | Male | Female |
| 5 to 17 Years | 0 (0.0%) | 0 (0.0%) |
| 18 to 34 Years | 3 (8.6%) | 0 (0.0%) |
| 35 to 64 Years | 7 (6.5%) | 4 (3.5%) |
| 65 to 74 Years | 0 (0.0%) | 0 (0.0%) |
| 75 Years and over | 2 (11.8%) | 5 (12.5%) |
Technology Access in Polkville
Computing Device Access in Polkville
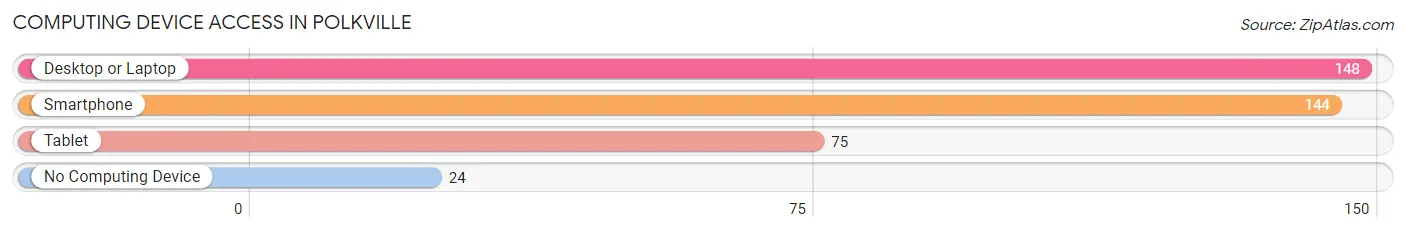
| Device Type | # Households | % Households |
| Desktop or Laptop | 148 | 77.5% |
| Smartphone | 144 | 75.4% |
| Tablet | 75 | 39.3% |
| No Computing Device | 24 | 12.6% |
| Total | 191 | 100.0% |
Internet Access in Polkville
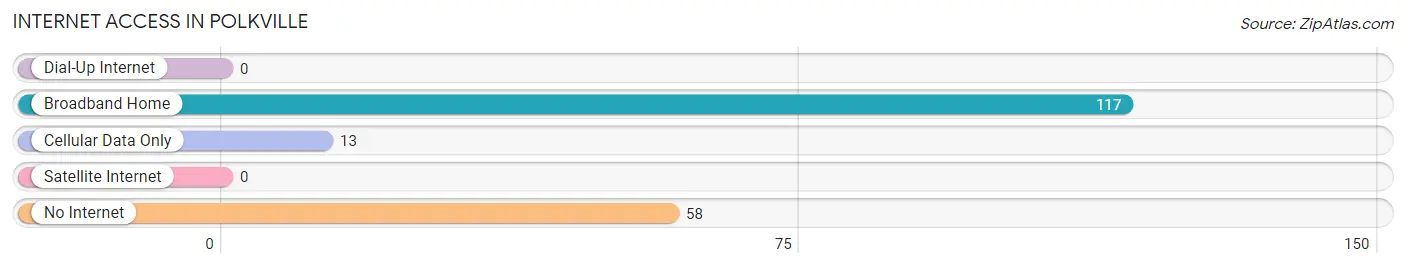
| Internet Type | # Households | % Households |
| Dial-Up Internet | 0 | 0.0% |
| Broadband Home | 117 | 61.3% |
| Cellular Data Only | 13 | 6.8% |
| Satellite Internet | 0 | 0.0% |
| No Internet | 58 | 30.4% |
| Total | 191 | 100.0% |
Polkville Summary
Polkville, North Carolina is a small town located in Cleveland County, in the foothills of the Blue Ridge Mountains. The town was founded in 1887 and is named after James K. Polk, the 11th President of the United States. The town is located approximately 25 miles southeast of Charlotte and is part of the Hickory-Lenoir-Morganton Metropolitan Statistical Area.
Geography
Polkville is located in the foothills of the Blue Ridge Mountains, in the Piedmont region of North Carolina. The town is situated at an elevation of 890 feet above sea level. The town is located in the Catawba River Valley, which is part of the larger Yadkin-Pee Dee River Basin. The town is located in the eastern part of Cleveland County, and is bordered by the towns of Lawndale, Kings Mountain, and Shelby. The town is located approximately 25 miles southeast of Charlotte.
The climate in Polkville is humid subtropical, with hot, humid summers and mild winters. The average annual temperature is around 61°F, with an average high of 79°F in July and an average low of 43°F in January. The average annual precipitation is around 45 inches, with the wettest month being July, with an average of 5.5 inches of rain.
Demographics
As of the 2010 census, the population of Polkville was 1,845. The racial makeup of the town was 91.3% White, 6.2% African American, 0.3% Native American, 0.3% Asian, 0.2% from other races, and 1.7% from two or more races. Hispanic or Latino of any race were 1.2% of the population.
The median household income in Polkville was $37,917, and the median family income was $45,938. The per capita income was $19,845. About 11.3% of families and 14.2% of the population were below the poverty line, including 18.2% of those under age 18 and 11.2% of those age 65 or over.
Economy
The economy of Polkville is largely based on agriculture and manufacturing. The town is home to several small businesses, including a grocery store, a hardware store, and a few restaurants. The town is also home to a number of small farms, which produce a variety of crops, including corn, soybeans, and tobacco.
The town is also home to several manufacturing companies, including a furniture manufacturer, a textile mill, and a plastics manufacturer. The town is also home to a number of small retail stores, including a few antique stores.
History
Polkville was founded in 1887 and was named after James K. Polk, the 11th President of the United States. The town was originally a small farming community, and the first post office was established in 1887. The town grew slowly over the years, and by the early 1900s, the town had a population of around 500 people.
In the early 1900s, the town began to experience a period of growth, as the town became a popular destination for tourists. The town was home to several hotels, and the town was also home to a number of small businesses, including a grocery store, a hardware store, and a few restaurants.
In the 1950s, the town began to experience a period of decline, as the town's economy shifted away from agriculture and manufacturing. The town's population began to decline, and by the 2000 census, the population had dropped to 1,845.
Today, Polkville is a small town with a population of around 1,845 people. The town is home to several small businesses, including a grocery store, a hardware store, and a few restaurants. The town is also home to a number of small farms, which produce a variety of crops, including corn, soybeans, and tobacco. The town is also home to several manufacturing companies, including a furniture manufacturer, a textile mill, and a plastics manufacturer. The town is also home to a number of small retail stores, including a few antique stores.
Common Questions
What is Per Capita Income in Polkville?
Per Capita income in Polkville is $25,488.
What is the Median Family Income in Polkville?
Median Family Income in Polkville is $62,917.
What is the Median Household income in Polkville?
Median Household Income in Polkville is $53,194.
What is Income or Wage Gap in Polkville?
Income or Wage Gap in Polkville is 10.4%.
Women in Polkville earn 89.6 cents for every dollar earned by a man.
What is Inequality or Gini Index in Polkville?
Inequality or Gini Index in Polkville is 0.37.
What is the Total Population of Polkville?
Total Population of Polkville is 500.
What is the Total Male Population of Polkville?
Total Male Population of Polkville is 238.
What is the Total Female Population of Polkville?
Total Female Population of Polkville is 262.
What is the Ratio of Males per 100 Females in Polkville?
There are 90.84 Males per 100 Females in Polkville.
What is the Ratio of Females per 100 Males in Polkville?
There are 110.08 Females per 100 Males in Polkville.
What is the Median Population Age in Polkville?
Median Population Age in Polkville is 47.4 Years.
What is the Average Family Size in Polkville
Average Family Size in Polkville is 3.3 People.
What is the Average Household Size in Polkville
Average Household Size in Polkville is 2.6 People.
How Large is the Labor Force in Polkville?
There are 249 People in the Labor Forcein in Polkville.
What is the Percentage of People in the Labor Force in Polkville?
59.7% of People are in the Labor Force in Polkville.
What is the Unemployment Rate in Polkville?
Unemployment Rate in Polkville is 4.8%.