Cities with the Highest Percentage of Population Employed in Manufacturing in Maryland
RELATED REPORTS & OPTIONS
Manufacturing
Maryland
Compare Cities
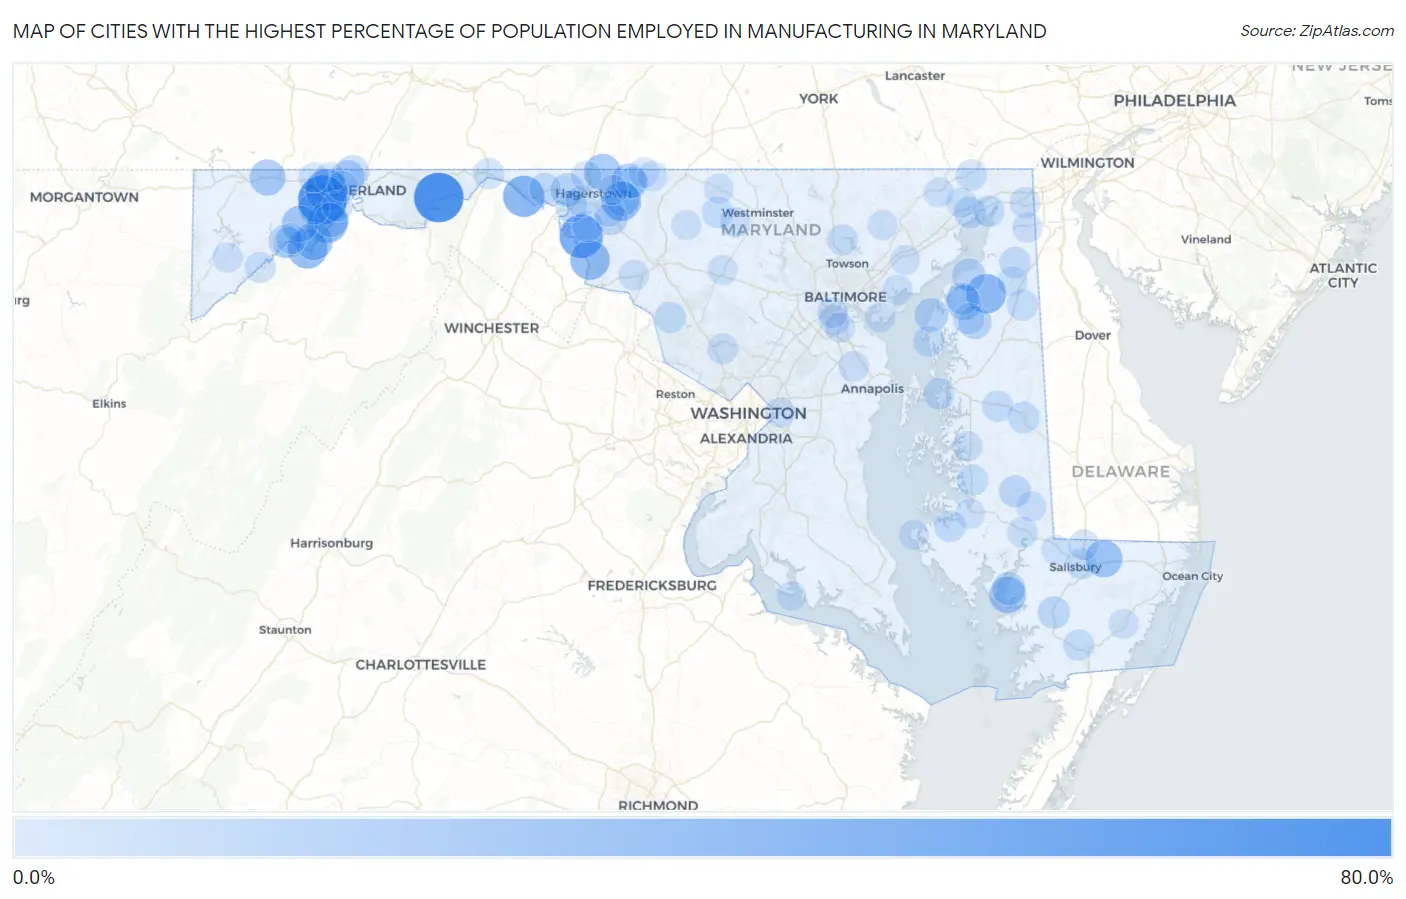
Map of Cities with the Highest Percentage of Population Employed in Manufacturing in Maryland
0.0%
80.0%
Cities with the Highest Percentage of Population Employed in Manufacturing in Maryland
| City | % Employed | vs State | vs National | |
| 1. | Little Orleans | 73.3% | 4.7%(+68.6)#1 | 10.0%(+63.3)#117 |
| 2. | Vale Summit | 70.8% | 4.7%(+66.1)#2 | 10.0%(+60.8)#129 |
| 3. | Mercersville | 52.7% | 4.7%(+48.0)#3 | 10.0%(+42.7)#326 |
| 4. | Eckhart Mines | 46.9% | 4.7%(+42.2)#4 | 10.0%(+36.9)#483 |
| 5. | Ernstville | 45.0% | 4.7%(+40.3)#5 | 10.0%(+35.0)#551 |
| 6. | Rawlings | 42.2% | 4.7%(+37.5)#6 | 10.0%(+32.2)#688 |
| 7. | Kennedyville | 39.2% | 4.7%(+34.5)#7 | 10.0%(+29.2)#883 |
| 8. | Mccoole | 39.0% | 4.7%(+34.3)#8 | 10.0%(+29.0)#900 |
| 9. | Antietam | 38.9% | 4.7%(+34.2)#9 | 10.0%(+28.9)#905 |
| 10. | Jugtown | 37.7% | 4.7%(+33.0)#10 | 10.0%(+27.7)#1,011 |
| 11. | Dawson | 33.3% | 4.7%(+28.6)#11 | 10.0%(+23.3)#1,512 |
| 12. | Parsonsburg | 31.9% | 4.7%(+27.2)#12 | 10.0%(+21.9)#1,724 |
| 13. | Reid | 30.6% | 4.7%(+25.9)#13 | 10.0%(+20.6)#1,970 |
| 14. | Nanticoke | 29.1% | 4.7%(+24.4)#14 | 10.0%(+19.1)#2,261 |
| 15. | Moscow | 28.3% | 4.7%(+23.6)#15 | 10.0%(+18.3)#2,473 |
| 16. | Grantsville | 27.1% | 4.7%(+22.4)#16 | 10.0%(+17.1)#2,819 |
| 17. | Greensburg | 25.0% | 4.7%(+20.3)#17 | 10.0%(+15.0)#3,485 |
| 18. | Worton | 23.7% | 4.7%(+19.0)#18 | 10.0%(+13.7)#3,954 |
| 19. | Pondsville | 22.2% | 4.7%(+17.5)#19 | 10.0%(+12.2)#4,574 |
| 20. | Bier | 22.0% | 4.7%(+17.3)#20 | 10.0%(+12.0)#4,683 |
| 21. | Corriganville | 21.2% | 4.7%(+16.5)#21 | 10.0%(+11.2)#5,077 |
| 22. | Tolchester | 19.3% | 4.7%(+14.6)#22 | 10.0%(+9.34)#6,170 |
| 23. | Wilson Conococheague | 19.1% | 4.7%(+14.3)#23 | 10.0%(+9.06)#6,387 |
| 24. | Jesterville | 18.1% | 4.7%(+13.4)#24 | 10.0%(+8.06)#7,069 |
| 25. | Kingstown | 17.9% | 4.7%(+13.2)#25 | 10.0%(+7.88)#7,191 |
| 26. | Bloomington | 17.7% | 4.7%(+13.0)#26 | 10.0%(+7.75)#7,293 |
| 27. | Betterton | 17.5% | 4.7%(+12.8)#27 | 10.0%(+7.51)#7,447 |
| 28. | San Mar | 16.8% | 4.7%(+12.1)#28 | 10.0%(+6.85)#7,911 |
| 29. | Ellerslie | 15.2% | 4.7%(+10.4)#29 | 10.0%(+5.16)#9,400 |
| 30. | Princess Anne | 15.1% | 4.7%(+10.4)#30 | 10.0%(+5.14)#9,424 |
| 31. | Butlertown | 14.9% | 4.7%(+10.2)#31 | 10.0%(+4.91)#9,648 |
| 32. | Hurlock | 14.3% | 4.7%(+9.58)#32 | 10.0%(+4.29)#10,231 |
| 33. | Romancoke | 13.9% | 4.7%(+9.21)#33 | 10.0%(+3.93)#10,614 |
| 34. | Williamsport | 13.9% | 4.7%(+9.20)#34 | 10.0%(+3.91)#10,627 |
| 35. | Midland | 13.8% | 4.7%(+9.09)#35 | 10.0%(+3.80)#10,721 |
| 36. | Clear Spring | 13.6% | 4.7%(+8.87)#36 | 10.0%(+3.58)#10,981 |
| 37. | Perryville | 13.3% | 4.7%(+8.58)#37 | 10.0%(+3.29)#11,305 |
| 38. | Denton | 12.8% | 4.7%(+8.06)#38 | 10.0%(+2.78)#11,859 |
| 39. | Church Creek | 12.8% | 4.7%(+8.06)#39 | 10.0%(+2.78)#11,870 |
| 40. | Cecilton | 12.7% | 4.7%(+7.99)#40 | 10.0%(+2.70)#11,946 |
| 41. | Edgemont | 12.3% | 4.7%(+7.63)#41 | 10.0%(+2.34)#12,334 |
| 42. | Millington | 12.2% | 4.7%(+7.52)#42 | 10.0%(+2.23)#12,442 |
| 43. | Charlestown | 12.2% | 4.7%(+7.47)#43 | 10.0%(+2.19)#12,500 |
| 44. | Union Bridge | 12.2% | 4.7%(+7.46)#44 | 10.0%(+2.18)#12,511 |
| 45. | Barnesville | 12.2% | 4.7%(+7.46)#45 | 10.0%(+2.17)#12,514 |
| 46. | Tilghmanton | 12.1% | 4.7%(+7.44)#46 | 10.0%(+2.15)#12,541 |
| 47. | Trappe | 12.1% | 4.7%(+7.36)#47 | 10.0%(+2.07)#12,643 |
| 48. | Grasonville | 12.0% | 4.7%(+7.31)#48 | 10.0%(+2.03)#12,691 |
| 49. | Chestertown | 12.0% | 4.7%(+7.25)#49 | 10.0%(+1.96)#12,787 |
| 50. | Luke | 11.9% | 4.7%(+7.20)#50 | 10.0%(+1.91)#12,845 |
| 51. | Hancock | 11.9% | 4.7%(+7.18)#51 | 10.0%(+1.89)#12,869 |
| 52. | Salisbury | 11.9% | 4.7%(+7.16)#52 | 10.0%(+1.87)#12,895 |
| 53. | Hillsboro | 11.8% | 4.7%(+7.12)#53 | 10.0%(+1.84)#12,933 |
| 54. | Rock Hall | 11.5% | 4.7%(+6.81)#54 | 10.0%(+1.52)#13,313 |
| 55. | Rising Sun | 11.4% | 4.7%(+6.69)#55 | 10.0%(+1.40)#13,436 |
| 56. | Kitzmiller | 11.4% | 4.7%(+6.66)#56 | 10.0%(+1.37)#13,489 |
| 57. | Halfway | 11.2% | 4.7%(+6.45)#57 | 10.0%(+1.17)#13,733 |
| 58. | West Pocomoke | 11.1% | 4.7%(+6.41)#58 | 10.0%(+1.12)#13,784 |
| 59. | Cockeysville | 11.1% | 4.7%(+6.35)#59 | 10.0%(+1.06)#13,891 |
| 60. | Beaver Creek | 11.0% | 4.7%(+6.30)#60 | 10.0%(+1.01)#13,948 |
| 61. | Elkton | 10.8% | 4.7%(+6.07)#61 | 10.0%(+0.784)#14,269 |
| 62. | Delmar | 10.4% | 4.7%(+5.68)#62 | 10.0%(+0.394)#14,710 |
| 63. | Vienna | 10.3% | 4.7%(+5.64)#63 | 10.0%(+0.354)#14,767 |
| 64. | Derwood | 10.2% | 4.7%(+5.53)#64 | 10.0%(+0.245)#14,895 |
| 65. | Mount Savage | 10.2% | 4.7%(+5.53)#65 | 10.0%(+0.245)#14,896 |
| 66. | Cresaptown | 10.2% | 4.7%(+5.46)#66 | 10.0%(+0.172)#14,998 |
| 67. | La Vale | 10.1% | 4.7%(+5.39)#67 | 10.0%(+0.107)#15,073 |
| 68. | Linthicum | 10.0% | 4.7%(+5.32)#68 | 10.0%(+0.028)#15,170 |
| 69. | Jefferson | 10.0% | 4.7%(+5.26)#69 | 10.0%(-0.026)#15,269 |
| 70. | Westernport | 9.9% | 4.7%(+5.15)#70 | 10.0%(-0.134)#15,416 |
| 71. | Herald Harbor | 9.7% | 4.7%(+5.02)#71 | 10.0%(-0.265)#15,599 |
| 72. | Lansdowne | 9.7% | 4.7%(+5.02)#72 | 10.0%(-0.266)#15,600 |
| 73. | Brookview | 9.5% | 4.7%(+4.82)#73 | 10.0%(-0.467)#15,870 |
| 74. | Ferndale | 9.4% | 4.7%(+4.67)#74 | 10.0%(-0.615)#16,049 |
| 75. | Maugansville | 9.3% | 4.7%(+4.63)#75 | 10.0%(-0.655)#16,105 |
| 76. | New Windsor | 9.2% | 4.7%(+4.51)#76 | 10.0%(-0.776)#16,267 |
| 77. | Easton | 9.2% | 4.7%(+4.50)#77 | 10.0%(-0.784)#16,278 |
| 78. | Chewsville | 9.1% | 4.7%(+4.39)#78 | 10.0%(-0.900)#16,437 |
| 79. | Bowleys Quarters | 9.1% | 4.7%(+4.38)#79 | 10.0%(-0.911)#16,477 |
| 80. | Chesapeake City | 9.0% | 4.7%(+4.32)#80 | 10.0%(-0.970)#16,530 |
| 81. | Galena | 8.9% | 4.7%(+4.18)#81 | 10.0%(-1.11)#16,711 |
| 82. | Finzel | 8.8% | 4.7%(+4.13)#82 | 10.0%(-1.16)#16,769 |
| 83. | Seat Pleasant | 8.8% | 4.7%(+4.11)#83 | 10.0%(-1.18)#16,816 |
| 84. | Highfield Cascade | 8.8% | 4.7%(+4.11)#84 | 10.0%(-1.18)#16,817 |
| 85. | Deer Park | 8.7% | 4.7%(+3.96)#85 | 10.0%(-1.32)#17,043 |
| 86. | Snow Hill | 8.6% | 4.7%(+3.91)#86 | 10.0%(-1.38)#17,110 |
| 87. | Sabillasville | 8.6% | 4.7%(+3.86)#87 | 10.0%(-1.43)#17,188 |
| 88. | Port Deposit | 8.5% | 4.7%(+3.80)#88 | 10.0%(-1.49)#17,260 |
| 89. | Woodsboro | 8.5% | 4.7%(+3.79)#89 | 10.0%(-1.50)#17,277 |
| 90. | Edgemere | 8.5% | 4.7%(+3.76)#90 | 10.0%(-1.53)#17,323 |
| 91. | Mount Airy | 8.4% | 4.7%(+3.69)#91 | 10.0%(-1.60)#17,421 |
| 92. | Cobb Island | 8.4% | 4.7%(+3.67)#92 | 10.0%(-1.62)#17,440 |
| 93. | Taneytown | 8.3% | 4.7%(+3.64)#93 | 10.0%(-1.65)#17,479 |
| 94. | Fallston | 8.3% | 4.7%(+3.63)#94 | 10.0%(-1.66)#17,489 |
| 95. | Darlington | 8.3% | 4.7%(+3.63)#95 | 10.0%(-1.66)#17,502 |
| 96. | Taylors Island | 8.3% | 4.7%(+3.63)#96 | 10.0%(-1.66)#17,524 |
| 97. | Cambridge | 8.2% | 4.7%(+3.48)#97 | 10.0%(-1.81)#17,726 |
| 98. | Joppatowne | 8.2% | 4.7%(+3.47)#98 | 10.0%(-1.82)#17,753 |
| 99. | Abingdon | 8.1% | 4.7%(+3.44)#99 | 10.0%(-1.85)#17,789 |
| 100. | Hebron | 8.1% | 4.7%(+3.40)#100 | 10.0%(-1.89)#17,853 |
Common Questions
What are the Top 10 Cities with the Highest Percentage of Population Employed in Manufacturing in Maryland?
Top 10 Cities with the Highest Percentage of Population Employed in Manufacturing in Maryland are:
#1
73.3%
#2
70.8%
#3
52.7%
#4
46.9%
#5
45.0%
#6
42.2%
#7
39.2%
#8
39.0%
#9
38.9%
#10
37.7%
What city has the Highest Percentage of Population Employed in Manufacturing in Maryland?
Little Orleans has the Highest Percentage of Population Employed in Manufacturing in Maryland with 73.3%.
What is the Percentage of Population Employed in Manufacturing in the State of Maryland?
Percentage of Population Employed in Manufacturing in Maryland is 4.7%.
What is the Percentage of Population Employed in Manufacturing in the United States?
Percentage of Population Employed in Manufacturing in the United States is 10.0%.