Cobb Island, MD Map & Demographics
Cobb Island Map
Cobb Island Overview
$52,863
PER CAPITA INCOME
$138,750
AVG FAMILY INCOME
$127,442
AVG HOUSEHOLD INCOME
22.3%
WAGE / INCOME GAP [ % ]
77.7¢/ $1
WAGE / INCOME GAP [ $ ]
0.32
INEQUALITY / GINI INDEX
1,298
TOTAL POPULATION
640
MALE POPULATION
658
FEMALE POPULATION
97.26
MALES / 100 FEMALES
102.81
FEMALES / 100 MALES
47.6
MEDIAN AGE
2.7
AVG FAMILY SIZE
2.5
AVG HOUSEHOLD SIZE
920
LABOR FORCE [ PEOPLE ]
81.1%
PERCENT IN LABOR FORCE
3.9%
UNEMPLOYMENT RATE
Cobb Island Zip Codes
Cobb Island Area Codes
Income in Cobb Island
Income Overview in Cobb Island
Per Capita Income in Cobb Island is $52,863, while median incomes of families and households are $138,750 and $127,442 respectively.
| Characteristic | Number | Measure |
| Per Capita Income | 1,298 | $52,863 |
| Median Family Income | 450 | $138,750 |
| Mean Family Income | 450 | $132,292 |
| Median Household Income | 514 | $127,442 |
| Mean Household Income | 514 | $128,812 |
| Income Deficit | 450 | $0 |
| Wage / Income Gap (%) | 1,298 | 22.32% |
| Wage / Income Gap ($) | 1,298 | 77.68¢ per $1 |
| Gini / Inequality Index | 1,298 | 0.32 |
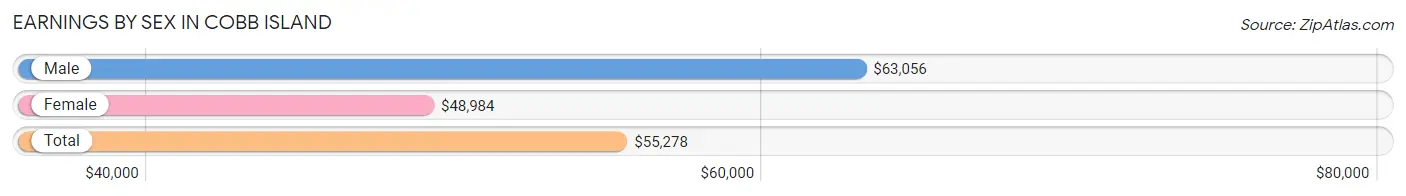
Earnings by Sex in Cobb Island
Average Earnings in Cobb Island are $55,278, $63,056 for men and $48,984 for women, a difference of 22.3%.
| Sex | Number | Average Earnings |
| Male | 566 (63.0%) | $63,056 |
| Female | 332 (37.0%) | $48,984 |
| Total | 898 (100.0%) | $55,278 |
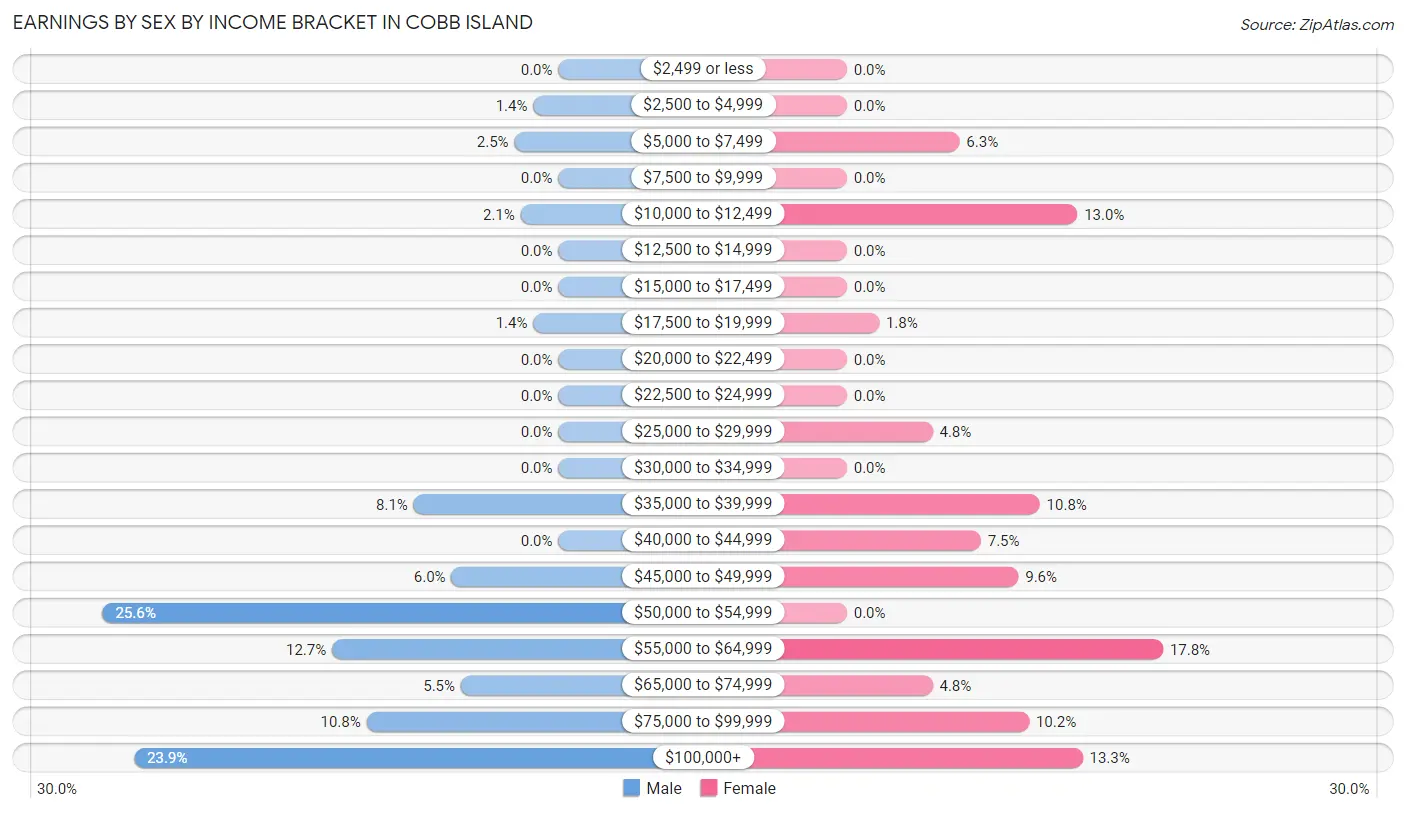
Earnings by Sex by Income Bracket in Cobb Island
The most common earnings brackets in Cobb Island are $50,000 to $54,999 for men (145 | 25.6%) and $55,000 to $64,999 for women (59 | 17.8%).
| Income | Male | Female |
| $2,499 or less | 0 (0.0%) | 0 (0.0%) |
| $2,500 to $4,999 | 8 (1.4%) | 0 (0.0%) |
| $5,000 to $7,499 | 14 (2.5%) | 21 (6.3%) |
| $7,500 to $9,999 | 0 (0.0%) | 0 (0.0%) |
| $10,000 to $12,499 | 12 (2.1%) | 43 (13.0%) |
| $12,500 to $14,999 | 0 (0.0%) | 0 (0.0%) |
| $15,000 to $17,499 | 0 (0.0%) | 0 (0.0%) |
| $17,500 to $19,999 | 8 (1.4%) | 6 (1.8%) |
| $20,000 to $22,499 | 0 (0.0%) | 0 (0.0%) |
| $22,500 to $24,999 | 0 (0.0%) | 0 (0.0%) |
| $25,000 to $29,999 | 0 (0.0%) | 16 (4.8%) |
| $30,000 to $34,999 | 0 (0.0%) | 0 (0.0%) |
| $35,000 to $39,999 | 46 (8.1%) | 36 (10.8%) |
| $40,000 to $44,999 | 0 (0.0%) | 25 (7.5%) |
| $45,000 to $49,999 | 34 (6.0%) | 32 (9.6%) |
| $50,000 to $54,999 | 145 (25.6%) | 0 (0.0%) |
| $55,000 to $64,999 | 72 (12.7%) | 59 (17.8%) |
| $65,000 to $74,999 | 31 (5.5%) | 16 (4.8%) |
| $75,000 to $99,999 | 61 (10.8%) | 34 (10.2%) |
| $100,000+ | 135 (23.8%) | 44 (13.3%) |
| Total | 566 (100.0%) | 332 (100.0%) |
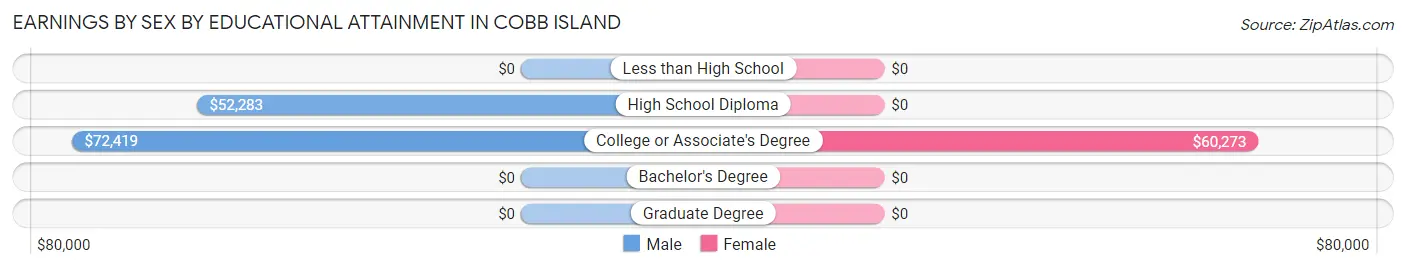
Earnings by Sex by Educational Attainment in Cobb Island
Average earnings in Cobb Island are $63,924 for men and $56,667 for women, a difference of 11.4%. Men with an educational attainment of college or associate's degree enjoy the highest average annual earnings of $72,419, while those with high school diploma education earn the least with $52,283. Women with an educational attainment of college or associate's degree earn the most with the average annual earnings of $60,273, while those with college or associate's degree education have the smallest earnings of $60,273.
| Educational Attainment | Male Income | Female Income |
| Less than High School | - | - |
| High School Diploma | $52,283 | $0 |
| College or Associate's Degree | $72,419 | $60,273 |
| Bachelor's Degree | - | - |
| Graduate Degree | - | - |
| Total | $63,924 | $56,667 |
Family Income in Cobb Island
Family Income Brackets in Cobb Island
According to the Cobb Island family income data, there are 163 families falling into the $150,000 to $199,999 income range, which is the most common income bracket and makes up 36.2% of all families.
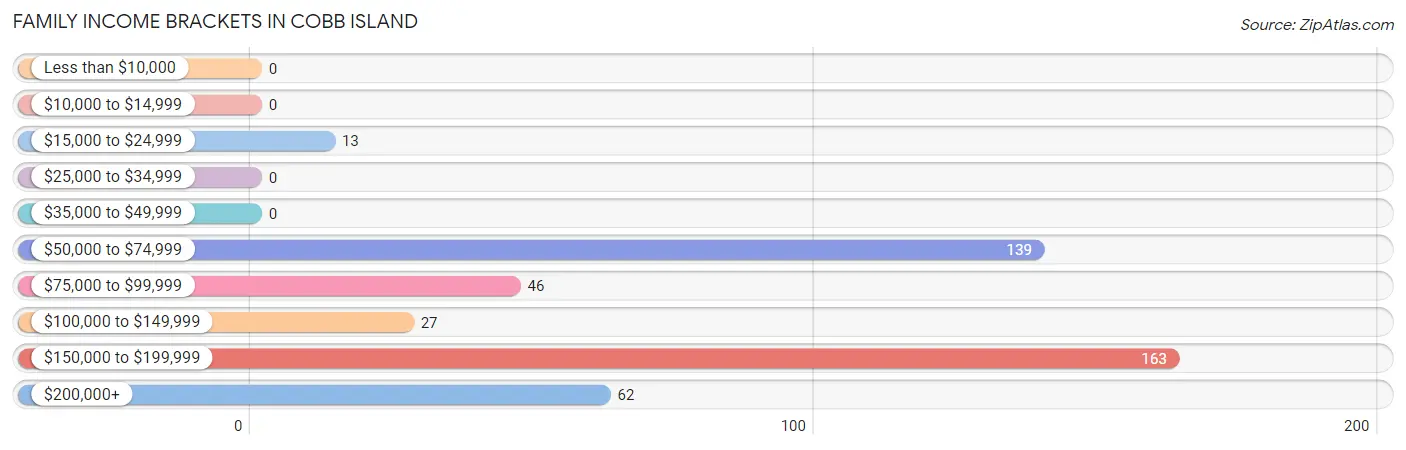
| Income Bracket | # Families | % Families |
| Less than $10,000 | 0 | 0.0% |
| $10,000 to $14,999 | 0 | 0.0% |
| $15,000 to $24,999 | 13 | 2.9% |
| $25,000 to $34,999 | 0 | 0.0% |
| $35,000 to $49,999 | 0 | 0.0% |
| $50,000 to $74,999 | 139 | 30.9% |
| $75,000 to $99,999 | 46 | 10.2% |
| $100,000 to $149,999 | 27 | 6.0% |
| $150,000 to $199,999 | 163 | 36.2% |
| $200,000+ | 62 | 13.8% |
Family Income by Famaliy Size in Cobb Island
4-person families (109 | 24.2%) account for the highest median family income in Cobb Island with $169,340 per family, while 4-person families (109 | 24.2%) have the highest median income of $42,335 per family member.
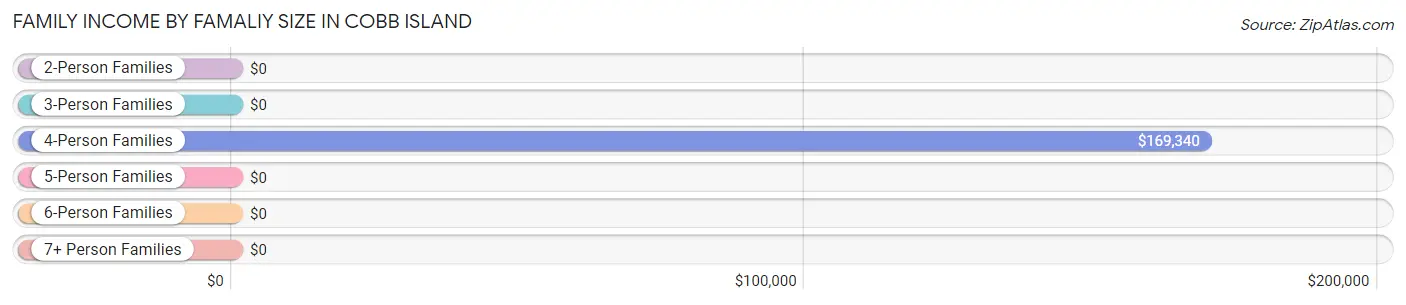
| Income Bracket | # Families | Median Income |
| 2-Person Families | 282 (62.7%) | $0 |
| 3-Person Families | 53 (11.8%) | $0 |
| 4-Person Families | 109 (24.2%) | $169,340 |
| 5-Person Families | 6 (1.3%) | $0 |
| 6-Person Families | 0 (0.0%) | $0 |
| 7+ Person Families | 0 (0.0%) | $0 |
| Total | 450 (100.0%) | $138,750 |
Family Income by Number of Earners in Cobb Island
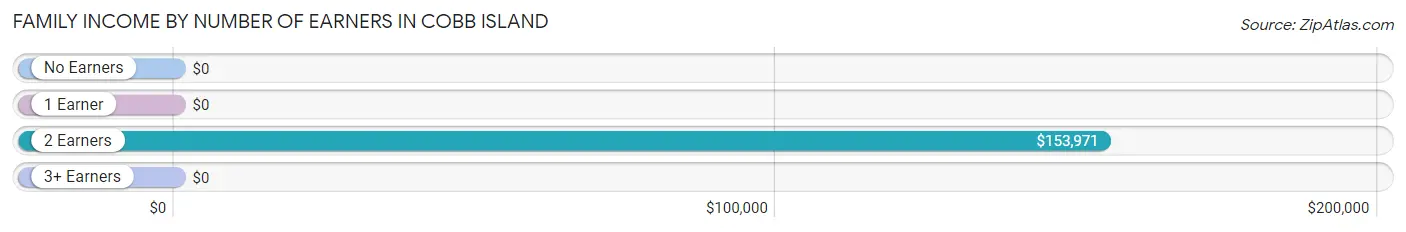
| Number of Earners | # Families | Median Income |
| No Earners | 0 (0.0%) | $0 |
| 1 Earner | 184 (40.9%) | $0 |
| 2 Earners | 224 (49.8%) | $153,971 |
| 3+ Earners | 42 (9.3%) | $0 |
| Total | 450 (100.0%) | $138,750 |
Household Income in Cobb Island
Household Income Brackets in Cobb Island
With 163 households falling in the category, the $150,000 to $199,999 income range is the most frequent in Cobb Island, accounting for 31.7% of all households.
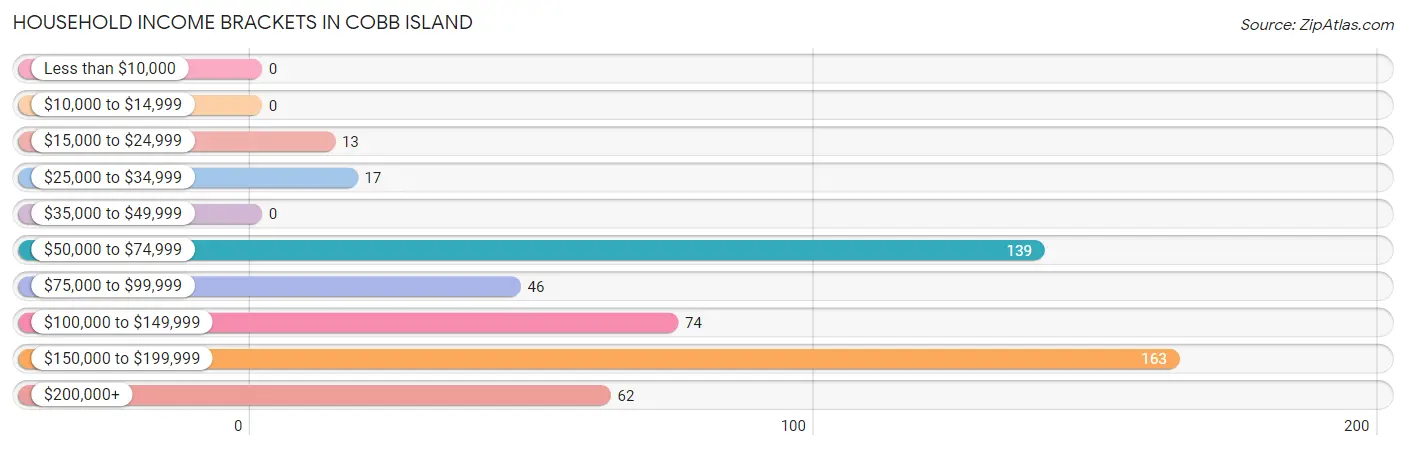
| Income Bracket | # Households | % Households |
| Less than $10,000 | 0 | 0.0% |
| $10,000 to $14,999 | 0 | 0.0% |
| $15,000 to $24,999 | 13 | 2.5% |
| $25,000 to $34,999 | 17 | 3.3% |
| $35,000 to $49,999 | 0 | 0.0% |
| $50,000 to $74,999 | 139 | 27.0% |
| $75,000 to $99,999 | 46 | 8.9% |
| $100,000 to $149,999 | 74 | 14.4% |
| $150,000 to $199,999 | 163 | 31.7% |
| $200,000+ | 62 | 12.1% |
Household Income by Householder Age in Cobb Island
The median household income in Cobb Island is $127,442, with the highest median household income of $169,375 found in the 25 to 44 years age bracket for the primary householder. A total of 108 households (21.0%) fall into this category. Meanwhile, the 15 to 24 years age bracket for the primary householder has the lowest median household income of $0, with 32 households (6.2%) in this group.
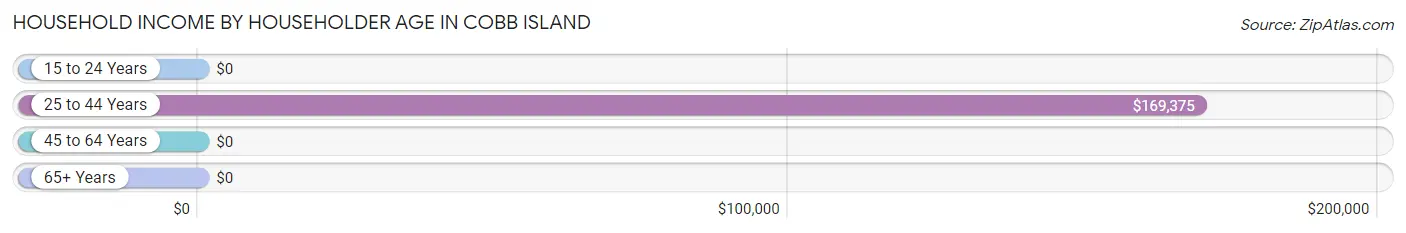
| Income Bracket | # Households | Median Income |
| 15 to 24 Years | 32 (6.2%) | $0 |
| 25 to 44 Years | 108 (21.0%) | $169,375 |
| 45 to 64 Years | 374 (72.8%) | $0 |
| 65+ Years | 0 (0.0%) | $0 |
| Total | 514 (100.0%) | $127,442 |
Poverty in Cobb Island
Income Below Poverty by Sex and Age in Cobb Island
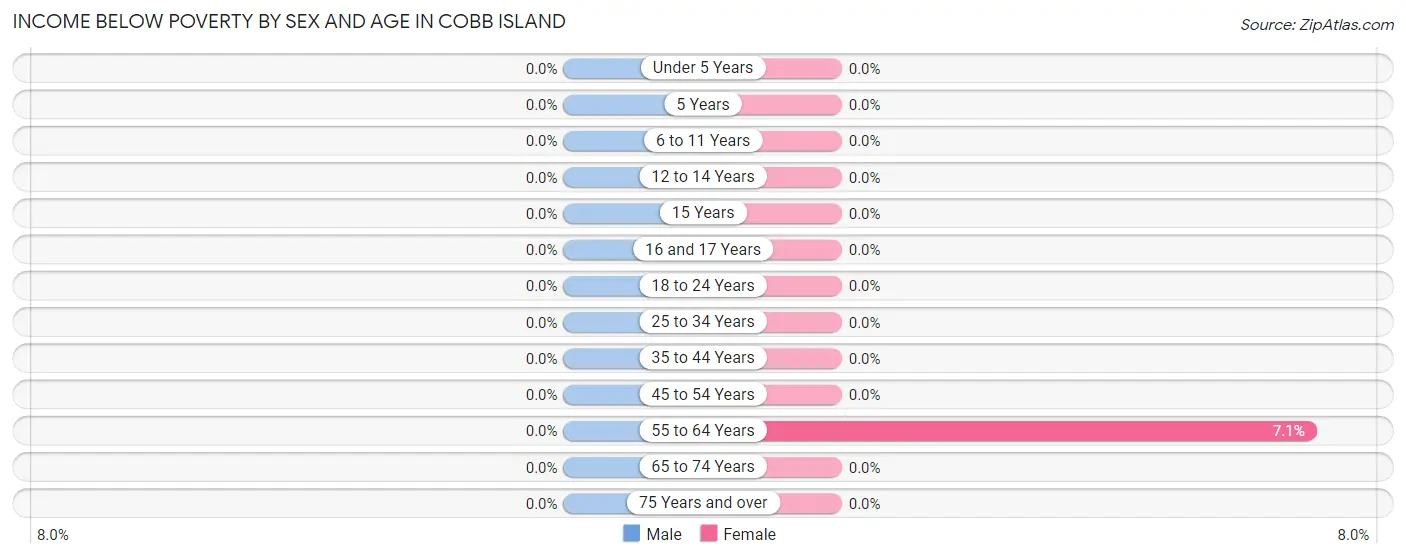
| Age Bracket | Male | Female |
| Under 5 Years | 0 (0.0%) | 0 (0.0%) |
| 5 Years | 0 (0.0%) | 0 (0.0%) |
| 6 to 11 Years | 0 (0.0%) | 0 (0.0%) |
| 12 to 14 Years | 0 (0.0%) | 0 (0.0%) |
| 15 Years | 0 (0.0%) | 0 (0.0%) |
| 16 and 17 Years | 0 (0.0%) | 0 (0.0%) |
| 18 to 24 Years | 0 (0.0%) | 0 (0.0%) |
| 25 to 34 Years | 0 (0.0%) | 0 (0.0%) |
| 35 to 44 Years | 0 (0.0%) | 0 (0.0%) |
| 45 to 54 Years | 0 (0.0%) | 0 (0.0%) |
| 55 to 64 Years | 0 (0.0%) | 21 (7.0%) |
| 65 to 74 Years | 0 (0.0%) | 0 (0.0%) |
| 75 Years and over | 0 (0.0%) | 0 (0.0%) |
| Total | 0 (0.0%) | 21 (3.2%) |
Income Above Poverty by Sex and Age in Cobb Island
According to the poverty statistics in Cobb Island, males aged 12 to 14 years and females aged under 5 years are the age groups that are most secure financially, with 100.0% of males and 100.0% of females in these age groups living above the poverty line.
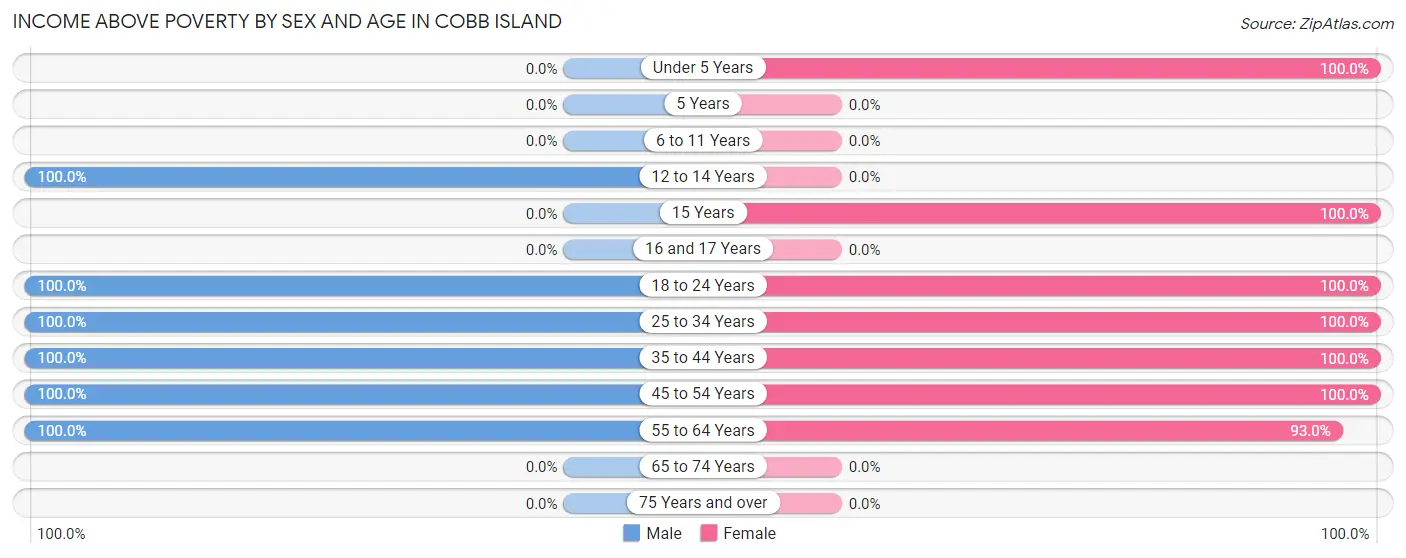
| Age Bracket | Male | Female |
| Under 5 Years | 0 (0.0%) | 30 (100.0%) |
| 5 Years | 0 (0.0%) | 0 (0.0%) |
| 6 to 11 Years | 0 (0.0%) | 0 (0.0%) |
| 12 to 14 Years | 74 (100.0%) | 0 (0.0%) |
| 15 Years | 0 (0.0%) | 59 (100.0%) |
| 16 and 17 Years | 0 (0.0%) | 0 (0.0%) |
| 18 to 24 Years | 50 (100.0%) | 98 (100.0%) |
| 25 to 34 Years | 77 (100.0%) | 33 (100.0%) |
| 35 to 44 Years | 81 (100.0%) | 81 (100.0%) |
| 45 to 54 Years | 249 (100.0%) | 59 (100.0%) |
| 55 to 64 Years | 109 (100.0%) | 277 (92.9%) |
| 65 to 74 Years | 0 (0.0%) | 0 (0.0%) |
| 75 Years and over | 0 (0.0%) | 0 (0.0%) |
| Total | 640 (100.0%) | 637 (96.8%) |
Income Below Poverty Among Married-Couple Families in Cobb Island
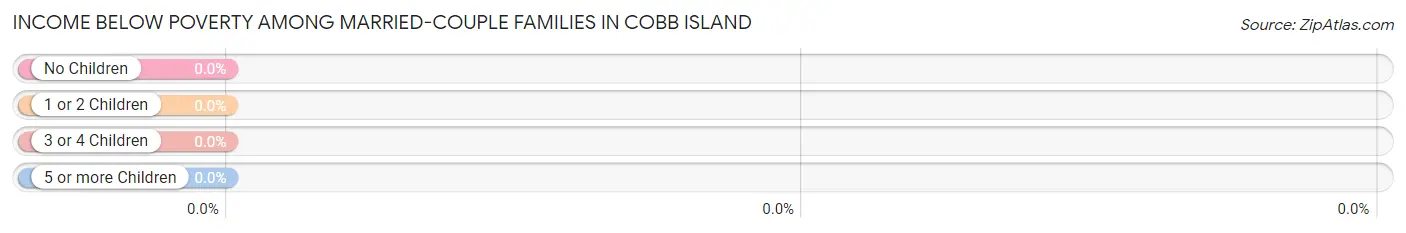
| Children | Above Poverty | Below Poverty |
| No Children | 324 (100.0%) | 0 (0.0%) |
| 1 or 2 Children | 126 (100.0%) | 0 (0.0%) |
| 3 or 4 Children | 0 (0.0%) | 0 (0.0%) |
| 5 or more Children | 0 (0.0%) | 0 (0.0%) |
| Total | 450 (100.0%) | 0 (0.0%) |
Income Below Poverty Among Single-Parent Households in Cobb Island
| Children | Single Father | Single Mother |
| No Children | 0 (0.0%) | 0 (0.0%) |
| 1 or 2 Children | 0 (0.0%) | 0 (0.0%) |
| 3 or 4 Children | 0 (0.0%) | 0 (0.0%) |
| 5 or more Children | 0 (0.0%) | 0 (0.0%) |
| Total | 0 (0.0%) | 0 (0.0%) |
Income Below Poverty Among Married-Couple vs Single-Parent Households in Cobb Island
| Children | Married-Couple Families | Single-Parent Households |
| No Children | 0 (0.0%) | 0 (0.0%) |
| 1 or 2 Children | 0 (0.0%) | 0 (0.0%) |
| 3 or 4 Children | 0 (0.0%) | 0 (0.0%) |
| 5 or more Children | 0 (0.0%) | 0 (0.0%) |
| Total | 0 (0.0%) | 0 (0.0%) |
Race in Cobb Island
The most populous races in Cobb Island are White / Caucasian (1,234 | 95.1%), Two or more Races (45 | 3.5%), and Asian (19 | 1.5%).
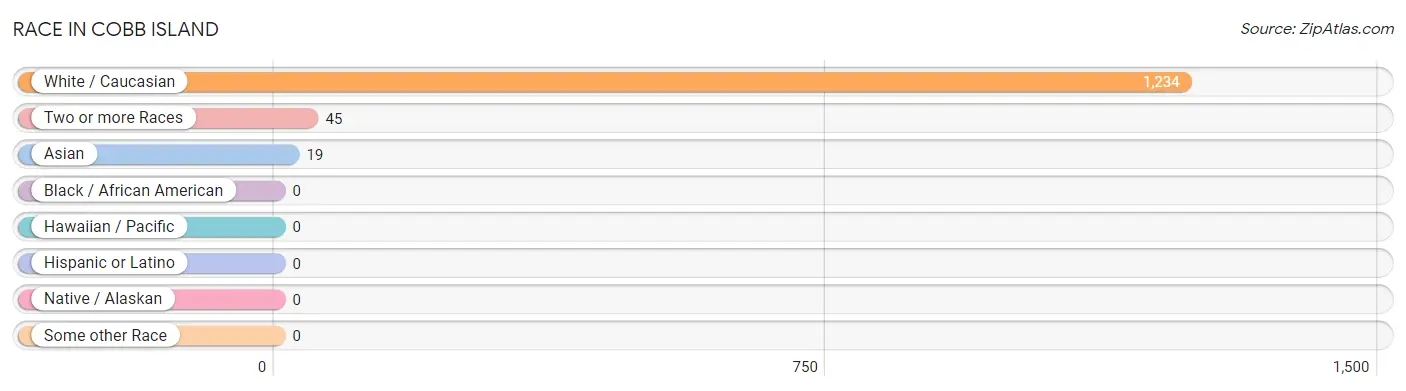
| Race | # Population | % Population |
| Asian | 19 | 1.5% |
| Black / African American | 0 | 0.0% |
| Hawaiian / Pacific | 0 | 0.0% |
| Hispanic or Latino | 0 | 0.0% |
| Native / Alaskan | 0 | 0.0% |
| White / Caucasian | 1,234 | 95.1% |
| Two or more Races | 45 | 3.5% |
| Some other Race | 0 | 0.0% |
| Total | 1,298 | 100.0% |
Ancestry in Cobb Island
The most populous ancestries reported in Cobb Island are Irish (266 | 20.5%), English (155 | 11.9%), German (133 | 10.2%), American (87 | 6.7%), and Italian (74 | 5.7%), together accounting for 55.1% of all Cobb Island residents.
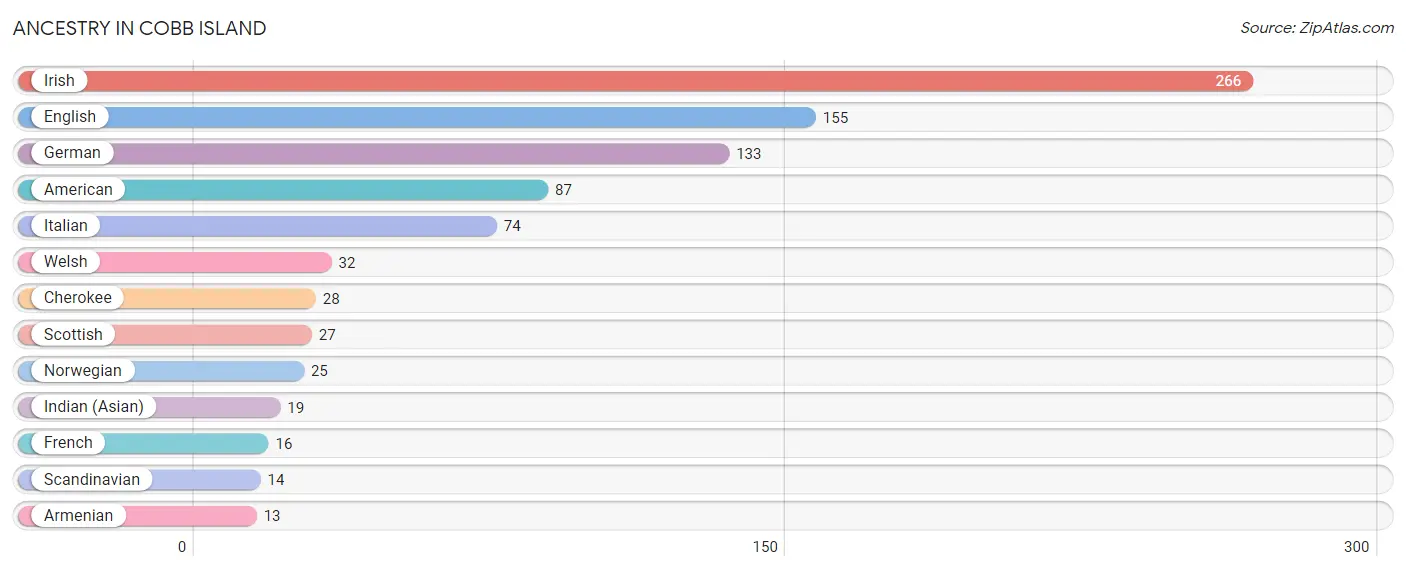
| Ancestry | # Population | % Population |
| American | 87 | 6.7% |
| Armenian | 13 | 1.0% |
| Cherokee | 28 | 2.2% |
| English | 155 | 11.9% |
| French | 16 | 1.2% |
| German | 133 | 10.2% |
| Indian (Asian) | 19 | 1.5% |
| Irish | 266 | 20.5% |
| Italian | 74 | 5.7% |
| Norwegian | 25 | 1.9% |
| Scandinavian | 14 | 1.1% |
| Scottish | 27 | 2.1% |
| Welsh | 32 | 2.5% | View All 13 Rows |
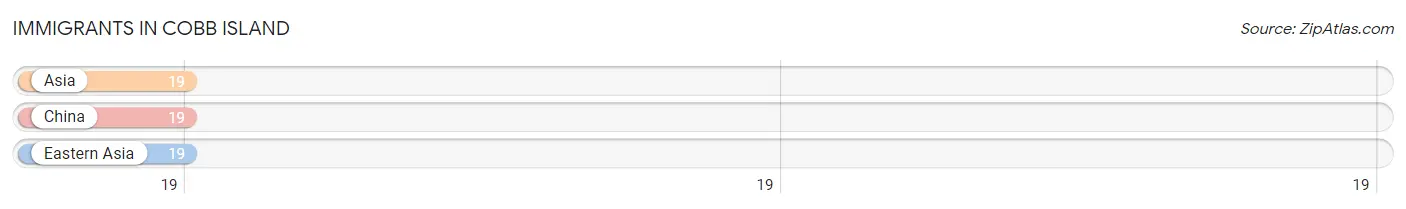
Immigrants in Cobb Island
The most numerous immigrant groups reported in Cobb Island came from Asia (19 | 1.5%), China (19 | 1.5%), and Eastern Asia (19 | 1.5%), together accounting for 4.4% of all Cobb Island residents.
| Immigration Origin | # Population | % Population |
| Asia | 19 | 1.5% |
| China | 19 | 1.5% |
| Eastern Asia | 19 | 1.5% | View All 3 Rows |
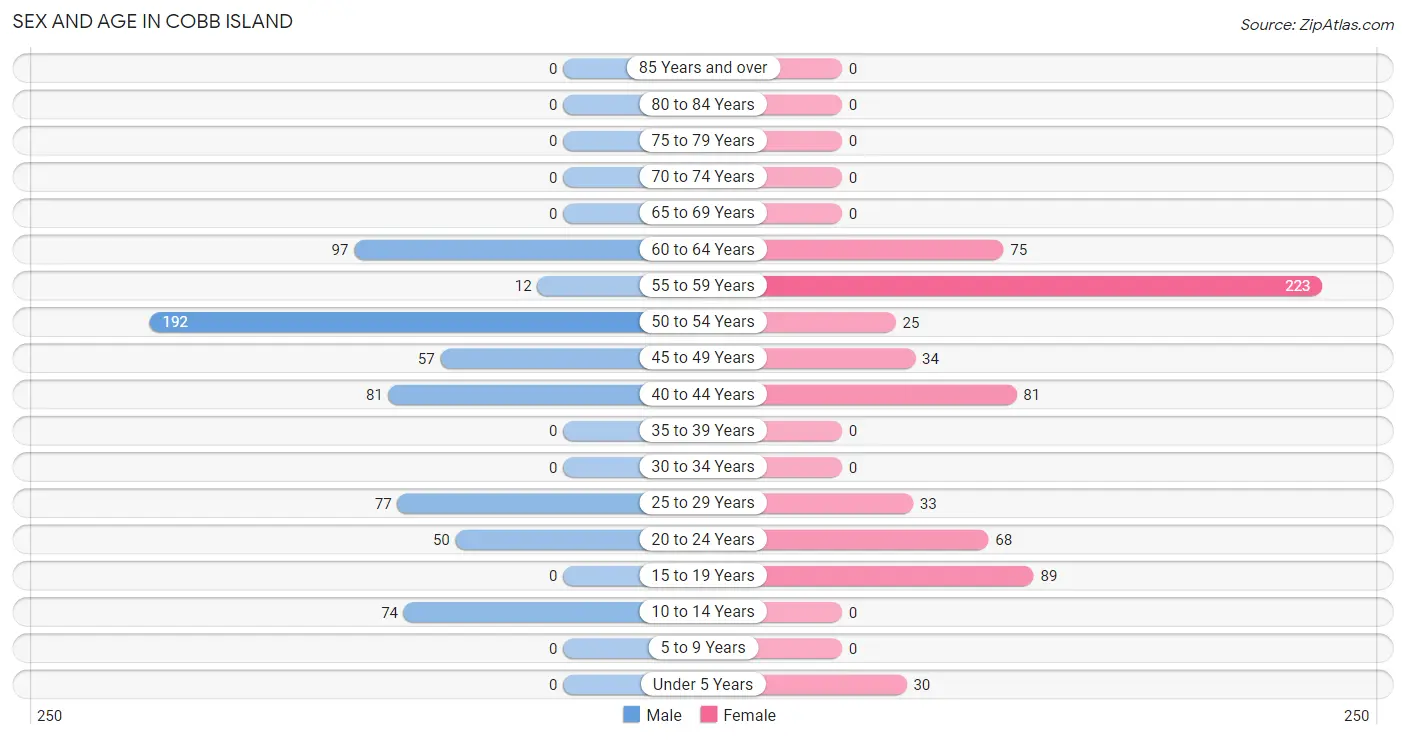
Sex and Age in Cobb Island
Sex and Age in Cobb Island
The most populous age groups in Cobb Island are 50 to 54 Years (192 | 30.0%) for men and 55 to 59 Years (223 | 33.9%) for women.
| Age Bracket | Male | Female |
| Under 5 Years | 0 (0.0%) | 30 (4.6%) |
| 5 to 9 Years | 0 (0.0%) | 0 (0.0%) |
| 10 to 14 Years | 74 (11.6%) | 0 (0.0%) |
| 15 to 19 Years | 0 (0.0%) | 89 (13.5%) |
| 20 to 24 Years | 50 (7.8%) | 68 (10.3%) |
| 25 to 29 Years | 77 (12.0%) | 33 (5.0%) |
| 30 to 34 Years | 0 (0.0%) | 0 (0.0%) |
| 35 to 39 Years | 0 (0.0%) | 0 (0.0%) |
| 40 to 44 Years | 81 (12.7%) | 81 (12.3%) |
| 45 to 49 Years | 57 (8.9%) | 34 (5.2%) |
| 50 to 54 Years | 192 (30.0%) | 25 (3.8%) |
| 55 to 59 Years | 12 (1.9%) | 223 (33.9%) |
| 60 to 64 Years | 97 (15.2%) | 75 (11.4%) |
| 65 to 69 Years | 0 (0.0%) | 0 (0.0%) |
| 70 to 74 Years | 0 (0.0%) | 0 (0.0%) |
| 75 to 79 Years | 0 (0.0%) | 0 (0.0%) |
| 80 to 84 Years | 0 (0.0%) | 0 (0.0%) |
| 85 Years and over | 0 (0.0%) | 0 (0.0%) |
| Total | 640 (100.0%) | 658 (100.0%) |
Families and Households in Cobb Island
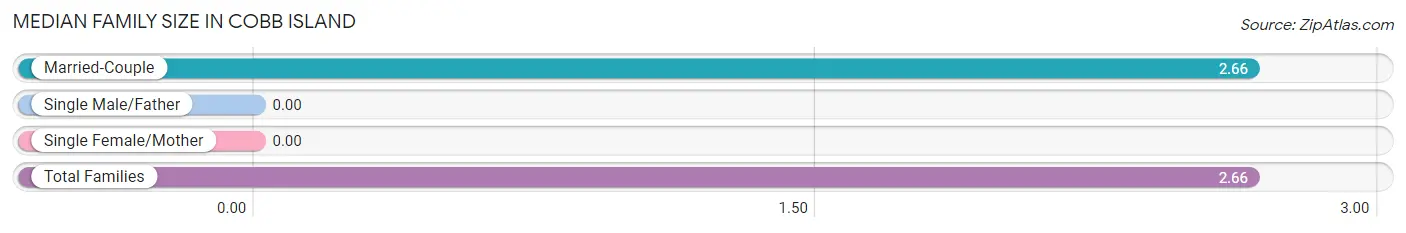
Median Family Size in Cobb Island
| Family Type | # Families | Family Size |
| Married-Couple | 450 (100.0%) | 2.66 |
| Single Male/Father | 0 (0.0%) | - |
| Single Female/Mother | 0 (0.0%) | - |
| Total Families | 450 (100.0%) | 2.66 |
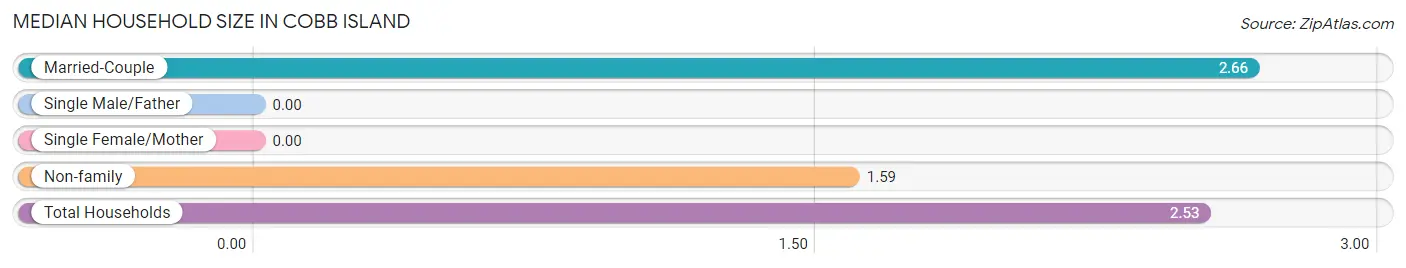
Median Household Size in Cobb Island
| Household Type | # Households | Household Size |
| Married-Couple | 450 (87.5%) | 2.66 |
| Single Male/Father | 0 (0.0%) | - |
| Single Female/Mother | 0 (0.0%) | - |
| Non-family | 64 (12.4%) | 1.59 |
| Total Households | 514 (100.0%) | 2.53 |
Household Size by Marriage Status in Cobb Island
Out of a total of 514 households in Cobb Island, 450 (87.5%) are family households, while 64 (12.4%) are nonfamily households. The most numerous type of family households are 2-person households, comprising 282, and the most common type of nonfamily households are 1-person households, comprising 43.
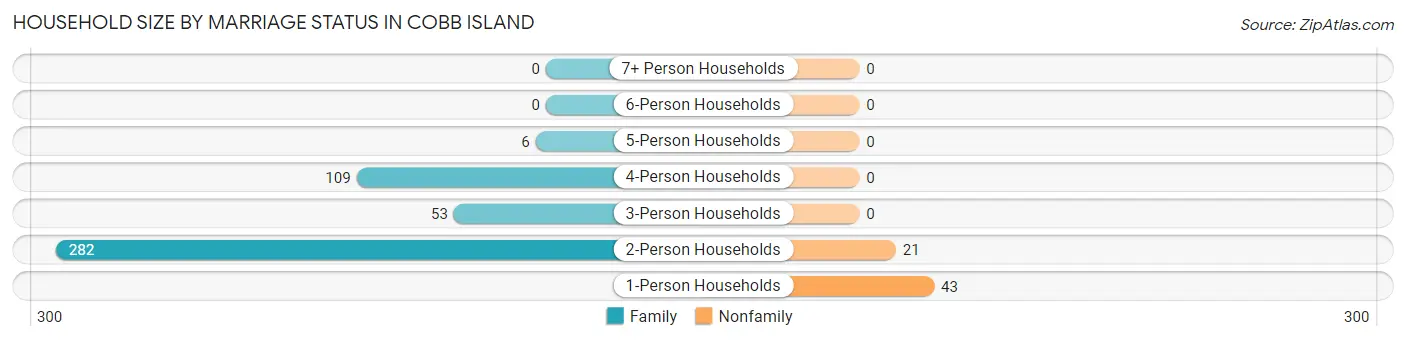
| Household Size | Family Households | Nonfamily Households |
| 1-Person Households | - | 43 (8.4%) |
| 2-Person Households | 282 (54.9%) | 21 (4.1%) |
| 3-Person Households | 53 (10.3%) | 0 (0.0%) |
| 4-Person Households | 109 (21.2%) | 0 (0.0%) |
| 5-Person Households | 6 (1.2%) | 0 (0.0%) |
| 6-Person Households | 0 (0.0%) | 0 (0.0%) |
| 7+ Person Households | 0 (0.0%) | 0 (0.0%) |
| Total | 450 (87.5%) | 64 (12.4%) |
Female Fertility in Cobb Island
Fertility by Age in Cobb Island
| Age Bracket | Women with Births | Births / 1,000 Women |
| 15 to 19 years | 0 (0.0%) | 0.0 |
| 20 to 34 years | 0 (0.0%) | 0.0 |
| 35 to 50 years | 0 (0.0%) | 0.0 |
| Total | 0 (0.0%) | 0.0 |
Fertility by Age by Marriage Status in Cobb Island
| Age Bracket | Married | Unmarried |
| 15 to 19 years | 0 (0.0%) | 0 (0.0%) |
| 20 to 34 years | 0 (0.0%) | 0 (0.0%) |
| 35 to 50 years | 0 (0.0%) | 0 (0.0%) |
| Total | 0 (0.0%) | 0 (0.0%) |
Fertility by Education in Cobb Island
| Educational Attainment | Women with Births | Births / 1,000 Women |
| Less than High School | 0 (0.0%) | 0.0 |
| High School Diploma | 0 (0.0%) | 0.0 |
| College or Associate's Degree | 0 (0.0%) | 0.0 |
| Bachelor's Degree | 0 (0.0%) | 0.0 |
| Graduate Degree | 0 (0.0%) | 0.0 |
| Total | 0 (0.0%) | 0.0 |
Fertility by Education by Marriage Status in Cobb Island
| Educational Attainment | Married | Unmarried |
| Less than High School | 0 (0.0%) | 0 (0.0%) |
| High School Diploma | 0 (0.0%) | 0 (0.0%) |
| College or Associate's Degree | 0 (0.0%) | 0 (0.0%) |
| Bachelor's Degree | 0 (0.0%) | 0 (0.0%) |
| Graduate Degree | 0 (0.0%) | 0 (0.0%) |
| Total | 0 (0.0%) | 0 (0.0%) |
Employment Characteristics in Cobb Island
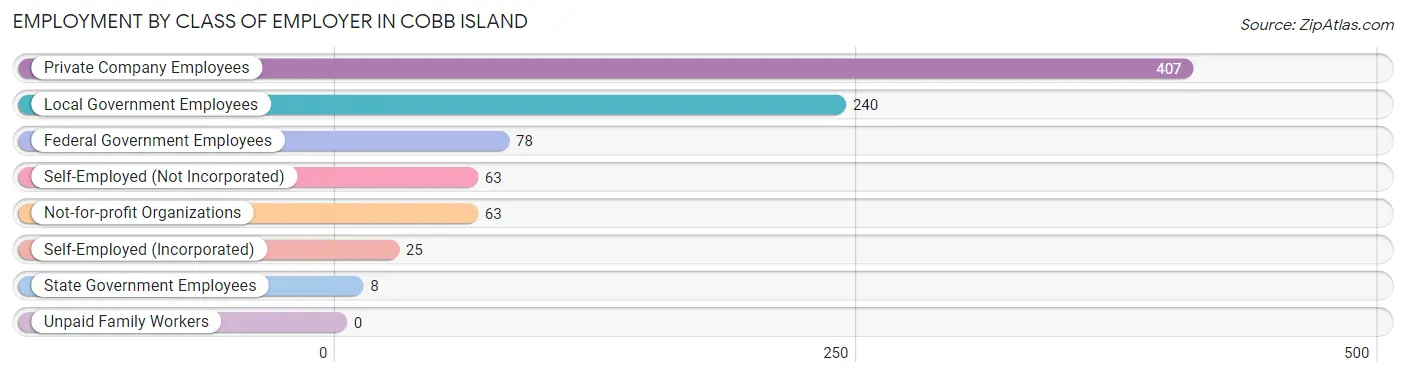
Employment by Class of Employer in Cobb Island
Among the 884 employed individuals in Cobb Island, private company employees (407 | 46.0%), local government employees (240 | 27.2%), and federal government employees (78 | 8.8%) make up the most common classes of employment.
| Employer Class | # Employees | % Employees |
| Private Company Employees | 407 | 46.0% |
| Self-Employed (Incorporated) | 25 | 2.8% |
| Self-Employed (Not Incorporated) | 63 | 7.1% |
| Not-for-profit Organizations | 63 | 7.1% |
| Local Government Employees | 240 | 27.2% |
| State Government Employees | 8 | 0.9% |
| Federal Government Employees | 78 | 8.8% |
| Unpaid Family Workers | 0 | 0.0% |
| Total | 884 | 100.0% |
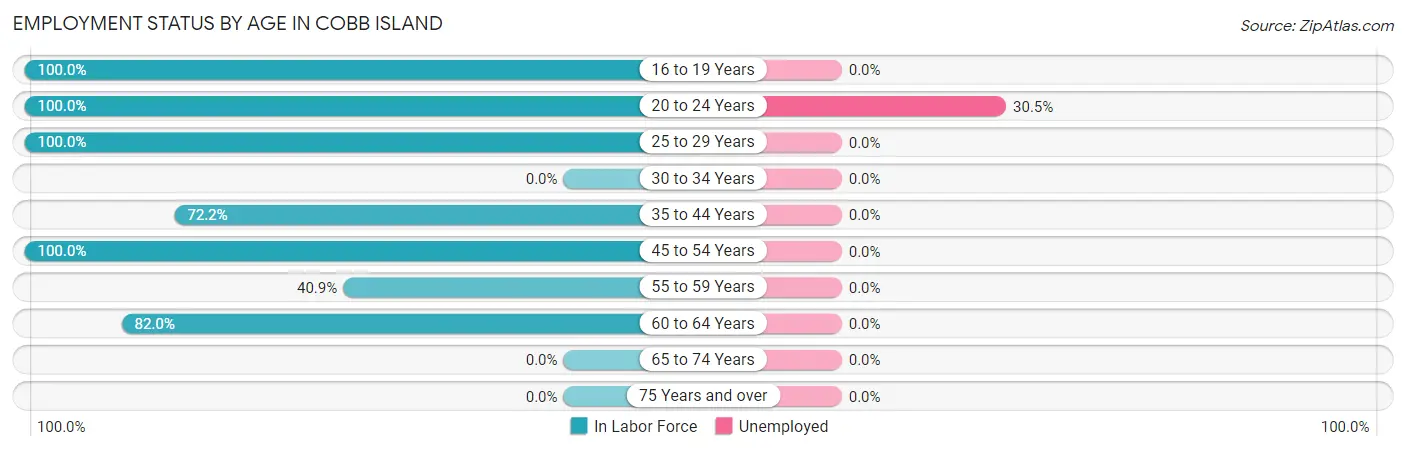
Employment Status by Age in Cobb Island
According to the labor force statistics for Cobb Island, out of the total population over 16 years of age (1,135), 81.1% or 920 individuals are in the labor force, with 3.9% or 36 of them unemployed. The age group with the highest labor force participation rate is 16 to 19 years, with 100.0% or 30 individuals in the labor force. Within the labor force, the 20 to 24 years age range has the highest percentage of unemployed individuals, with 30.5% or 36 of them being unemployed.
| Age Bracket | In Labor Force | Unemployed |
| 16 to 19 Years | 30 (100.0%) | 0 (0.0%) |
| 20 to 24 Years | 118 (100.0%) | 36 (30.5%) |
| 25 to 29 Years | 110 (100.0%) | 0 (0.0%) |
| 30 to 34 Years | 0 (0.0%) | 0 (0.0%) |
| 35 to 44 Years | 117 (72.2%) | 0 (0.0%) |
| 45 to 54 Years | 308 (100.0%) | 0 (0.0%) |
| 55 to 59 Years | 96 (40.9%) | 0 (0.0%) |
| 60 to 64 Years | 141 (82.0%) | 0 (0.0%) |
| 65 to 74 Years | 0 (0.0%) | 0 (0.0%) |
| 75 Years and over | 0 (0.0%) | 0 (0.0%) |
| Total | 920 (81.1%) | 36 (3.9%) |
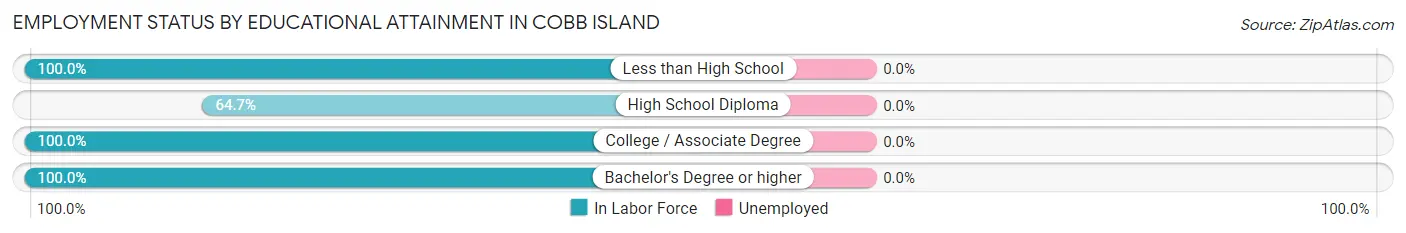
Employment Status by Educational Attainment in Cobb Island
| Educational Attainment | In Labor Force | Unemployed |
| Less than High School | 48 (100.0%) | 0 (0.0%) |
| High School Diploma | 394 (64.7%) | 0 (0.0%) |
| College / Associate Degree | 261 (100.0%) | 0 (0.0%) |
| Bachelor's Degree or higher | 69 (100.0%) | 0 (0.0%) |
| Total | 772 (78.2%) | 0 (0.0%) |
Employment Occupations by Sex in Cobb Island
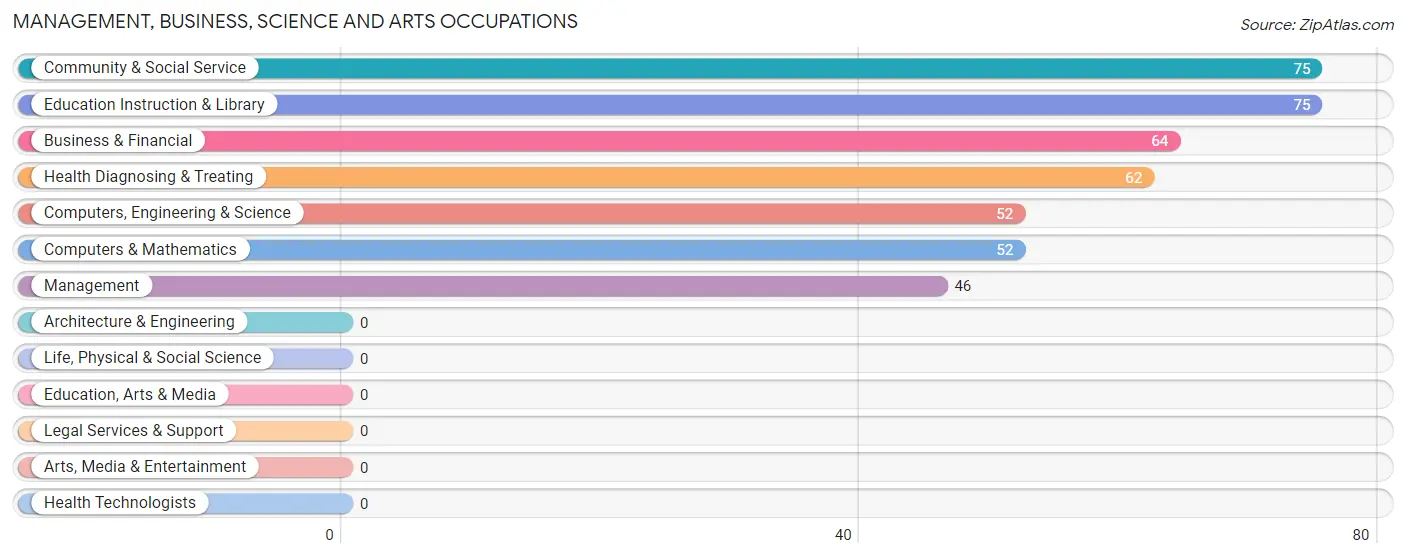
Management, Business, Science and Arts Occupations
The most common Management, Business, Science and Arts occupations in Cobb Island are Community & Social Service (75 | 8.5%), Education Instruction & Library (75 | 8.5%), Business & Financial (64 | 7.2%), Health Diagnosing & Treating (62 | 7.0%), and Computers, Engineering & Science (52 | 5.9%).
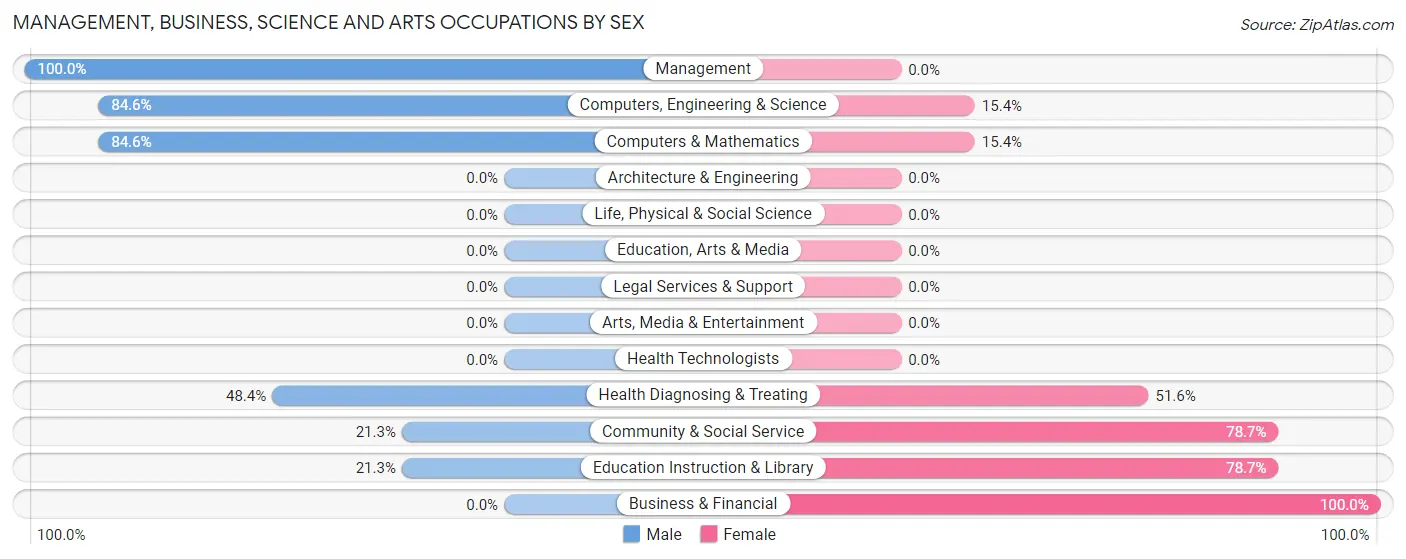
Management, Business, Science and Arts Occupations by Sex
Within the Management, Business, Science and Arts occupations in Cobb Island, the most male-oriented occupations are Management (100.0%), Computers, Engineering & Science (84.6%), and Computers & Mathematics (84.6%), while the most female-oriented occupations are Business & Financial (100.0%), Community & Social Service (78.7%), and Education Instruction & Library (78.7%).
| Occupation | Male | Female |
| Management | 46 (100.0%) | 0 (0.0%) |
| Business & Financial | 0 (0.0%) | 64 (100.0%) |
| Computers, Engineering & Science | 44 (84.6%) | 8 (15.4%) |
| Computers & Mathematics | 44 (84.6%) | 8 (15.4%) |
| Architecture & Engineering | 0 (0.0%) | 0 (0.0%) |
| Life, Physical & Social Science | 0 (0.0%) | 0 (0.0%) |
| Community & Social Service | 16 (21.3%) | 59 (78.7%) |
| Education, Arts & Media | 0 (0.0%) | 0 (0.0%) |
| Legal Services & Support | 0 (0.0%) | 0 (0.0%) |
| Education Instruction & Library | 16 (21.3%) | 59 (78.7%) |
| Arts, Media & Entertainment | 0 (0.0%) | 0 (0.0%) |
| Health Diagnosing & Treating | 30 (48.4%) | 32 (51.6%) |
| Health Technologists | 0 (0.0%) | 0 (0.0%) |
| Total (Category) | 136 (45.5%) | 163 (54.5%) |
| Total (Overall) | 552 (62.4%) | 332 (37.6%) |
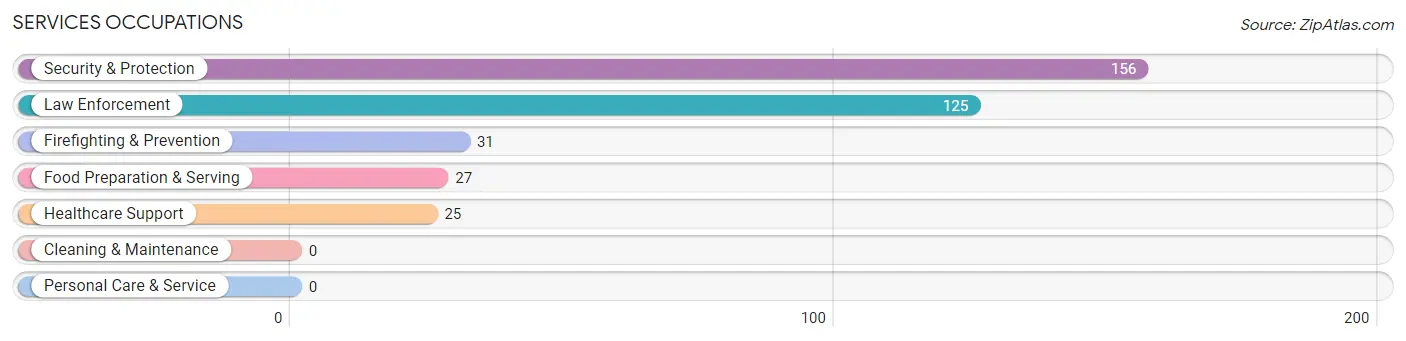
Services Occupations
The most common Services occupations in Cobb Island are Security & Protection (156 | 17.6%), Law Enforcement (125 | 14.1%), Firefighting & Prevention (31 | 3.5%), Food Preparation & Serving (27 | 3.0%), and Healthcare Support (25 | 2.8%).
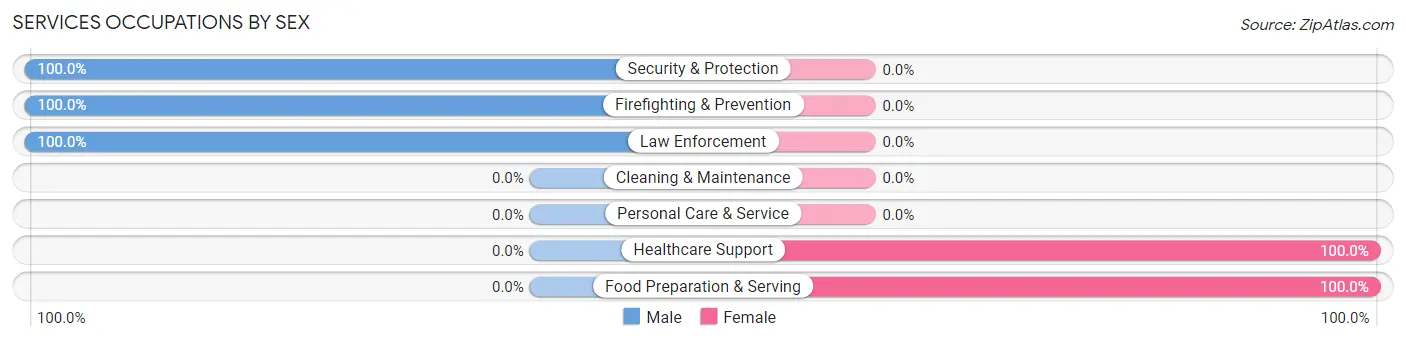
Services Occupations by Sex
Within the Services occupations in Cobb Island, the most male-oriented occupations are Security & Protection (100.0%), Firefighting & Prevention (100.0%), and Law Enforcement (100.0%), while the most female-oriented occupations are Healthcare Support (100.0%), and Food Preparation & Serving (100.0%).
| Occupation | Male | Female |
| Healthcare Support | 0 (0.0%) | 25 (100.0%) |
| Security & Protection | 156 (100.0%) | 0 (0.0%) |
| Firefighting & Prevention | 31 (100.0%) | 0 (0.0%) |
| Law Enforcement | 125 (100.0%) | 0 (0.0%) |
| Food Preparation & Serving | 0 (0.0%) | 27 (100.0%) |
| Cleaning & Maintenance | 0 (0.0%) | 0 (0.0%) |
| Personal Care & Service | 0 (0.0%) | 0 (0.0%) |
| Total (Category) | 156 (75.0%) | 52 (25.0%) |
| Total (Overall) | 552 (62.4%) | 332 (37.6%) |
Sales and Office Occupations
The most common Sales and Office occupations in Cobb Island are Sales & Related (89 | 10.1%), and Office & Administration (49 | 5.5%).
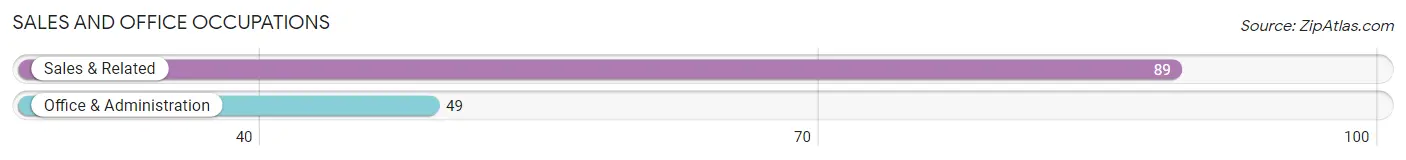
Sales and Office Occupations by Sex
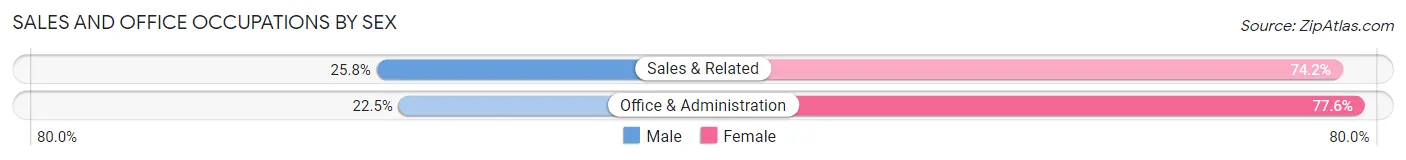
| Occupation | Male | Female |
| Sales & Related | 23 (25.8%) | 66 (74.2%) |
| Office & Administration | 11 (22.5%) | 38 (77.5%) |
| Total (Category) | 34 (24.6%) | 104 (75.4%) |
| Total (Overall) | 552 (62.4%) | 332 (37.6%) |
Natural Resources, Construction and Maintenance Occupations
The most common Natural Resources, Construction and Maintenance occupations in Cobb Island are Construction & Extraction (157 | 17.8%), and Installation, Maintenance & Repair (36 | 4.1%).
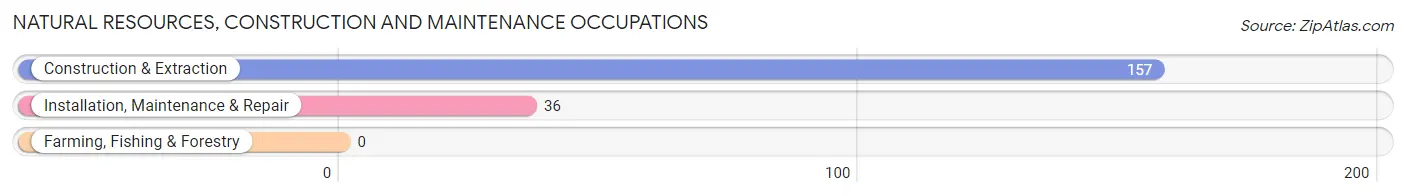
Natural Resources, Construction and Maintenance Occupations by Sex
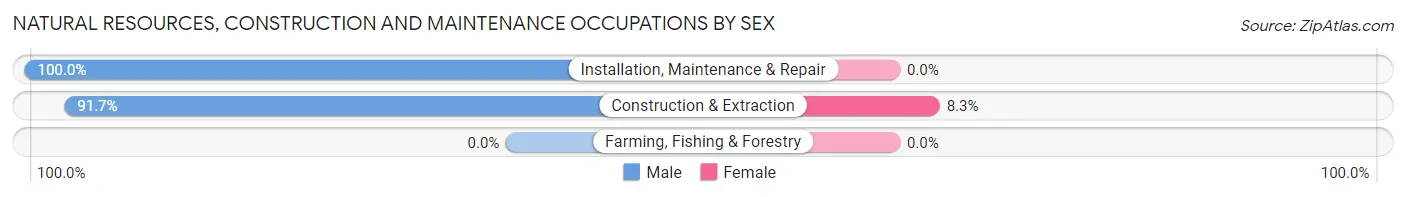
| Occupation | Male | Female |
| Farming, Fishing & Forestry | 0 (0.0%) | 0 (0.0%) |
| Construction & Extraction | 144 (91.7%) | 13 (8.3%) |
| Installation, Maintenance & Repair | 36 (100.0%) | 0 (0.0%) |
| Total (Category) | 180 (93.3%) | 13 (6.7%) |
| Total (Overall) | 552 (62.4%) | 332 (37.6%) |
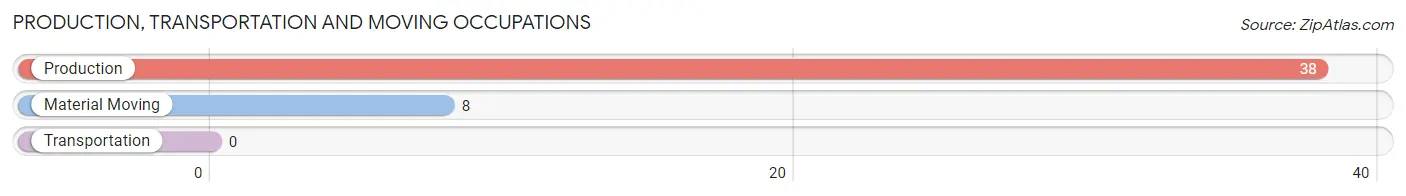
Production, Transportation and Moving Occupations
The most common Production, Transportation and Moving occupations in Cobb Island are Production (38 | 4.3%), and Material Moving (8 | 0.9%).
Production, Transportation and Moving Occupations by Sex
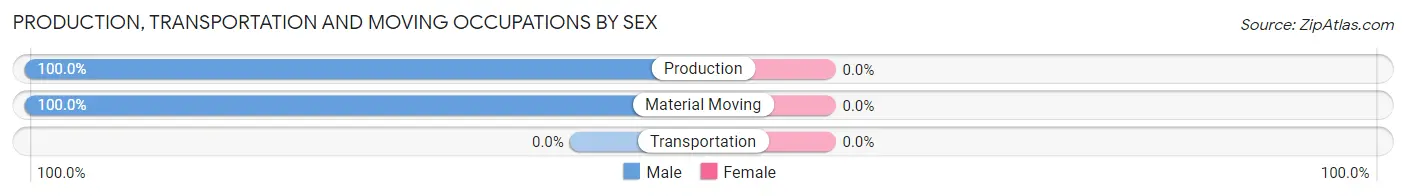
| Occupation | Male | Female |
| Production | 38 (100.0%) | 0 (0.0%) |
| Transportation | 0 (0.0%) | 0 (0.0%) |
| Material Moving | 8 (100.0%) | 0 (0.0%) |
| Total (Category) | 46 (100.0%) | 0 (0.0%) |
| Total (Overall) | 552 (62.4%) | 332 (37.6%) |
Employment Industries by Sex in Cobb Island
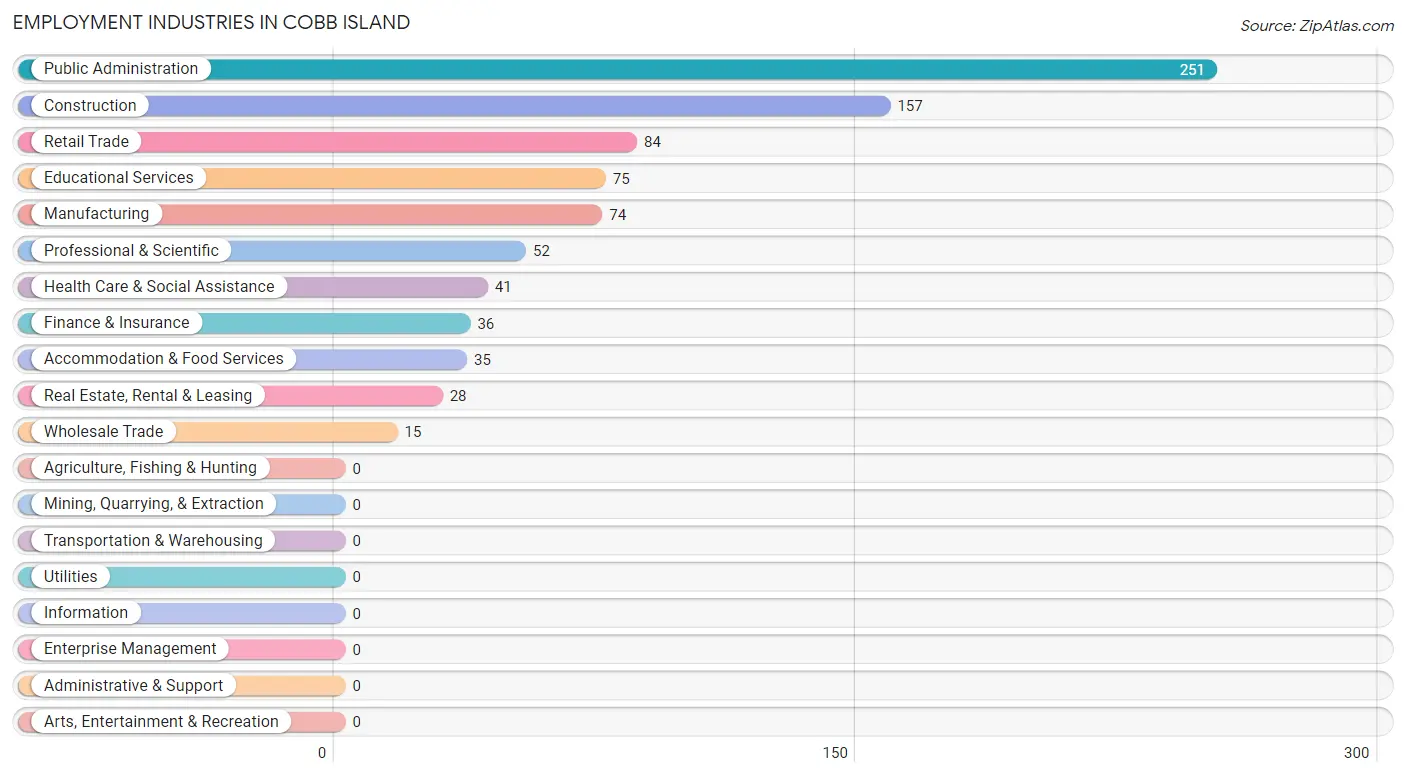
Employment Industries in Cobb Island
The major employment industries in Cobb Island include Public Administration (251 | 28.4%), Construction (157 | 17.8%), Retail Trade (84 | 9.5%), Educational Services (75 | 8.5%), and Manufacturing (74 | 8.4%).
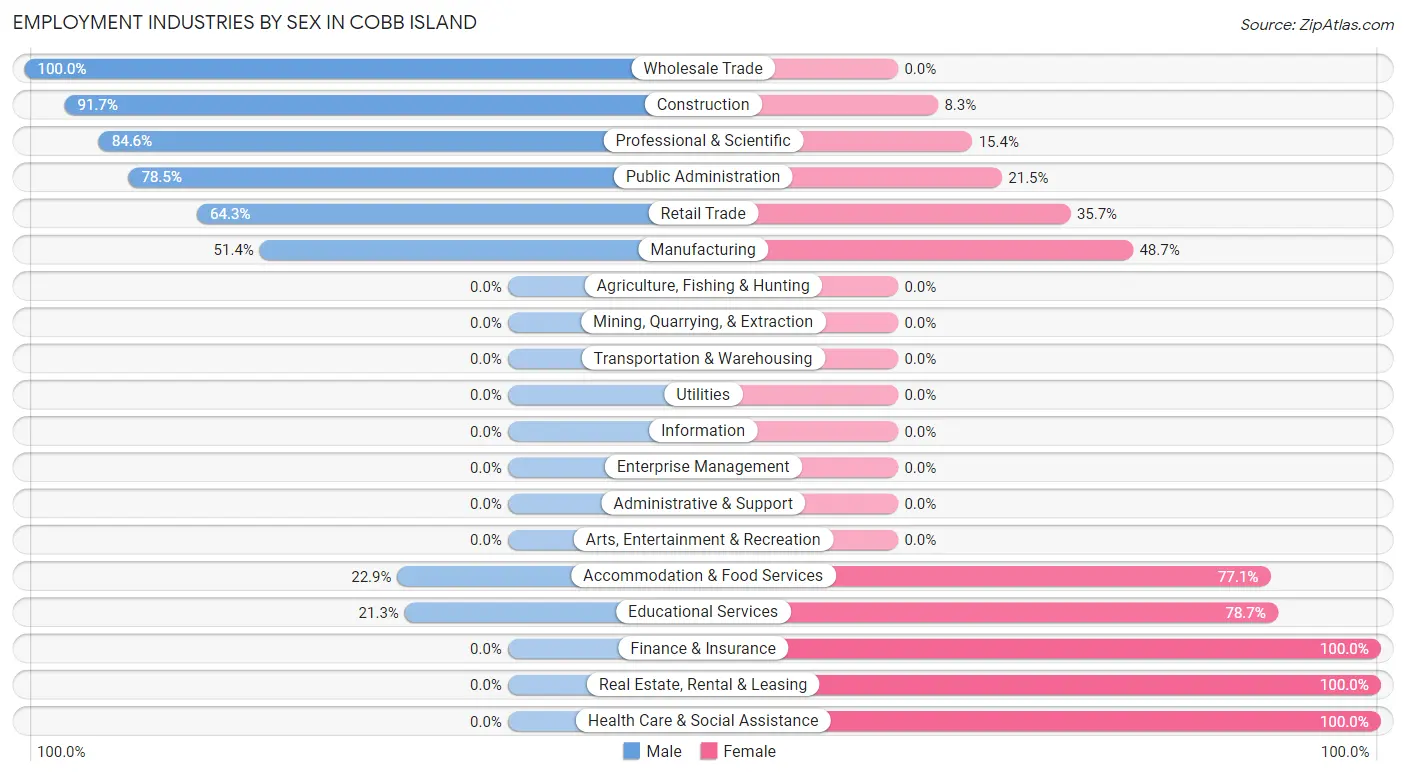
Employment Industries by Sex in Cobb Island
The Cobb Island industries that see more men than women are Wholesale Trade (100.0%), Construction (91.7%), and Professional & Scientific (84.6%), whereas the industries that tend to have a higher number of women are Finance & Insurance (100.0%), Real Estate, Rental & Leasing (100.0%), and Health Care & Social Assistance (100.0%).
| Industry | Male | Female |
| Agriculture, Fishing & Hunting | 0 (0.0%) | 0 (0.0%) |
| Mining, Quarrying, & Extraction | 0 (0.0%) | 0 (0.0%) |
| Construction | 144 (91.7%) | 13 (8.3%) |
| Manufacturing | 38 (51.3%) | 36 (48.6%) |
| Wholesale Trade | 15 (100.0%) | 0 (0.0%) |
| Retail Trade | 54 (64.3%) | 30 (35.7%) |
| Transportation & Warehousing | 0 (0.0%) | 0 (0.0%) |
| Utilities | 0 (0.0%) | 0 (0.0%) |
| Information | 0 (0.0%) | 0 (0.0%) |
| Finance & Insurance | 0 (0.0%) | 36 (100.0%) |
| Real Estate, Rental & Leasing | 0 (0.0%) | 28 (100.0%) |
| Professional & Scientific | 44 (84.6%) | 8 (15.4%) |
| Enterprise Management | 0 (0.0%) | 0 (0.0%) |
| Administrative & Support | 0 (0.0%) | 0 (0.0%) |
| Educational Services | 16 (21.3%) | 59 (78.7%) |
| Health Care & Social Assistance | 0 (0.0%) | 41 (100.0%) |
| Arts, Entertainment & Recreation | 0 (0.0%) | 0 (0.0%) |
| Accommodation & Food Services | 8 (22.9%) | 27 (77.1%) |
| Public Administration | 197 (78.5%) | 54 (21.5%) |
| Total | 552 (62.4%) | 332 (37.6%) |
Education in Cobb Island
School Enrollment in Cobb Island
The most common levels of schooling among the 271 students in Cobb Island are high school (89 | 32.8%), middle school (74 | 27.3%), and college / undergraduate (65 | 24.0%).
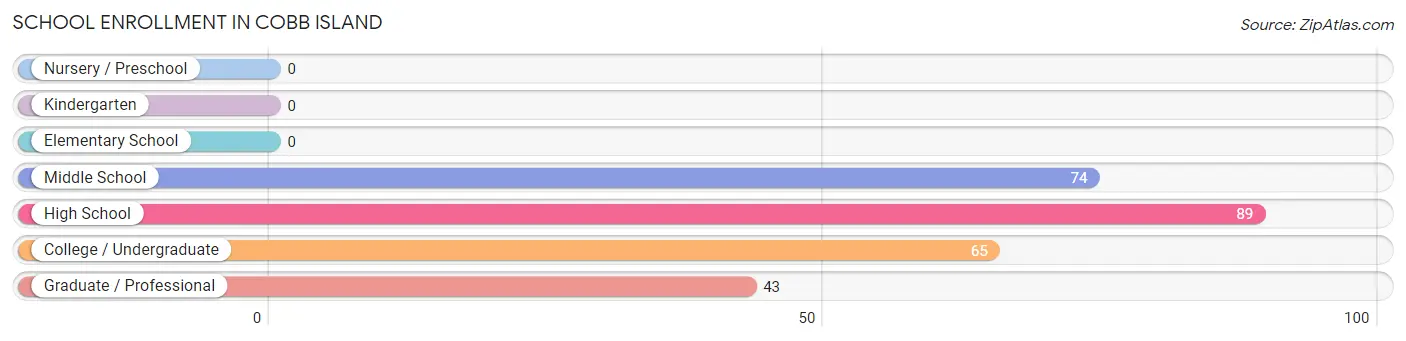
| School Level | # Students | % Students |
| Nursery / Preschool | 0 | 0.0% |
| Kindergarten | 0 | 0.0% |
| Elementary School | 0 | 0.0% |
| Middle School | 74 | 27.3% |
| High School | 89 | 32.8% |
| College / Undergraduate | 65 | 24.0% |
| Graduate / Professional | 43 | 15.9% |
| Total | 271 | 100.0% |
School Enrollment by Age by Funding Source in Cobb Island
Out of a total of 271 students who are enrolled in schools in Cobb Island, 46 (17.0%) attend a private institution, while the remaining 225 (83.0%) are enrolled in public schools. The age group of 18 to 19 year olds has the highest likelihood of being enrolled in private schools, with 30 (100.0% in the age bracket) enrolled. Conversely, the age group of 10 to 14 year olds has the lowest likelihood of being enrolled in a private school, with 74 (100.0% in the age bracket) attending a public institution.
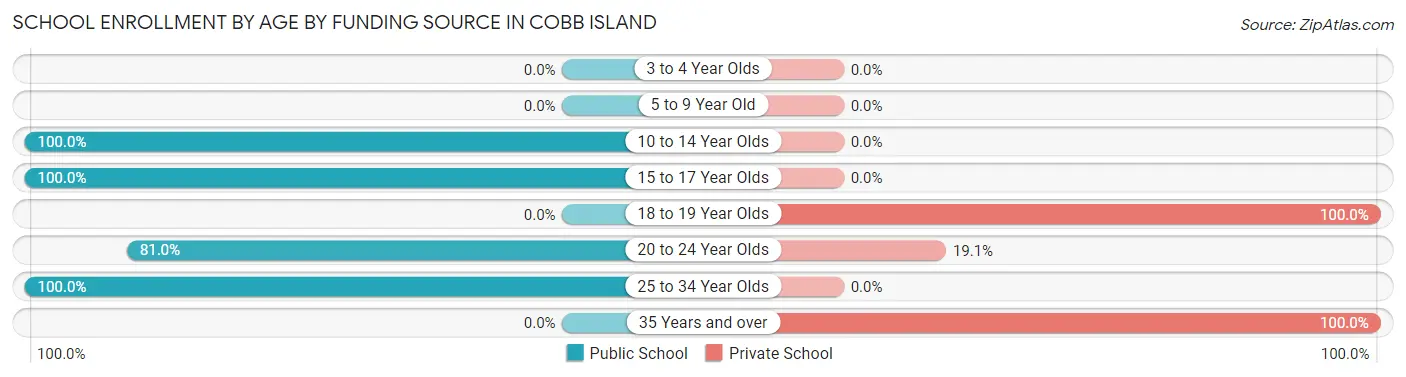
| Age Bracket | Public School | Private School |
| 3 to 4 Year Olds | 0 (0.0%) | 0 (0.0%) |
| 5 to 9 Year Old | 0 (0.0%) | 0 (0.0%) |
| 10 to 14 Year Olds | 74 (100.0%) | 0 (0.0%) |
| 15 to 17 Year Olds | 59 (100.0%) | 0 (0.0%) |
| 18 to 19 Year Olds | 0 (0.0%) | 30 (100.0%) |
| 20 to 24 Year Olds | 34 (80.9%) | 8 (19.1%) |
| 25 to 34 Year Olds | 58 (100.0%) | 0 (0.0%) |
| 35 Years and over | 0 (0.0%) | 8 (100.0%) |
| Total | 225 (83.0%) | 46 (17.0%) |
Educational Attainment by Field of Study in Cobb Island
Education (27 | 39.1%), literature & languages (16 | 23.2%), computers & mathematics (10 | 14.5%), psychology (8 | 11.6%), and arts & humanities (8 | 11.6%) are the most common fields of study among 69 individuals in Cobb Island who have obtained a bachelor's degree or higher.
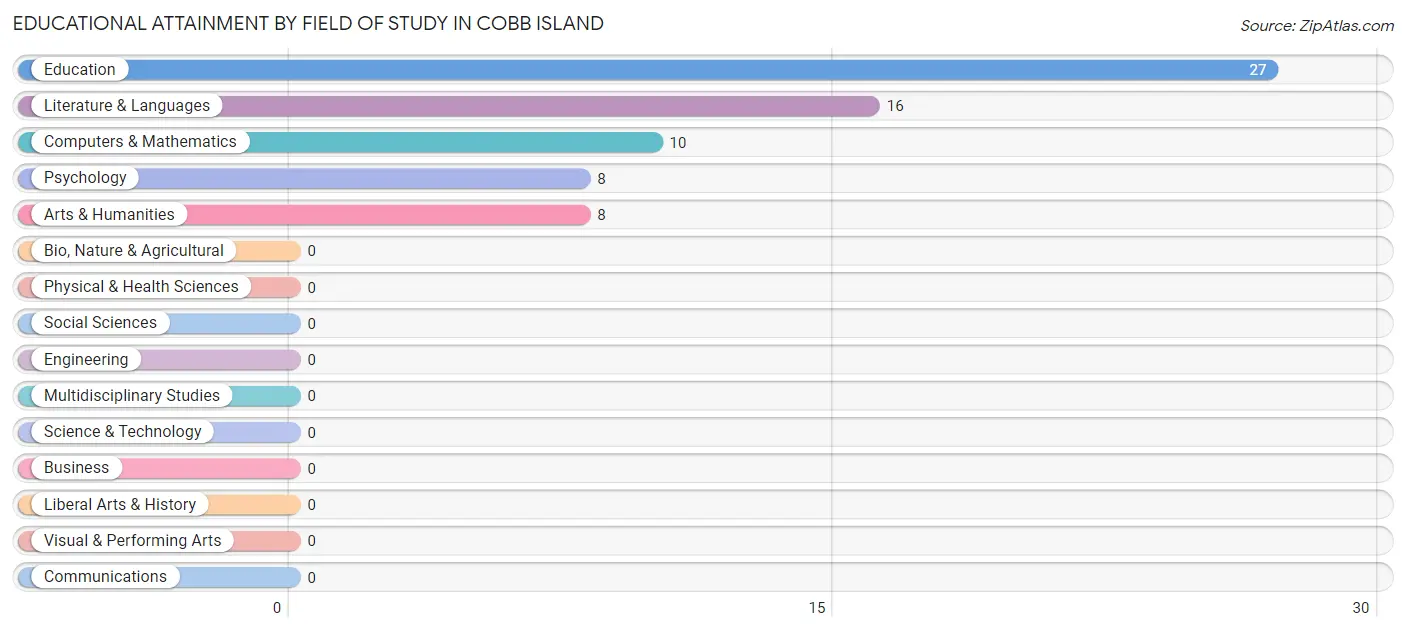
| Field of Study | # Graduates | % Graduates |
| Computers & Mathematics | 10 | 14.5% |
| Bio, Nature & Agricultural | 0 | 0.0% |
| Physical & Health Sciences | 0 | 0.0% |
| Psychology | 8 | 11.6% |
| Social Sciences | 0 | 0.0% |
| Engineering | 0 | 0.0% |
| Multidisciplinary Studies | 0 | 0.0% |
| Science & Technology | 0 | 0.0% |
| Business | 0 | 0.0% |
| Education | 27 | 39.1% |
| Literature & Languages | 16 | 23.2% |
| Liberal Arts & History | 0 | 0.0% |
| Visual & Performing Arts | 0 | 0.0% |
| Communications | 0 | 0.0% |
| Arts & Humanities | 8 | 11.6% |
| Total | 69 | 100.0% |
Transportation & Commute in Cobb Island
Vehicle Availability by Sex in Cobb Island
The most prevalent vehicle ownership categories in Cobb Island are males with 2 vehicles (331, accounting for 60.0%) and females with 2 vehicles (207, making up 99.7%).
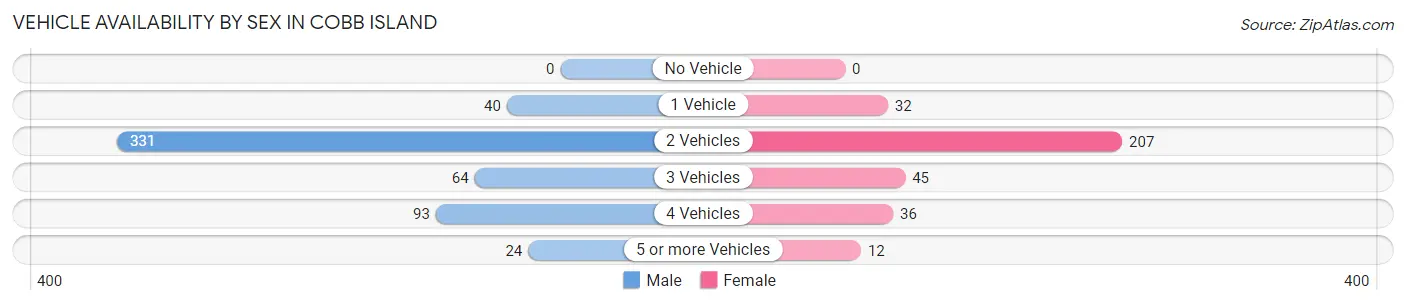
| Vehicles Available | Male | Female |
| No Vehicle | 0 (0.0%) | 0 (0.0%) |
| 1 Vehicle | 40 (7.2%) | 32 (9.6%) |
| 2 Vehicles | 331 (60.0%) | 207 (62.4%) |
| 3 Vehicles | 64 (11.6%) | 45 (13.6%) |
| 4 Vehicles | 93 (16.9%) | 36 (10.8%) |
| 5 or more Vehicles | 24 (4.3%) | 12 (3.6%) |
| Total | 552 (100.0%) | 332 (100.0%) |
Commute Time in Cobb Island
The most frequently occuring commute durations in Cobb Island are 45 to 59 minutes (219 commuters, 25.9%), 30 to 34 minutes (178 commuters, 21.0%), and 90 or more minutes (137 commuters, 16.2%).
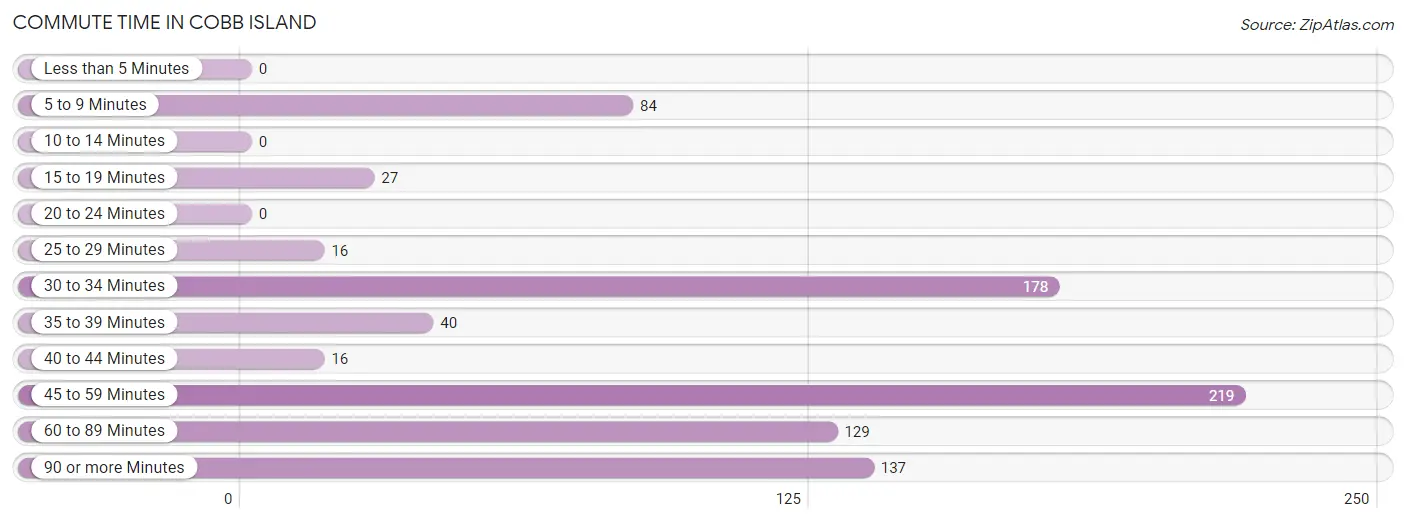
| Commute Time | # Commuters | % Commuters |
| Less than 5 Minutes | 0 | 0.0% |
| 5 to 9 Minutes | 84 | 9.9% |
| 10 to 14 Minutes | 0 | 0.0% |
| 15 to 19 Minutes | 27 | 3.2% |
| 20 to 24 Minutes | 0 | 0.0% |
| 25 to 29 Minutes | 16 | 1.9% |
| 30 to 34 Minutes | 178 | 21.0% |
| 35 to 39 Minutes | 40 | 4.7% |
| 40 to 44 Minutes | 16 | 1.9% |
| 45 to 59 Minutes | 219 | 25.9% |
| 60 to 89 Minutes | 129 | 15.2% |
| 90 or more Minutes | 137 | 16.2% |
Commute Time by Sex in Cobb Island
The most common commute times in Cobb Island are 45 to 59 minutes (181 commuters, 33.4%) for males and 30 to 34 minutes (98 commuters, 32.2%) for females.
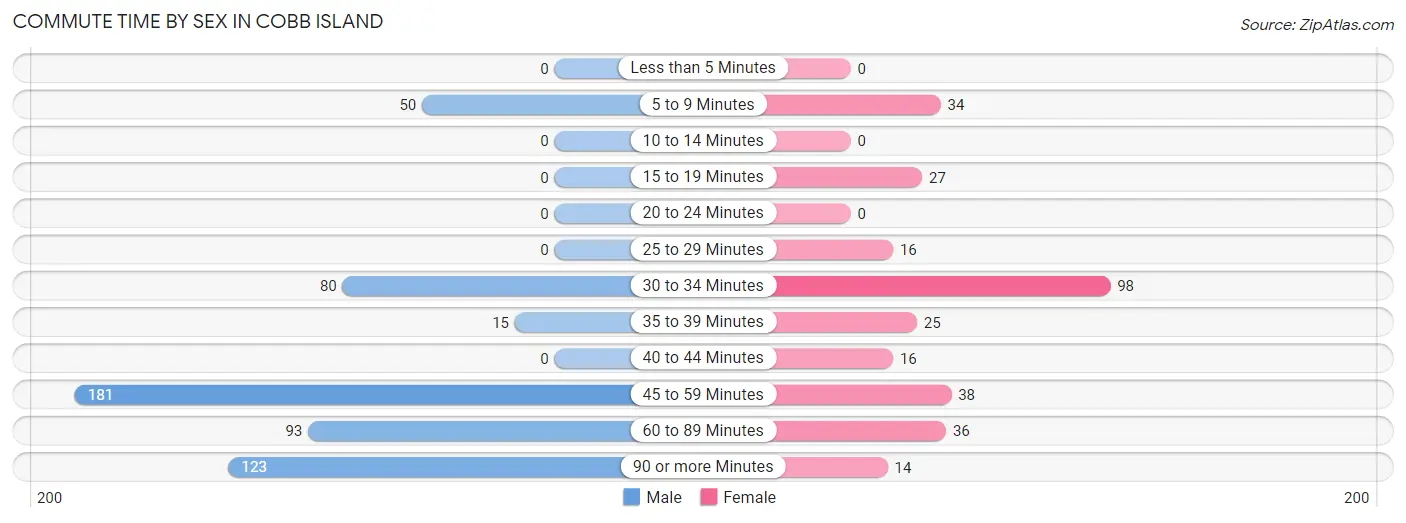
| Commute Time | Male | Female |
| Less than 5 Minutes | 0 (0.0%) | 0 (0.0%) |
| 5 to 9 Minutes | 50 (9.2%) | 34 (11.2%) |
| 10 to 14 Minutes | 0 (0.0%) | 0 (0.0%) |
| 15 to 19 Minutes | 0 (0.0%) | 27 (8.9%) |
| 20 to 24 Minutes | 0 (0.0%) | 0 (0.0%) |
| 25 to 29 Minutes | 0 (0.0%) | 16 (5.3%) |
| 30 to 34 Minutes | 80 (14.8%) | 98 (32.2%) |
| 35 to 39 Minutes | 15 (2.8%) | 25 (8.2%) |
| 40 to 44 Minutes | 0 (0.0%) | 16 (5.3%) |
| 45 to 59 Minutes | 181 (33.4%) | 38 (12.5%) |
| 60 to 89 Minutes | 93 (17.2%) | 36 (11.8%) |
| 90 or more Minutes | 123 (22.7%) | 14 (4.6%) |
Time of Departure to Work by Sex in Cobb Island
The most frequent times of departure to work in Cobb Island are 12:00 AM to 4:59 AM (227, 41.9%) for males and 7:30 AM to 7:59 AM (81, 26.6%) for females.
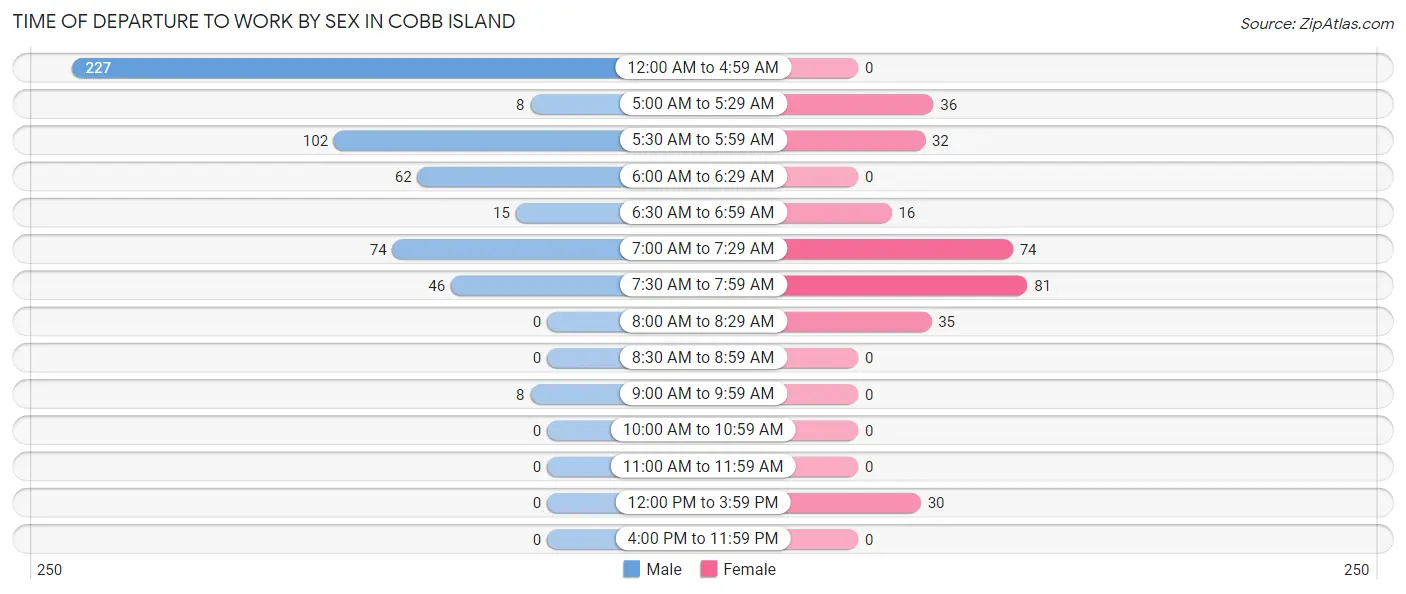
| Time of Departure | Male | Female |
| 12:00 AM to 4:59 AM | 227 (41.9%) | 0 (0.0%) |
| 5:00 AM to 5:29 AM | 8 (1.5%) | 36 (11.8%) |
| 5:30 AM to 5:59 AM | 102 (18.8%) | 32 (10.5%) |
| 6:00 AM to 6:29 AM | 62 (11.4%) | 0 (0.0%) |
| 6:30 AM to 6:59 AM | 15 (2.8%) | 16 (5.3%) |
| 7:00 AM to 7:29 AM | 74 (13.7%) | 74 (24.3%) |
| 7:30 AM to 7:59 AM | 46 (8.5%) | 81 (26.6%) |
| 8:00 AM to 8:29 AM | 0 (0.0%) | 35 (11.5%) |
| 8:30 AM to 8:59 AM | 0 (0.0%) | 0 (0.0%) |
| 9:00 AM to 9:59 AM | 8 (1.5%) | 0 (0.0%) |
| 10:00 AM to 10:59 AM | 0 (0.0%) | 0 (0.0%) |
| 11:00 AM to 11:59 AM | 0 (0.0%) | 0 (0.0%) |
| 12:00 PM to 3:59 PM | 0 (0.0%) | 30 (9.9%) |
| 4:00 PM to 11:59 PM | 0 (0.0%) | 0 (0.0%) |
| Total | 542 (100.0%) | 304 (100.0%) |
Housing Occupancy in Cobb Island
Occupancy by Ownership in Cobb Island
Of the total 514 dwellings in Cobb Island, owner-occupied units account for 456 (88.7%), while renter-occupied units make up 58 (11.3%).
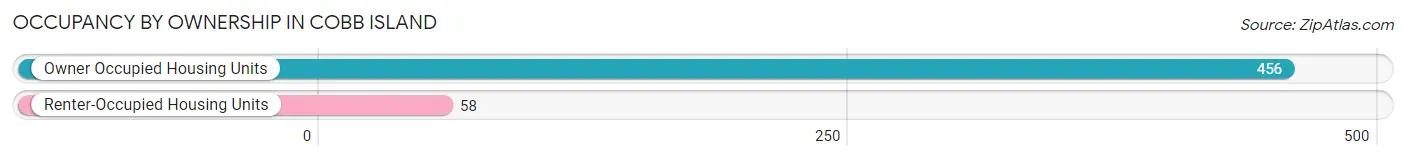
| Occupancy | # Housing Units | % Housing Units |
| Owner Occupied Housing Units | 456 | 88.7% |
| Renter-Occupied Housing Units | 58 | 11.3% |
| Total Occupied Housing Units | 514 | 100.0% |
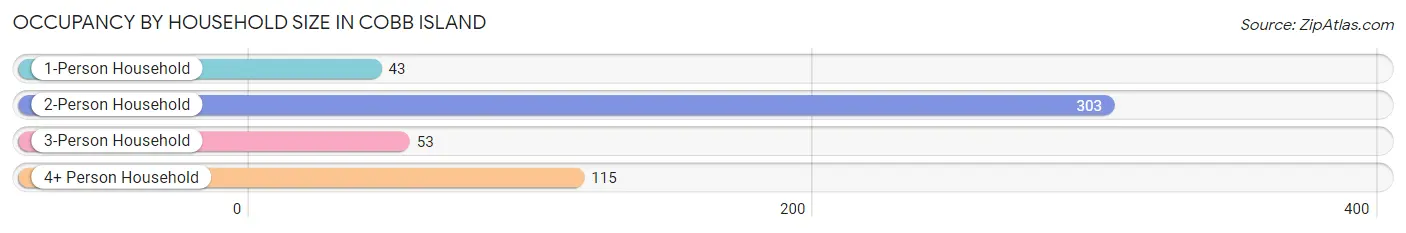
Occupancy by Household Size in Cobb Island
| Household Size | # Housing Units | % Housing Units |
| 1-Person Household | 43 | 8.4% |
| 2-Person Household | 303 | 59.0% |
| 3-Person Household | 53 | 10.3% |
| 4+ Person Household | 115 | 22.4% |
| Total Housing Units | 514 | 100.0% |
Occupancy by Ownership by Household Size in Cobb Island
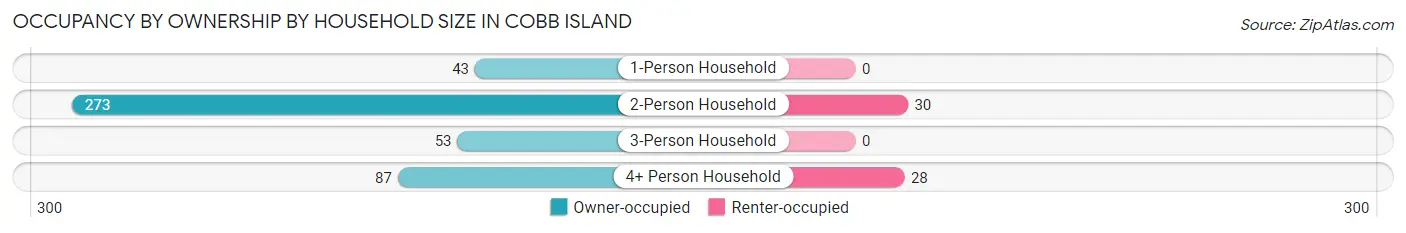
| Household Size | Owner-occupied | Renter-occupied |
| 1-Person Household | 43 (100.0%) | 0 (0.0%) |
| 2-Person Household | 273 (90.1%) | 30 (9.9%) |
| 3-Person Household | 53 (100.0%) | 0 (0.0%) |
| 4+ Person Household | 87 (75.6%) | 28 (24.3%) |
| Total Housing Units | 456 (88.7%) | 58 (11.3%) |
Occupancy by Educational Attainment in Cobb Island
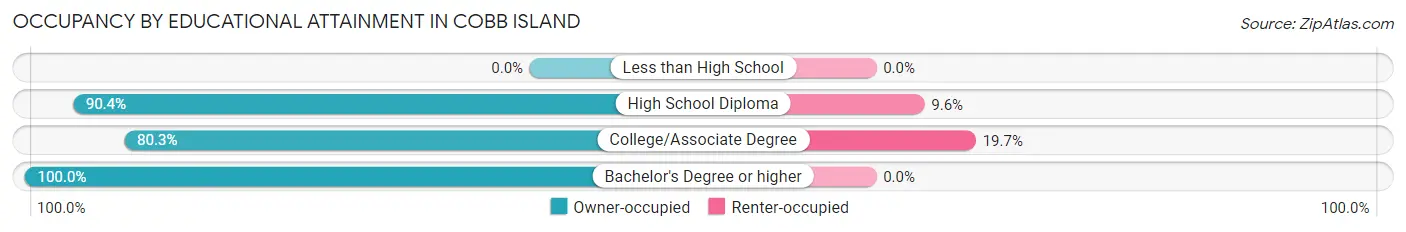
| Household Size | Owner-occupied | Renter-occupied |
| Less than High School | 0 (0.0%) | 0 (0.0%) |
| High School Diploma | 265 (90.4%) | 28 (9.6%) |
| College/Associate Degree | 122 (80.3%) | 30 (19.7%) |
| Bachelor's Degree or higher | 69 (100.0%) | 0 (0.0%) |
Occupancy by Age of Householder in Cobb Island
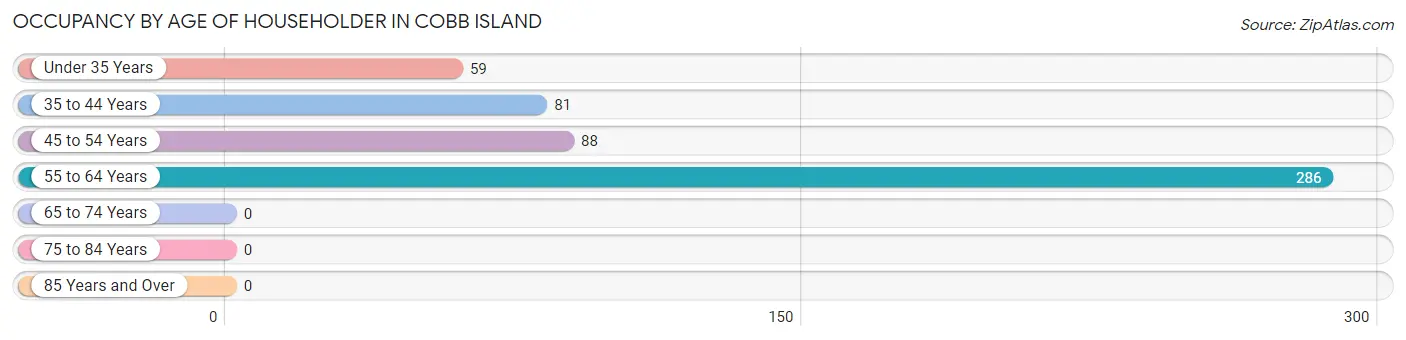
| Age Bracket | # Households | % Households |
| Under 35 Years | 59 | 11.5% |
| 35 to 44 Years | 81 | 15.8% |
| 45 to 54 Years | 88 | 17.1% |
| 55 to 64 Years | 286 | 55.6% |
| 65 to 74 Years | 0 | 0.0% |
| 75 to 84 Years | 0 | 0.0% |
| 85 Years and Over | 0 | 0.0% |
| Total | 514 | 100.0% |
Housing Finances in Cobb Island
Median Income by Occupancy in Cobb Island
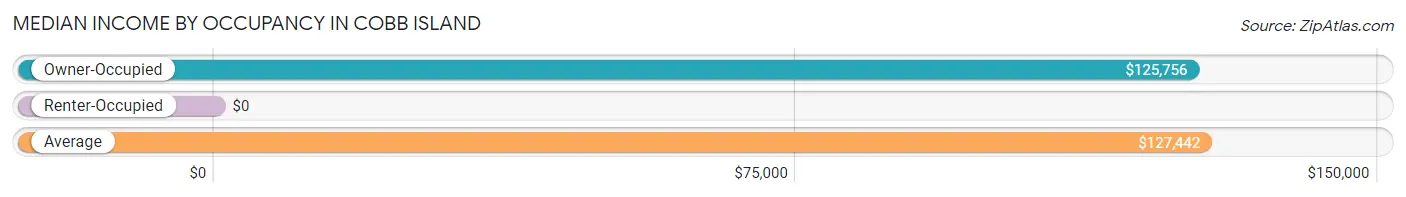
| Occupancy Type | # Households | Median Income |
| Owner-Occupied | 456 (88.7%) | $125,756 |
| Renter-Occupied | 58 (11.3%) | $0 |
| Average | 514 (100.0%) | $127,442 |
Occupancy by Householder Income Bracket in Cobb Island
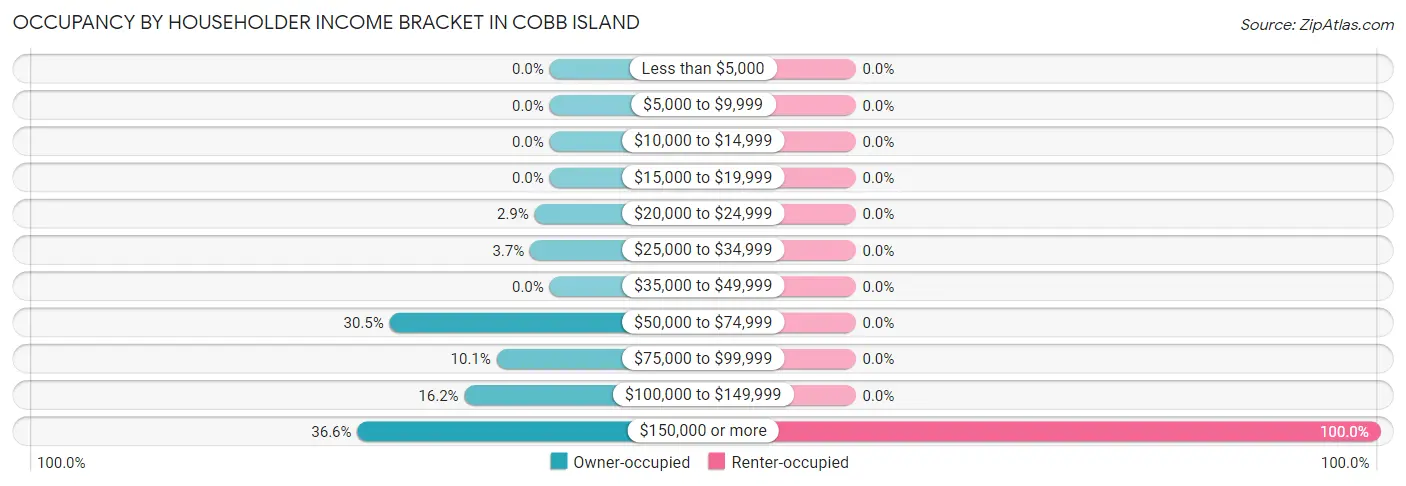
| Income Bracket | Owner-occupied | Renter-occupied |
| Less than $5,000 | 0 (0.0%) | 0 (0.0%) |
| $5,000 to $9,999 | 0 (0.0%) | 0 (0.0%) |
| $10,000 to $14,999 | 0 (0.0%) | 0 (0.0%) |
| $15,000 to $19,999 | 0 (0.0%) | 0 (0.0%) |
| $20,000 to $24,999 | 13 (2.9%) | 0 (0.0%) |
| $25,000 to $34,999 | 17 (3.7%) | 0 (0.0%) |
| $35,000 to $49,999 | 0 (0.0%) | 0 (0.0%) |
| $50,000 to $74,999 | 139 (30.5%) | 0 (0.0%) |
| $75,000 to $99,999 | 46 (10.1%) | 0 (0.0%) |
| $100,000 to $149,999 | 74 (16.2%) | 0 (0.0%) |
| $150,000 or more | 167 (36.6%) | 58 (100.0%) |
| Total | 456 (100.0%) | 58 (100.0%) |
Monthly Housing Cost Tiers in Cobb Island
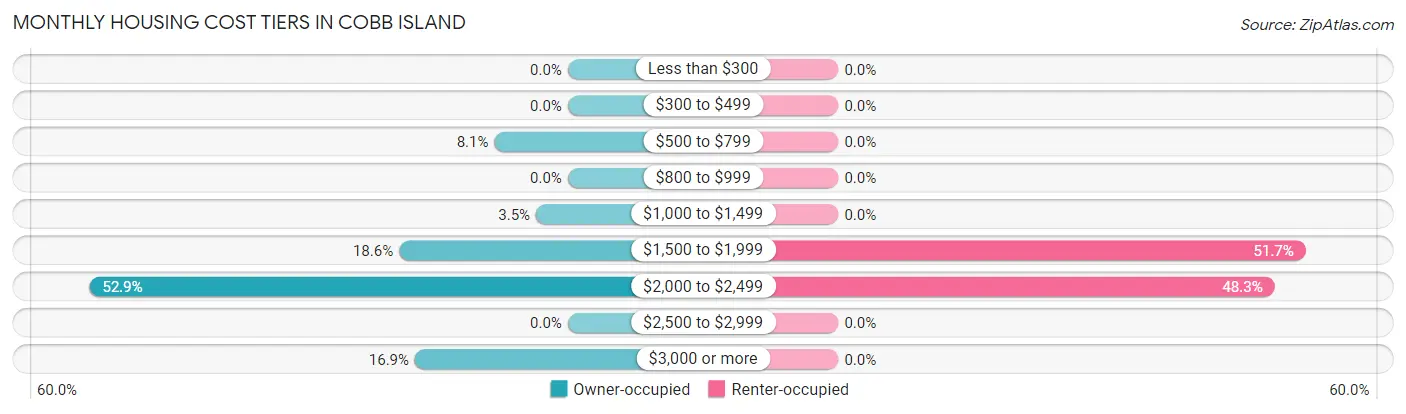
| Monthly Cost | Owner-occupied | Renter-occupied |
| Less than $300 | 0 (0.0%) | 0 (0.0%) |
| $300 to $499 | 0 (0.0%) | 0 (0.0%) |
| $500 to $799 | 37 (8.1%) | 0 (0.0%) |
| $800 to $999 | 0 (0.0%) | 0 (0.0%) |
| $1,000 to $1,499 | 16 (3.5%) | 0 (0.0%) |
| $1,500 to $1,999 | 85 (18.6%) | 30 (51.7%) |
| $2,000 to $2,499 | 241 (52.8%) | 28 (48.3%) |
| $2,500 to $2,999 | 0 (0.0%) | 0 (0.0%) |
| $3,000 or more | 77 (16.9%) | 0 (0.0%) |
| Total | 456 (100.0%) | 58 (100.0%) |
Physical Housing Characteristics in Cobb Island
Housing Structures in Cobb Island
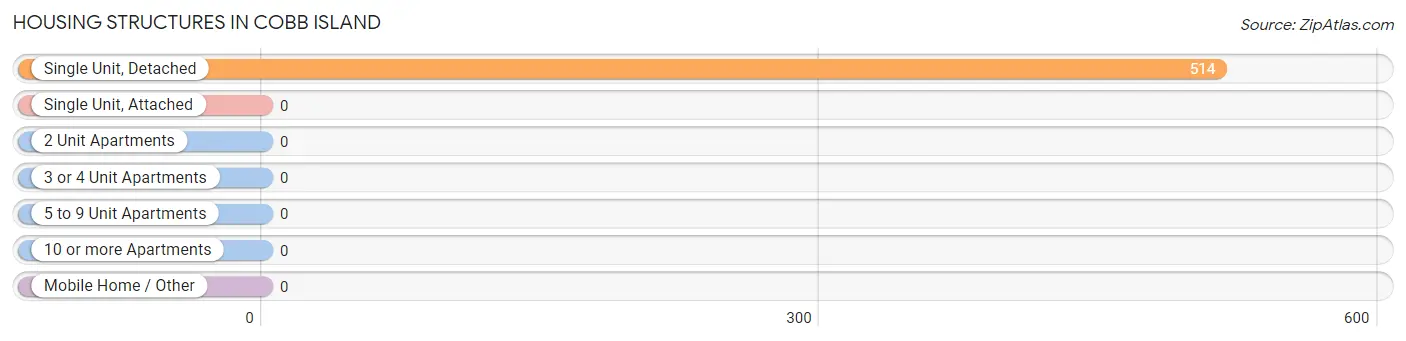
| Structure Type | # Housing Units | % Housing Units |
| Single Unit, Detached | 514 | 100.0% |
| Single Unit, Attached | 0 | 0.0% |
| 2 Unit Apartments | 0 | 0.0% |
| 3 or 4 Unit Apartments | 0 | 0.0% |
| 5 to 9 Unit Apartments | 0 | 0.0% |
| 10 or more Apartments | 0 | 0.0% |
| Mobile Home / Other | 0 | 0.0% |
| Total | 514 | 100.0% |
Housing Structures by Occupancy in Cobb Island
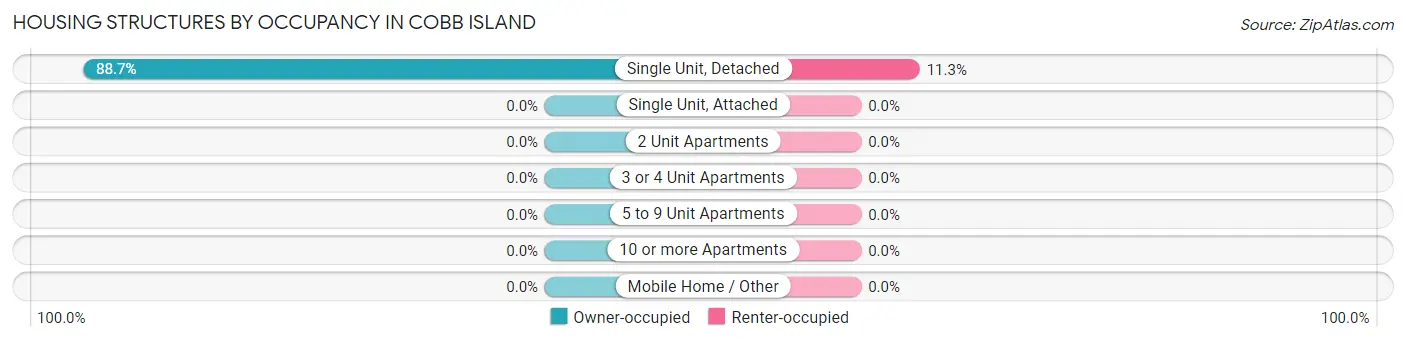
| Structure Type | Owner-occupied | Renter-occupied |
| Single Unit, Detached | 456 (88.7%) | 58 (11.3%) |
| Single Unit, Attached | 0 (0.0%) | 0 (0.0%) |
| 2 Unit Apartments | 0 (0.0%) | 0 (0.0%) |
| 3 or 4 Unit Apartments | 0 (0.0%) | 0 (0.0%) |
| 5 to 9 Unit Apartments | 0 (0.0%) | 0 (0.0%) |
| 10 or more Apartments | 0 (0.0%) | 0 (0.0%) |
| Mobile Home / Other | 0 (0.0%) | 0 (0.0%) |
| Total | 456 (88.7%) | 58 (11.3%) |
Housing Structures by Number of Rooms in Cobb Island
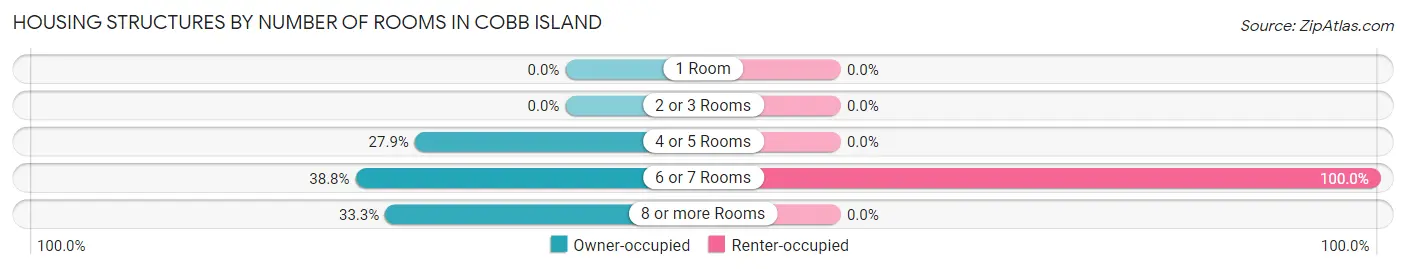
| Number of Rooms | Owner-occupied | Renter-occupied |
| 1 Room | 0 (0.0%) | 0 (0.0%) |
| 2 or 3 Rooms | 0 (0.0%) | 0 (0.0%) |
| 4 or 5 Rooms | 127 (27.9%) | 0 (0.0%) |
| 6 or 7 Rooms | 177 (38.8%) | 58 (100.0%) |
| 8 or more Rooms | 152 (33.3%) | 0 (0.0%) |
| Total | 456 (100.0%) | 58 (100.0%) |
Housing Structure by Heating Type in Cobb Island
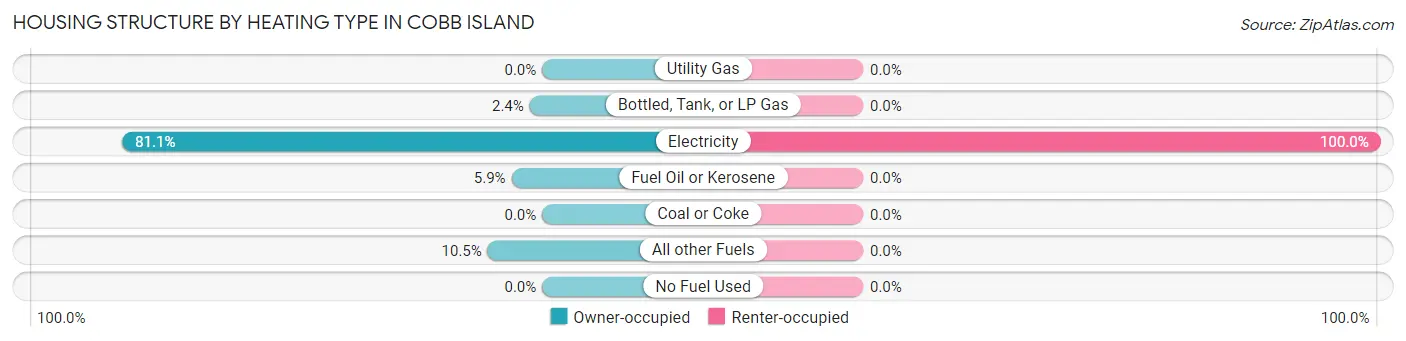
| Heating Type | Owner-occupied | Renter-occupied |
| Utility Gas | 0 (0.0%) | 0 (0.0%) |
| Bottled, Tank, or LP Gas | 11 (2.4%) | 0 (0.0%) |
| Electricity | 370 (81.1%) | 58 (100.0%) |
| Fuel Oil or Kerosene | 27 (5.9%) | 0 (0.0%) |
| Coal or Coke | 0 (0.0%) | 0 (0.0%) |
| All other Fuels | 48 (10.5%) | 0 (0.0%) |
| No Fuel Used | 0 (0.0%) | 0 (0.0%) |
| Total | 456 (100.0%) | 58 (100.0%) |
Household Vehicle Usage in Cobb Island
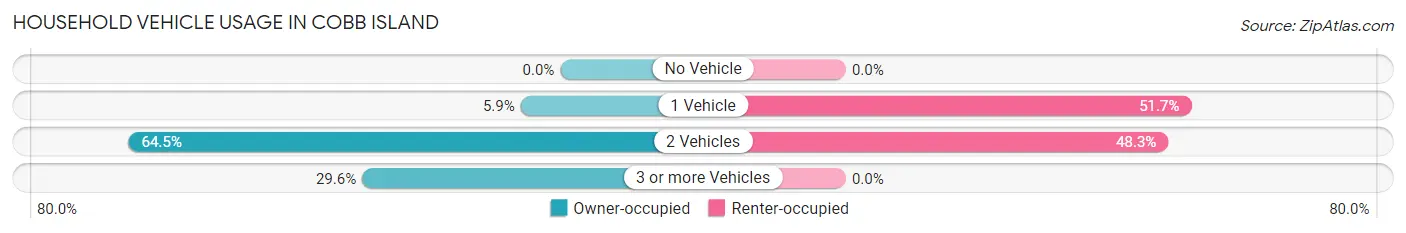
| Vehicles per Household | Owner-occupied | Renter-occupied |
| No Vehicle | 0 (0.0%) | 0 (0.0%) |
| 1 Vehicle | 27 (5.9%) | 30 (51.7%) |
| 2 Vehicles | 294 (64.5%) | 28 (48.3%) |
| 3 or more Vehicles | 135 (29.6%) | 0 (0.0%) |
| Total | 456 (100.0%) | 58 (100.0%) |
Real Estate & Mortgages in Cobb Island
Real Estate and Mortgage Overview in Cobb Island
| Characteristic | Without Mortgage | With Mortgage |
| Housing Units | 37 | 419 |
| Median Property Value | - | - |
| Median Household Income | - | - |
| Monthly Housing Costs | - | - |
| Real Estate Taxes | - | - |
Property Value by Mortgage Status in Cobb Island
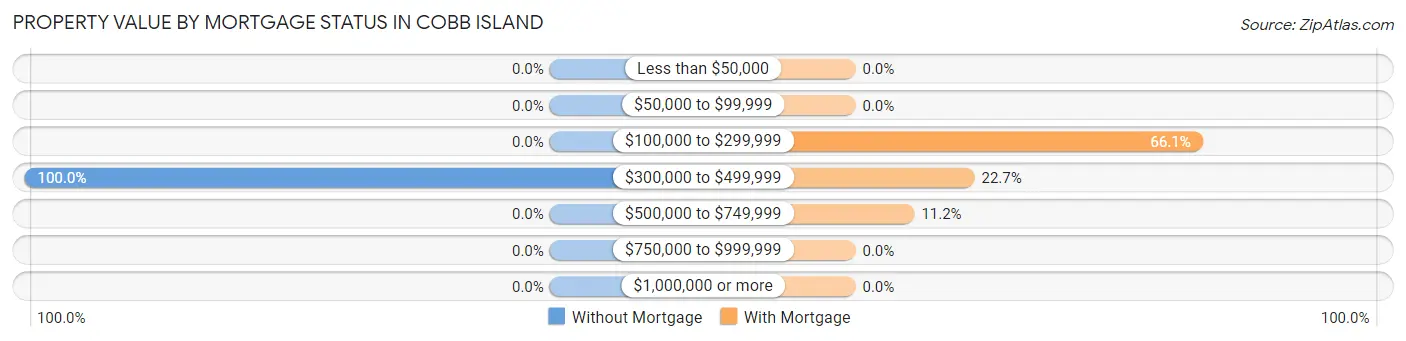
| Property Value | Without Mortgage | With Mortgage |
| Less than $50,000 | 0 (0.0%) | 0 (0.0%) |
| $50,000 to $99,999 | 0 (0.0%) | 0 (0.0%) |
| $100,000 to $299,999 | 0 (0.0%) | 277 (66.1%) |
| $300,000 to $499,999 | 37 (100.0%) | 95 (22.7%) |
| $500,000 to $749,999 | 0 (0.0%) | 47 (11.2%) |
| $750,000 to $999,999 | 0 (0.0%) | 0 (0.0%) |
| $1,000,000 or more | 0 (0.0%) | 0 (0.0%) |
| Total | 37 (100.0%) | 419 (100.0%) |
Household Income by Mortgage Status in Cobb Island
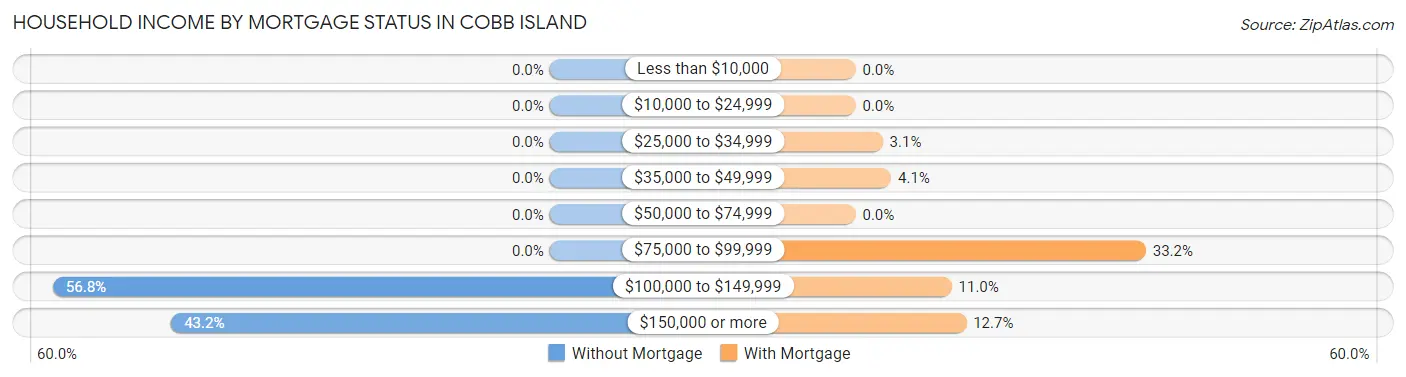
| Household Income | Without Mortgage | With Mortgage |
| Less than $10,000 | 0 (0.0%) | 0 (0.0%) |
| $10,000 to $24,999 | 0 (0.0%) | 0 (0.0%) |
| $25,000 to $34,999 | 0 (0.0%) | 13 (3.1%) |
| $35,000 to $49,999 | 0 (0.0%) | 17 (4.1%) |
| $50,000 to $74,999 | 0 (0.0%) | 0 (0.0%) |
| $75,000 to $99,999 | 0 (0.0%) | 139 (33.2%) |
| $100,000 to $149,999 | 21 (56.8%) | 46 (11.0%) |
| $150,000 or more | 16 (43.2%) | 53 (12.7%) |
| Total | 37 (100.0%) | 419 (100.0%) |
Property Value to Household Income Ratio in Cobb Island
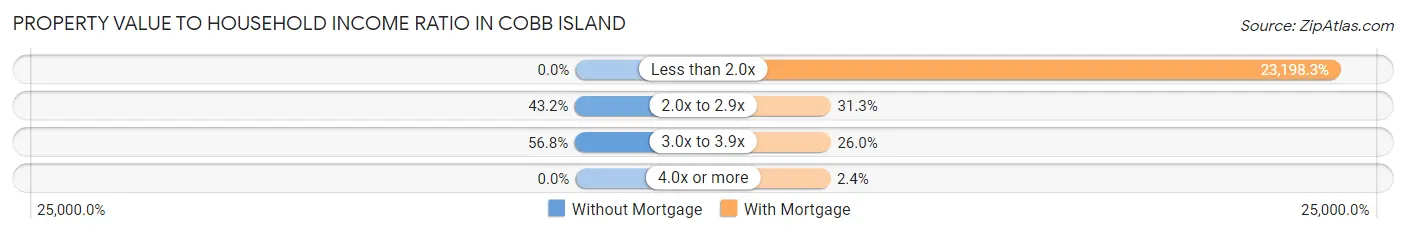
| Value-to-Income Ratio | Without Mortgage | With Mortgage |
| Less than 2.0x | 0 (0.0%) | 97,201 (23,198.3%) |
| 2.0x to 2.9x | 16 (43.2%) | 131 (31.3%) |
| 3.0x to 3.9x | 21 (56.8%) | 109 (26.0%) |
| 4.0x or more | 0 (0.0%) | 10 (2.4%) |
| Total | 37 (100.0%) | 419 (100.0%) |
Real Estate Taxes by Mortgage Status in Cobb Island
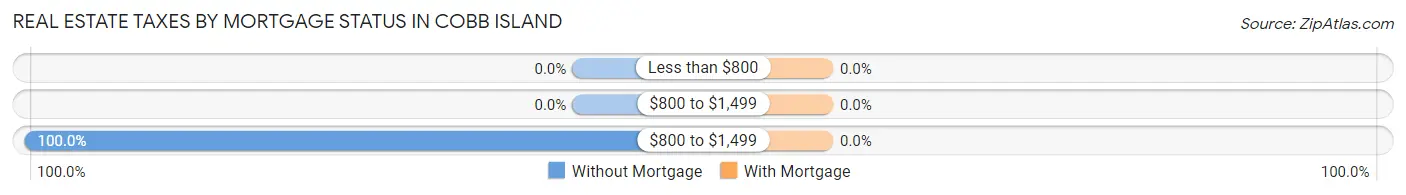
| Property Taxes | Without Mortgage | With Mortgage |
| Less than $800 | 0 (0.0%) | 0 (0.0%) |
| $800 to $1,499 | 0 (0.0%) | 0 (0.0%) |
| $800 to $1,499 | 37 (100.0%) | 0 (0.0%) |
| Total | 37 (100.0%) | 419 (100.0%) |
Health & Disability in Cobb Island
Health Insurance Coverage by Age in Cobb Island
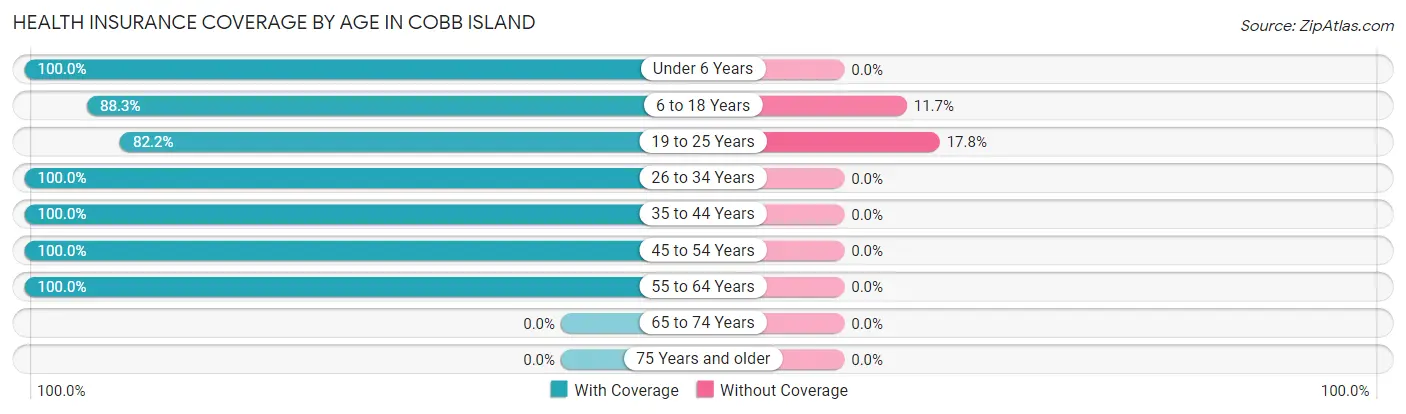
| Age Bracket | With Coverage | Without Coverage |
| Under 6 Years | 30 (100.0%) | 0 (0.0%) |
| 6 to 18 Years | 144 (88.3%) | 19 (11.7%) |
| 19 to 25 Years | 157 (82.2%) | 34 (17.8%) |
| 26 to 34 Years | 37 (100.0%) | 0 (0.0%) |
| 35 to 44 Years | 162 (100.0%) | 0 (0.0%) |
| 45 to 54 Years | 308 (100.0%) | 0 (0.0%) |
| 55 to 64 Years | 407 (100.0%) | 0 (0.0%) |
| 65 to 74 Years | 0 (0.0%) | 0 (0.0%) |
| 75 Years and older | 0 (0.0%) | 0 (0.0%) |
| Total | 1,245 (95.9%) | 53 (4.1%) |
Health Insurance Coverage by Citizenship Status in Cobb Island
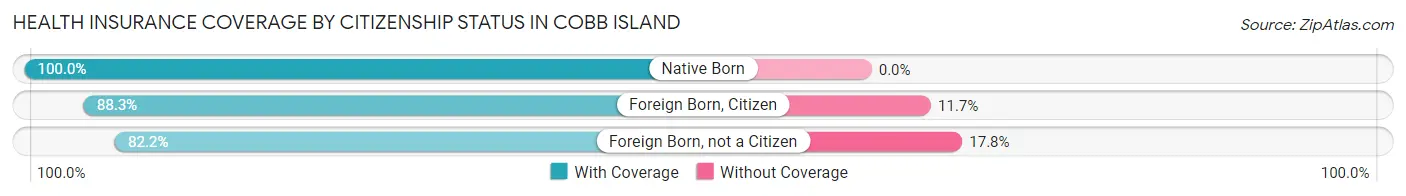
| Citizenship Status | With Coverage | Without Coverage |
| Native Born | 30 (100.0%) | 0 (0.0%) |
| Foreign Born, Citizen | 144 (88.3%) | 19 (11.7%) |
| Foreign Born, not a Citizen | 157 (82.2%) | 34 (17.8%) |
Health Insurance Coverage by Household Income in Cobb Island
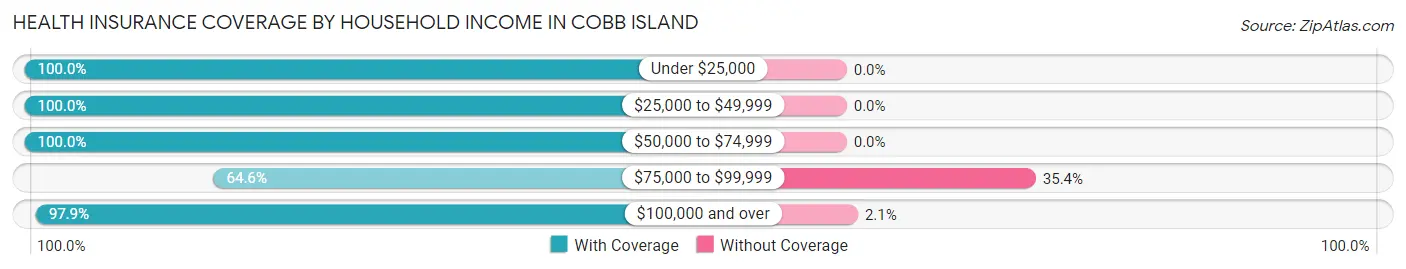
| Household Income | With Coverage | Without Coverage |
| Under $25,000 | 25 (100.0%) | 0 (0.0%) |
| $25,000 to $49,999 | 17 (100.0%) | 0 (0.0%) |
| $50,000 to $74,999 | 254 (100.0%) | 0 (0.0%) |
| $75,000 to $99,999 | 62 (64.6%) | 34 (35.4%) |
| $100,000 and over | 887 (97.9%) | 19 (2.1%) |
Public vs Private Health Insurance Coverage by Age in Cobb Island
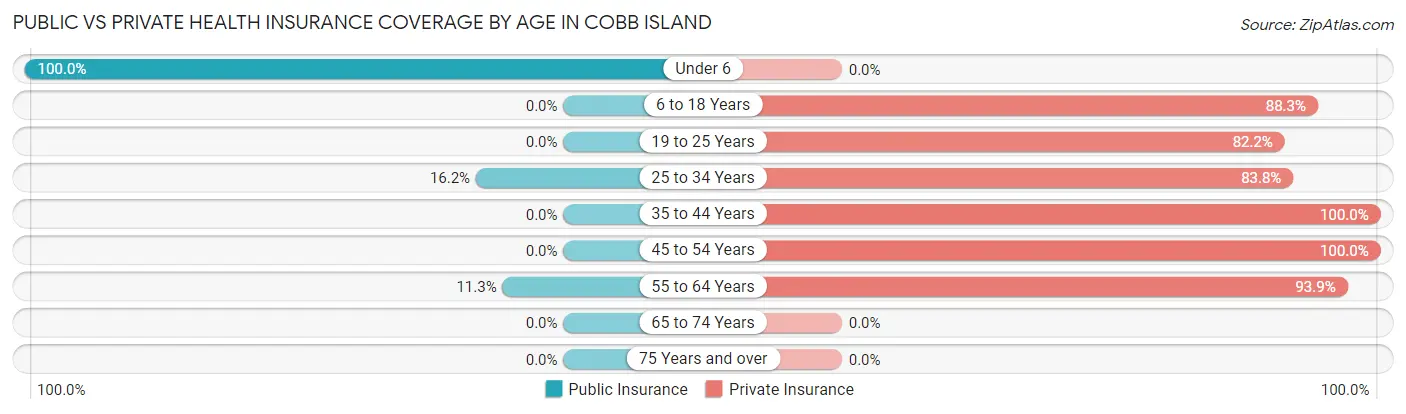
| Age Bracket | Public Insurance | Private Insurance |
| Under 6 | 30 (100.0%) | 0 (0.0%) |
| 6 to 18 Years | 0 (0.0%) | 144 (88.3%) |
| 19 to 25 Years | 0 (0.0%) | 157 (82.2%) |
| 25 to 34 Years | 6 (16.2%) | 31 (83.8%) |
| 35 to 44 Years | 0 (0.0%) | 162 (100.0%) |
| 45 to 54 Years | 0 (0.0%) | 308 (100.0%) |
| 55 to 64 Years | 46 (11.3%) | 382 (93.9%) |
| 65 to 74 Years | 0 (0.0%) | 0 (0.0%) |
| 75 Years and over | 0 (0.0%) | 0 (0.0%) |
| Total | 82 (6.3%) | 1,184 (91.2%) |
Disability Status by Sex by Age in Cobb Island
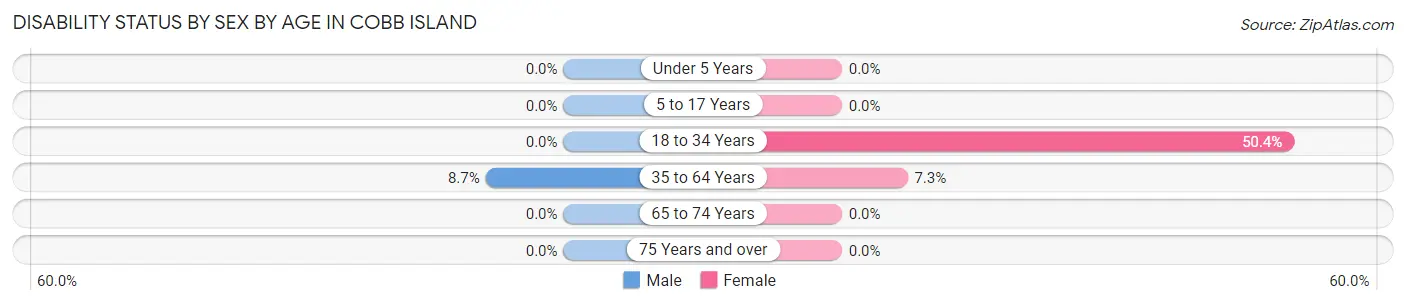
| Age Bracket | Male | Female |
| Under 5 Years | 0 (0.0%) | 0 (0.0%) |
| 5 to 17 Years | 0 (0.0%) | 0 (0.0%) |
| 18 to 34 Years | 0 (0.0%) | 66 (50.4%) |
| 35 to 64 Years | 38 (8.7%) | 32 (7.3%) |
| 65 to 74 Years | 0 (0.0%) | 0 (0.0%) |
| 75 Years and over | 0 (0.0%) | 0 (0.0%) |
Disability Class by Sex by Age in Cobb Island
Disability Class: Hearing Difficulty
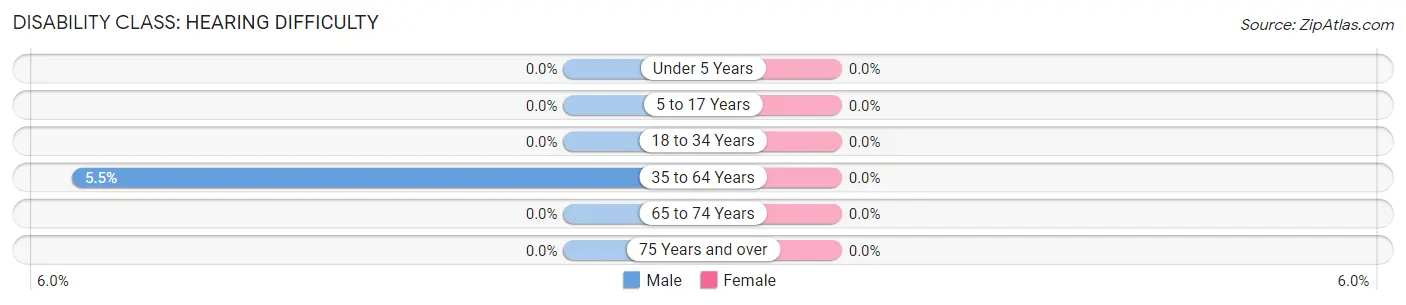
| Age Bracket | Male | Female |
| Under 5 Years | 0 (0.0%) | 0 (0.0%) |
| 5 to 17 Years | 0 (0.0%) | 0 (0.0%) |
| 18 to 34 Years | 0 (0.0%) | 0 (0.0%) |
| 35 to 64 Years | 24 (5.5%) | 0 (0.0%) |
| 65 to 74 Years | 0 (0.0%) | 0 (0.0%) |
| 75 Years and over | 0 (0.0%) | 0 (0.0%) |
Disability Class: Vision Difficulty
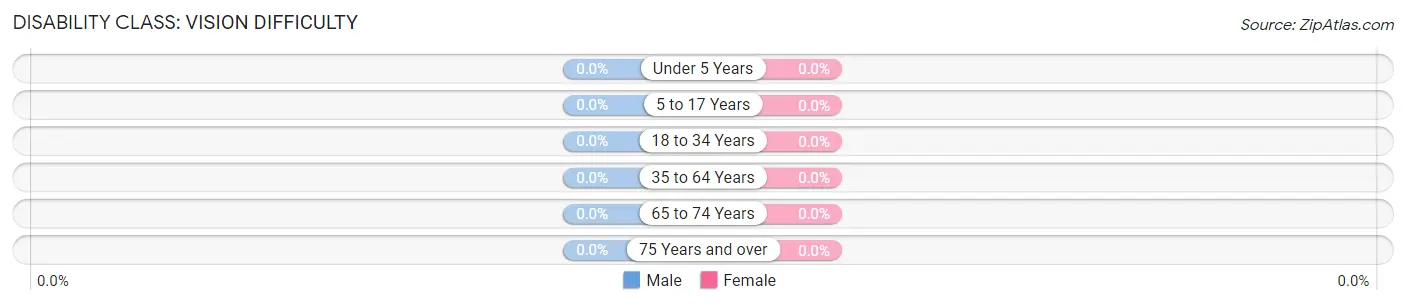
| Age Bracket | Male | Female |
| Under 5 Years | 0 (0.0%) | 0 (0.0%) |
| 5 to 17 Years | 0 (0.0%) | 0 (0.0%) |
| 18 to 34 Years | 0 (0.0%) | 0 (0.0%) |
| 35 to 64 Years | 0 (0.0%) | 0 (0.0%) |
| 65 to 74 Years | 0 (0.0%) | 0 (0.0%) |
| 75 Years and over | 0 (0.0%) | 0 (0.0%) |
Disability Class: Cognitive Difficulty
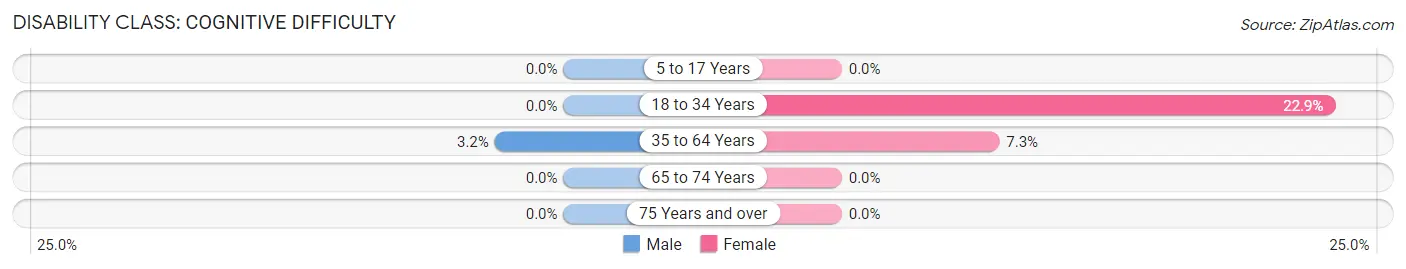
| Age Bracket | Male | Female |
| 5 to 17 Years | 0 (0.0%) | 0 (0.0%) |
| 18 to 34 Years | 0 (0.0%) | 30 (22.9%) |
| 35 to 64 Years | 14 (3.2%) | 32 (7.3%) |
| 65 to 74 Years | 0 (0.0%) | 0 (0.0%) |
| 75 Years and over | 0 (0.0%) | 0 (0.0%) |
Disability Class: Ambulatory Difficulty
| Age Bracket | Male | Female |
| 5 to 17 Years | 0 (0.0%) | 0 (0.0%) |
| 18 to 34 Years | 0 (0.0%) | 0 (0.0%) |
| 35 to 64 Years | 0 (0.0%) | 0 (0.0%) |
| 65 to 74 Years | 0 (0.0%) | 0 (0.0%) |
| 75 Years and over | 0 (0.0%) | 0 (0.0%) |
Disability Class: Self-Care Difficulty
| Age Bracket | Male | Female |
| 5 to 17 Years | 0 (0.0%) | 0 (0.0%) |
| 18 to 34 Years | 0 (0.0%) | 0 (0.0%) |
| 35 to 64 Years | 0 (0.0%) | 0 (0.0%) |
| 65 to 74 Years | 0 (0.0%) | 0 (0.0%) |
| 75 Years and over | 0 (0.0%) | 0 (0.0%) |
Technology Access in Cobb Island
Computing Device Access in Cobb Island
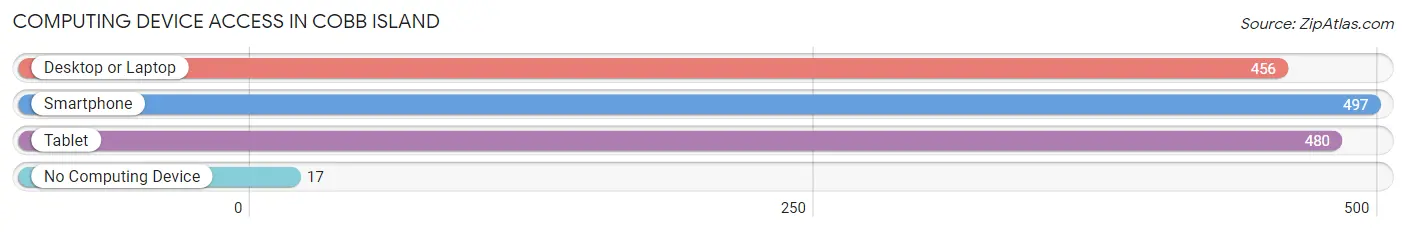
| Device Type | # Households | % Households |
| Desktop or Laptop | 456 | 88.7% |
| Smartphone | 497 | 96.7% |
| Tablet | 480 | 93.4% |
| No Computing Device | 17 | 3.3% |
| Total | 514 | 100.0% |
Internet Access in Cobb Island
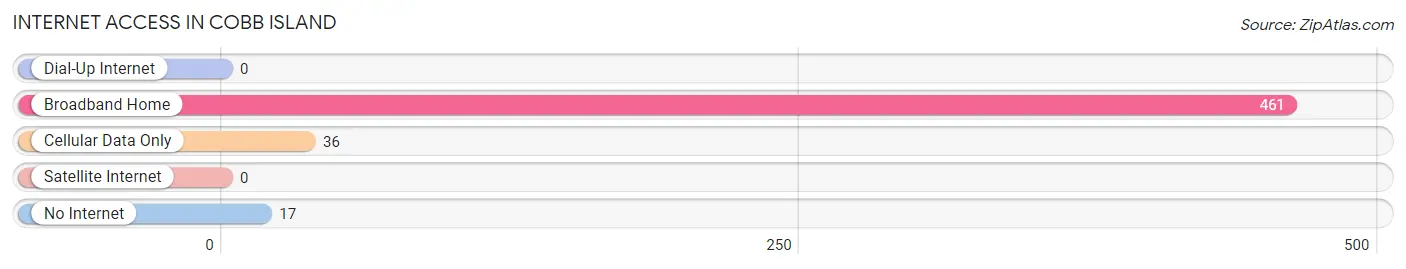
| Internet Type | # Households | % Households |
| Dial-Up Internet | 0 | 0.0% |
| Broadband Home | 461 | 89.7% |
| Cellular Data Only | 36 | 7.0% |
| Satellite Internet | 0 | 0.0% |
| No Internet | 17 | 3.3% |
| Total | 514 | 100.0% |
Cobb Island Summary
Cobb Island is a small unincorporated community located in Charles County, Maryland. It is situated on the Potomac River, approximately 40 miles south of Washington, D.C. The island is home to a population of approximately 500 people, and is a popular destination for fishing, boating, and other recreational activities.
History
Cobb Island has a long and varied history. The island was first inhabited by Native Americans, who used it as a fishing and hunting ground. In 1634, the island was granted to Thomas Gerard by the Maryland General Assembly. The island was then sold to the Cobb family in 1720, and the island has been known as Cobb Island ever since.
In the late 19th century, Cobb Island became a popular destination for oyster harvesting. The island was also home to a number of resorts, including the Cobb Island Hotel, which was built in 1891. The hotel was destroyed by a fire in the early 20th century, but the island remained a popular destination for fishing and boating.
In the 1950s, Cobb Island became a popular destination for weekenders from Washington, D.C. and the surrounding area. The island was home to a number of restaurants, bars, and other businesses catering to the weekenders.
Geography
Cobb Island is located in Charles County, Maryland, on the Potomac River. The island is approximately 1.5 miles long and 0.5 miles wide. The island is bordered by the Potomac River to the north, the Wicomico River to the east, and the Mattawoman Creek to the south.
The island is mostly flat, with an elevation of approximately 10 feet above sea level. The island is covered in marshland and wetlands, and is home to a variety of wildlife, including deer, foxes, and a variety of birds.
Economy
Cobb Island is primarily a residential community, and the majority of the island’s residents are employed in the service industry. The island is home to a number of restaurants, bars, and other businesses catering to the weekenders from Washington, D.C. and the surrounding area.
The island is also home to a number of marinas, which provide docking and storage services for boats. The island is also home to a number of charter fishing boats, which offer fishing trips to the Potomac River and the Chesapeake Bay.
Demographics
As of the 2010 census, the population of Cobb Island was 498. The racial makeup of the island was 94.4% White, 2.2% African American, 0.2% Native American, 0.4% Asian, 0.2% from other races, and 2.6% from two or more races. Hispanic or Latino of any race were 1.2% of the population.
The median household income in Cobb Island was $50,000, and the median family income was $54,375. The per capita income for the island was $21,945. About 8.3% of families and 10.2% of the population were below the poverty line, including 14.3% of those under age 18 and none of those age 65 or over.
Conclusion
Cobb Island is a small unincorporated community located in Charles County, Maryland. It is situated on the Potomac River, approximately 40 miles south of Washington, D.C. The island has a long and varied history, and is a popular destination for fishing, boating, and other recreational activities. The island is mostly flat, with an elevation of approximately 10 feet above sea level, and is home to a population of approximately 500 people. The majority of the island’s residents are employed in the service industry, and the island is home to a number of restaurants, bars, and other businesses catering to the weekenders from Washington, D.C. and the surrounding area.
Common Questions
What is Per Capita Income in Cobb Island?
Per Capita income in Cobb Island is $52,863.
What is the Median Family Income in Cobb Island?
Median Family Income in Cobb Island is $138,750.
What is the Median Household income in Cobb Island?
Median Household Income in Cobb Island is $127,442.
What is Income or Wage Gap in Cobb Island?
Income or Wage Gap in Cobb Island is 22.3%.
Women in Cobb Island earn 77.7 cents for every dollar earned by a man.
What is Inequality or Gini Index in Cobb Island?
Inequality or Gini Index in Cobb Island is 0.32.
What is the Total Population of Cobb Island?
Total Population of Cobb Island is 1,298.
What is the Total Male Population of Cobb Island?
Total Male Population of Cobb Island is 640.
What is the Total Female Population of Cobb Island?
Total Female Population of Cobb Island is 658.
What is the Ratio of Males per 100 Females in Cobb Island?
There are 97.26 Males per 100 Females in Cobb Island.
What is the Ratio of Females per 100 Males in Cobb Island?
There are 102.81 Females per 100 Males in Cobb Island.
What is the Median Population Age in Cobb Island?
Median Population Age in Cobb Island is 47.6 Years.
What is the Average Family Size in Cobb Island
Average Family Size in Cobb Island is 2.7 People.
What is the Average Household Size in Cobb Island
Average Household Size in Cobb Island is 2.5 People.
How Large is the Labor Force in Cobb Island?
There are 920 People in the Labor Forcein in Cobb Island.
What is the Percentage of People in the Labor Force in Cobb Island?
81.1% of People are in the Labor Force in Cobb Island.
What is the Unemployment Rate in Cobb Island?
Unemployment Rate in Cobb Island is 3.9%.