Hurlock, MD Map & Demographics
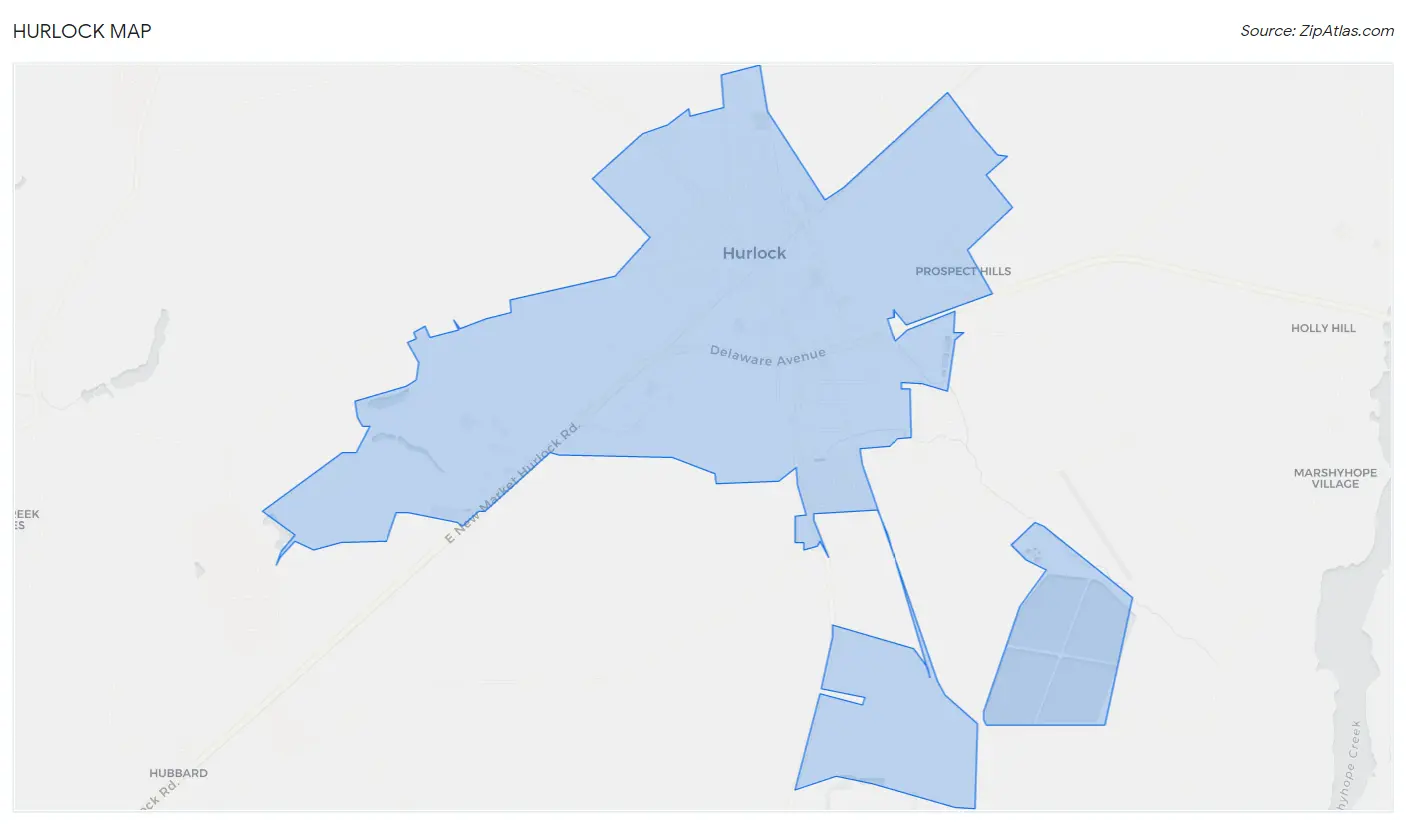
Hurlock Map
Hurlock Overview
$28,473
PER CAPITA INCOME
$78,750
AVG FAMILY INCOME
$57,313
AVG HOUSEHOLD INCOME
12.4%
WAGE / INCOME GAP [ % ]
87.6¢/ $1
WAGE / INCOME GAP [ $ ]
0.38
INEQUALITY / GINI INDEX
2,284
TOTAL POPULATION
982
MALE POPULATION
1,302
FEMALE POPULATION
75.42
MALES / 100 FEMALES
132.59
FEMALES / 100 MALES
39.2
MEDIAN AGE
3.2
AVG FAMILY SIZE
2.7
AVG HOUSEHOLD SIZE
1,084
LABOR FORCE [ PEOPLE ]
60.1%
PERCENT IN LABOR FORCE
6.5%
UNEMPLOYMENT RATE
Hurlock Zip Codes
Hurlock Area Codes
Income in Hurlock
Income Overview in Hurlock
Per Capita Income in Hurlock is $28,473, while median incomes of families and households are $78,750 and $57,313 respectively.
| Characteristic | Number | Measure |
| Per Capita Income | 2,284 | $28,473 |
| Median Family Income | 576 | $78,750 |
| Mean Family Income | 576 | $80,485 |
| Median Household Income | 843 | $57,313 |
| Mean Household Income | 843 | $71,116 |
| Income Deficit | 576 | $0 |
| Wage / Income Gap (%) | 2,284 | 12.37% |
| Wage / Income Gap ($) | 2,284 | 87.63¢ per $1 |
| Gini / Inequality Index | 2,284 | 0.38 |
Earnings by Sex in Hurlock
Average Earnings in Hurlock are $35,811, $37,031 for men and $32,450 for women, a difference of 12.4%.
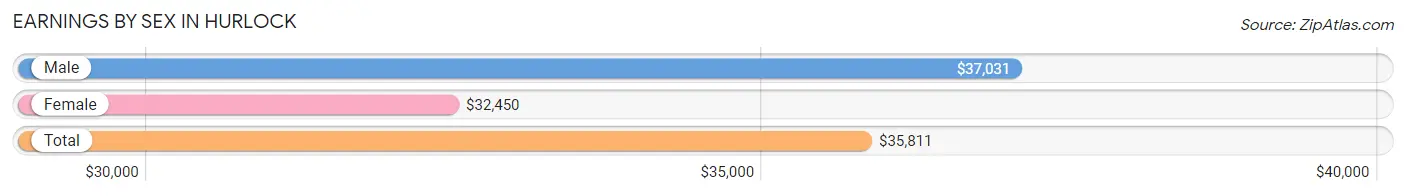
| Sex | Number | Average Earnings |
| Male | 569 (48.9%) | $37,031 |
| Female | 595 (51.1%) | $32,450 |
| Total | 1,164 (100.0%) | $35,811 |
Earnings by Sex by Income Bracket in Hurlock
The most common earnings brackets in Hurlock are $30,000 to $34,999 for men (72 | 12.7%) and $55,000 to $64,999 for women (104 | 17.5%).
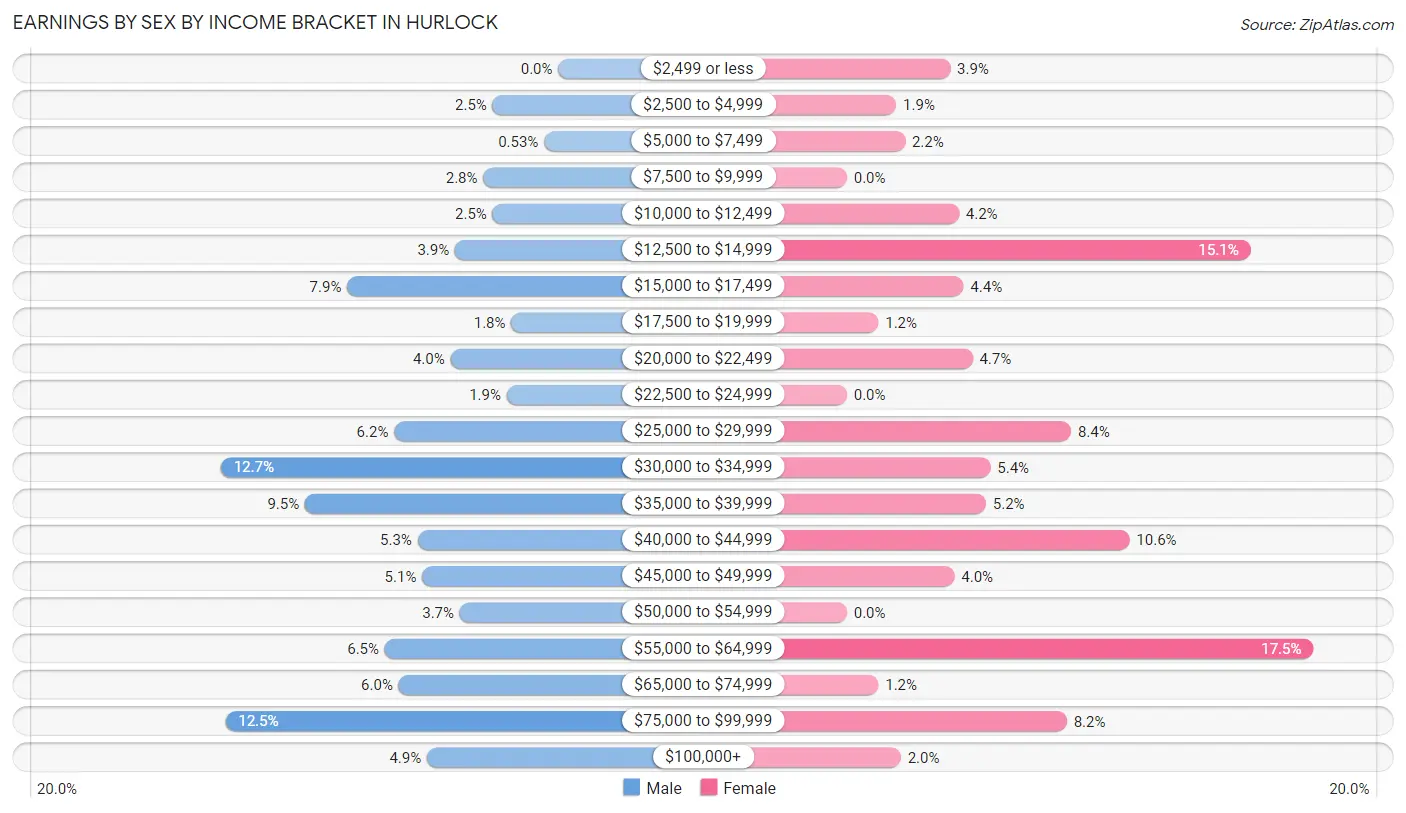
| Income | Male | Female |
| $2,499 or less | 0 (0.0%) | 23 (3.9%) |
| $2,500 to $4,999 | 14 (2.5%) | 11 (1.8%) |
| $5,000 to $7,499 | 3 (0.5%) | 13 (2.2%) |
| $7,500 to $9,999 | 16 (2.8%) | 0 (0.0%) |
| $10,000 to $12,499 | 14 (2.5%) | 25 (4.2%) |
| $12,500 to $14,999 | 22 (3.9%) | 90 (15.1%) |
| $15,000 to $17,499 | 45 (7.9%) | 26 (4.4%) |
| $17,500 to $19,999 | 10 (1.8%) | 7 (1.2%) |
| $20,000 to $22,499 | 23 (4.0%) | 28 (4.7%) |
| $22,500 to $24,999 | 11 (1.9%) | 0 (0.0%) |
| $25,000 to $29,999 | 35 (6.1%) | 50 (8.4%) |
| $30,000 to $34,999 | 72 (12.7%) | 32 (5.4%) |
| $35,000 to $39,999 | 54 (9.5%) | 31 (5.2%) |
| $40,000 to $44,999 | 30 (5.3%) | 63 (10.6%) |
| $45,000 to $49,999 | 29 (5.1%) | 24 (4.0%) |
| $50,000 to $54,999 | 21 (3.7%) | 0 (0.0%) |
| $55,000 to $64,999 | 37 (6.5%) | 104 (17.5%) |
| $65,000 to $74,999 | 34 (6.0%) | 7 (1.2%) |
| $75,000 to $99,999 | 71 (12.5%) | 49 (8.2%) |
| $100,000+ | 28 (4.9%) | 12 (2.0%) |
| Total | 569 (100.0%) | 595 (100.0%) |
Earnings by Sex by Educational Attainment in Hurlock
Average earnings in Hurlock are $39,000 for men and $41,776 for women, a difference of 6.6%. Men with an educational attainment of high school diploma enjoy the highest average annual earnings of $40,450, while those with college or associate's degree education earn the least with $33,654. Women with an educational attainment of graduate degree earn the most with the average annual earnings of $78,500, while those with less than high school education have the smallest earnings of $28,500.
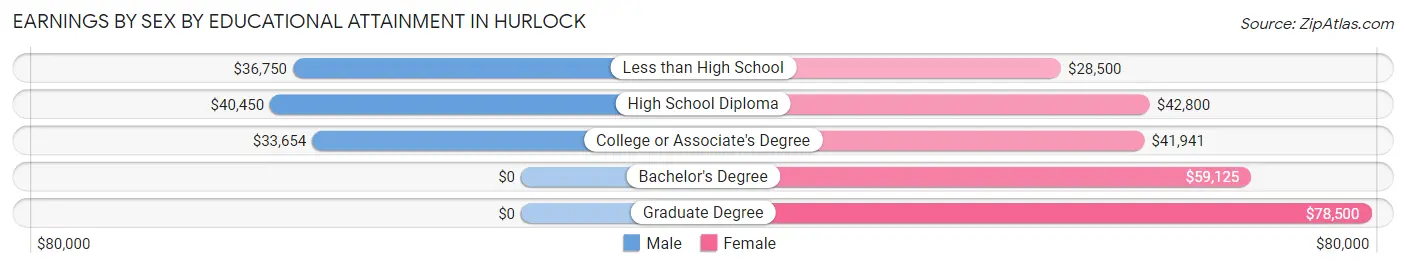
| Educational Attainment | Male Income | Female Income |
| Less than High School | $36,750 | $28,500 |
| High School Diploma | $40,450 | $42,800 |
| College or Associate's Degree | $33,654 | $41,941 |
| Bachelor's Degree | - | - |
| Graduate Degree | - | - |
| Total | $39,000 | $41,776 |
Family Income in Hurlock
Family Income Brackets in Hurlock
According to the Hurlock family income data, there are 119 families falling into the $100,000 to $149,999 income range, which is the most common income bracket and makes up 20.7% of all families.
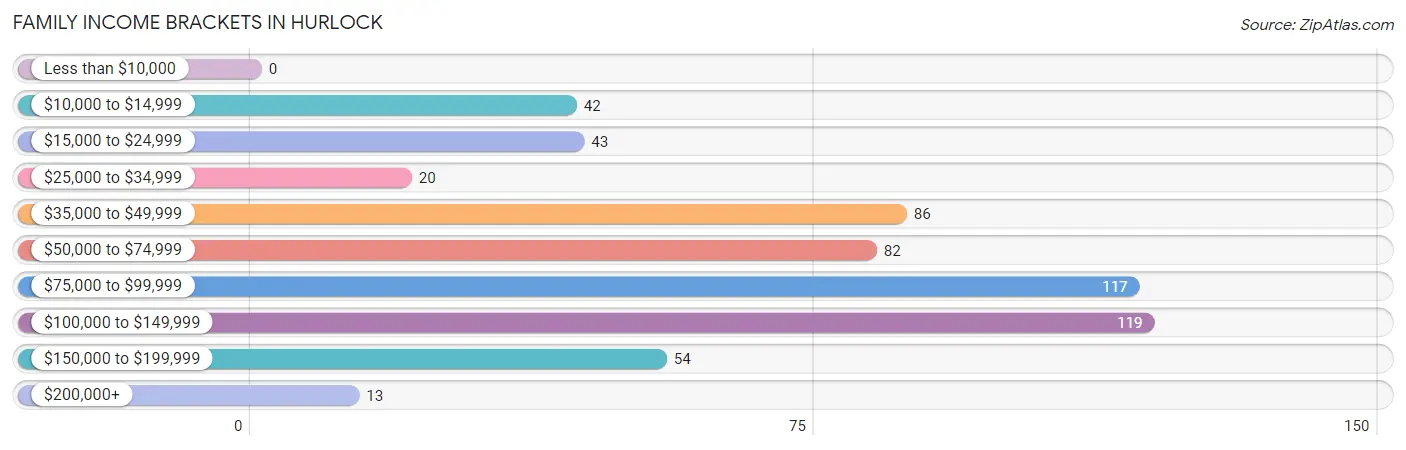
| Income Bracket | # Families | % Families |
| Less than $10,000 | 0 | 0.0% |
| $10,000 to $14,999 | 42 | 7.3% |
| $15,000 to $24,999 | 43 | 7.5% |
| $25,000 to $34,999 | 20 | 3.5% |
| $35,000 to $49,999 | 86 | 14.9% |
| $50,000 to $74,999 | 82 | 14.2% |
| $75,000 to $99,999 | 117 | 20.3% |
| $100,000 to $149,999 | 119 | 20.7% |
| $150,000 to $199,999 | 54 | 9.4% |
| $200,000+ | 13 | 2.3% |
Family Income by Famaliy Size in Hurlock
5-person families (52 | 9.0%) account for the highest median family income in Hurlock with $102,632 per family, while 2-person families (355 | 61.6%) have the highest median income of $35,312 per family member.
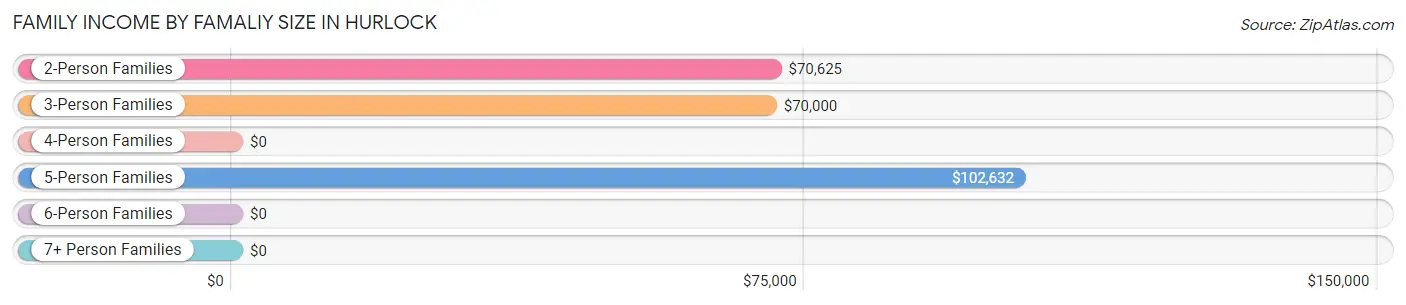
| Income Bracket | # Families | Median Income |
| 2-Person Families | 355 (61.6%) | $70,625 |
| 3-Person Families | 58 (10.1%) | $70,000 |
| 4-Person Families | 95 (16.5%) | $0 |
| 5-Person Families | 52 (9.0%) | $102,632 |
| 6-Person Families | 16 (2.8%) | $0 |
| 7+ Person Families | 0 (0.0%) | $0 |
| Total | 576 (100.0%) | $78,750 |
Family Income by Number of Earners in Hurlock
The median family income in Hurlock is $78,750, with families comprising 3+ earners (65) having the highest median family income of $156,050, while families with no earners (91) have the lowest median family income of $38,616, accounting for 11.3% and 15.8% of families, respectively.
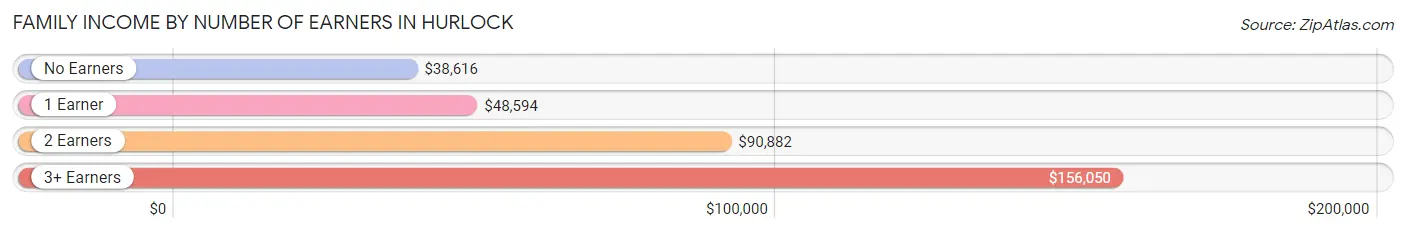
| Number of Earners | # Families | Median Income |
| No Earners | 91 (15.8%) | $38,616 |
| 1 Earner | 198 (34.4%) | $48,594 |
| 2 Earners | 222 (38.5%) | $90,882 |
| 3+ Earners | 65 (11.3%) | $156,050 |
| Total | 576 (100.0%) | $78,750 |
Household Income in Hurlock
Household Income Brackets in Hurlock
With 149 households falling in the category, the $100,000 to $149,999 income range is the most frequent in Hurlock, accounting for 17.7% of all households. In contrast, only 13 households (1.5%) fall into the $200,000+ income bracket, making it the least populous group.
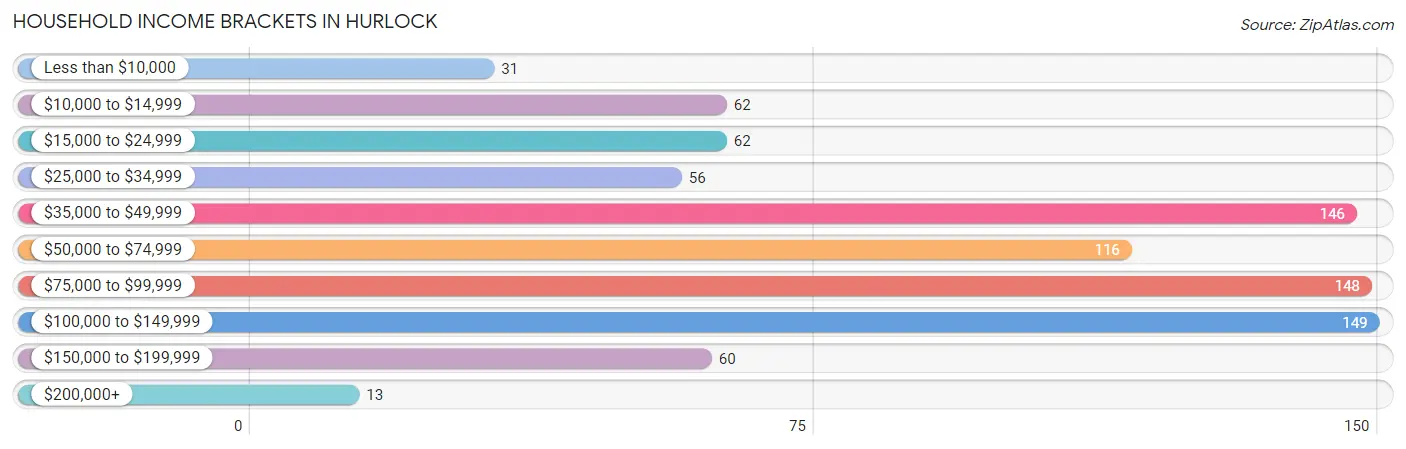
| Income Bracket | # Households | % Households |
| Less than $10,000 | 31 | 3.7% |
| $10,000 to $14,999 | 62 | 7.4% |
| $15,000 to $24,999 | 62 | 7.4% |
| $25,000 to $34,999 | 56 | 6.6% |
| $35,000 to $49,999 | 146 | 17.3% |
| $50,000 to $74,999 | 116 | 13.8% |
| $75,000 to $99,999 | 148 | 17.6% |
| $100,000 to $149,999 | 149 | 17.7% |
| $150,000 to $199,999 | 60 | 7.1% |
| $200,000+ | 13 | 1.5% |
Household Income by Householder Age in Hurlock
The median household income in Hurlock is $57,313, with the highest median household income of $77,000 found in the 25 to 44 years age bracket for the primary householder. A total of 216 households (25.6%) fall into this category. Meanwhile, the 15 to 24 years age bracket for the primary householder has the lowest median household income of $45,893, with 21 households (2.5%) in this group.
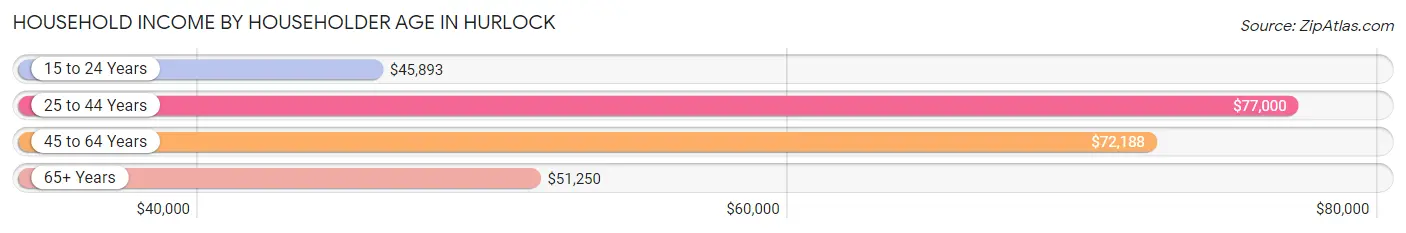
| Income Bracket | # Households | Median Income |
| 15 to 24 Years | 21 (2.5%) | $45,893 |
| 25 to 44 Years | 216 (25.6%) | $77,000 |
| 45 to 64 Years | 309 (36.6%) | $72,188 |
| 65+ Years | 297 (35.2%) | $51,250 |
| Total | 843 (100.0%) | $57,313 |
Poverty in Hurlock
Income Below Poverty by Sex and Age in Hurlock
With 12.6% poverty level for males and 19.3% for females among the residents of Hurlock, 16 and 17 year old males and 5 year old females are the most vulnerable to poverty, with 15 males (55.6%) and 5 females (100.0%) in their respective age groups living below the poverty level.
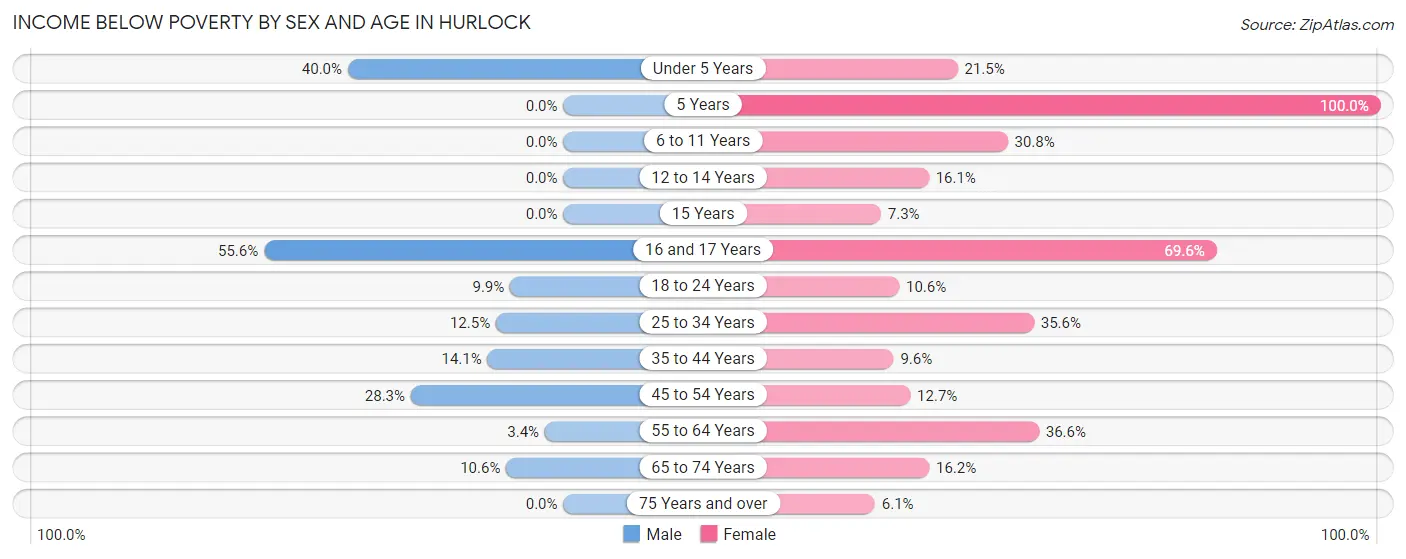
| Age Bracket | Male | Female |
| Under 5 Years | 16 (40.0%) | 26 (21.5%) |
| 5 Years | 0 (0.0%) | 5 (100.0%) |
| 6 to 11 Years | 0 (0.0%) | 24 (30.8%) |
| 12 to 14 Years | 0 (0.0%) | 5 (16.1%) |
| 15 Years | 0 (0.0%) | 5 (7.2%) |
| 16 and 17 Years | 15 (55.6%) | 16 (69.6%) |
| 18 to 24 Years | 8 (9.9%) | 17 (10.6%) |
| 25 to 34 Years | 16 (12.5%) | 36 (35.6%) |
| 35 to 44 Years | 19 (14.1%) | 14 (9.6%) |
| 45 to 54 Years | 30 (28.3%) | 17 (12.7%) |
| 55 to 64 Years | 4 (3.4%) | 49 (36.6%) |
| 65 to 74 Years | 16 (10.6%) | 29 (16.2%) |
| 75 Years and over | 0 (0.0%) | 7 (6.1%) |
| Total | 124 (12.6%) | 250 (19.3%) |
Income Above Poverty by Sex and Age in Hurlock
According to the poverty statistics in Hurlock, males aged 5 years and females aged 75 years and over are the age groups that are most secure financially, with 100.0% of males and 93.9% of females in these age groups living above the poverty line.
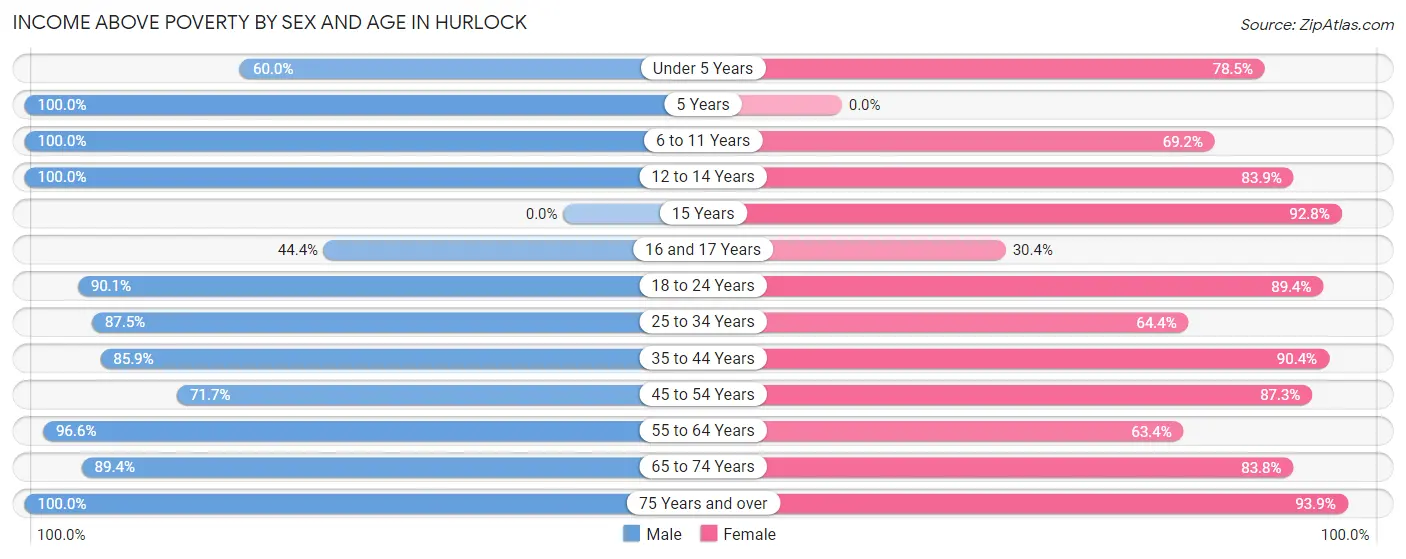
| Age Bracket | Male | Female |
| Under 5 Years | 24 (60.0%) | 95 (78.5%) |
| 5 Years | 4 (100.0%) | 0 (0.0%) |
| 6 to 11 Years | 33 (100.0%) | 54 (69.2%) |
| 12 to 14 Years | 93 (100.0%) | 26 (83.9%) |
| 15 Years | 0 (0.0%) | 64 (92.7%) |
| 16 and 17 Years | 12 (44.4%) | 7 (30.4%) |
| 18 to 24 Years | 73 (90.1%) | 143 (89.4%) |
| 25 to 34 Years | 112 (87.5%) | 65 (64.4%) |
| 35 to 44 Years | 116 (85.9%) | 132 (90.4%) |
| 45 to 54 Years | 76 (71.7%) | 117 (87.3%) |
| 55 to 64 Years | 113 (96.6%) | 85 (63.4%) |
| 65 to 74 Years | 135 (89.4%) | 150 (83.8%) |
| 75 Years and over | 67 (100.0%) | 107 (93.9%) |
| Total | 858 (87.4%) | 1,045 (80.7%) |
Income Below Poverty Among Married-Couple Families in Hurlock
The poverty statistics for married-couple families in Hurlock show that 7.4% or 26 of the total 352 families live below the poverty line. Families with no children have the highest poverty rate of 8.0%, comprising of 22 families. On the other hand, families with 3 or 4 children have the lowest poverty rate of 0.0%, which includes 0 families.
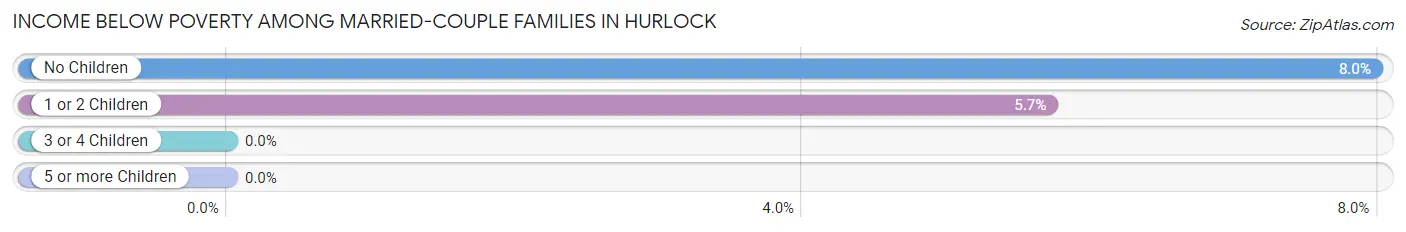
| Children | Above Poverty | Below Poverty |
| No Children | 254 (92.0%) | 22 (8.0%) |
| 1 or 2 Children | 66 (94.3%) | 4 (5.7%) |
| 3 or 4 Children | 6 (100.0%) | 0 (0.0%) |
| 5 or more Children | 0 (0.0%) | 0 (0.0%) |
| Total | 326 (92.6%) | 26 (7.4%) |
Income Below Poverty Among Single-Parent Households in Hurlock
According to the poverty data in Hurlock, 35.6% or 16 single-father households and 21.8% or 39 single-mother households are living below the poverty line. Among single-father households, those with 3 or 4 children have the highest poverty rate, with 16 households (100.0%) experiencing poverty. Likewise, among single-mother households, those with 1 or 2 children have the highest poverty rate, with 33 households (30.8%) falling below the poverty line.
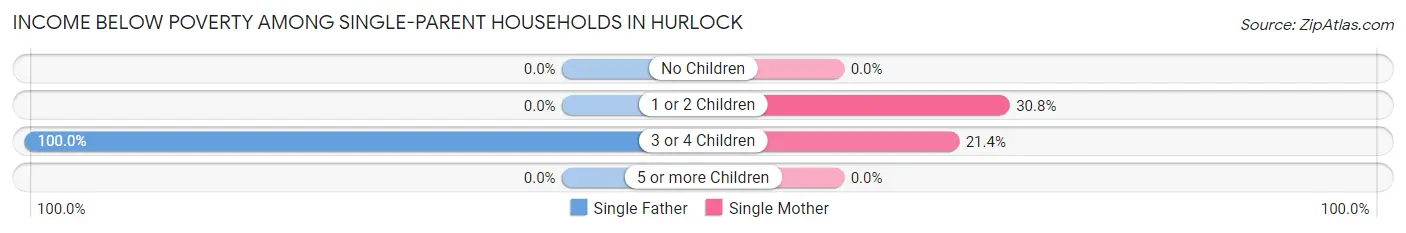
| Children | Single Father | Single Mother |
| No Children | 0 (0.0%) | 0 (0.0%) |
| 1 or 2 Children | 0 (0.0%) | 33 (30.8%) |
| 3 or 4 Children | 16 (100.0%) | 6 (21.4%) |
| 5 or more Children | 0 (0.0%) | 0 (0.0%) |
| Total | 16 (35.6%) | 39 (21.8%) |
Income Below Poverty Among Married-Couple vs Single-Parent Households in Hurlock
The poverty data for Hurlock shows that 26 of the married-couple family households (7.4%) and 55 of the single-parent households (24.5%) are living below the poverty level. Within the married-couple family households, those with no children have the highest poverty rate, with 22 households (8.0%) falling below the poverty line. Among the single-parent households, those with 3 or 4 children have the highest poverty rate, with 22 household (50.0%) living below poverty.
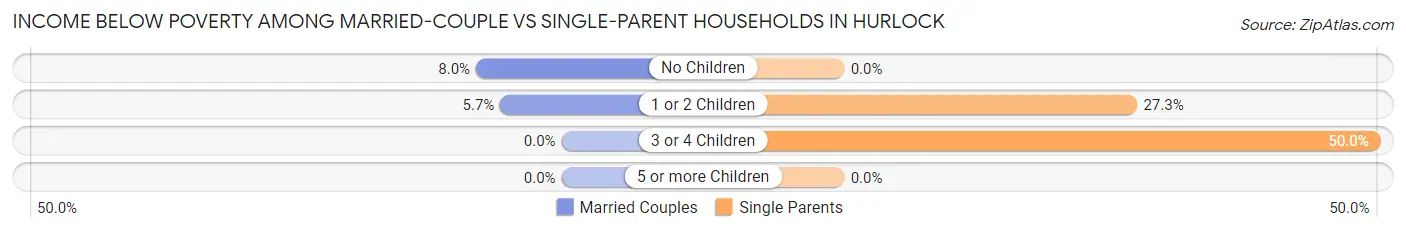
| Children | Married-Couple Families | Single-Parent Households |
| No Children | 22 (8.0%) | 0 (0.0%) |
| 1 or 2 Children | 4 (5.7%) | 33 (27.3%) |
| 3 or 4 Children | 0 (0.0%) | 22 (50.0%) |
| 5 or more Children | 0 (0.0%) | 0 (0.0%) |
| Total | 26 (7.4%) | 55 (24.5%) |
Race in Hurlock
The most populous races in Hurlock are White / Caucasian (1,199 | 52.5%), Black / African American (705 | 30.9%), and Hispanic or Latino (248 | 10.9%).
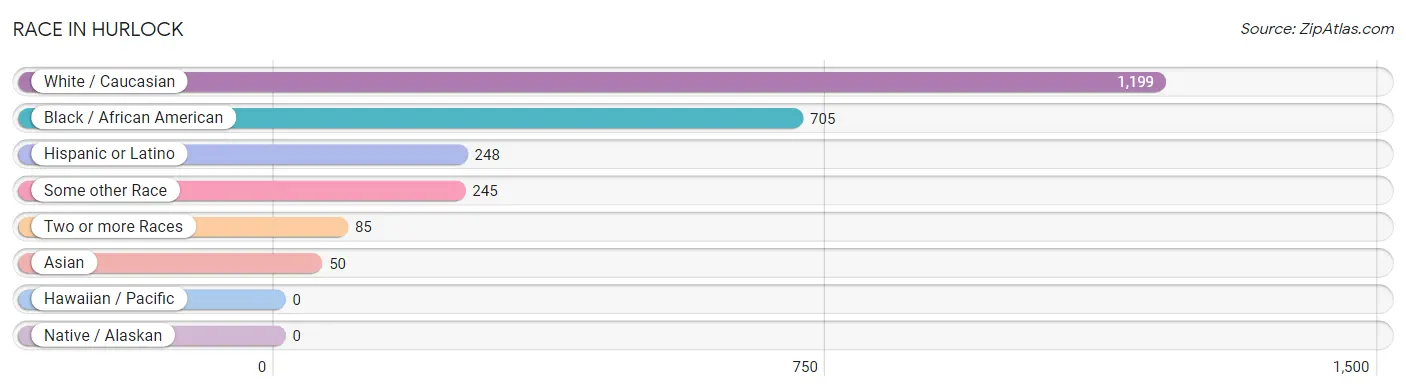
| Race | # Population | % Population |
| Asian | 50 | 2.2% |
| Black / African American | 705 | 30.9% |
| Hawaiian / Pacific | 0 | 0.0% |
| Hispanic or Latino | 248 | 10.9% |
| Native / Alaskan | 0 | 0.0% |
| White / Caucasian | 1,199 | 52.5% |
| Two or more Races | 85 | 3.7% |
| Some other Race | 245 | 10.7% |
| Total | 2,284 | 100.0% |
Ancestry in Hurlock
The most populous ancestries reported in Hurlock are American (435 | 19.1%), German (260 | 11.4%), Central American (199 | 8.7%), Salvadoran (199 | 8.7%), and English (182 | 8.0%), together accounting for 55.8% of all Hurlock residents.
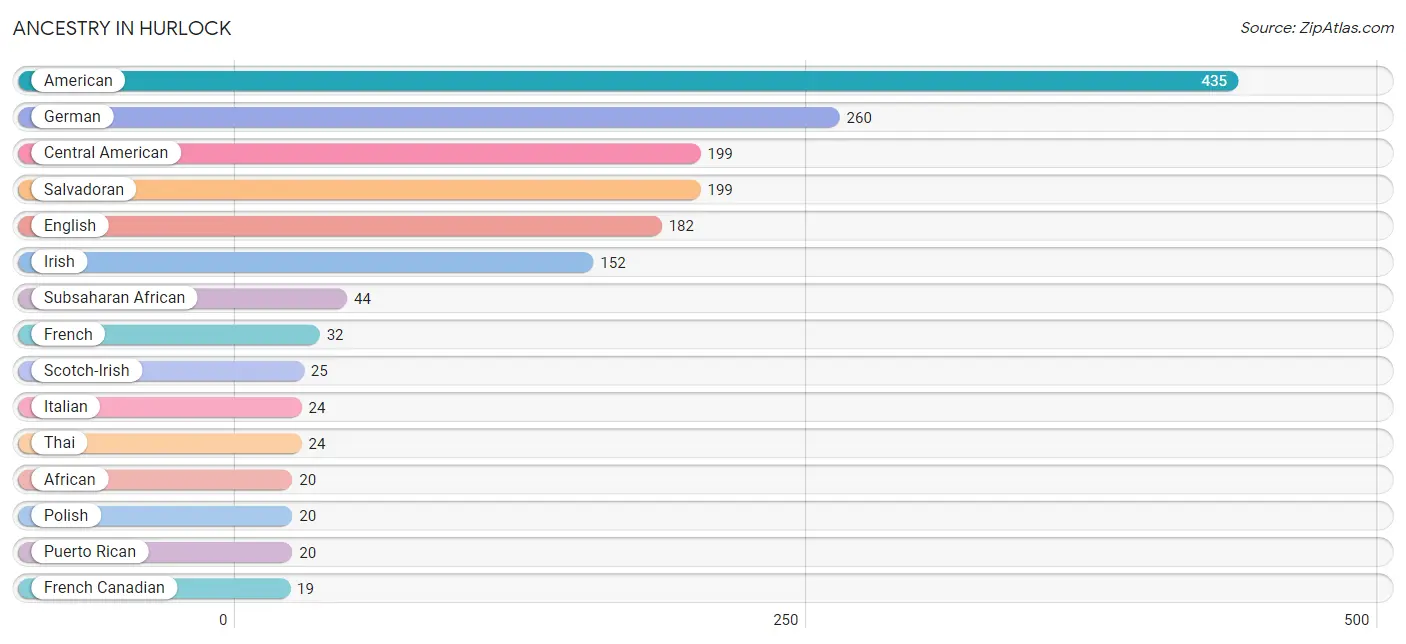
| Ancestry | # Population | % Population |
| African | 20 | 0.9% |
| American | 435 | 19.1% |
| Austrian | 3 | 0.1% |
| Canadian | 17 | 0.7% |
| Central American | 199 | 8.7% |
| Colombian | 10 | 0.4% |
| Cuban | 3 | 0.1% |
| Dutch | 11 | 0.5% |
| English | 182 | 8.0% |
| European | 3 | 0.1% |
| French | 32 | 1.4% |
| French Canadian | 19 | 0.8% |
| German | 260 | 11.4% |
| Ghanaian | 10 | 0.4% |
| Haitian | 12 | 0.5% |
| Irish | 152 | 6.7% |
| Italian | 24 | 1.1% |
| Jamaican | 15 | 0.7% |
| Lithuanian | 4 | 0.2% |
| Mexican | 16 | 0.7% |
| Nigerian | 14 | 0.6% |
| Polish | 20 | 0.9% |
| Puerto Rican | 20 | 0.9% |
| Romanian | 2 | 0.1% |
| Russian | 6 | 0.3% |
| Salvadoran | 199 | 8.7% |
| Scotch-Irish | 25 | 1.1% |
| Scottish | 12 | 0.5% |
| Sioux | 3 | 0.1% |
| South American | 10 | 0.4% |
| Sri Lankan | 9 | 0.4% |
| Subsaharan African | 44 | 1.9% |
| Thai | 24 | 1.1% | View All 33 Rows |
Immigrants in Hurlock
The most numerous immigrant groups reported in Hurlock came from Latin America (123 | 5.4%), Central America (84 | 3.7%), El Salvador (79 | 3.5%), Caribbean (29 | 1.3%), and Asia (21 | 0.9%), together accounting for 14.7% of all Hurlock residents.
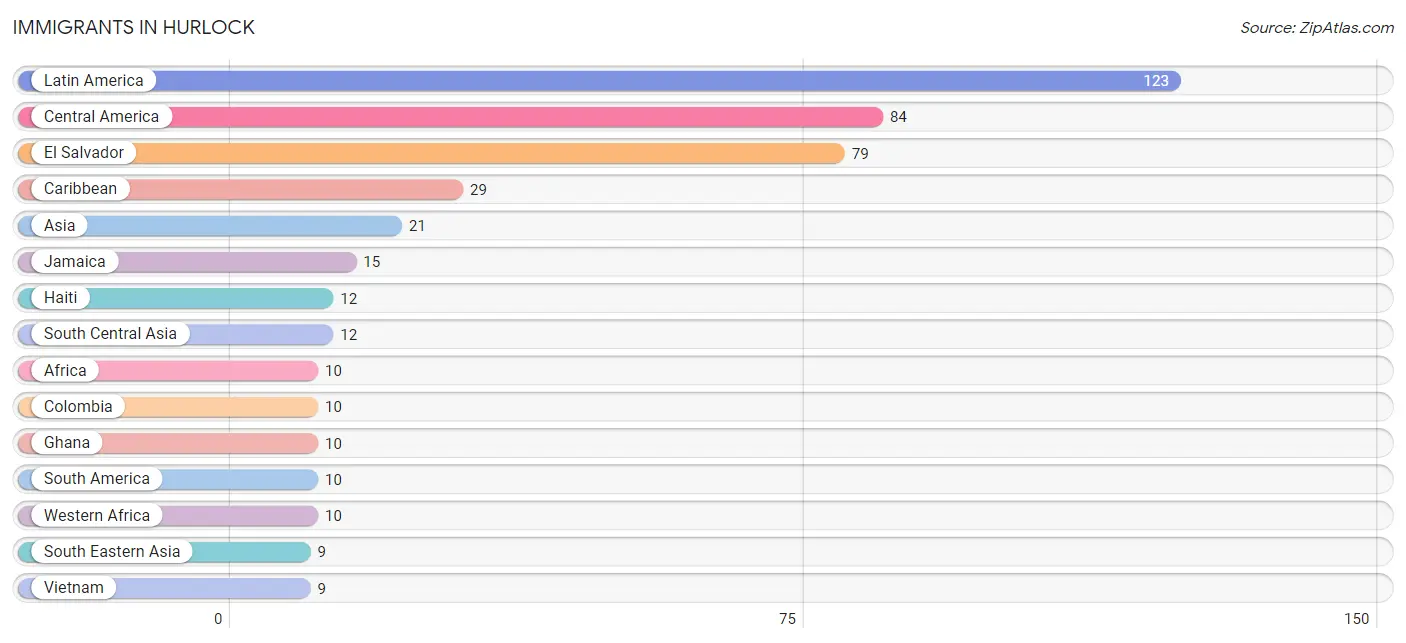
| Immigration Origin | # Population | % Population |
| Africa | 10 | 0.4% |
| Asia | 21 | 0.9% |
| Bangladesh | 4 | 0.2% |
| Caribbean | 29 | 1.3% |
| Central America | 84 | 3.7% |
| Colombia | 10 | 0.4% |
| Dominican Republic | 2 | 0.1% |
| El Salvador | 79 | 3.5% |
| Ghana | 10 | 0.4% |
| Haiti | 12 | 0.5% |
| Jamaica | 15 | 0.7% |
| Latin America | 123 | 5.4% |
| Mexico | 2 | 0.1% |
| Pakistan | 8 | 0.4% |
| Panama | 3 | 0.1% |
| South America | 10 | 0.4% |
| South Central Asia | 12 | 0.5% |
| South Eastern Asia | 9 | 0.4% |
| Vietnam | 9 | 0.4% |
| Western Africa | 10 | 0.4% | View All 20 Rows |
Sex and Age in Hurlock
Sex and Age in Hurlock
The most populous age groups in Hurlock are 10 to 14 Years (116 | 11.8%) for men and 15 to 19 Years (145 | 11.1%) for women.
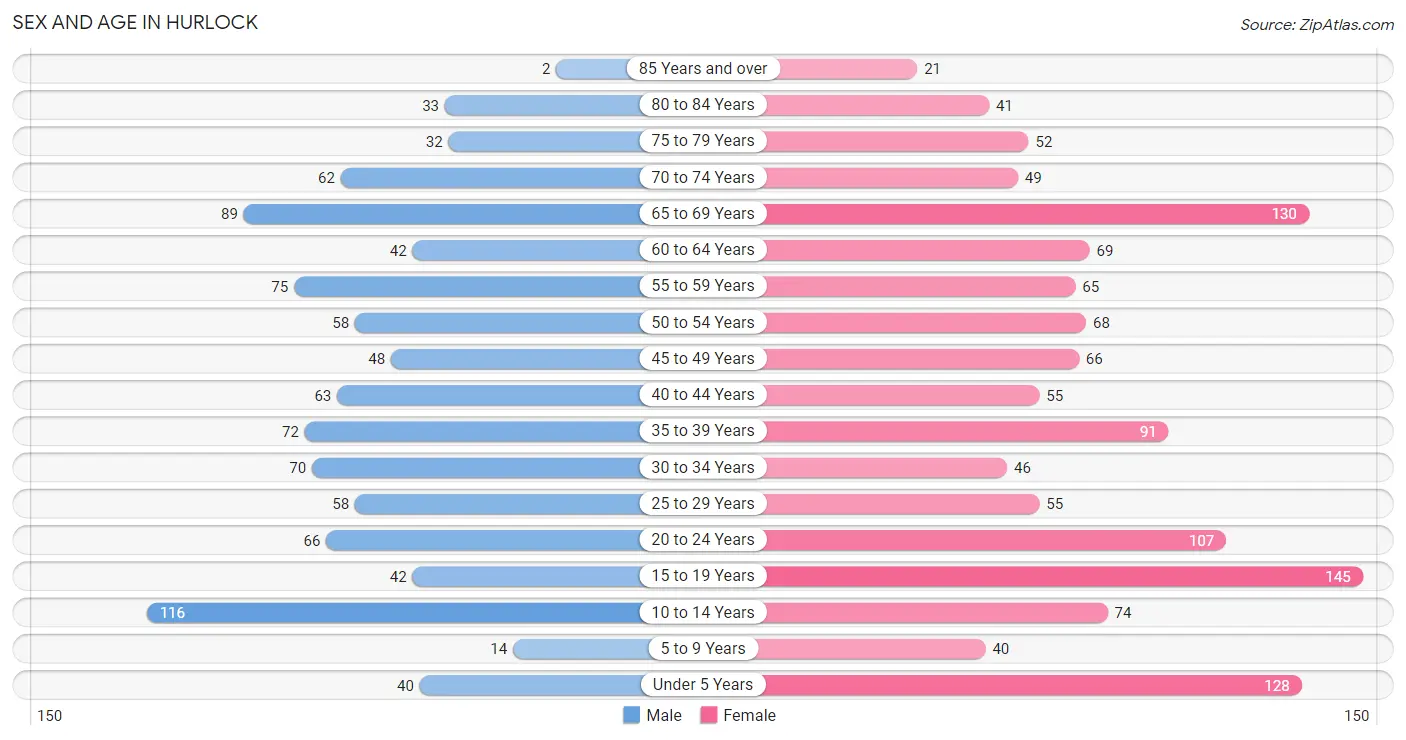
| Age Bracket | Male | Female |
| Under 5 Years | 40 (4.1%) | 128 (9.8%) |
| 5 to 9 Years | 14 (1.4%) | 40 (3.1%) |
| 10 to 14 Years | 116 (11.8%) | 74 (5.7%) |
| 15 to 19 Years | 42 (4.3%) | 145 (11.1%) |
| 20 to 24 Years | 66 (6.7%) | 107 (8.2%) |
| 25 to 29 Years | 58 (5.9%) | 55 (4.2%) |
| 30 to 34 Years | 70 (7.1%) | 46 (3.5%) |
| 35 to 39 Years | 72 (7.3%) | 91 (7.0%) |
| 40 to 44 Years | 63 (6.4%) | 55 (4.2%) |
| 45 to 49 Years | 48 (4.9%) | 66 (5.1%) |
| 50 to 54 Years | 58 (5.9%) | 68 (5.2%) |
| 55 to 59 Years | 75 (7.6%) | 65 (5.0%) |
| 60 to 64 Years | 42 (4.3%) | 69 (5.3%) |
| 65 to 69 Years | 89 (9.1%) | 130 (10.0%) |
| 70 to 74 Years | 62 (6.3%) | 49 (3.8%) |
| 75 to 79 Years | 32 (3.3%) | 52 (4.0%) |
| 80 to 84 Years | 33 (3.4%) | 41 (3.2%) |
| 85 Years and over | 2 (0.2%) | 21 (1.6%) |
| Total | 982 (100.0%) | 1,302 (100.0%) |
Families and Households in Hurlock
Median Family Size in Hurlock
The median family size in Hurlock is 3.23 persons per family, with single female/mother families (179 | 31.1%) accounting for the largest median family size of 4.02 persons per family. On the other hand, single male/father families (45 | 7.8%) represent the smallest median family size with 2.58 persons per family.
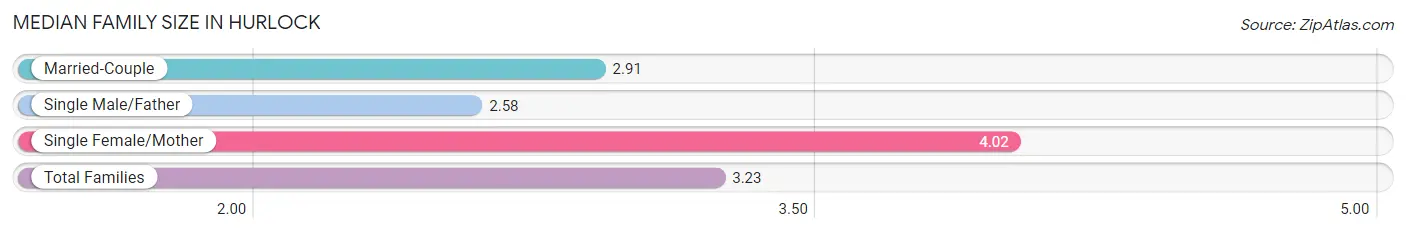
| Family Type | # Families | Family Size |
| Married-Couple | 352 (61.1%) | 2.91 |
| Single Male/Father | 45 (7.8%) | 2.58 |
| Single Female/Mother | 179 (31.1%) | 4.02 |
| Total Families | 576 (100.0%) | 3.23 |
Median Household Size in Hurlock
The median household size in Hurlock is 2.67 persons per household, with single female/mother households (179 | 21.2%) accounting for the largest median household size of 4.49 persons per household. non-family households (267 | 31.7%) represent the smallest median household size with 1.08 persons per household.
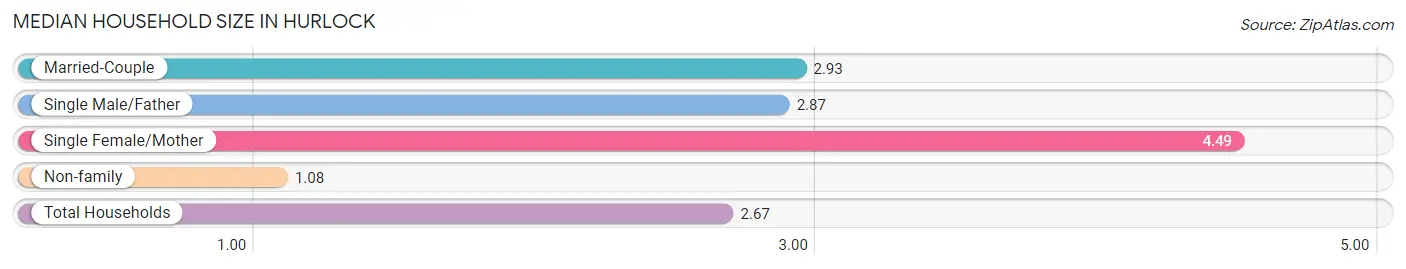
| Household Type | # Households | Household Size |
| Married-Couple | 352 (41.8%) | 2.93 |
| Single Male/Father | 45 (5.3%) | 2.87 |
| Single Female/Mother | 179 (21.2%) | 4.49 |
| Non-family | 267 (31.7%) | 1.08 |
| Total Households | 843 (100.0%) | 2.67 |
Household Size by Marriage Status in Hurlock
Out of a total of 843 households in Hurlock, 576 (68.3%) are family households, while 267 (31.7%) are nonfamily households. The most numerous type of family households are 2-person households, comprising 317, and the most common type of nonfamily households are 1-person households, comprising 231.
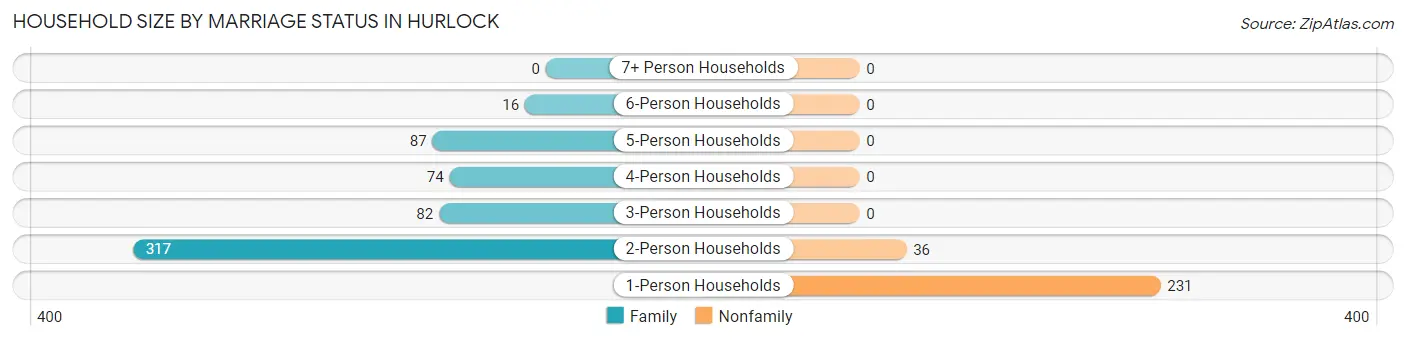
| Household Size | Family Households | Nonfamily Households |
| 1-Person Households | - | 231 (27.4%) |
| 2-Person Households | 317 (37.6%) | 36 (4.3%) |
| 3-Person Households | 82 (9.7%) | 0 (0.0%) |
| 4-Person Households | 74 (8.8%) | 0 (0.0%) |
| 5-Person Households | 87 (10.3%) | 0 (0.0%) |
| 6-Person Households | 16 (1.9%) | 0 (0.0%) |
| 7+ Person Households | 0 (0.0%) | 0 (0.0%) |
| Total | 576 (68.3%) | 267 (31.7%) |
Female Fertility in Hurlock
Fertility by Age in Hurlock
Average fertility rate in Hurlock is 45.0 births per 1,000 women. Women in the age bracket of 20 to 34 years have the highest fertility rate with 125.0 births per 1,000 women. Women in the age bracket of 20 to 34 years acount for 100.0% of all women with births.
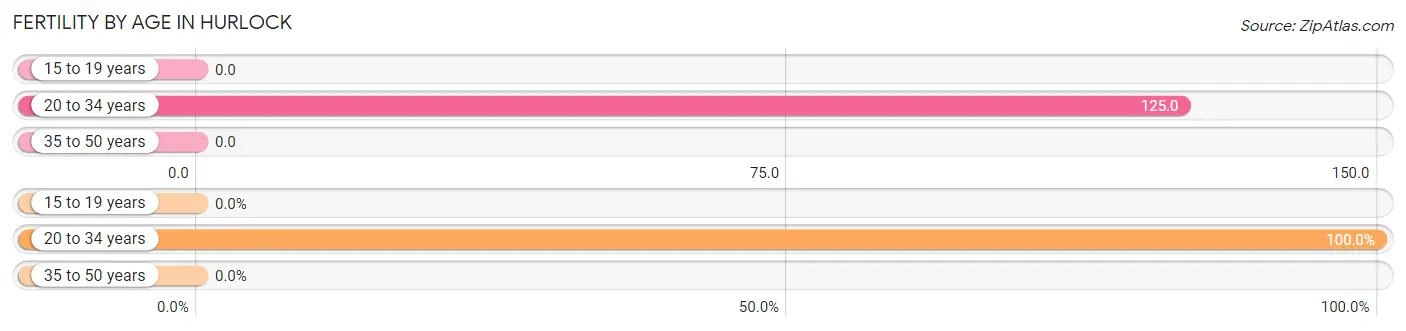
| Age Bracket | Women with Births | Births / 1,000 Women |
| 15 to 19 years | 0 (0.0%) | 0.0 |
| 20 to 34 years | 26 (100.0%) | 125.0 |
| 35 to 50 years | 0 (0.0%) | 0.0 |
| Total | 26 (100.0%) | 45.0 |
Fertility by Age by Marriage Status in Hurlock
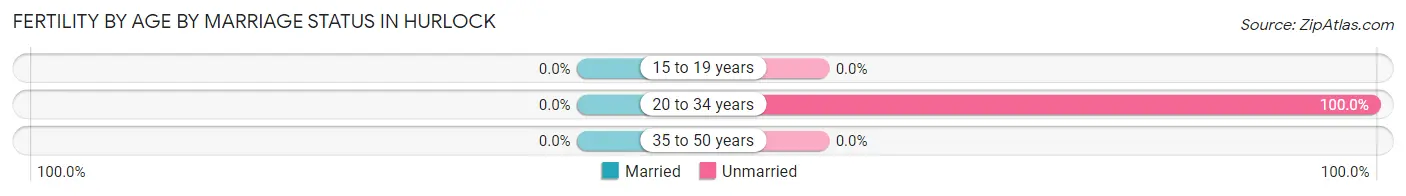
| Age Bracket | Married | Unmarried |
| 15 to 19 years | 0 (0.0%) | 0 (0.0%) |
| 20 to 34 years | 0 (0.0%) | 26 (100.0%) |
| 35 to 50 years | 0 (0.0%) | 0 (0.0%) |
| Total | 0 (0.0%) | 26 (100.0%) |
Fertility by Education in Hurlock
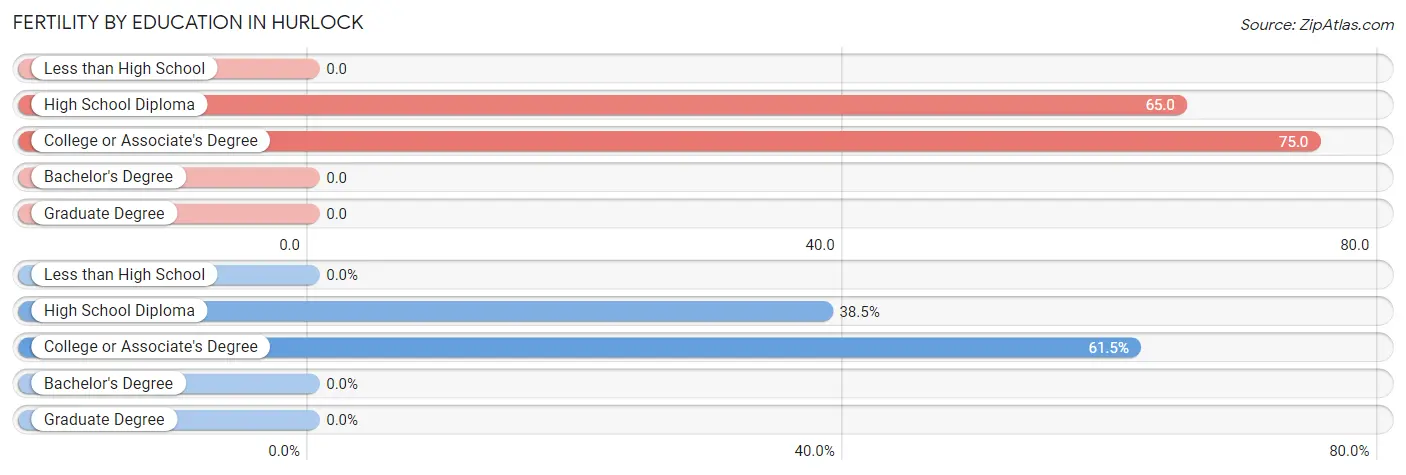
| Educational Attainment | Women with Births | Births / 1,000 Women |
| Less than High School | 0 (0.0%) | 0.0 |
| High School Diploma | 10 (38.5%) | 65.0 |
| College or Associate's Degree | 16 (61.5%) | 75.0 |
| Bachelor's Degree | 0 (0.0%) | 0.0 |
| Graduate Degree | 0 (0.0%) | 0.0 |
| Total | 26 (100.0%) | 45.0 |
Fertility by Education by Marriage Status in Hurlock
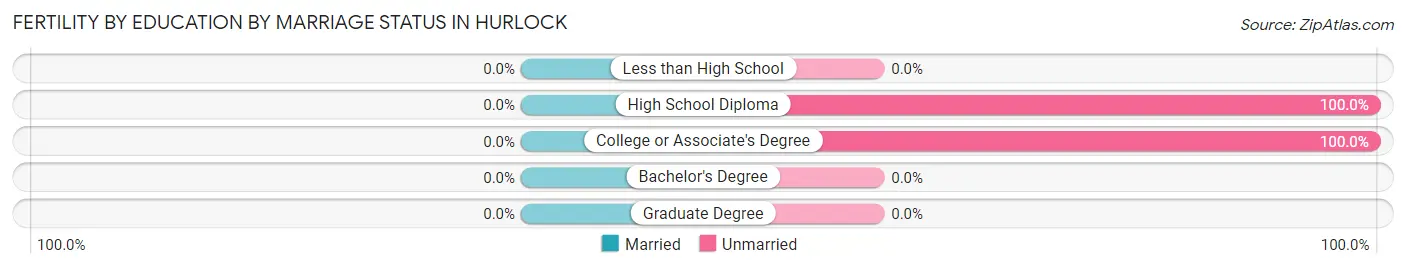
| Educational Attainment | Married | Unmarried |
| Less than High School | 0 (0.0%) | 0 (0.0%) |
| High School Diploma | 0 (0.0%) | 10 (100.0%) |
| College or Associate's Degree | 0 (0.0%) | 16 (100.0%) |
| Bachelor's Degree | 0 (0.0%) | 0 (0.0%) |
| Graduate Degree | 0 (0.0%) | 0 (0.0%) |
| Total | 0 (0.0%) | 26 (100.0%) |
Employment Characteristics in Hurlock
Employment by Class of Employer in Hurlock
Among the 978 employed individuals in Hurlock, private company employees (646 | 66.0%), not-for-profit organizations (101 | 10.3%), and local government employees (76 | 7.8%) make up the most common classes of employment.
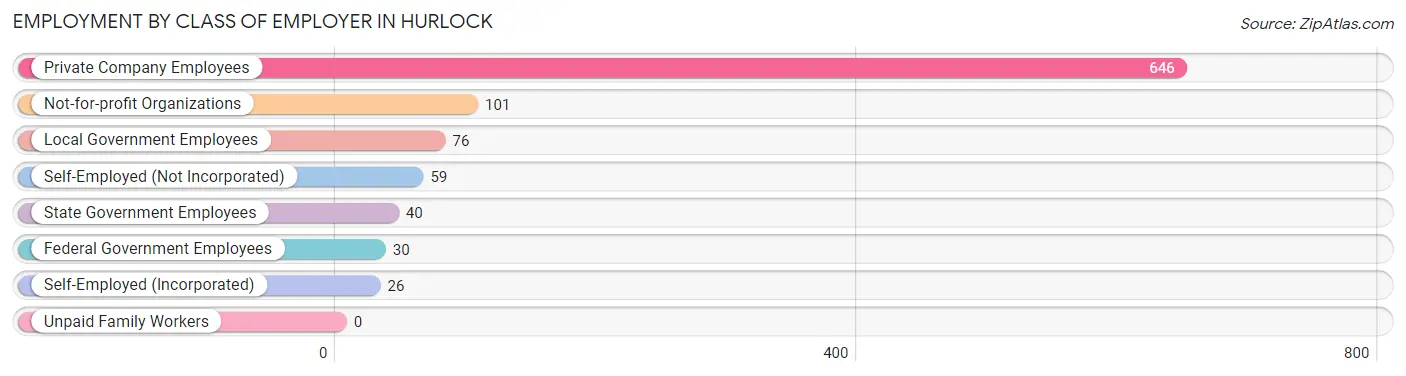
| Employer Class | # Employees | % Employees |
| Private Company Employees | 646 | 66.0% |
| Self-Employed (Incorporated) | 26 | 2.7% |
| Self-Employed (Not Incorporated) | 59 | 6.0% |
| Not-for-profit Organizations | 101 | 10.3% |
| Local Government Employees | 76 | 7.8% |
| State Government Employees | 40 | 4.1% |
| Federal Government Employees | 30 | 3.1% |
| Unpaid Family Workers | 0 | 0.0% |
| Total | 978 | 100.0% |
Employment Status by Age in Hurlock
According to the labor force statistics for Hurlock, out of the total population over 16 years of age (1,803), 60.1% or 1,084 individuals are in the labor force, with 6.5% or 70 of them unemployed. The age group with the highest labor force participation rate is 25 to 29 years, with 100.0% or 113 individuals in the labor force. Within the labor force, the 16 to 19 years age range has the highest percentage of unemployed individuals, with 68.3% or 28 of them being unemployed.
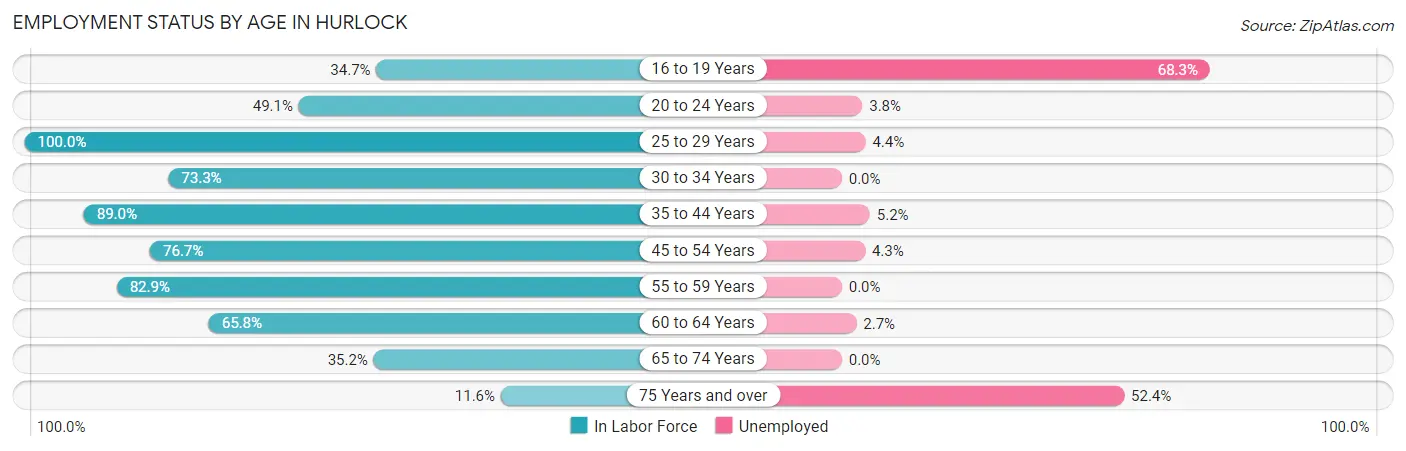
| Age Bracket | In Labor Force | Unemployed |
| 16 to 19 Years | 41 (34.7%) | 28 (68.3%) |
| 20 to 24 Years | 85 (49.1%) | 3 (3.8%) |
| 25 to 29 Years | 113 (100.0%) | 5 (4.4%) |
| 30 to 34 Years | 85 (73.3%) | 0 (0.0%) |
| 35 to 44 Years | 250 (89.0%) | 13 (5.2%) |
| 45 to 54 Years | 184 (76.7%) | 8 (4.3%) |
| 55 to 59 Years | 116 (82.9%) | 0 (0.0%) |
| 60 to 64 Years | 73 (65.8%) | 2 (2.7%) |
| 65 to 74 Years | 116 (35.2%) | 0 (0.0%) |
| 75 Years and over | 21 (11.6%) | 11 (52.4%) |
| Total | 1,084 (60.1%) | 70 (6.5%) |
Employment Status by Educational Attainment in Hurlock
According to labor force statistics for Hurlock, 82.0% of individuals (821) out of the total population between 25 and 64 years of age (1,001) are in the labor force, with 3.4% or 28 of them being unemployed. The group with the highest labor force participation rate are those with the educational attainment of bachelor's degree or higher, with 87.5% or 105 individuals in the labor force. Within the labor force, individuals with less than high school education have the highest percentage of unemployment, with 7.1% or 8 of them being unemployed.
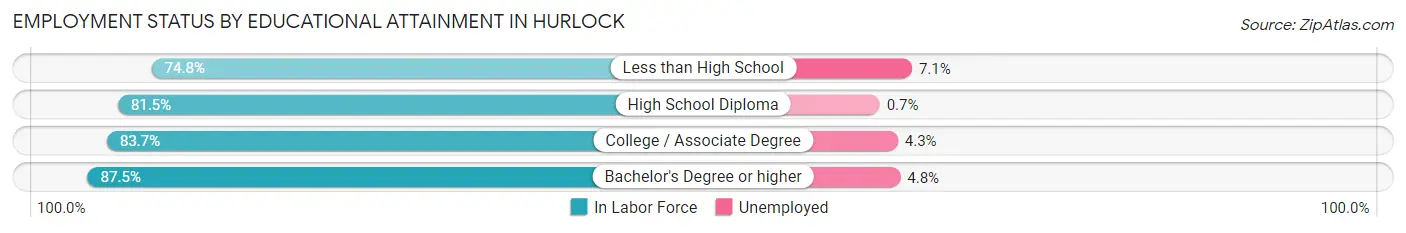
| Educational Attainment | In Labor Force | Unemployed |
| Less than High School | 113 (74.8%) | 11 (7.1%) |
| High School Diploma | 300 (81.5%) | 3 (0.7%) |
| College / Associate Degree | 303 (83.7%) | 16 (4.3%) |
| Bachelor's Degree or higher | 105 (87.5%) | 6 (4.8%) |
| Total | 821 (82.0%) | 34 (3.4%) |
Employment Occupations by Sex in Hurlock
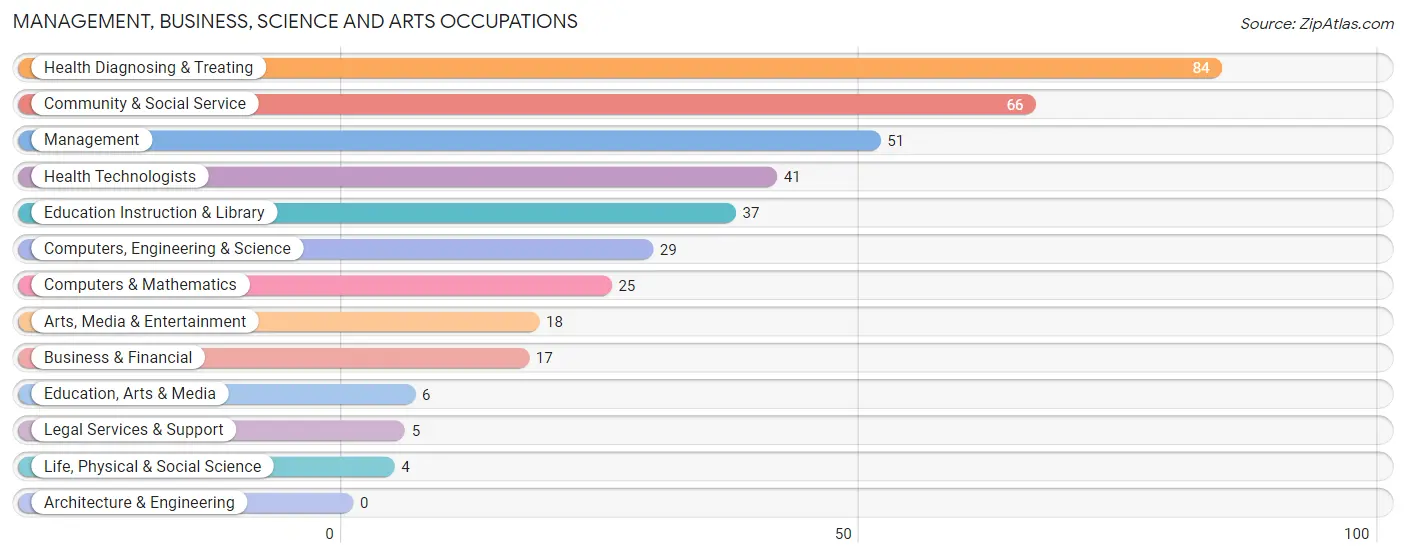
Management, Business, Science and Arts Occupations
The most common Management, Business, Science and Arts occupations in Hurlock are Health Diagnosing & Treating (84 | 8.3%), Community & Social Service (66 | 6.6%), Management (51 | 5.1%), Health Technologists (41 | 4.1%), and Education Instruction & Library (37 | 3.7%).
Management, Business, Science and Arts Occupations by Sex
Within the Management, Business, Science and Arts occupations in Hurlock, the most male-oriented occupations are Arts, Media & Entertainment (100.0%), Computers & Mathematics (88.0%), and Management (82.4%), while the most female-oriented occupations are Life, Physical & Social Science (100.0%), Education, Arts & Media (100.0%), and Legal Services & Support (100.0%).
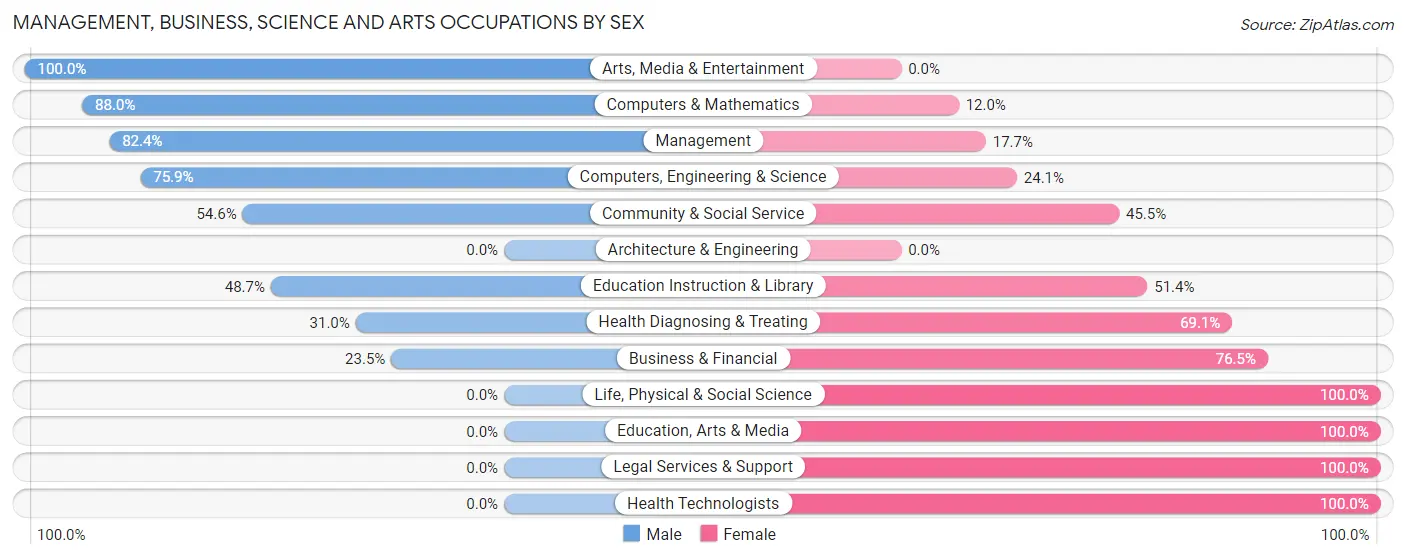
| Occupation | Male | Female |
| Management | 42 (82.4%) | 9 (17.6%) |
| Business & Financial | 4 (23.5%) | 13 (76.5%) |
| Computers, Engineering & Science | 22 (75.9%) | 7 (24.1%) |
| Computers & Mathematics | 22 (88.0%) | 3 (12.0%) |
| Architecture & Engineering | 0 (0.0%) | 0 (0.0%) |
| Life, Physical & Social Science | 0 (0.0%) | 4 (100.0%) |
| Community & Social Service | 36 (54.5%) | 30 (45.5%) |
| Education, Arts & Media | 0 (0.0%) | 6 (100.0%) |
| Legal Services & Support | 0 (0.0%) | 5 (100.0%) |
| Education Instruction & Library | 18 (48.6%) | 19 (51.3%) |
| Arts, Media & Entertainment | 18 (100.0%) | 0 (0.0%) |
| Health Diagnosing & Treating | 26 (30.9%) | 58 (69.1%) |
| Health Technologists | 0 (0.0%) | 41 (100.0%) |
| Total (Category) | 130 (52.6%) | 117 (47.4%) |
| Total (Overall) | 528 (52.4%) | 480 (47.6%) |
Services Occupations
The most common Services occupations in Hurlock are Cleaning & Maintenance (85 | 8.4%), Healthcare Support (46 | 4.6%), Security & Protection (45 | 4.5%), Personal Care & Service (31 | 3.1%), and Law Enforcement (28 | 2.8%).
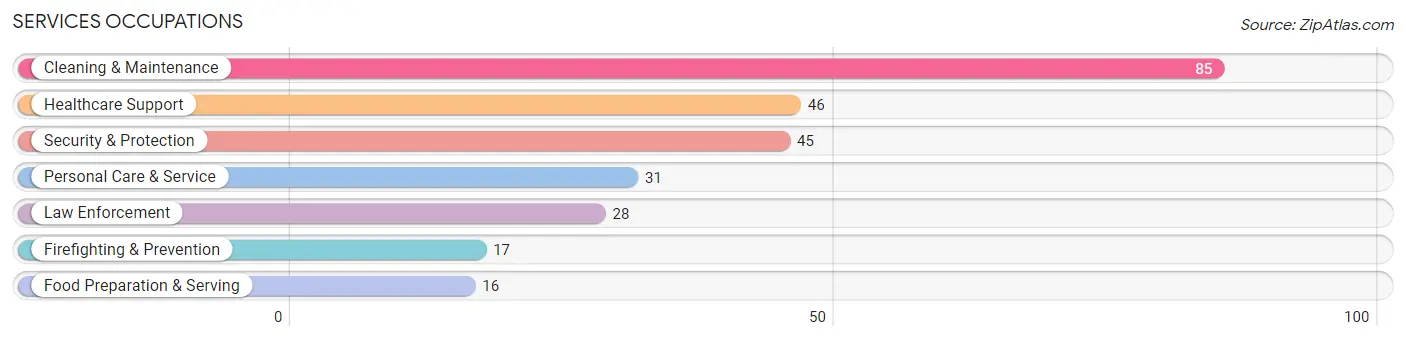
Services Occupations by Sex
Within the Services occupations in Hurlock, the most male-oriented occupations are Firefighting & Prevention (100.0%), Security & Protection (88.9%), and Law Enforcement (82.1%), while the most female-oriented occupations are Food Preparation & Serving (100.0%), Healthcare Support (93.5%), and Personal Care & Service (90.3%).
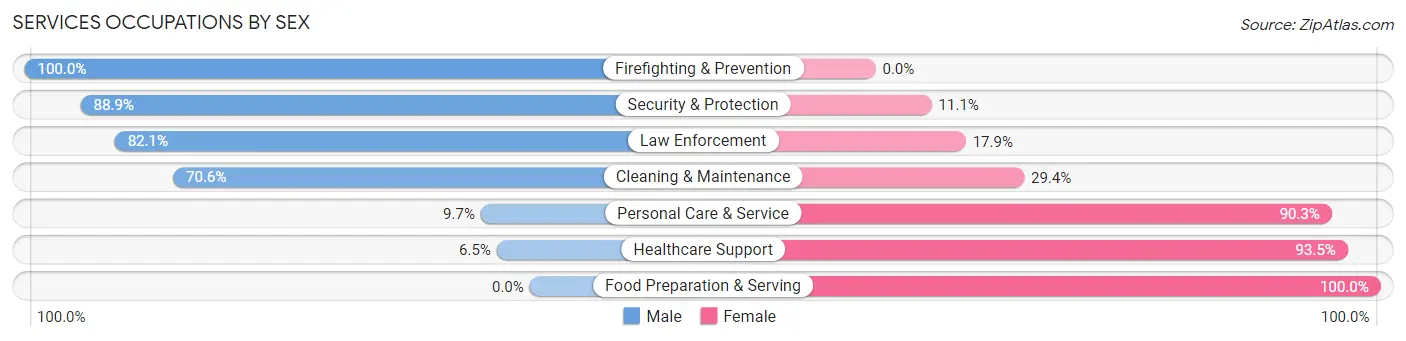
| Occupation | Male | Female |
| Healthcare Support | 3 (6.5%) | 43 (93.5%) |
| Security & Protection | 40 (88.9%) | 5 (11.1%) |
| Firefighting & Prevention | 17 (100.0%) | 0 (0.0%) |
| Law Enforcement | 23 (82.1%) | 5 (17.9%) |
| Food Preparation & Serving | 0 (0.0%) | 16 (100.0%) |
| Cleaning & Maintenance | 60 (70.6%) | 25 (29.4%) |
| Personal Care & Service | 3 (9.7%) | 28 (90.3%) |
| Total (Category) | 106 (47.5%) | 117 (52.5%) |
| Total (Overall) | 528 (52.4%) | 480 (47.6%) |
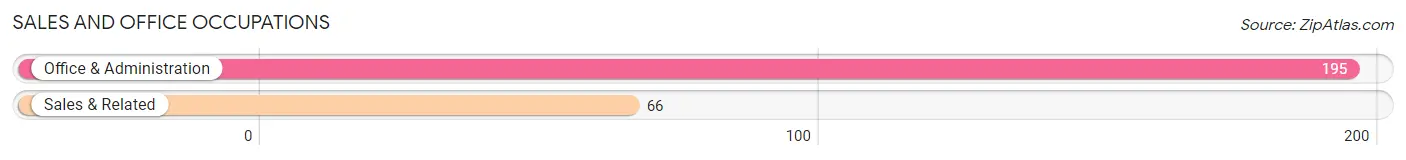
Sales and Office Occupations
The most common Sales and Office occupations in Hurlock are Office & Administration (195 | 19.4%), and Sales & Related (66 | 6.6%).
Sales and Office Occupations by Sex
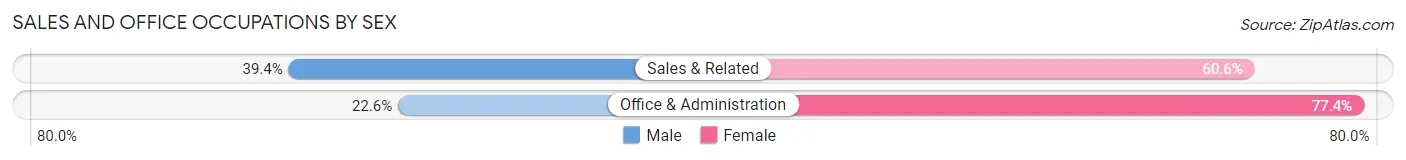
| Occupation | Male | Female |
| Sales & Related | 26 (39.4%) | 40 (60.6%) |
| Office & Administration | 44 (22.6%) | 151 (77.4%) |
| Total (Category) | 70 (26.8%) | 191 (73.2%) |
| Total (Overall) | 528 (52.4%) | 480 (47.6%) |
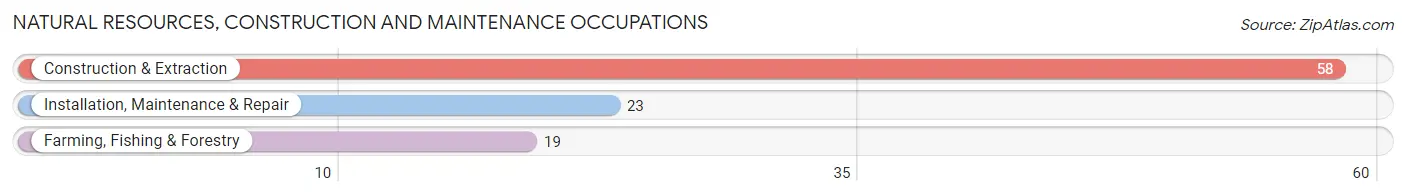
Natural Resources, Construction and Maintenance Occupations
The most common Natural Resources, Construction and Maintenance occupations in Hurlock are Construction & Extraction (58 | 5.8%), Installation, Maintenance & Repair (23 | 2.3%), and Farming, Fishing & Forestry (19 | 1.9%).
Natural Resources, Construction and Maintenance Occupations by Sex
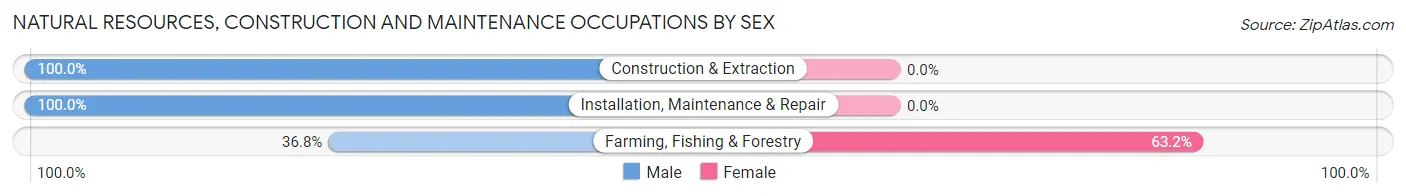
| Occupation | Male | Female |
| Farming, Fishing & Forestry | 7 (36.8%) | 12 (63.2%) |
| Construction & Extraction | 58 (100.0%) | 0 (0.0%) |
| Installation, Maintenance & Repair | 23 (100.0%) | 0 (0.0%) |
| Total (Category) | 88 (88.0%) | 12 (12.0%) |
| Total (Overall) | 528 (52.4%) | 480 (47.6%) |
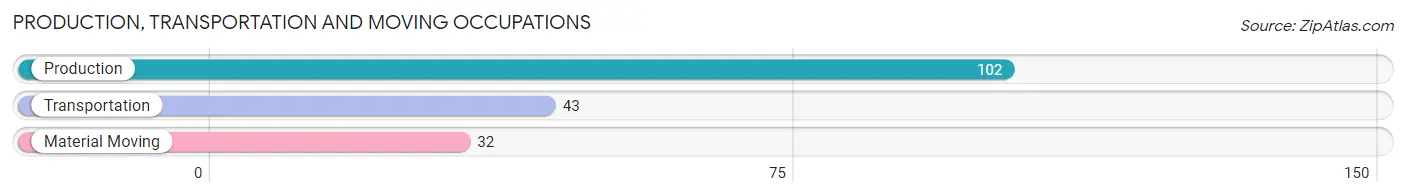
Production, Transportation and Moving Occupations
The most common Production, Transportation and Moving occupations in Hurlock are Production (102 | 10.1%), Transportation (43 | 4.3%), and Material Moving (32 | 3.2%).
Production, Transportation and Moving Occupations by Sex
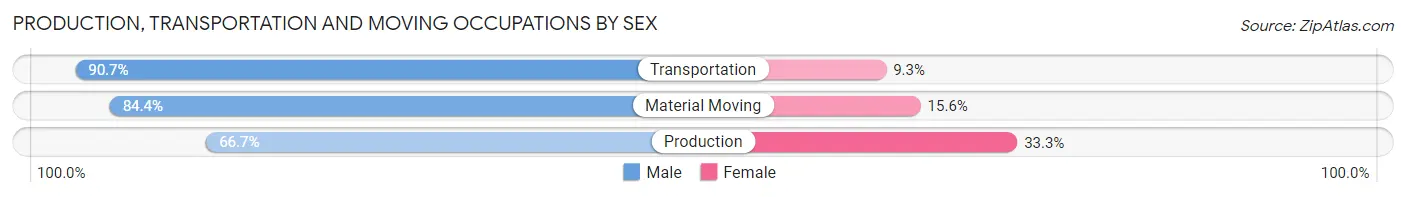
| Occupation | Male | Female |
| Production | 68 (66.7%) | 34 (33.3%) |
| Transportation | 39 (90.7%) | 4 (9.3%) |
| Material Moving | 27 (84.4%) | 5 (15.6%) |
| Total (Category) | 134 (75.7%) | 43 (24.3%) |
| Total (Overall) | 528 (52.4%) | 480 (47.6%) |
Employment Industries by Sex in Hurlock
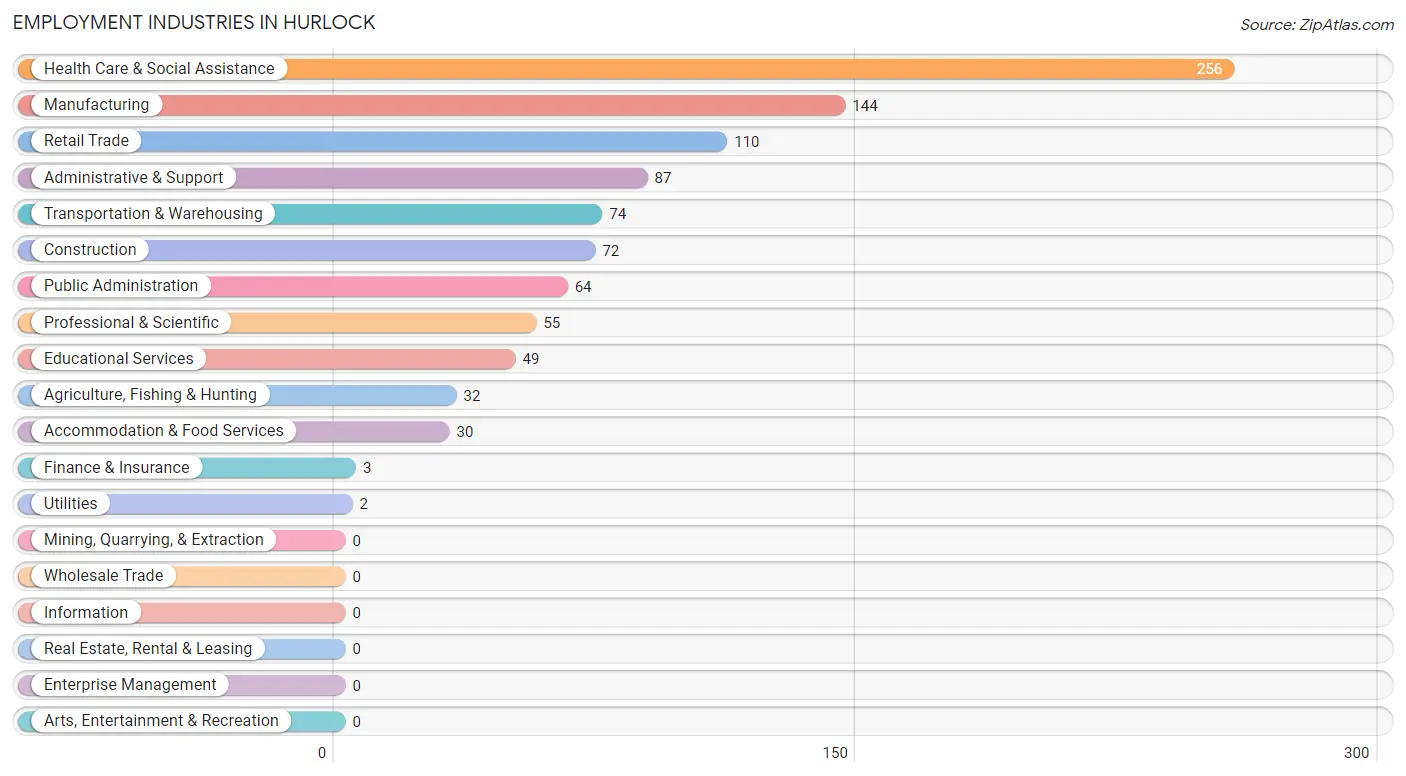
Employment Industries in Hurlock
The major employment industries in Hurlock include Health Care & Social Assistance (256 | 25.4%), Manufacturing (144 | 14.3%), Retail Trade (110 | 10.9%), Administrative & Support (87 | 8.6%), and Transportation & Warehousing (74 | 7.3%).
Employment Industries by Sex in Hurlock
The Hurlock industries that see more men than women are Utilities (100.0%), Professional & Scientific (85.5%), and Construction (80.6%), whereas the industries that tend to have a higher number of women are Finance & Insurance (100.0%), Health Care & Social Assistance (82.0%), and Educational Services (71.4%).
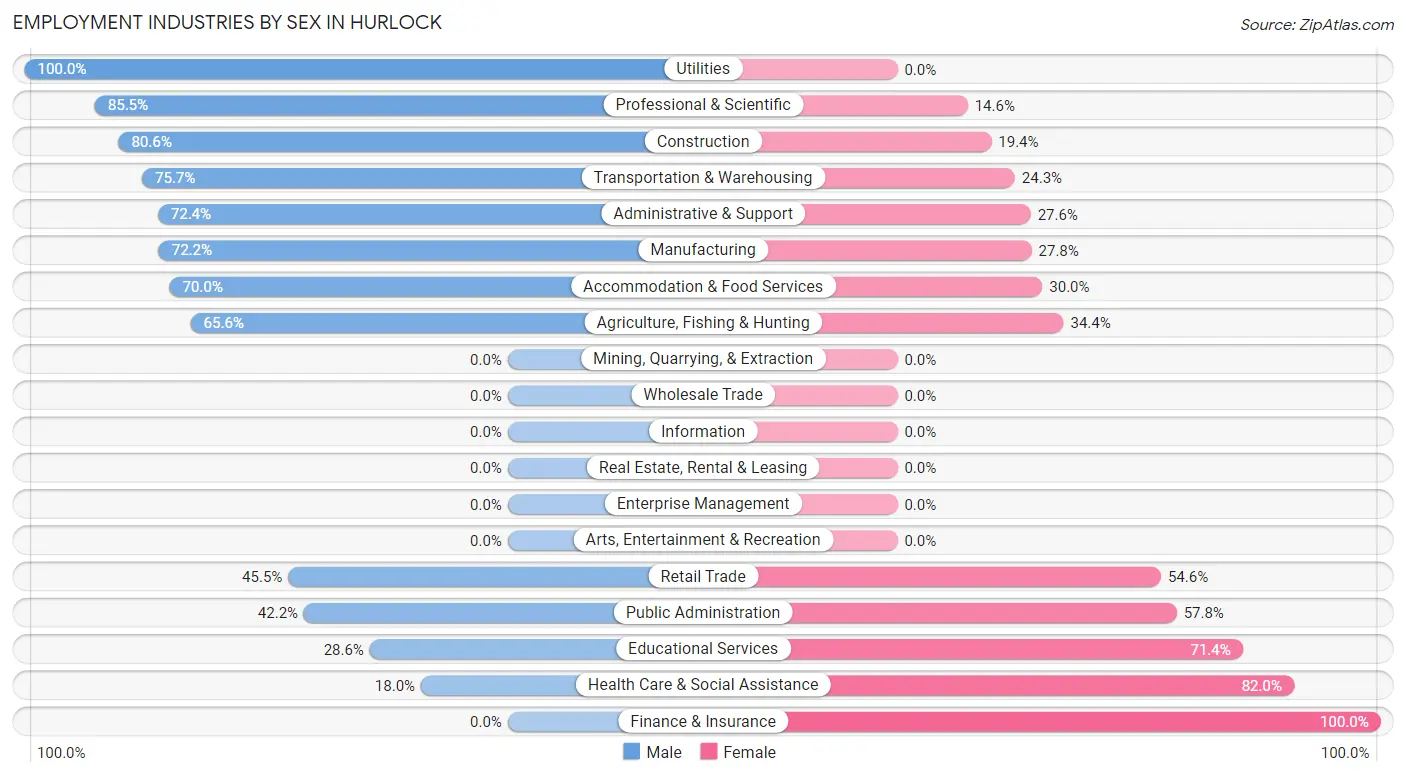
| Industry | Male | Female |
| Agriculture, Fishing & Hunting | 21 (65.6%) | 11 (34.4%) |
| Mining, Quarrying, & Extraction | 0 (0.0%) | 0 (0.0%) |
| Construction | 58 (80.6%) | 14 (19.4%) |
| Manufacturing | 104 (72.2%) | 40 (27.8%) |
| Wholesale Trade | 0 (0.0%) | 0 (0.0%) |
| Retail Trade | 50 (45.5%) | 60 (54.5%) |
| Transportation & Warehousing | 56 (75.7%) | 18 (24.3%) |
| Utilities | 2 (100.0%) | 0 (0.0%) |
| Information | 0 (0.0%) | 0 (0.0%) |
| Finance & Insurance | 0 (0.0%) | 3 (100.0%) |
| Real Estate, Rental & Leasing | 0 (0.0%) | 0 (0.0%) |
| Professional & Scientific | 47 (85.5%) | 8 (14.5%) |
| Enterprise Management | 0 (0.0%) | 0 (0.0%) |
| Administrative & Support | 63 (72.4%) | 24 (27.6%) |
| Educational Services | 14 (28.6%) | 35 (71.4%) |
| Health Care & Social Assistance | 46 (18.0%) | 210 (82.0%) |
| Arts, Entertainment & Recreation | 0 (0.0%) | 0 (0.0%) |
| Accommodation & Food Services | 21 (70.0%) | 9 (30.0%) |
| Public Administration | 27 (42.2%) | 37 (57.8%) |
| Total | 528 (52.4%) | 480 (47.6%) |
Education in Hurlock
School Enrollment in Hurlock
The most common levels of schooling among the 546 students in Hurlock are middle school (180 | 33.0%), high school (131 | 24.0%), and college / undergraduate (128 | 23.4%).
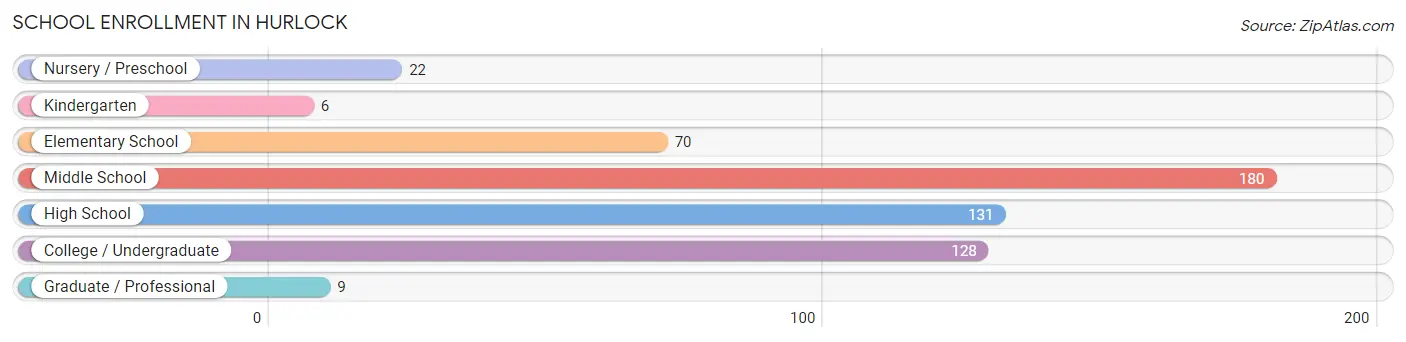
| School Level | # Students | % Students |
| Nursery / Preschool | 22 | 4.0% |
| Kindergarten | 6 | 1.1% |
| Elementary School | 70 | 12.8% |
| Middle School | 180 | 33.0% |
| High School | 131 | 24.0% |
| College / Undergraduate | 128 | 23.4% |
| Graduate / Professional | 9 | 1.7% |
| Total | 546 | 100.0% |
School Enrollment by Age by Funding Source in Hurlock
Out of a total of 546 students who are enrolled in schools in Hurlock, 46 (8.4%) attend a private institution, while the remaining 500 (91.6%) are enrolled in public schools. The age group of 25 to 34 year olds has the highest likelihood of being enrolled in private schools, with 13 (40.6% in the age bracket) enrolled. Conversely, the age group of 3 to 4 year olds has the lowest likelihood of being enrolled in a private school, with 17 (100.0% in the age bracket) attending a public institution.
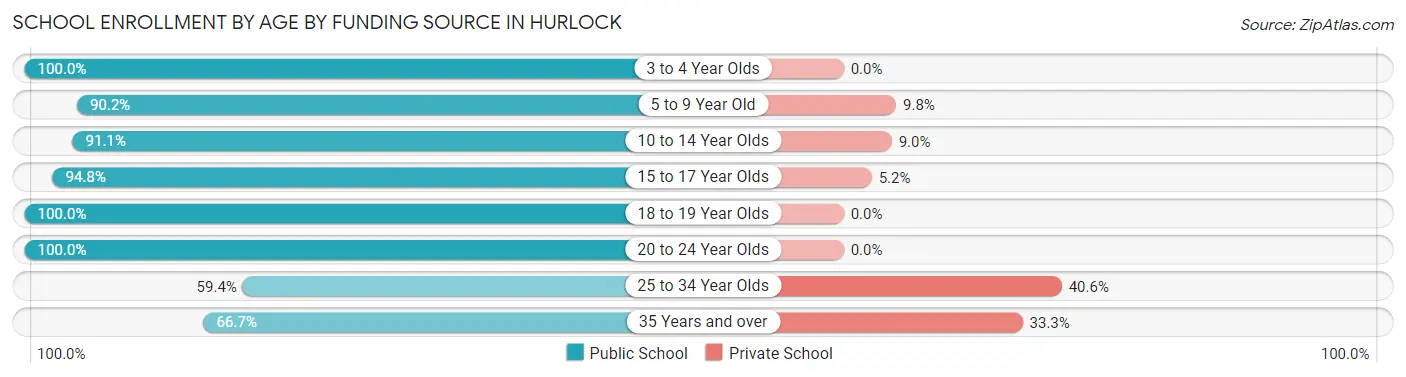
| Age Bracket | Public School | Private School |
| 3 to 4 Year Olds | 17 (100.0%) | 0 (0.0%) |
| 5 to 9 Year Old | 37 (90.2%) | 4 (9.8%) |
| 10 to 14 Year Olds | 173 (91.0%) | 17 (8.9%) |
| 15 to 17 Year Olds | 109 (94.8%) | 6 (5.2%) |
| 18 to 19 Year Olds | 59 (100.0%) | 0 (0.0%) |
| 20 to 24 Year Olds | 74 (100.0%) | 0 (0.0%) |
| 25 to 34 Year Olds | 19 (59.4%) | 13 (40.6%) |
| 35 Years and over | 12 (66.7%) | 6 (33.3%) |
| Total | 500 (91.6%) | 46 (8.4%) |
Educational Attainment by Field of Study in Hurlock
Education (37 | 17.7%), computers & mathematics (35 | 16.8%), psychology (27 | 12.9%), business (25 | 12.0%), and arts & humanities (23 | 11.0%) are the most common fields of study among 209 individuals in Hurlock who have obtained a bachelor's degree or higher.
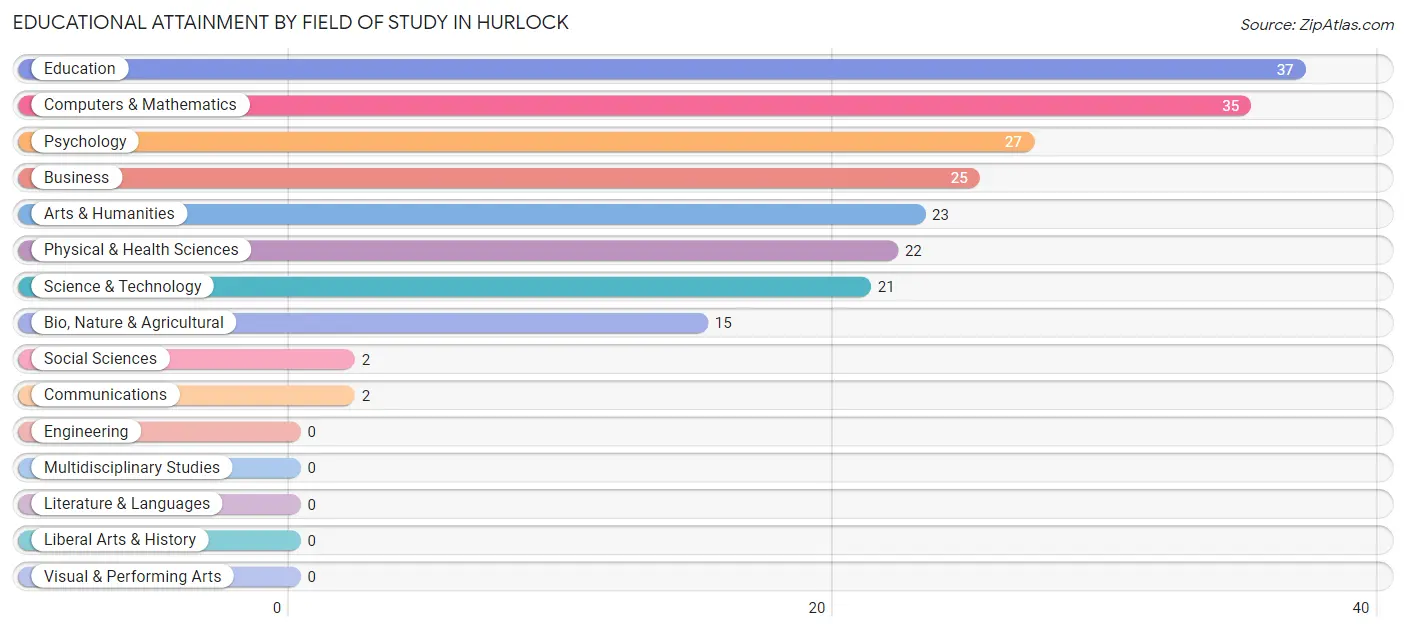
| Field of Study | # Graduates | % Graduates |
| Computers & Mathematics | 35 | 16.8% |
| Bio, Nature & Agricultural | 15 | 7.2% |
| Physical & Health Sciences | 22 | 10.5% |
| Psychology | 27 | 12.9% |
| Social Sciences | 2 | 1.0% |
| Engineering | 0 | 0.0% |
| Multidisciplinary Studies | 0 | 0.0% |
| Science & Technology | 21 | 10.1% |
| Business | 25 | 12.0% |
| Education | 37 | 17.7% |
| Literature & Languages | 0 | 0.0% |
| Liberal Arts & History | 0 | 0.0% |
| Visual & Performing Arts | 0 | 0.0% |
| Communications | 2 | 1.0% |
| Arts & Humanities | 23 | 11.0% |
| Total | 209 | 100.0% |
Transportation & Commute in Hurlock
Vehicle Availability by Sex in Hurlock
The most prevalent vehicle ownership categories in Hurlock are males with 2 vehicles (219, accounting for 44.5%) and females with 2 vehicles (196, making up 45.6%).
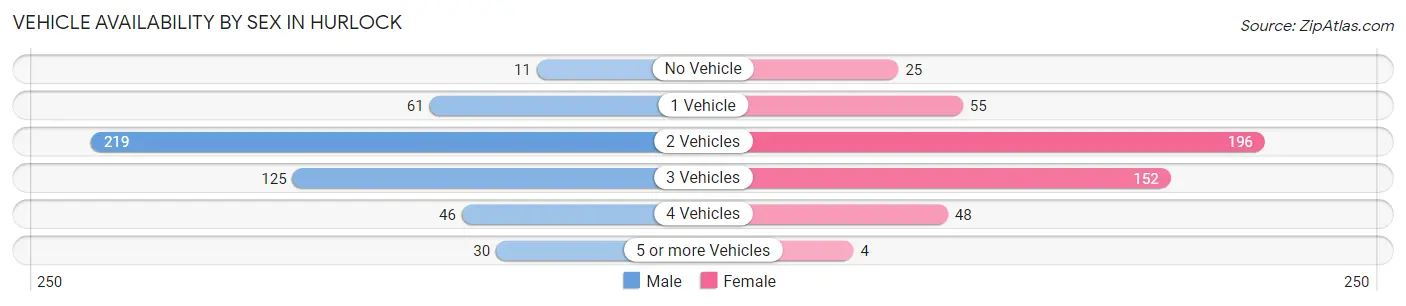
| Vehicles Available | Male | Female |
| No Vehicle | 11 (2.2%) | 25 (5.2%) |
| 1 Vehicle | 61 (12.4%) | 55 (11.5%) |
| 2 Vehicles | 219 (44.5%) | 196 (40.8%) |
| 3 Vehicles | 125 (25.4%) | 152 (31.7%) |
| 4 Vehicles | 46 (9.3%) | 48 (10.0%) |
| 5 or more Vehicles | 30 (6.1%) | 4 (0.8%) |
| Total | 492 (100.0%) | 480 (100.0%) |
Commute Time in Hurlock
The most frequently occuring commute durations in Hurlock are 20 to 24 minutes (197 commuters, 21.0%), 25 to 29 minutes (121 commuters, 12.9%), and 30 to 34 minutes (112 commuters, 11.9%).
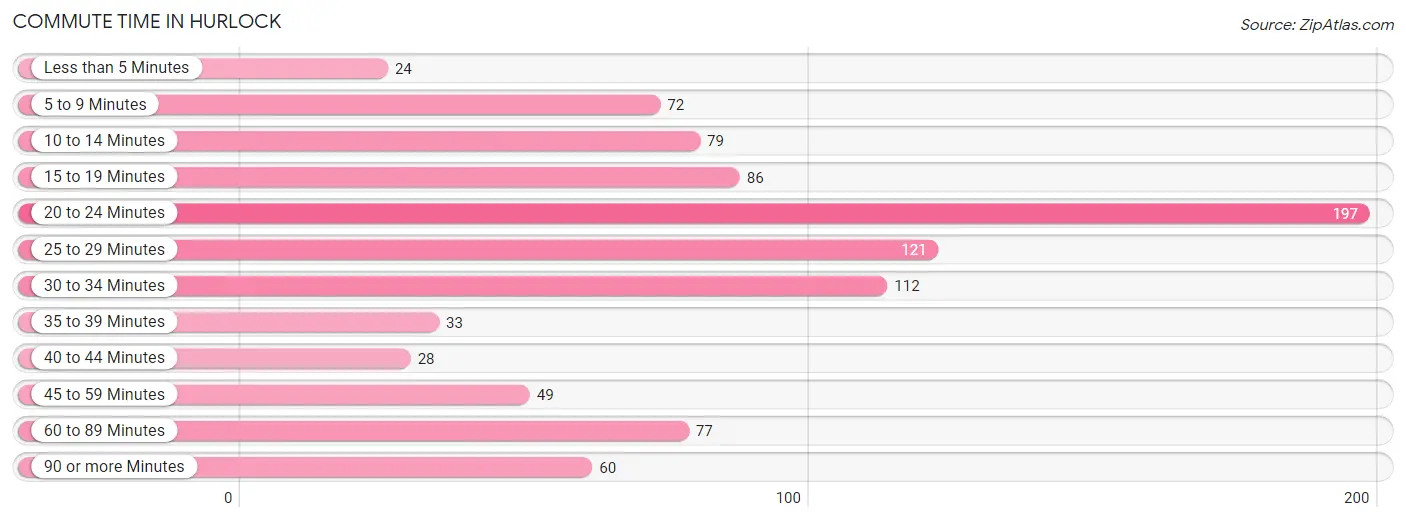
| Commute Time | # Commuters | % Commuters |
| Less than 5 Minutes | 24 | 2.6% |
| 5 to 9 Minutes | 72 | 7.7% |
| 10 to 14 Minutes | 79 | 8.4% |
| 15 to 19 Minutes | 86 | 9.2% |
| 20 to 24 Minutes | 197 | 21.0% |
| 25 to 29 Minutes | 121 | 12.9% |
| 30 to 34 Minutes | 112 | 11.9% |
| 35 to 39 Minutes | 33 | 3.5% |
| 40 to 44 Minutes | 28 | 3.0% |
| 45 to 59 Minutes | 49 | 5.2% |
| 60 to 89 Minutes | 77 | 8.2% |
| 90 or more Minutes | 60 | 6.4% |
Commute Time by Sex in Hurlock
The most common commute times in Hurlock are 20 to 24 minutes (112 commuters, 23.1%) for males and 20 to 24 minutes (85 commuters, 18.8%) for females.
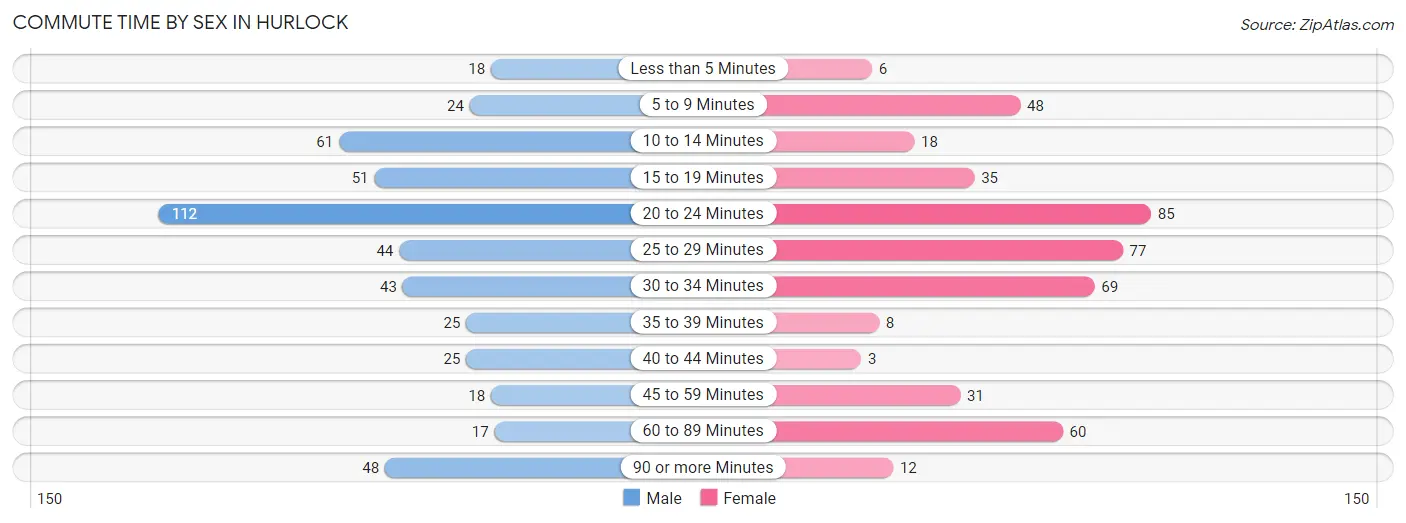
| Commute Time | Male | Female |
| Less than 5 Minutes | 18 (3.7%) | 6 (1.3%) |
| 5 to 9 Minutes | 24 (4.9%) | 48 (10.6%) |
| 10 to 14 Minutes | 61 (12.6%) | 18 (4.0%) |
| 15 to 19 Minutes | 51 (10.5%) | 35 (7.7%) |
| 20 to 24 Minutes | 112 (23.1%) | 85 (18.8%) |
| 25 to 29 Minutes | 44 (9.0%) | 77 (17.0%) |
| 30 to 34 Minutes | 43 (8.8%) | 69 (15.3%) |
| 35 to 39 Minutes | 25 (5.1%) | 8 (1.8%) |
| 40 to 44 Minutes | 25 (5.1%) | 3 (0.7%) |
| 45 to 59 Minutes | 18 (3.7%) | 31 (6.9%) |
| 60 to 89 Minutes | 17 (3.5%) | 60 (13.3%) |
| 90 or more Minutes | 48 (9.9%) | 12 (2.6%) |
Time of Departure to Work by Sex in Hurlock
The most frequent times of departure to work in Hurlock are 12:00 AM to 4:59 AM (120, 24.7%) for males and 6:30 AM to 6:59 AM (124, 27.4%) for females.
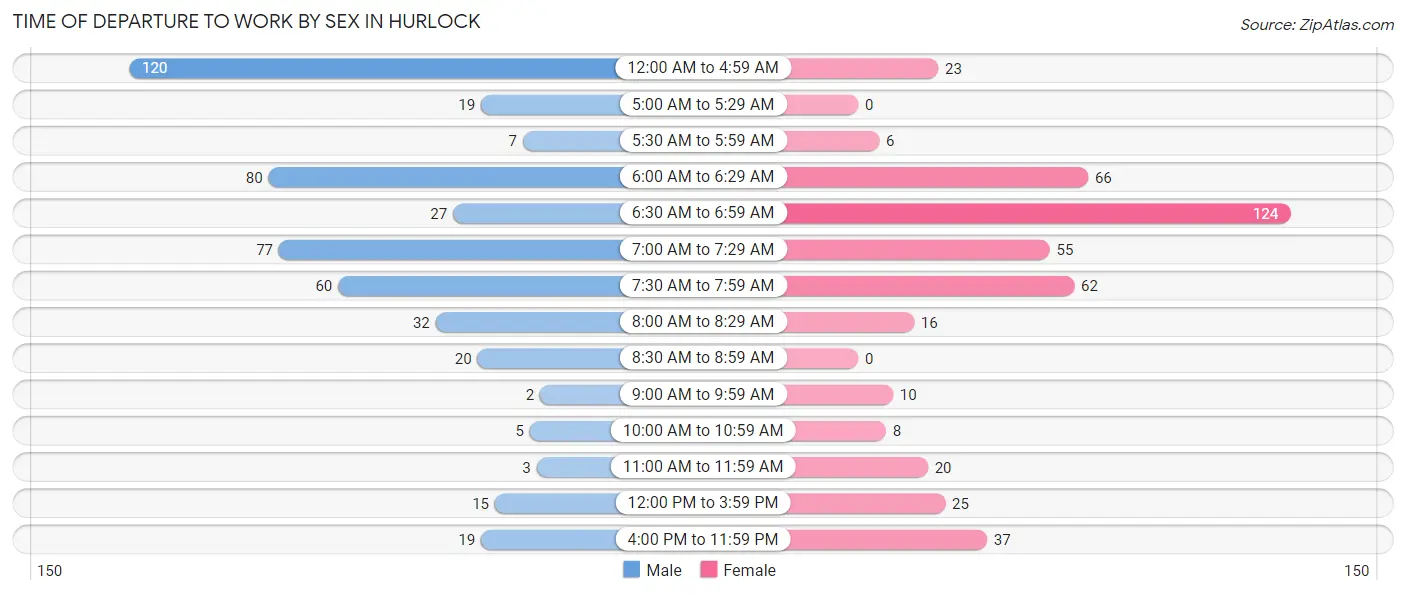
| Time of Departure | Male | Female |
| 12:00 AM to 4:59 AM | 120 (24.7%) | 23 (5.1%) |
| 5:00 AM to 5:29 AM | 19 (3.9%) | 0 (0.0%) |
| 5:30 AM to 5:59 AM | 7 (1.4%) | 6 (1.3%) |
| 6:00 AM to 6:29 AM | 80 (16.5%) | 66 (14.6%) |
| 6:30 AM to 6:59 AM | 27 (5.6%) | 124 (27.4%) |
| 7:00 AM to 7:29 AM | 77 (15.8%) | 55 (12.2%) |
| 7:30 AM to 7:59 AM | 60 (12.3%) | 62 (13.7%) |
| 8:00 AM to 8:29 AM | 32 (6.6%) | 16 (3.5%) |
| 8:30 AM to 8:59 AM | 20 (4.1%) | 0 (0.0%) |
| 9:00 AM to 9:59 AM | 2 (0.4%) | 10 (2.2%) |
| 10:00 AM to 10:59 AM | 5 (1.0%) | 8 (1.8%) |
| 11:00 AM to 11:59 AM | 3 (0.6%) | 20 (4.4%) |
| 12:00 PM to 3:59 PM | 15 (3.1%) | 25 (5.5%) |
| 4:00 PM to 11:59 PM | 19 (3.9%) | 37 (8.2%) |
| Total | 486 (100.0%) | 452 (100.0%) |
Housing Occupancy in Hurlock
Occupancy by Ownership in Hurlock
Of the total 843 dwellings in Hurlock, owner-occupied units account for 583 (69.2%), while renter-occupied units make up 260 (30.8%).
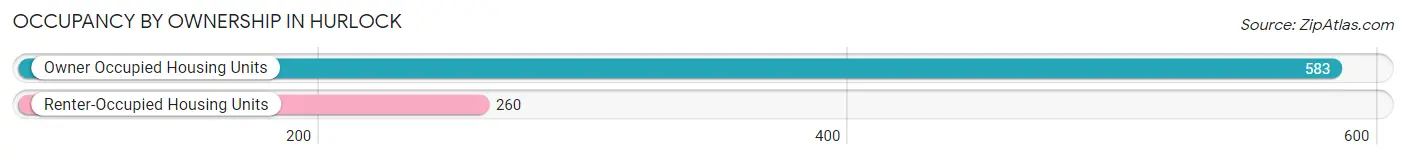
| Occupancy | # Housing Units | % Housing Units |
| Owner Occupied Housing Units | 583 | 69.2% |
| Renter-Occupied Housing Units | 260 | 30.8% |
| Total Occupied Housing Units | 843 | 100.0% |
Occupancy by Household Size in Hurlock
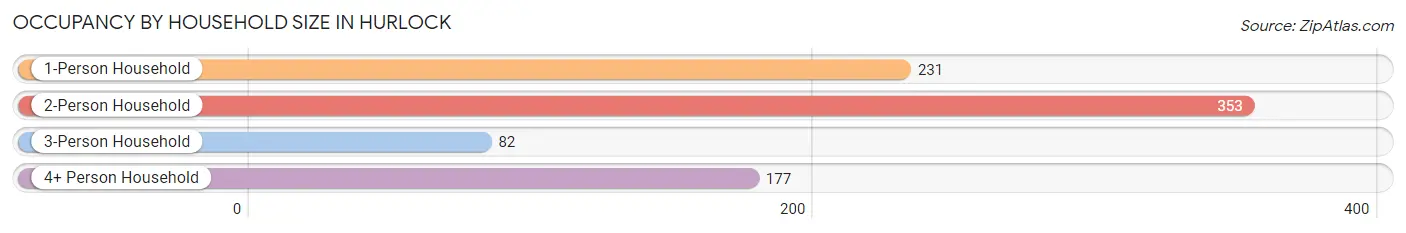
| Household Size | # Housing Units | % Housing Units |
| 1-Person Household | 231 | 27.4% |
| 2-Person Household | 353 | 41.9% |
| 3-Person Household | 82 | 9.7% |
| 4+ Person Household | 177 | 21.0% |
| Total Housing Units | 843 | 100.0% |
Occupancy by Ownership by Household Size in Hurlock
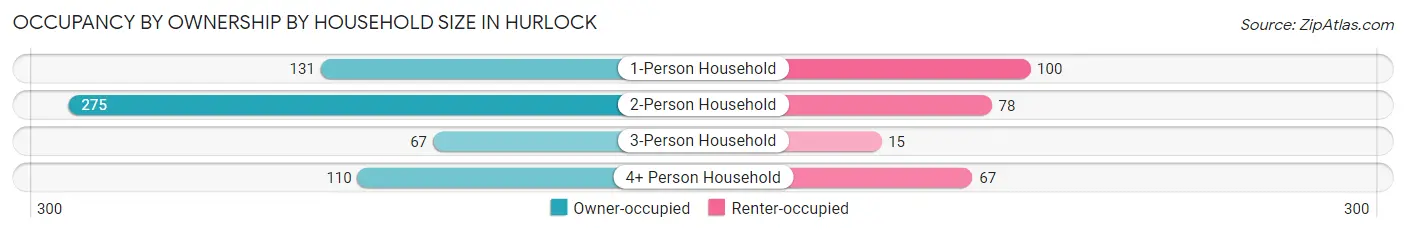
| Household Size | Owner-occupied | Renter-occupied |
| 1-Person Household | 131 (56.7%) | 100 (43.3%) |
| 2-Person Household | 275 (77.9%) | 78 (22.1%) |
| 3-Person Household | 67 (81.7%) | 15 (18.3%) |
| 4+ Person Household | 110 (62.2%) | 67 (37.9%) |
| Total Housing Units | 583 (69.2%) | 260 (30.8%) |
Occupancy by Educational Attainment in Hurlock
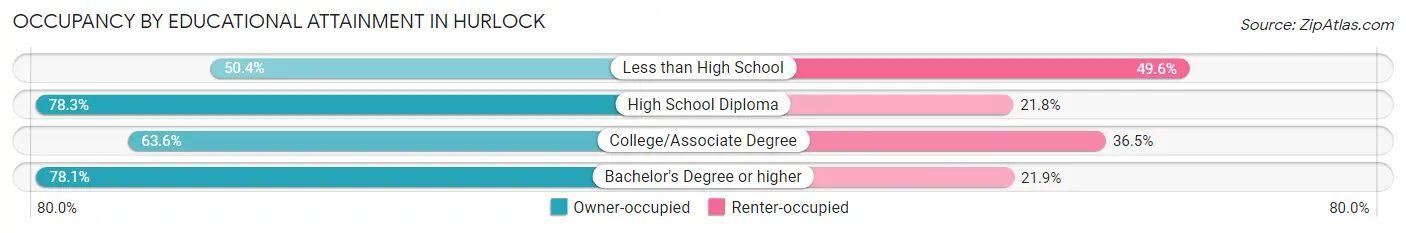
| Household Size | Owner-occupied | Renter-occupied |
| Less than High School | 59 (50.4%) | 58 (49.6%) |
| High School Diploma | 259 (78.2%) | 72 (21.7%) |
| College/Associate Degree | 190 (63.5%) | 109 (36.4%) |
| Bachelor's Degree or higher | 75 (78.1%) | 21 (21.9%) |
Occupancy by Age of Householder in Hurlock
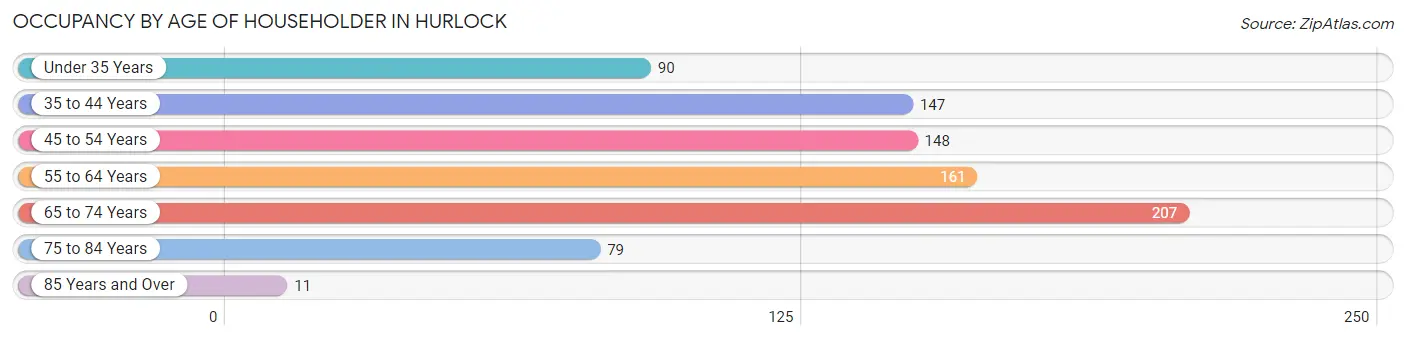
| Age Bracket | # Households | % Households |
| Under 35 Years | 90 | 10.7% |
| 35 to 44 Years | 147 | 17.4% |
| 45 to 54 Years | 148 | 17.6% |
| 55 to 64 Years | 161 | 19.1% |
| 65 to 74 Years | 207 | 24.6% |
| 75 to 84 Years | 79 | 9.4% |
| 85 Years and Over | 11 | 1.3% |
| Total | 843 | 100.0% |
Housing Finances in Hurlock
Median Income by Occupancy in Hurlock
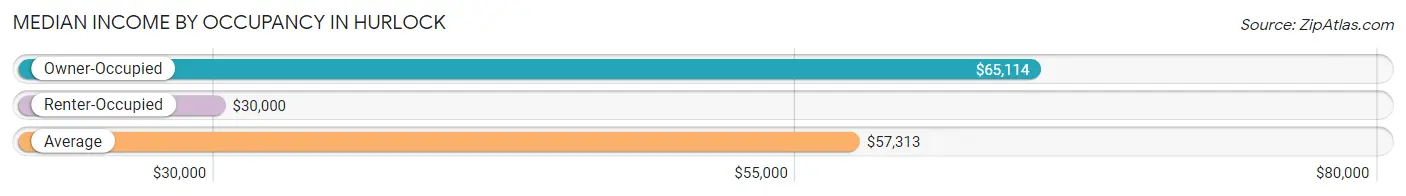
| Occupancy Type | # Households | Median Income |
| Owner-Occupied | 583 (69.2%) | $65,114 |
| Renter-Occupied | 260 (30.8%) | $30,000 |
| Average | 843 (100.0%) | $57,313 |
Occupancy by Householder Income Bracket in Hurlock
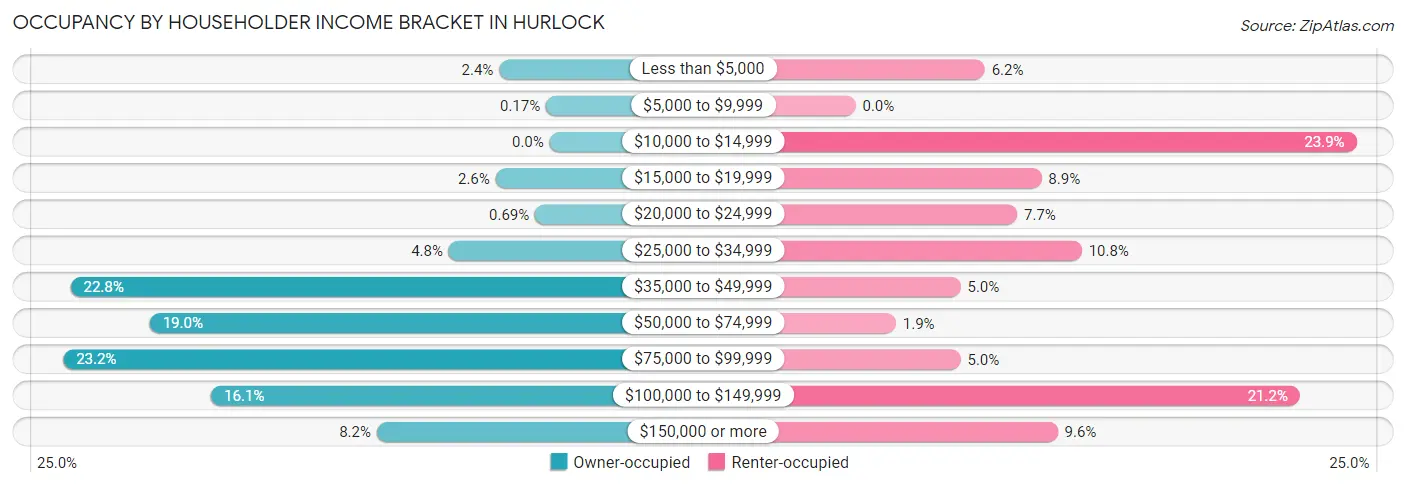
| Income Bracket | Owner-occupied | Renter-occupied |
| Less than $5,000 | 14 (2.4%) | 16 (6.1%) |
| $5,000 to $9,999 | 1 (0.2%) | 0 (0.0%) |
| $10,000 to $14,999 | 0 (0.0%) | 62 (23.8%) |
| $15,000 to $19,999 | 15 (2.6%) | 23 (8.8%) |
| $20,000 to $24,999 | 4 (0.7%) | 20 (7.7%) |
| $25,000 to $34,999 | 28 (4.8%) | 28 (10.8%) |
| $35,000 to $49,999 | 133 (22.8%) | 13 (5.0%) |
| $50,000 to $74,999 | 111 (19.0%) | 5 (1.9%) |
| $75,000 to $99,999 | 135 (23.2%) | 13 (5.0%) |
| $100,000 to $149,999 | 94 (16.1%) | 55 (21.1%) |
| $150,000 or more | 48 (8.2%) | 25 (9.6%) |
| Total | 583 (100.0%) | 260 (100.0%) |
Monthly Housing Cost Tiers in Hurlock
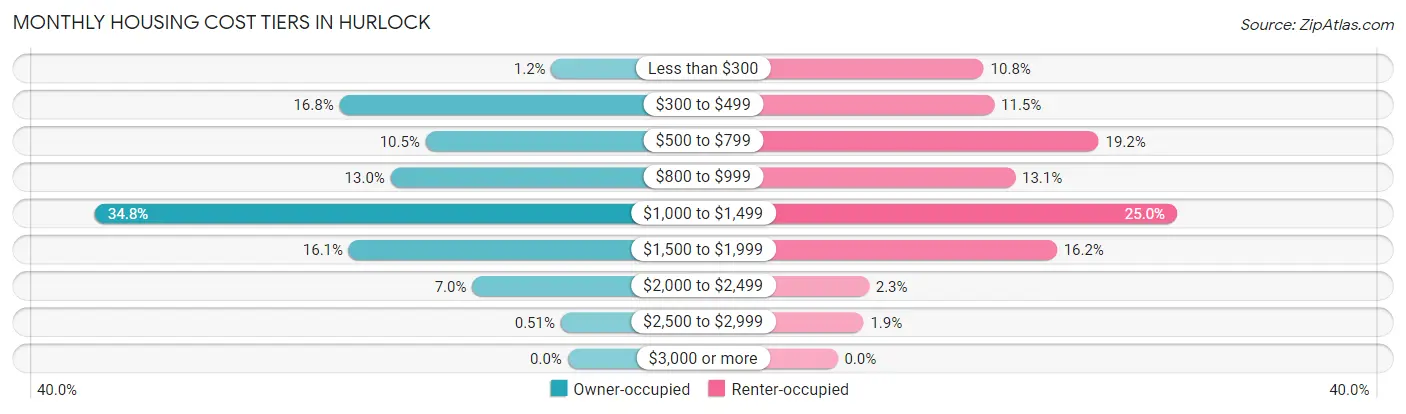
| Monthly Cost | Owner-occupied | Renter-occupied |
| Less than $300 | 7 (1.2%) | 28 (10.8%) |
| $300 to $499 | 98 (16.8%) | 30 (11.5%) |
| $500 to $799 | 61 (10.5%) | 50 (19.2%) |
| $800 to $999 | 76 (13.0%) | 34 (13.1%) |
| $1,000 to $1,499 | 203 (34.8%) | 65 (25.0%) |
| $1,500 to $1,999 | 94 (16.1%) | 42 (16.2%) |
| $2,000 to $2,499 | 41 (7.0%) | 6 (2.3%) |
| $2,500 to $2,999 | 3 (0.5%) | 5 (1.9%) |
| $3,000 or more | 0 (0.0%) | 0 (0.0%) |
| Total | 583 (100.0%) | 260 (100.0%) |
Physical Housing Characteristics in Hurlock
Housing Structures in Hurlock
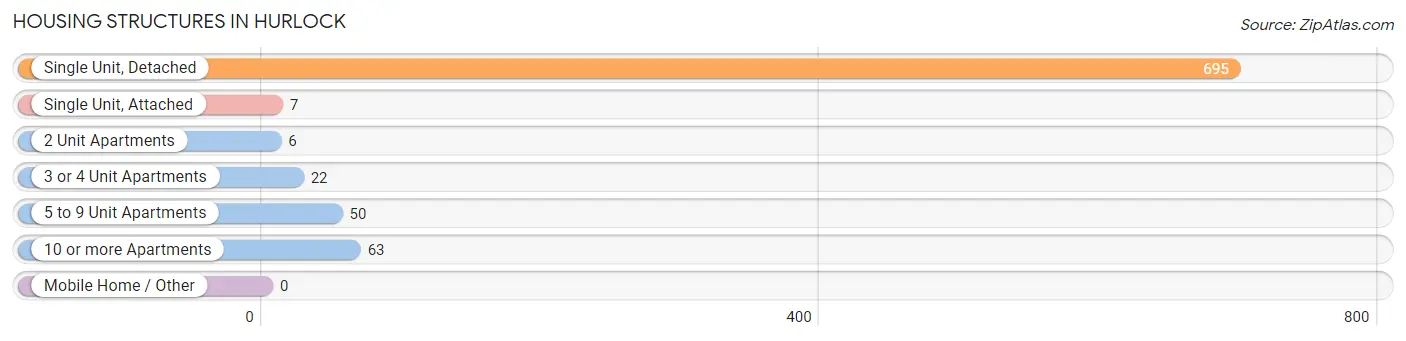
| Structure Type | # Housing Units | % Housing Units |
| Single Unit, Detached | 695 | 82.4% |
| Single Unit, Attached | 7 | 0.8% |
| 2 Unit Apartments | 6 | 0.7% |
| 3 or 4 Unit Apartments | 22 | 2.6% |
| 5 to 9 Unit Apartments | 50 | 5.9% |
| 10 or more Apartments | 63 | 7.5% |
| Mobile Home / Other | 0 | 0.0% |
| Total | 843 | 100.0% |
Housing Structures by Occupancy in Hurlock
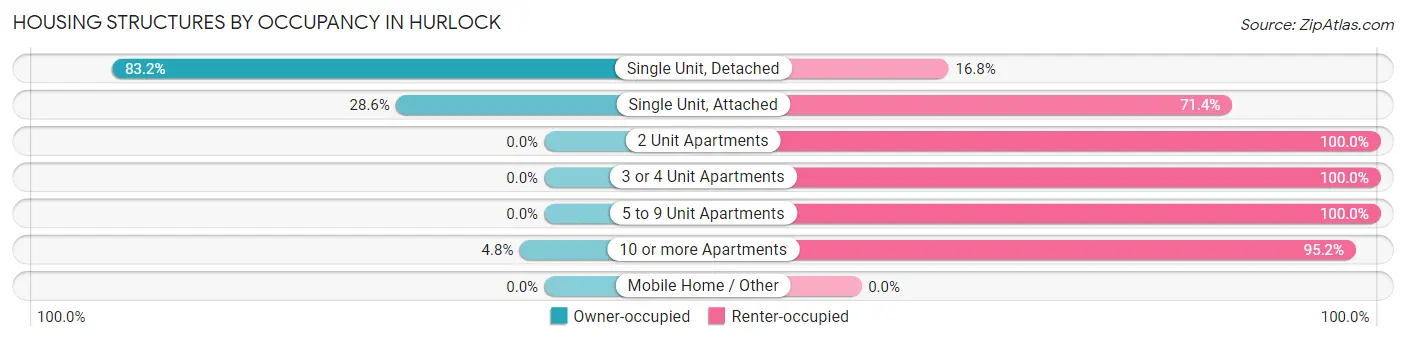
| Structure Type | Owner-occupied | Renter-occupied |
| Single Unit, Detached | 578 (83.2%) | 117 (16.8%) |
| Single Unit, Attached | 2 (28.6%) | 5 (71.4%) |
| 2 Unit Apartments | 0 (0.0%) | 6 (100.0%) |
| 3 or 4 Unit Apartments | 0 (0.0%) | 22 (100.0%) |
| 5 to 9 Unit Apartments | 0 (0.0%) | 50 (100.0%) |
| 10 or more Apartments | 3 (4.8%) | 60 (95.2%) |
| Mobile Home / Other | 0 (0.0%) | 0 (0.0%) |
| Total | 583 (69.2%) | 260 (30.8%) |
Housing Structures by Number of Rooms in Hurlock
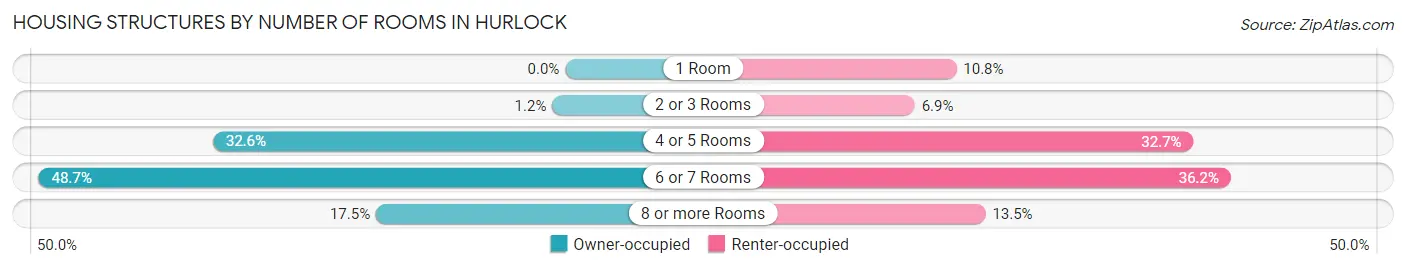
| Number of Rooms | Owner-occupied | Renter-occupied |
| 1 Room | 0 (0.0%) | 28 (10.8%) |
| 2 or 3 Rooms | 7 (1.2%) | 18 (6.9%) |
| 4 or 5 Rooms | 190 (32.6%) | 85 (32.7%) |
| 6 or 7 Rooms | 284 (48.7%) | 94 (36.1%) |
| 8 or more Rooms | 102 (17.5%) | 35 (13.5%) |
| Total | 583 (100.0%) | 260 (100.0%) |
Housing Structure by Heating Type in Hurlock
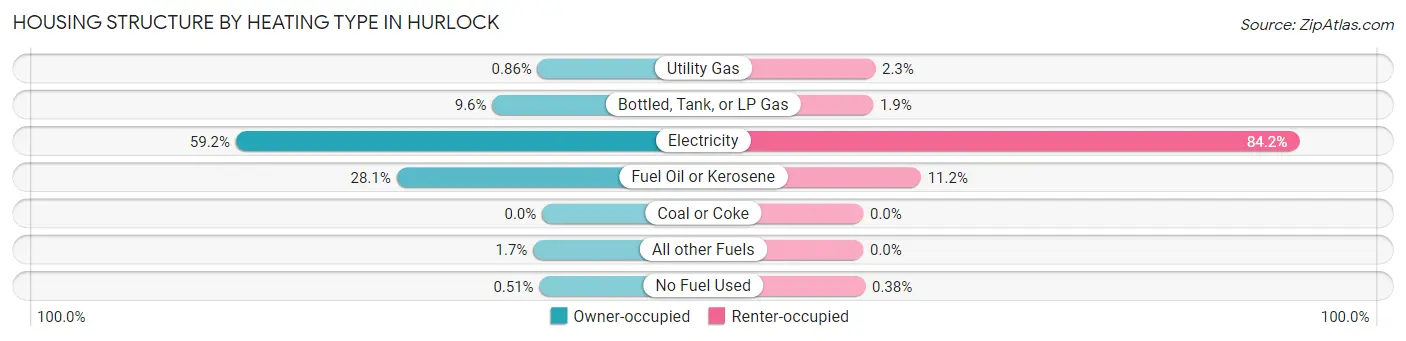
| Heating Type | Owner-occupied | Renter-occupied |
| Utility Gas | 5 (0.9%) | 6 (2.3%) |
| Bottled, Tank, or LP Gas | 56 (9.6%) | 5 (1.9%) |
| Electricity | 345 (59.2%) | 219 (84.2%) |
| Fuel Oil or Kerosene | 164 (28.1%) | 29 (11.2%) |
| Coal or Coke | 0 (0.0%) | 0 (0.0%) |
| All other Fuels | 10 (1.7%) | 0 (0.0%) |
| No Fuel Used | 3 (0.5%) | 1 (0.4%) |
| Total | 583 (100.0%) | 260 (100.0%) |
Household Vehicle Usage in Hurlock
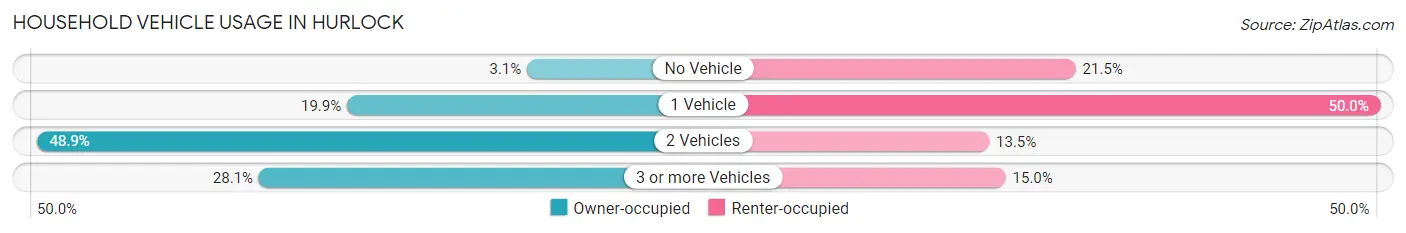
| Vehicles per Household | Owner-occupied | Renter-occupied |
| No Vehicle | 18 (3.1%) | 56 (21.5%) |
| 1 Vehicle | 116 (19.9%) | 130 (50.0%) |
| 2 Vehicles | 285 (48.9%) | 35 (13.5%) |
| 3 or more Vehicles | 164 (28.1%) | 39 (15.0%) |
| Total | 583 (100.0%) | 260 (100.0%) |
Real Estate & Mortgages in Hurlock
Real Estate and Mortgage Overview in Hurlock
| Characteristic | Without Mortgage | With Mortgage |
| Housing Units | 192 | 391 |
| Median Property Value | $155,000 | $163,800 |
| Median Household Income | $44,167 | $47 |
| Monthly Housing Costs | $494 | $0 |
| Real Estate Taxes | $2,215 | $12 |
Property Value by Mortgage Status in Hurlock
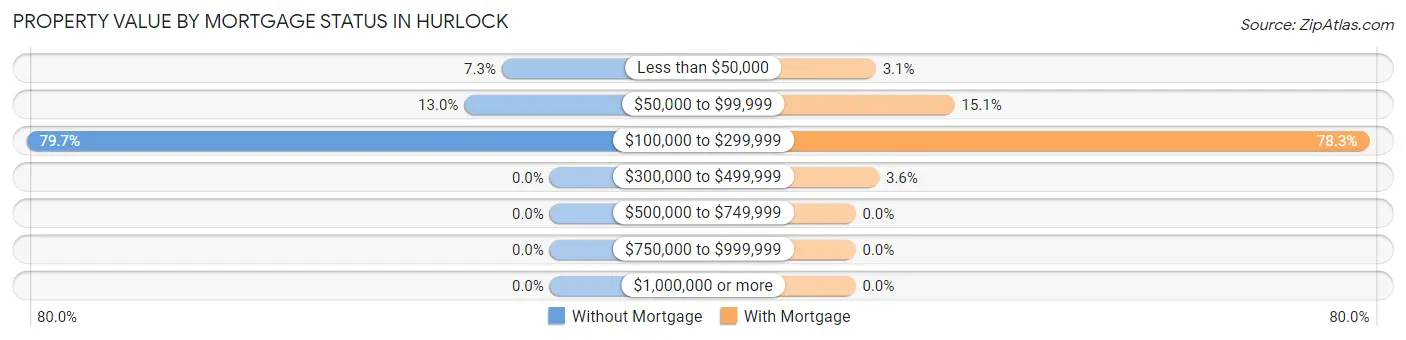
| Property Value | Without Mortgage | With Mortgage |
| Less than $50,000 | 14 (7.3%) | 12 (3.1%) |
| $50,000 to $99,999 | 25 (13.0%) | 59 (15.1%) |
| $100,000 to $299,999 | 153 (79.7%) | 306 (78.3%) |
| $300,000 to $499,999 | 0 (0.0%) | 14 (3.6%) |
| $500,000 to $749,999 | 0 (0.0%) | 0 (0.0%) |
| $750,000 to $999,999 | 0 (0.0%) | 0 (0.0%) |
| $1,000,000 or more | 0 (0.0%) | 0 (0.0%) |
| Total | 192 (100.0%) | 391 (100.0%) |
Household Income by Mortgage Status in Hurlock
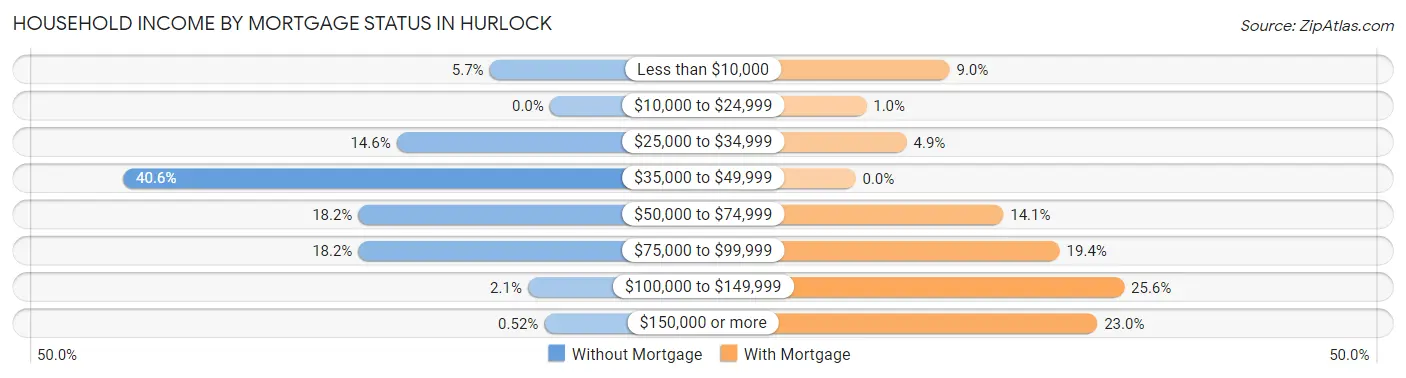
| Household Income | Without Mortgage | With Mortgage |
| Less than $10,000 | 11 (5.7%) | 35 (8.9%) |
| $10,000 to $24,999 | 0 (0.0%) | 4 (1.0%) |
| $25,000 to $34,999 | 28 (14.6%) | 19 (4.9%) |
| $35,000 to $49,999 | 78 (40.6%) | 0 (0.0%) |
| $50,000 to $74,999 | 35 (18.2%) | 55 (14.1%) |
| $75,000 to $99,999 | 35 (18.2%) | 76 (19.4%) |
| $100,000 to $149,999 | 4 (2.1%) | 100 (25.6%) |
| $150,000 or more | 1 (0.5%) | 90 (23.0%) |
| Total | 192 (100.0%) | 391 (100.0%) |
Property Value to Household Income Ratio in Hurlock
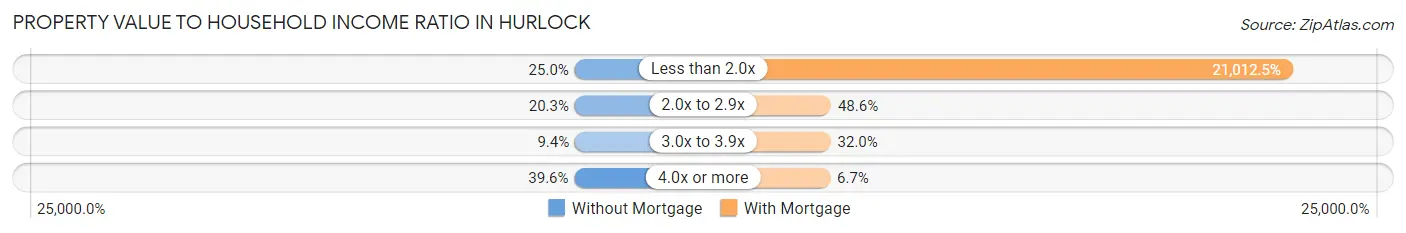
| Value-to-Income Ratio | Without Mortgage | With Mortgage |
| Less than 2.0x | 48 (25.0%) | 82,159 (21,012.5%) |
| 2.0x to 2.9x | 39 (20.3%) | 190 (48.6%) |
| 3.0x to 3.9x | 18 (9.4%) | 125 (32.0%) |
| 4.0x or more | 76 (39.6%) | 26 (6.7%) |
| Total | 192 (100.0%) | 391 (100.0%) |
Real Estate Taxes by Mortgage Status in Hurlock
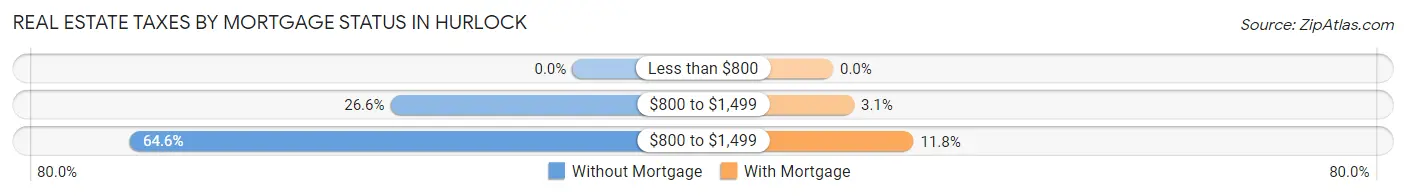
| Property Taxes | Without Mortgage | With Mortgage |
| Less than $800 | 0 (0.0%) | 0 (0.0%) |
| $800 to $1,499 | 51 (26.6%) | 12 (3.1%) |
| $800 to $1,499 | 124 (64.6%) | 46 (11.8%) |
| Total | 192 (100.0%) | 391 (100.0%) |
Health & Disability in Hurlock
Health Insurance Coverage by Age in Hurlock
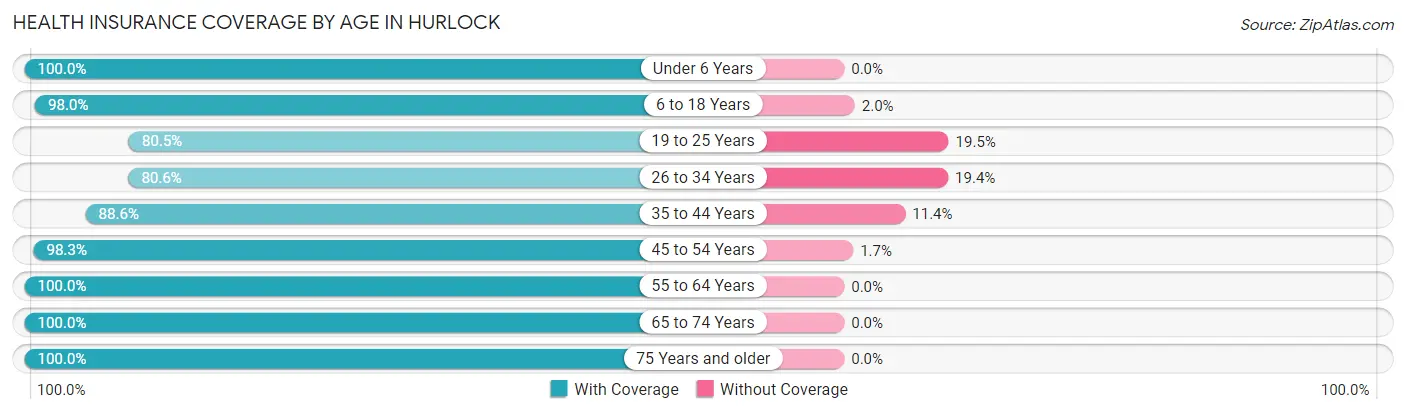
| Age Bracket | With Coverage | Without Coverage |
| Under 6 Years | 177 (100.0%) | 0 (0.0%) |
| 6 to 18 Years | 398 (98.0%) | 8 (2.0%) |
| 19 to 25 Years | 178 (80.5%) | 43 (19.5%) |
| 26 to 34 Years | 154 (80.6%) | 37 (19.4%) |
| 35 to 44 Years | 249 (88.6%) | 32 (11.4%) |
| 45 to 54 Years | 236 (98.3%) | 4 (1.7%) |
| 55 to 64 Years | 251 (100.0%) | 0 (0.0%) |
| 65 to 74 Years | 330 (100.0%) | 0 (0.0%) |
| 75 Years and older | 181 (100.0%) | 0 (0.0%) |
| Total | 2,154 (94.6%) | 124 (5.4%) |
Health Insurance Coverage by Citizenship Status in Hurlock
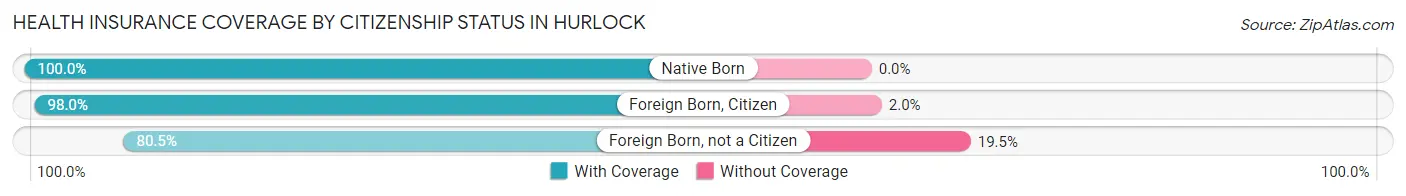
| Citizenship Status | With Coverage | Without Coverage |
| Native Born | 177 (100.0%) | 0 (0.0%) |
| Foreign Born, Citizen | 398 (98.0%) | 8 (2.0%) |
| Foreign Born, not a Citizen | 178 (80.5%) | 43 (19.5%) |
Health Insurance Coverage by Household Income in Hurlock
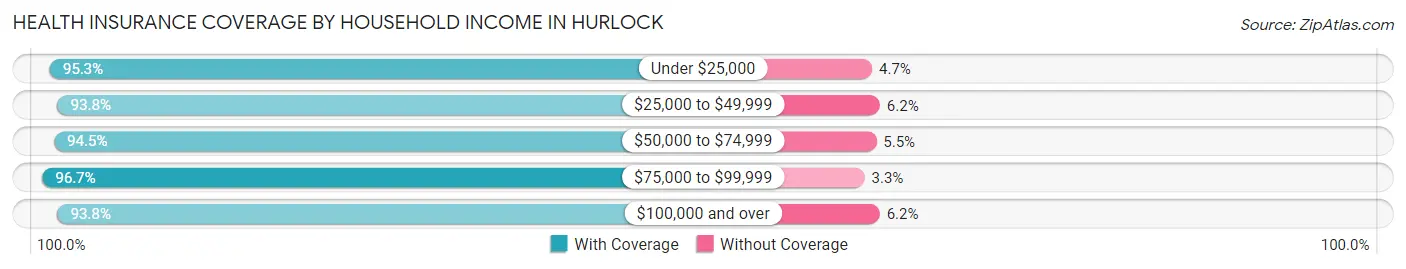
| Household Income | With Coverage | Without Coverage |
| Under $25,000 | 221 (95.3%) | 11 (4.7%) |
| $25,000 to $49,999 | 454 (93.8%) | 30 (6.2%) |
| $50,000 to $74,999 | 290 (94.5%) | 17 (5.5%) |
| $75,000 to $99,999 | 319 (96.7%) | 11 (3.3%) |
| $100,000 and over | 836 (93.8%) | 55 (6.2%) |
Public vs Private Health Insurance Coverage by Age in Hurlock
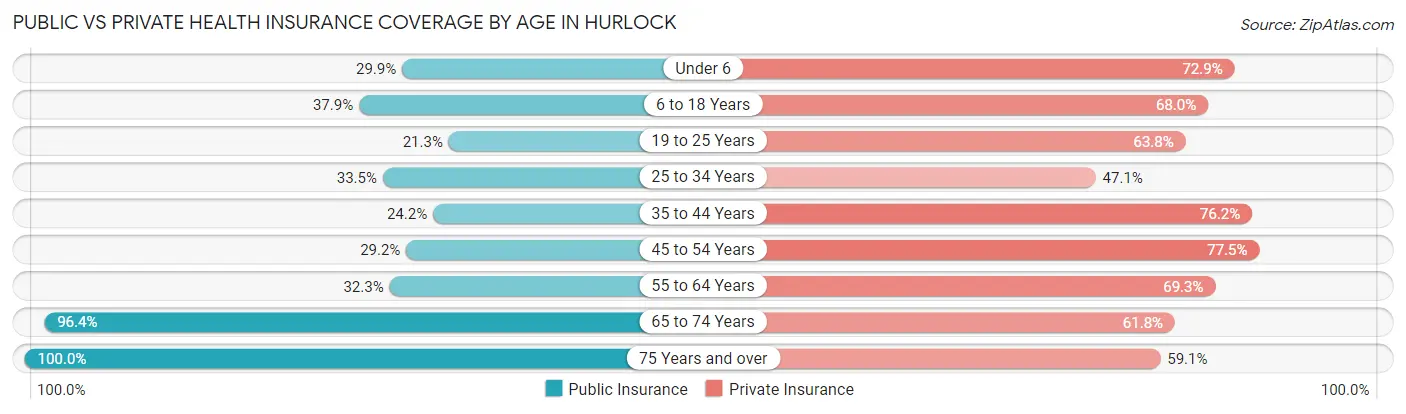
| Age Bracket | Public Insurance | Private Insurance |
| Under 6 | 53 (29.9%) | 129 (72.9%) |
| 6 to 18 Years | 154 (37.9%) | 276 (68.0%) |
| 19 to 25 Years | 47 (21.3%) | 141 (63.8%) |
| 25 to 34 Years | 64 (33.5%) | 90 (47.1%) |
| 35 to 44 Years | 68 (24.2%) | 214 (76.2%) |
| 45 to 54 Years | 70 (29.2%) | 186 (77.5%) |
| 55 to 64 Years | 81 (32.3%) | 174 (69.3%) |
| 65 to 74 Years | 318 (96.4%) | 204 (61.8%) |
| 75 Years and over | 181 (100.0%) | 107 (59.1%) |
| Total | 1,036 (45.5%) | 1,521 (66.8%) |
Disability Status by Sex by Age in Hurlock
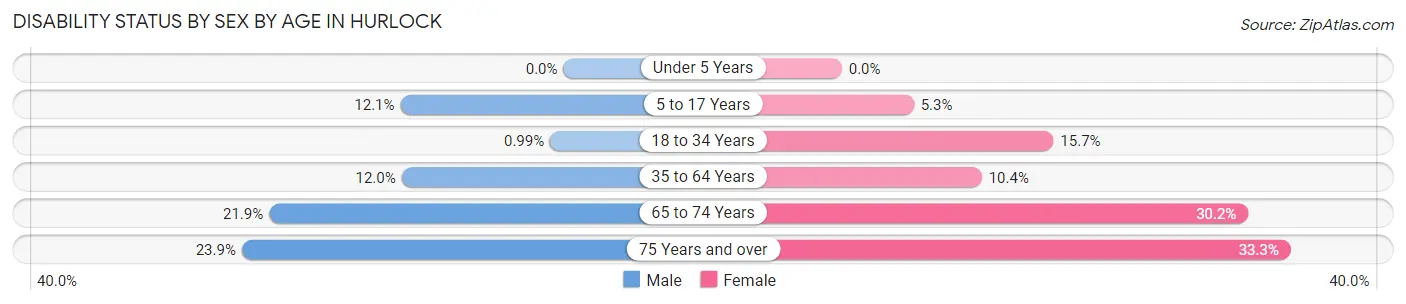
| Age Bracket | Male | Female |
| Under 5 Years | 0 (0.0%) | 0 (0.0%) |
| 5 to 17 Years | 19 (12.1%) | 11 (5.3%) |
| 18 to 34 Years | 2 (1.0%) | 41 (15.7%) |
| 35 to 64 Years | 43 (12.0%) | 43 (10.4%) |
| 65 to 74 Years | 33 (21.8%) | 54 (30.2%) |
| 75 Years and over | 16 (23.9%) | 38 (33.3%) |
Disability Class by Sex by Age in Hurlock
Disability Class: Hearing Difficulty
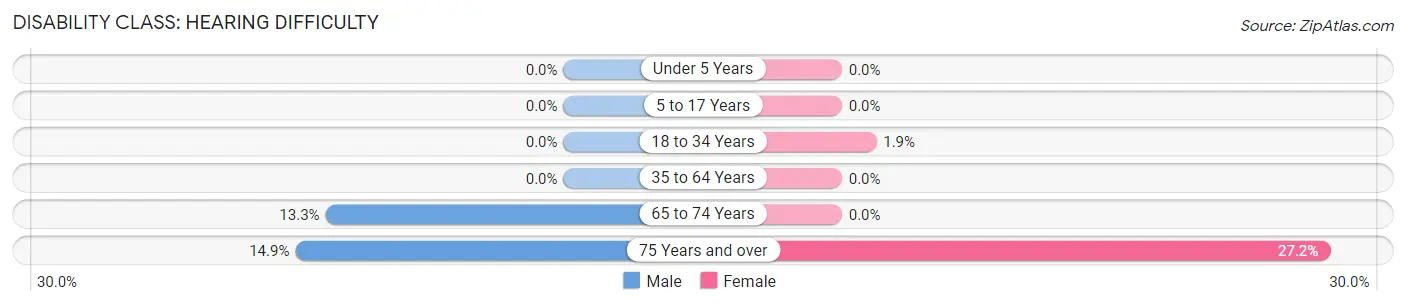
| Age Bracket | Male | Female |
| Under 5 Years | 0 (0.0%) | 0 (0.0%) |
| 5 to 17 Years | 0 (0.0%) | 0 (0.0%) |
| 18 to 34 Years | 0 (0.0%) | 5 (1.9%) |
| 35 to 64 Years | 0 (0.0%) | 0 (0.0%) |
| 65 to 74 Years | 20 (13.3%) | 0 (0.0%) |
| 75 Years and over | 10 (14.9%) | 31 (27.2%) |
Disability Class: Vision Difficulty
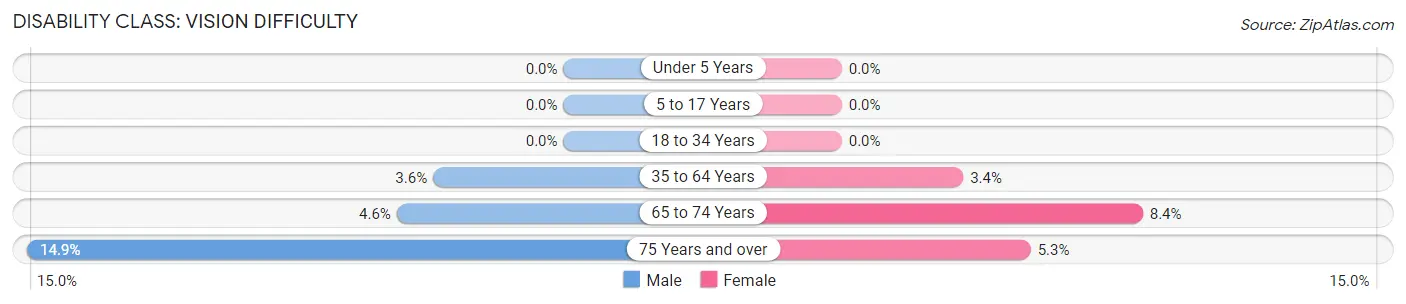
| Age Bracket | Male | Female |
| Under 5 Years | 0 (0.0%) | 0 (0.0%) |
| 5 to 17 Years | 0 (0.0%) | 0 (0.0%) |
| 18 to 34 Years | 0 (0.0%) | 0 (0.0%) |
| 35 to 64 Years | 13 (3.6%) | 14 (3.4%) |
| 65 to 74 Years | 7 (4.6%) | 15 (8.4%) |
| 75 Years and over | 10 (14.9%) | 6 (5.3%) |
Disability Class: Cognitive Difficulty
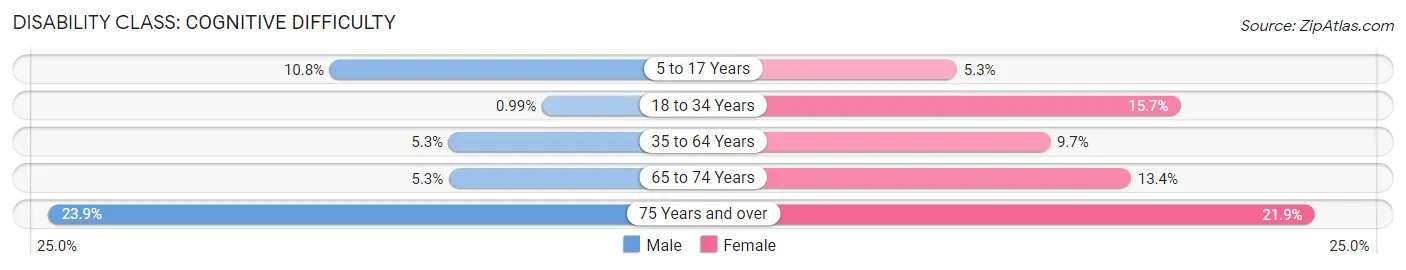
| Age Bracket | Male | Female |
| 5 to 17 Years | 17 (10.8%) | 11 (5.3%) |
| 18 to 34 Years | 2 (1.0%) | 41 (15.7%) |
| 35 to 64 Years | 19 (5.3%) | 40 (9.7%) |
| 65 to 74 Years | 8 (5.3%) | 24 (13.4%) |
| 75 Years and over | 16 (23.9%) | 25 (21.9%) |
Disability Class: Ambulatory Difficulty
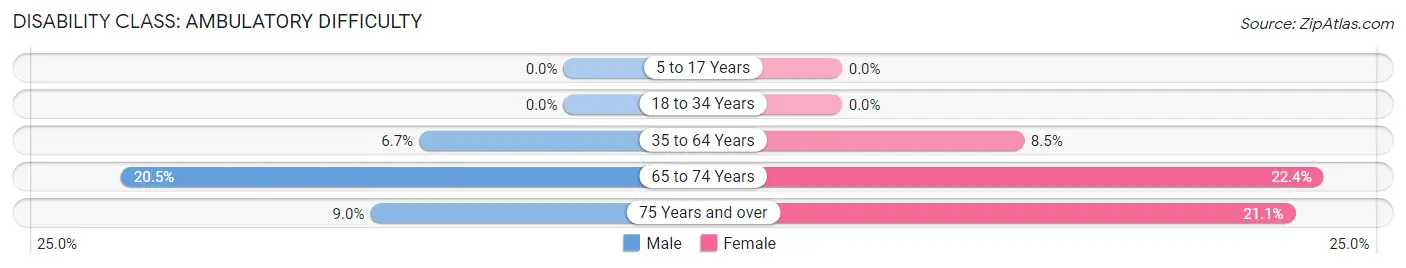
| Age Bracket | Male | Female |
| 5 to 17 Years | 0 (0.0%) | 0 (0.0%) |
| 18 to 34 Years | 0 (0.0%) | 0 (0.0%) |
| 35 to 64 Years | 24 (6.7%) | 35 (8.5%) |
| 65 to 74 Years | 31 (20.5%) | 40 (22.4%) |
| 75 Years and over | 6 (9.0%) | 24 (21.0%) |
Disability Class: Self-Care Difficulty
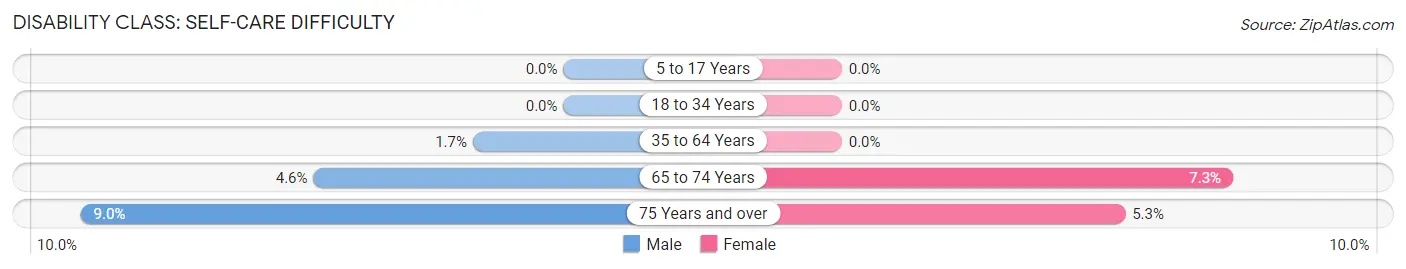
| Age Bracket | Male | Female |
| 5 to 17 Years | 0 (0.0%) | 0 (0.0%) |
| 18 to 34 Years | 0 (0.0%) | 0 (0.0%) |
| 35 to 64 Years | 6 (1.7%) | 0 (0.0%) |
| 65 to 74 Years | 7 (4.6%) | 13 (7.3%) |
| 75 Years and over | 6 (9.0%) | 6 (5.3%) |
Technology Access in Hurlock
Computing Device Access in Hurlock
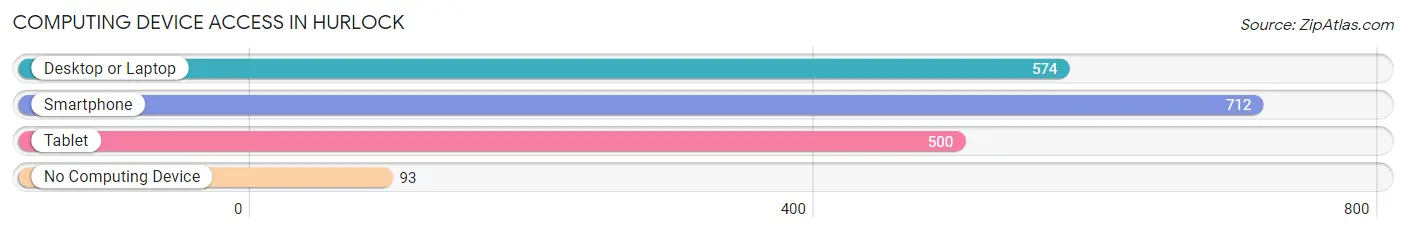
| Device Type | # Households | % Households |
| Desktop or Laptop | 574 | 68.1% |
| Smartphone | 712 | 84.5% |
| Tablet | 500 | 59.3% |
| No Computing Device | 93 | 11.0% |
| Total | 843 | 100.0% |
Internet Access in Hurlock
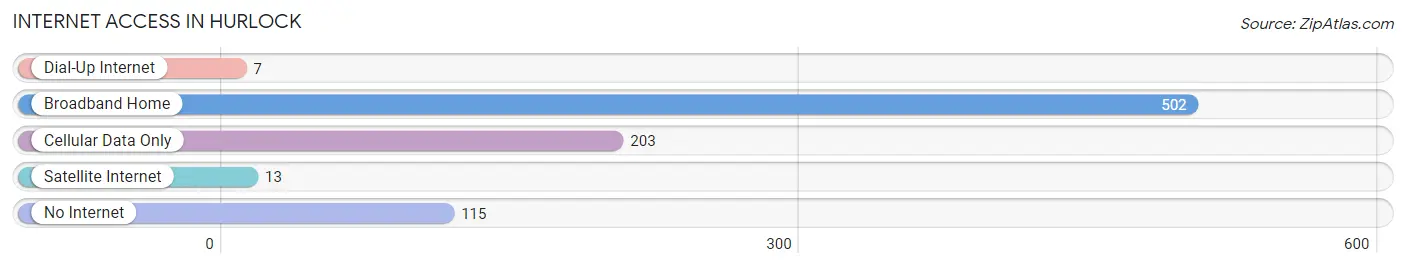
| Internet Type | # Households | % Households |
| Dial-Up Internet | 7 | 0.8% |
| Broadband Home | 502 | 59.6% |
| Cellular Data Only | 203 | 24.1% |
| Satellite Internet | 13 | 1.5% |
| No Internet | 115 | 13.6% |
| Total | 843 | 100.0% |
Hurlock Summary
Hurlock, Maryland is a small town located in Dorchester County on the Eastern Shore of Maryland. The town is situated on the Choptank River, about 25 miles south of Cambridge. The population of Hurlock was 1,541 at the 2010 census.
History
Hurlock was founded in 1867 by William Hurlock, a local farmer. The town was originally known as Hurlock’s Crossroads, and was a small farming community. In 1873, the town was incorporated as Hurlock. The town was named after William Hurlock, who was a prominent local farmer and businessman.
In the late 19th century, Hurlock was a thriving agricultural center. The town was home to several large farms, and the local economy was largely based on the production of tobacco, corn, and other crops. The town also had a number of small businesses, including a general store, a blacksmith shop, and a post office.
In the early 20th century, Hurlock began to experience a decline in its agricultural economy. The town’s population began to decline, and many of the local businesses closed. In the 1950s, the town was revitalized by the construction of a new highway, which connected Hurlock to nearby towns and cities.
Geography
Hurlock is located in Dorchester County, on the Eastern Shore of Maryland. The town is situated on the Choptank River, about 25 miles south of Cambridge. The town is bordered by the towns of East New Market to the north, Vienna to the east, and Secretary to the south.
The town has a total area of 1.2 square miles, all of which is land. The town is located in a rural area, and is surrounded by farmland and woodlands. The town is located in a humid subtropical climate zone, and experiences hot, humid summers and mild winters.
Economy
The economy of Hurlock is largely based on agriculture. The town is home to several large farms, which produce a variety of crops, including corn, soybeans, and tobacco. The town also has a number of small businesses, including a general store, a hardware store, and a post office.
The town is also home to a number of manufacturing companies, including a furniture factory and a plastics factory. The town is also home to a number of restaurants and other businesses.
Demographics
As of the 2010 census, the population of Hurlock was 1,541. The town has a population density of 1,269 people per square mile. The racial makeup of the town is 87.3% White, 8.7% African American, 0.7% Native American, 0.3% Asian, and 2.9% from other races.
The median household income in Hurlock is $41,250, and the median family income is $50,000. The town has a poverty rate of 16.3%. The town has a high school graduation rate of 87.3%. The town has a population of 1,541, and the median age is 41.7 years.
Common Questions
What is Per Capita Income in Hurlock?
Per Capita income in Hurlock is $28,473.
What is the Median Family Income in Hurlock?
Median Family Income in Hurlock is $78,750.
What is the Median Household income in Hurlock?
Median Household Income in Hurlock is $57,313.
What is Income or Wage Gap in Hurlock?
Income or Wage Gap in Hurlock is 12.4%.
Women in Hurlock earn 87.6 cents for every dollar earned by a man.
What is Inequality or Gini Index in Hurlock?
Inequality or Gini Index in Hurlock is 0.38.
What is the Total Population of Hurlock?
Total Population of Hurlock is 2,284.
What is the Total Male Population of Hurlock?
Total Male Population of Hurlock is 982.
What is the Total Female Population of Hurlock?
Total Female Population of Hurlock is 1,302.
What is the Ratio of Males per 100 Females in Hurlock?
There are 75.42 Males per 100 Females in Hurlock.
What is the Ratio of Females per 100 Males in Hurlock?
There are 132.59 Females per 100 Males in Hurlock.
What is the Median Population Age in Hurlock?
Median Population Age in Hurlock is 39.2 Years.
What is the Average Family Size in Hurlock
Average Family Size in Hurlock is 3.2 People.
What is the Average Household Size in Hurlock
Average Household Size in Hurlock is 2.7 People.
How Large is the Labor Force in Hurlock?
There are 1,084 People in the Labor Forcein in Hurlock.
What is the Percentage of People in the Labor Force in Hurlock?
60.1% of People are in the Labor Force in Hurlock.
What is the Unemployment Rate in Hurlock?
Unemployment Rate in Hurlock is 6.5%.