Midland, MD Map & Demographics
Midland Map
Midland Overview
$23,008
PER CAPITA INCOME
$60,139
AVG FAMILY INCOME
$60,195
AVG HOUSEHOLD INCOME
49.3%
WAGE / INCOME GAP [ % ]
50.7¢/ $1
WAGE / INCOME GAP [ $ ]
0.41
INEQUALITY / GINI INDEX
699
TOTAL POPULATION
383
MALE POPULATION
316
FEMALE POPULATION
121.20
MALES / 100 FEMALES
82.51
FEMALES / 100 MALES
25.6
MEDIAN AGE
3.1
AVG FAMILY SIZE
2.9
AVG HOUSEHOLD SIZE
317
LABOR FORCE [ PEOPLE ]
69.1%
PERCENT IN LABOR FORCE
8.5%
UNEMPLOYMENT RATE
Midland Zip Codes
Midland Area Codes
Income in Midland
Income Overview in Midland
Per Capita Income in Midland is $23,008, while median incomes of families and households are $60,139 and $60,195 respectively.
| Characteristic | Number | Measure |
| Per Capita Income | 699 | $23,008 |
| Median Family Income | 199 | $60,139 |
| Mean Family Income | 199 | $70,211 |
| Median Household Income | 241 | $60,195 |
| Mean Household Income | 241 | $67,601 |
| Income Deficit | 199 | $0 |
| Wage / Income Gap (%) | 699 | 49.26% |
| Wage / Income Gap ($) | 699 | 50.74¢ per $1 |
| Gini / Inequality Index | 699 | 0.41 |
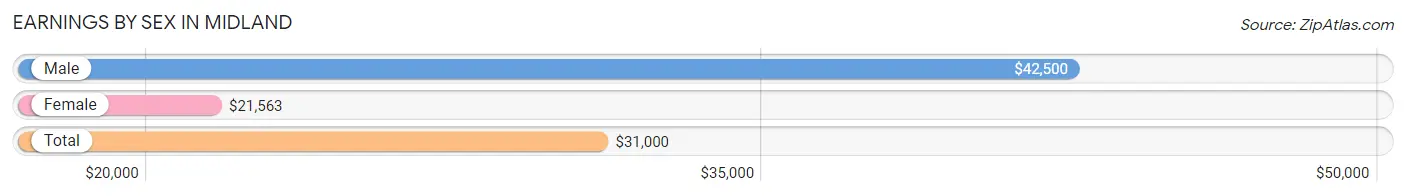
Earnings by Sex in Midland
Average Earnings in Midland are $31,000, $42,500 for men and $21,563 for women, a difference of 49.3%.
| Sex | Number | Average Earnings |
| Male | 168 (52.2%) | $42,500 |
| Female | 154 (47.8%) | $21,563 |
| Total | 322 (100.0%) | $31,000 |
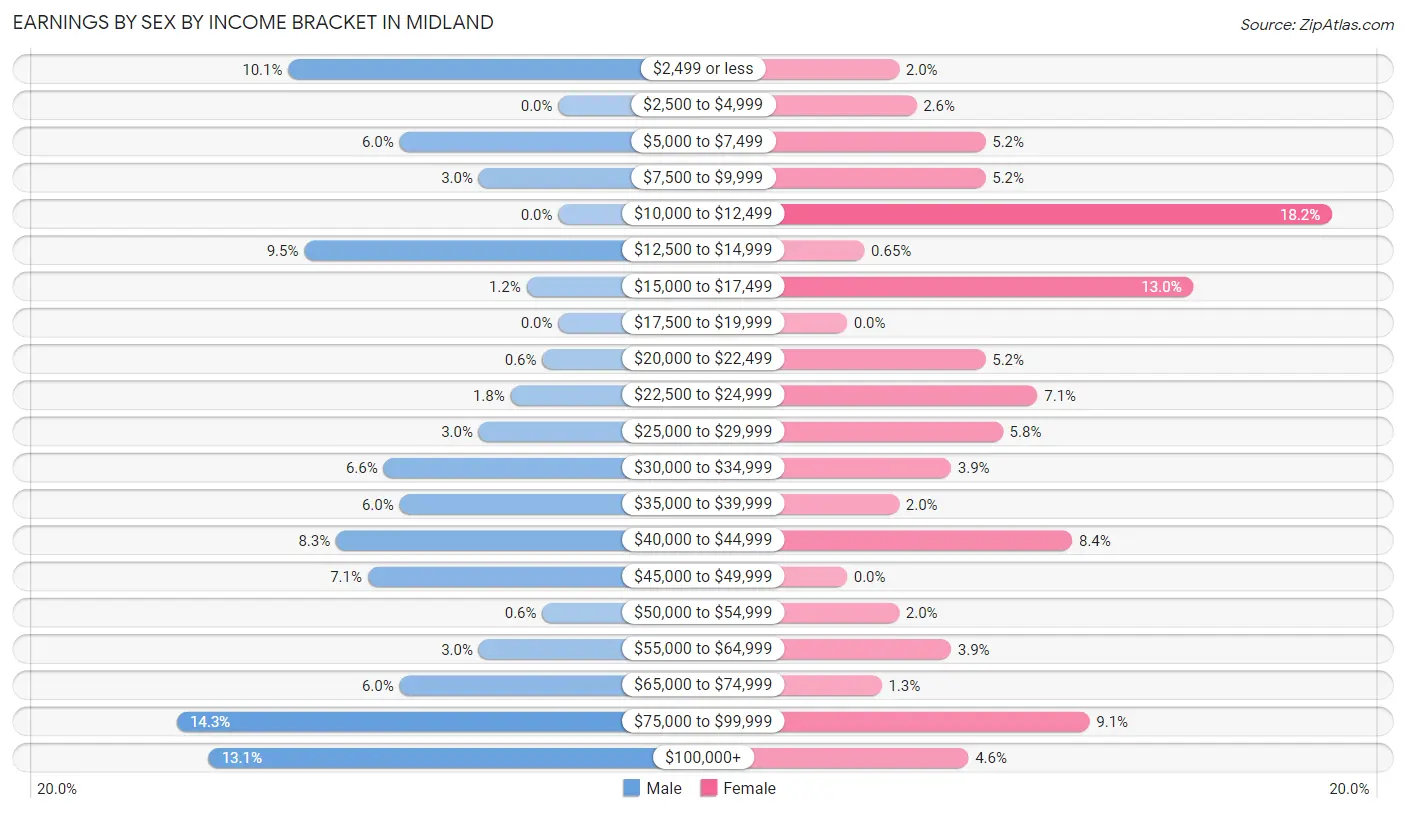
Earnings by Sex by Income Bracket in Midland
The most common earnings brackets in Midland are $75,000 to $99,999 for men (24 | 14.3%) and $10,000 to $12,499 for women (28 | 18.2%).
| Income | Male | Female |
| $2,499 or less | 17 (10.1%) | 3 (1.9%) |
| $2,500 to $4,999 | 0 (0.0%) | 4 (2.6%) |
| $5,000 to $7,499 | 10 (5.9%) | 8 (5.2%) |
| $7,500 to $9,999 | 5 (3.0%) | 8 (5.2%) |
| $10,000 to $12,499 | 0 (0.0%) | 28 (18.2%) |
| $12,500 to $14,999 | 16 (9.5%) | 1 (0.6%) |
| $15,000 to $17,499 | 2 (1.2%) | 20 (13.0%) |
| $17,500 to $19,999 | 0 (0.0%) | 0 (0.0%) |
| $20,000 to $22,499 | 1 (0.6%) | 8 (5.2%) |
| $22,500 to $24,999 | 3 (1.8%) | 11 (7.1%) |
| $25,000 to $29,999 | 5 (3.0%) | 9 (5.8%) |
| $30,000 to $34,999 | 11 (6.6%) | 6 (3.9%) |
| $35,000 to $39,999 | 10 (5.9%) | 3 (1.9%) |
| $40,000 to $44,999 | 14 (8.3%) | 13 (8.4%) |
| $45,000 to $49,999 | 12 (7.1%) | 0 (0.0%) |
| $50,000 to $54,999 | 1 (0.6%) | 3 (1.9%) |
| $55,000 to $64,999 | 5 (3.0%) | 6 (3.9%) |
| $65,000 to $74,999 | 10 (5.9%) | 2 (1.3%) |
| $75,000 to $99,999 | 24 (14.3%) | 14 (9.1%) |
| $100,000+ | 22 (13.1%) | 7 (4.5%) |
| Total | 168 (100.0%) | 154 (100.0%) |
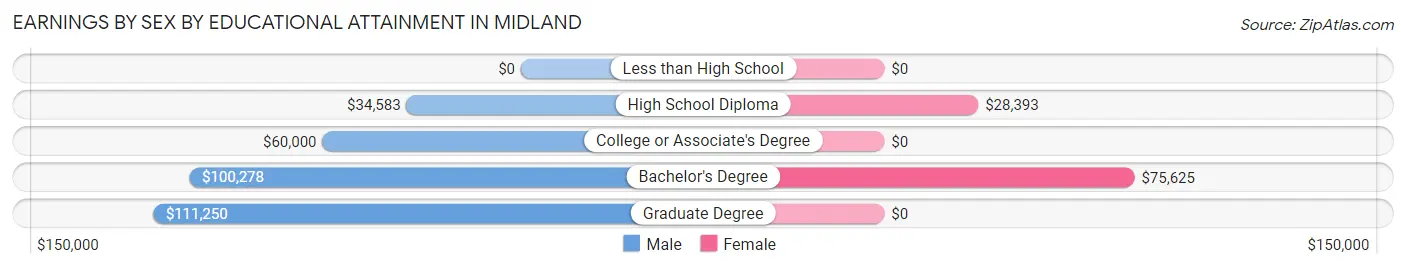
Earnings by Sex by Educational Attainment in Midland
Average earnings in Midland are $48,333 for men and $26,250 for women, a difference of 45.7%. Men with an educational attainment of graduate degree enjoy the highest average annual earnings of $111,250, while those with high school diploma education earn the least with $34,583. Women with an educational attainment of bachelor's degree earn the most with the average annual earnings of $75,625, while those with high school diploma education have the smallest earnings of $28,393.
| Educational Attainment | Male Income | Female Income |
| Less than High School | - | - |
| High School Diploma | $34,583 | $28,393 |
| College or Associate's Degree | $60,000 | $0 |
| Bachelor's Degree | $100,278 | $75,625 |
| Graduate Degree | $111,250 | $0 |
| Total | $48,333 | $26,250 |
Family Income in Midland
Family Income Brackets in Midland
According to the Midland family income data, there are 46 families falling into the $50,000 to $74,999 income range, which is the most common income bracket and makes up 23.1% of all families. Conversely, the $10,000 to $14,999 income bracket is the least frequent group with only 8 families (4.0%) belonging to this category.
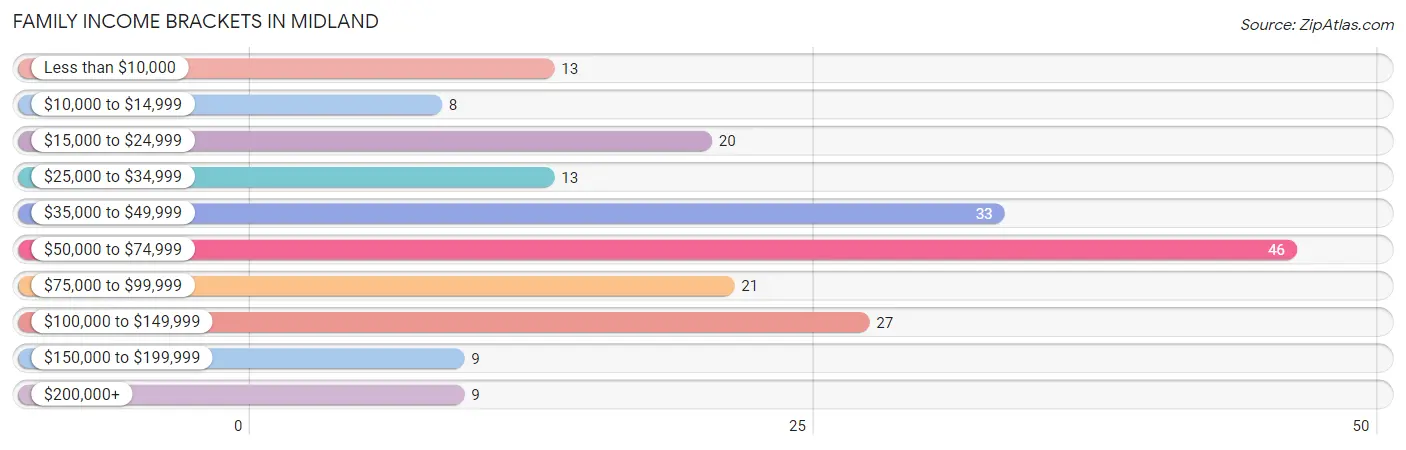
| Income Bracket | # Families | % Families |
| Less than $10,000 | 13 | 6.5% |
| $10,000 to $14,999 | 8 | 4.0% |
| $15,000 to $24,999 | 20 | 10.1% |
| $25,000 to $34,999 | 13 | 6.5% |
| $35,000 to $49,999 | 33 | 16.6% |
| $50,000 to $74,999 | 46 | 23.1% |
| $75,000 to $99,999 | 21 | 10.6% |
| $100,000 to $149,999 | 27 | 13.6% |
| $150,000 to $199,999 | 9 | 4.5% |
| $200,000+ | 9 | 4.5% |
Family Income by Famaliy Size in Midland
4-person families (44 | 22.1%) account for the highest median family income in Midland with $73,750 per family, while 2-person families (85 | 42.7%) have the highest median income of $30,718 per family member.
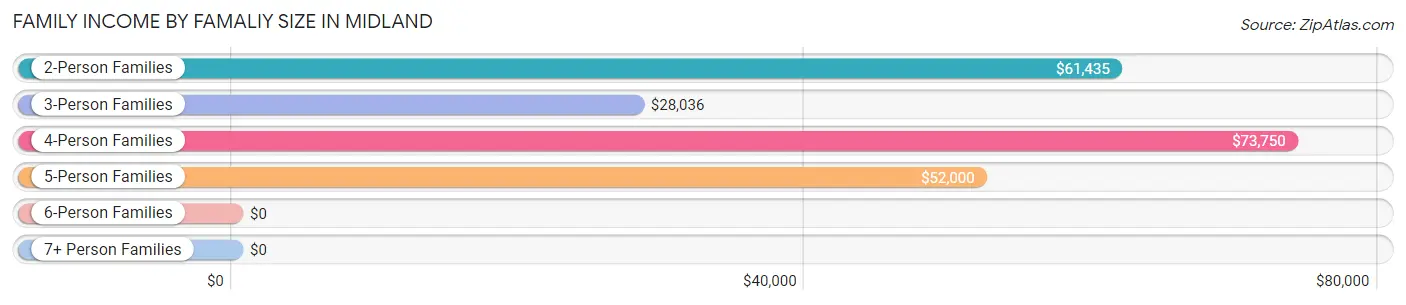
| Income Bracket | # Families | Median Income |
| 2-Person Families | 85 (42.7%) | $61,435 |
| 3-Person Families | 41 (20.6%) | $28,036 |
| 4-Person Families | 44 (22.1%) | $73,750 |
| 5-Person Families | 20 (10.1%) | $52,000 |
| 6-Person Families | 0 (0.0%) | $0 |
| 7+ Person Families | 9 (4.5%) | $0 |
| Total | 199 (100.0%) | $60,139 |
Family Income by Number of Earners in Midland
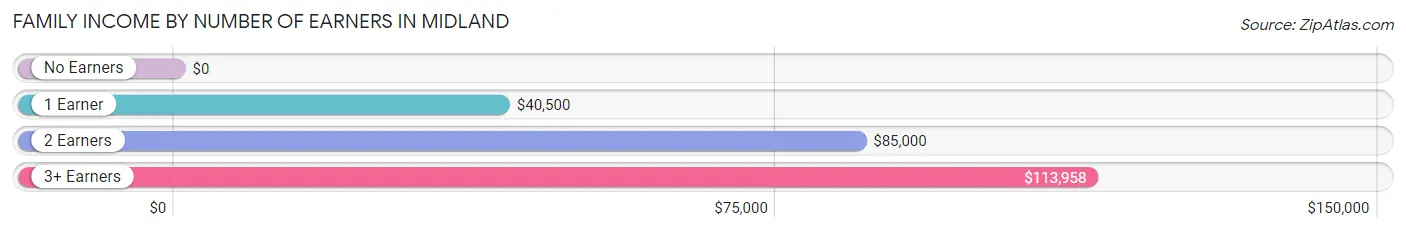
| Number of Earners | # Families | Median Income |
| No Earners | 4 (2.0%) | $0 |
| 1 Earner | 114 (57.3%) | $40,500 |
| 2 Earners | 68 (34.2%) | $85,000 |
| 3+ Earners | 13 (6.5%) | $113,958 |
| Total | 199 (100.0%) | $60,139 |
Household Income in Midland
Household Income Brackets in Midland
With 60 households falling in the category, the $50,000 to $74,999 income range is the most frequent in Midland, accounting for 24.9% of all households. In contrast, only 9 households (3.7%) fall into the $150,000 to $199,999 income bracket, making it the least populous group.
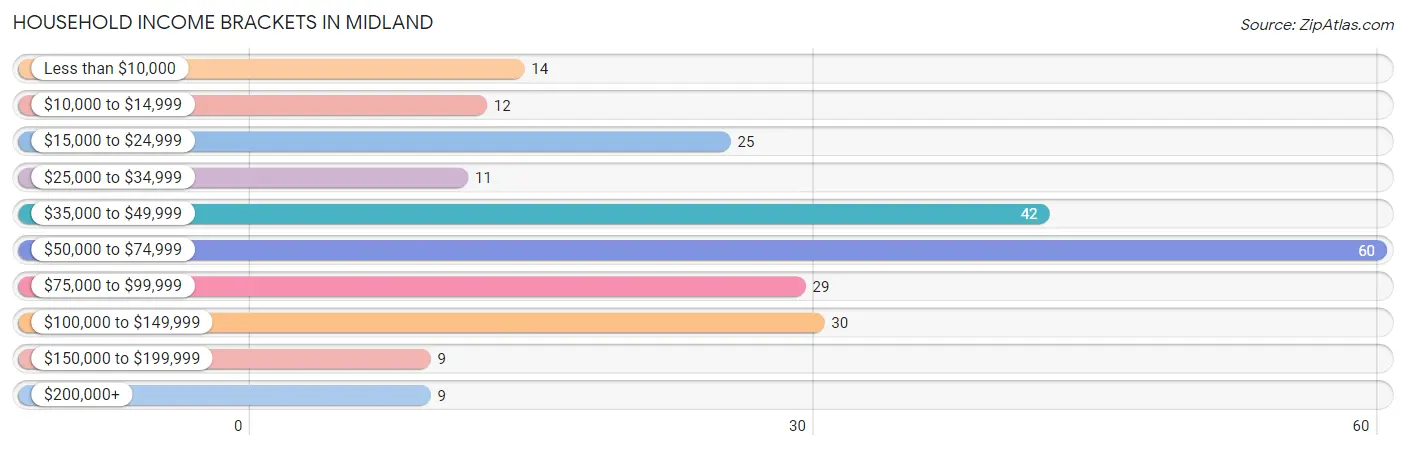
| Income Bracket | # Households | % Households |
| Less than $10,000 | 14 | 5.8% |
| $10,000 to $14,999 | 12 | 5.0% |
| $15,000 to $24,999 | 25 | 10.4% |
| $25,000 to $34,999 | 11 | 4.6% |
| $35,000 to $49,999 | 42 | 17.4% |
| $50,000 to $74,999 | 60 | 24.9% |
| $75,000 to $99,999 | 29 | 12.0% |
| $100,000 to $149,999 | 30 | 12.4% |
| $150,000 to $199,999 | 9 | 3.7% |
| $200,000+ | 9 | 3.7% |
Household Income by Householder Age in Midland
The median household income in Midland is $60,195, with the highest median household income of $102,083 found in the 45 to 64 years age bracket for the primary householder. A total of 57 households (23.6%) fall into this category. Meanwhile, the 15 to 24 years age bracket for the primary householder has the lowest median household income of $0, with 53 households (22.0%) in this group.
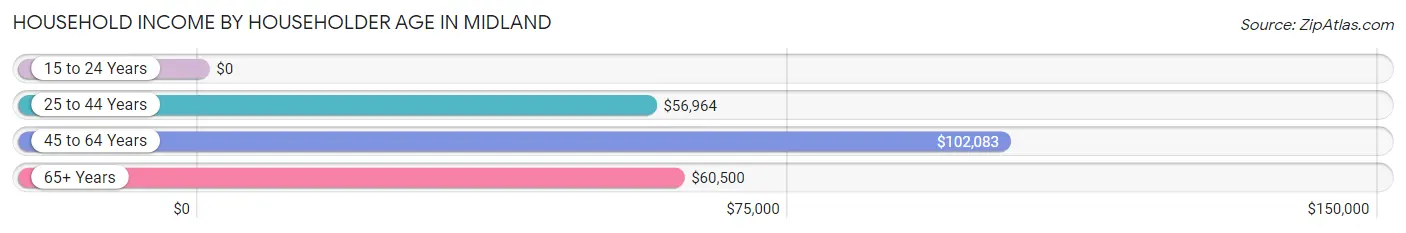
| Income Bracket | # Households | Median Income |
| 15 to 24 Years | 53 (22.0%) | $0 |
| 25 to 44 Years | 79 (32.8%) | $56,964 |
| 45 to 64 Years | 57 (23.6%) | $102,083 |
| 65+ Years | 52 (21.6%) | $60,500 |
| Total | 241 (100.0%) | $60,195 |
Poverty in Midland
Income Below Poverty by Sex and Age in Midland
With 18.0% poverty level for males and 19.3% for females among the residents of Midland, 15 year old males and 18 to 24 year old females are the most vulnerable to poverty, with 3 males (100.0%) and 21 females (53.8%) in their respective age groups living below the poverty level.
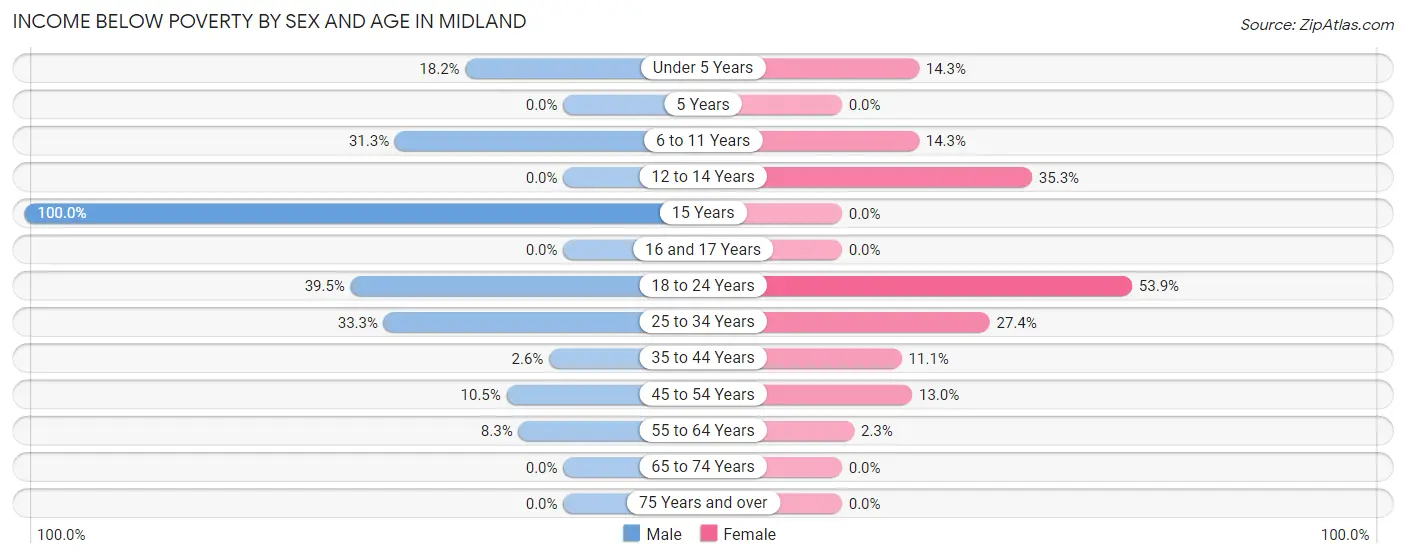
| Age Bracket | Male | Female |
| Under 5 Years | 12 (18.2%) | 6 (14.3%) |
| 5 Years | 0 (0.0%) | 0 (0.0%) |
| 6 to 11 Years | 15 (31.2%) | 4 (14.3%) |
| 12 to 14 Years | 0 (0.0%) | 6 (35.3%) |
| 15 Years | 3 (100.0%) | 0 (0.0%) |
| 16 and 17 Years | 0 (0.0%) | 0 (0.0%) |
| 18 to 24 Years | 15 (39.5%) | 21 (53.8%) |
| 25 to 34 Years | 19 (33.3%) | 17 (27.4%) |
| 35 to 44 Years | 1 (2.6%) | 3 (11.1%) |
| 45 to 54 Years | 2 (10.5%) | 3 (13.0%) |
| 55 to 64 Years | 2 (8.3%) | 1 (2.3%) |
| 65 to 74 Years | 0 (0.0%) | 0 (0.0%) |
| 75 Years and over | 0 (0.0%) | 0 (0.0%) |
| Total | 69 (18.0%) | 61 (19.3%) |
Income Above Poverty by Sex and Age in Midland
According to the poverty statistics in Midland, males aged 5 years and females aged 5 years are the age groups that are most secure financially, with 100.0% of males and 100.0% of females in these age groups living above the poverty line.
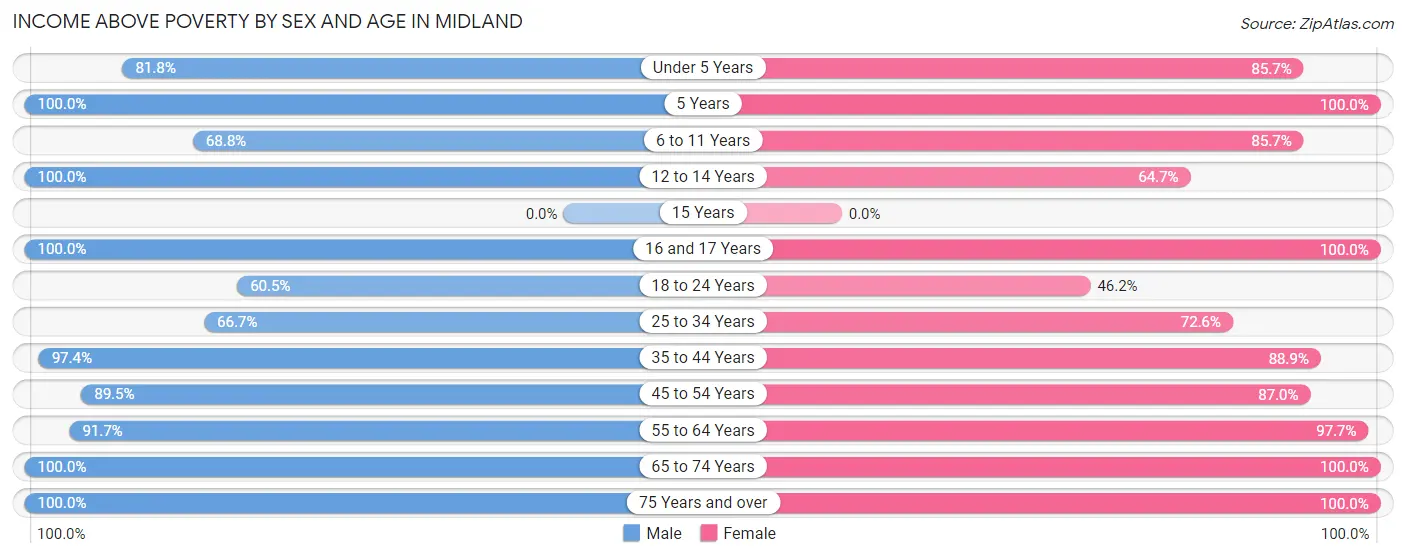
| Age Bracket | Male | Female |
| Under 5 Years | 54 (81.8%) | 36 (85.7%) |
| 5 Years | 10 (100.0%) | 2 (100.0%) |
| 6 to 11 Years | 33 (68.8%) | 24 (85.7%) |
| 12 to 14 Years | 24 (100.0%) | 11 (64.7%) |
| 15 Years | 0 (0.0%) | 0 (0.0%) |
| 16 and 17 Years | 16 (100.0%) | 4 (100.0%) |
| 18 to 24 Years | 23 (60.5%) | 18 (46.2%) |
| 25 to 34 Years | 38 (66.7%) | 45 (72.6%) |
| 35 to 44 Years | 37 (97.4%) | 24 (88.9%) |
| 45 to 54 Years | 17 (89.5%) | 20 (87.0%) |
| 55 to 64 Years | 22 (91.7%) | 43 (97.7%) |
| 65 to 74 Years | 35 (100.0%) | 20 (100.0%) |
| 75 Years and over | 5 (100.0%) | 8 (100.0%) |
| Total | 314 (82.0%) | 255 (80.7%) |
Income Below Poverty Among Married-Couple Families in Midland
The poverty statistics for married-couple families in Midland show that 10.8% or 14 of the total 130 families live below the poverty line. Families with 3 or 4 children have the highest poverty rate of 100.0%, comprising of 6 families. On the other hand, families with no children have the lowest poverty rate of 0.0%, which includes 0 families.
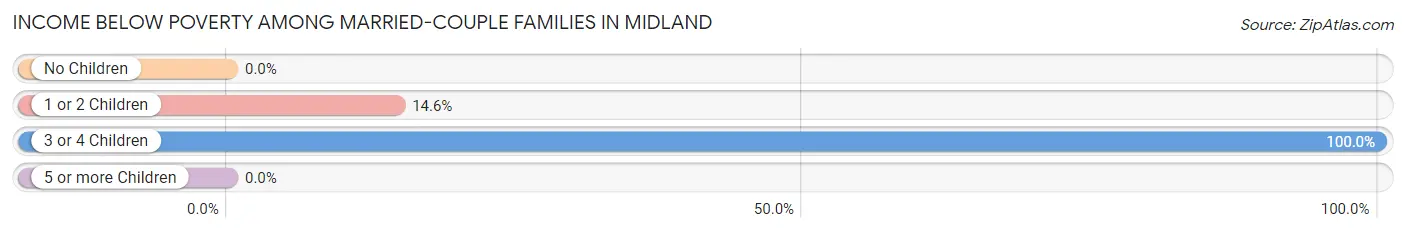
| Children | Above Poverty | Below Poverty |
| No Children | 60 (100.0%) | 0 (0.0%) |
| 1 or 2 Children | 47 (85.5%) | 8 (14.5%) |
| 3 or 4 Children | 0 (0.0%) | 6 (100.0%) |
| 5 or more Children | 9 (100.0%) | 0 (0.0%) |
| Total | 116 (89.2%) | 14 (10.8%) |
Income Below Poverty Among Single-Parent Households in Midland
According to the poverty data in Midland, 35.1% or 13 single-father households and 28.1% or 9 single-mother households are living below the poverty line. Among single-father households, those with 1 or 2 children have the highest poverty rate, with 13 households (35.1%) experiencing poverty. Likewise, among single-mother households, those with 1 or 2 children have the highest poverty rate, with 8 households (42.1%) falling below the poverty line.
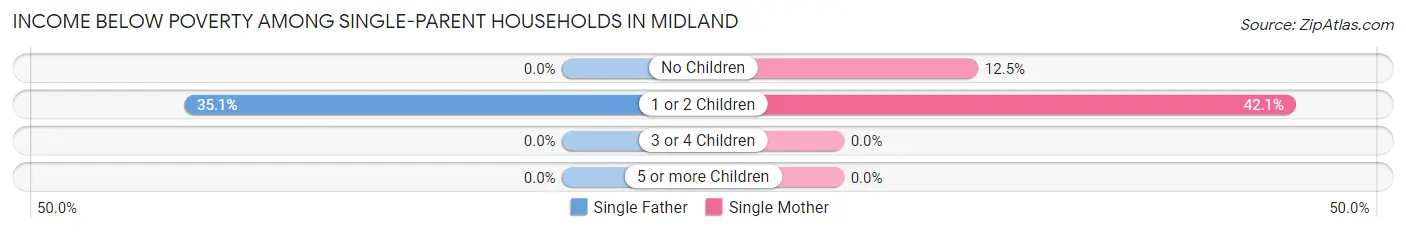
| Children | Single Father | Single Mother |
| No Children | 0 (0.0%) | 1 (12.5%) |
| 1 or 2 Children | 13 (35.1%) | 8 (42.1%) |
| 3 or 4 Children | 0 (0.0%) | 0 (0.0%) |
| 5 or more Children | 0 (0.0%) | 0 (0.0%) |
| Total | 13 (35.1%) | 9 (28.1%) |
Income Below Poverty Among Married-Couple vs Single-Parent Households in Midland
The poverty data for Midland shows that 14 of the married-couple family households (10.8%) and 22 of the single-parent households (31.9%) are living below the poverty level. Within the married-couple family households, those with 3 or 4 children have the highest poverty rate, with 6 households (100.0%) falling below the poverty line. Among the single-parent households, those with 1 or 2 children have the highest poverty rate, with 21 household (37.5%) living below poverty.
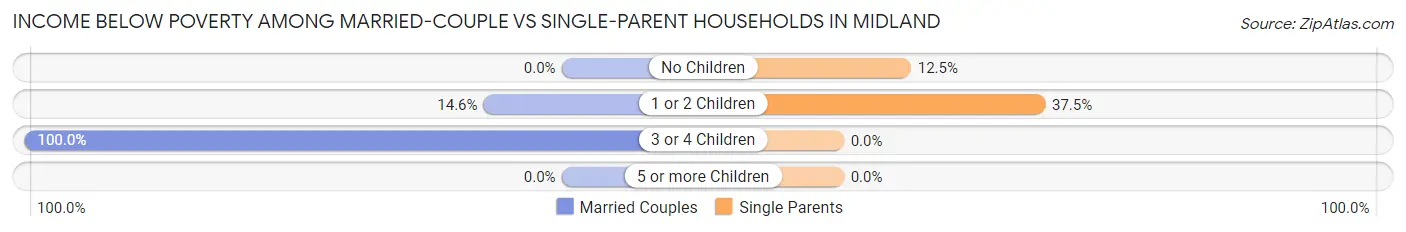
| Children | Married-Couple Families | Single-Parent Households |
| No Children | 0 (0.0%) | 1 (12.5%) |
| 1 or 2 Children | 8 (14.5%) | 21 (37.5%) |
| 3 or 4 Children | 6 (100.0%) | 0 (0.0%) |
| 5 or more Children | 0 (0.0%) | 0 (0.0%) |
| Total | 14 (10.8%) | 22 (31.9%) |
Race in Midland
The most populous races in Midland are White / Caucasian (667 | 95.4%), Two or more Races (25 | 3.6%), and Asian (5 | 0.7%).
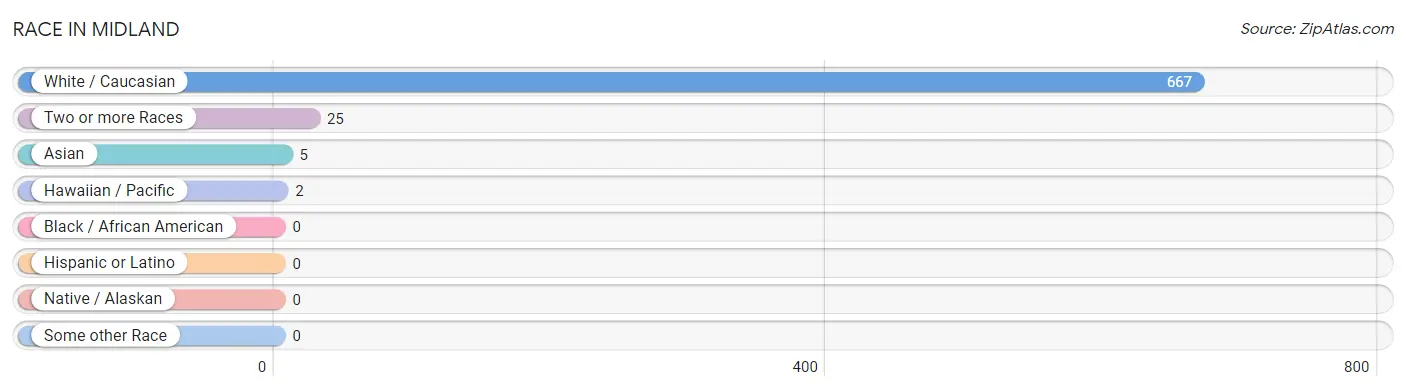
| Race | # Population | % Population |
| Asian | 5 | 0.7% |
| Black / African American | 0 | 0.0% |
| Hawaiian / Pacific | 2 | 0.3% |
| Hispanic or Latino | 0 | 0.0% |
| Native / Alaskan | 0 | 0.0% |
| White / Caucasian | 667 | 95.4% |
| Two or more Races | 25 | 3.6% |
| Some other Race | 0 | 0.0% |
| Total | 699 | 100.0% |
Ancestry in Midland
The most populous ancestries reported in Midland are German (132 | 18.9%), English (84 | 12.0%), Irish (79 | 11.3%), Scottish (69 | 9.9%), and American (41 | 5.9%), together accounting for 57.9% of all Midland residents.
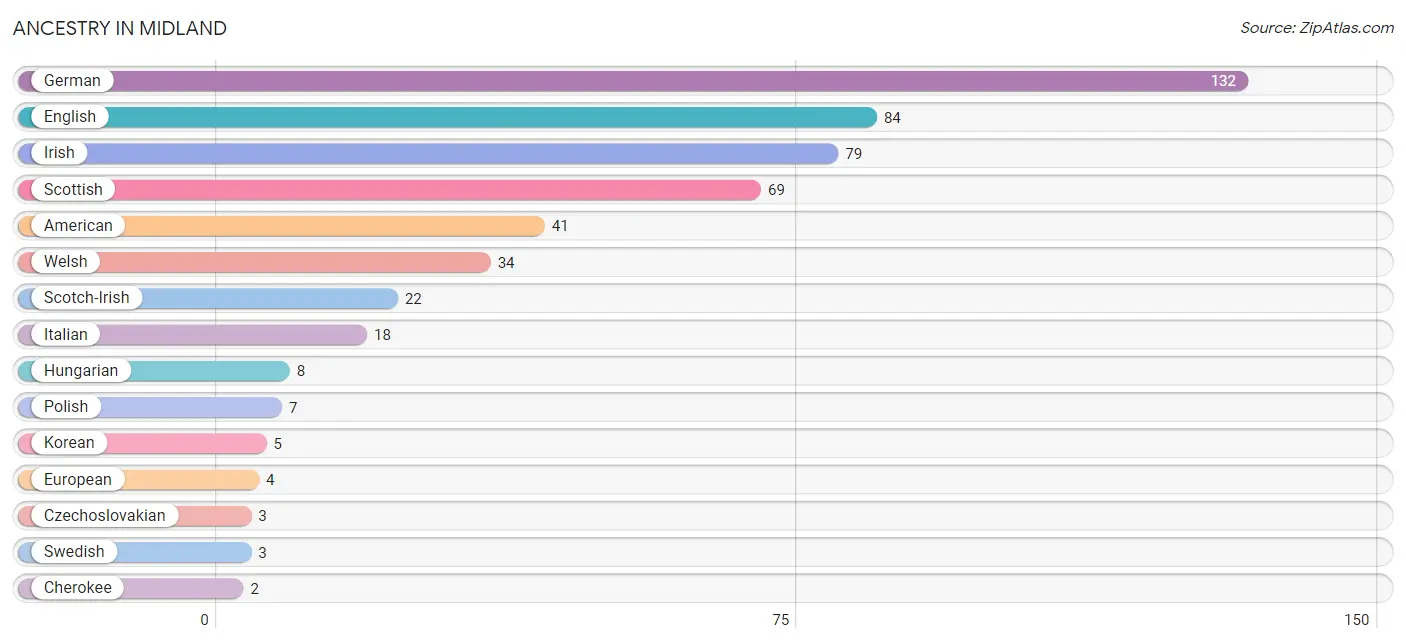
| Ancestry | # Population | % Population |
| American | 41 | 5.9% |
| Cherokee | 2 | 0.3% |
| Czechoslovakian | 3 | 0.4% |
| English | 84 | 12.0% |
| European | 4 | 0.6% |
| German | 132 | 18.9% |
| Guamanian / Chamorro | 1 | 0.1% |
| Hungarian | 8 | 1.1% |
| Irish | 79 | 11.3% |
| Italian | 18 | 2.6% |
| Korean | 5 | 0.7% |
| Native Hawaiian | 1 | 0.1% |
| Polish | 7 | 1.0% |
| Scotch-Irish | 22 | 3.2% |
| Scottish | 69 | 9.9% |
| Swedish | 3 | 0.4% |
| Welsh | 34 | 4.9% | View All 17 Rows |
Immigrants in Midland

| Immigration Origin | # Population | % Population | View All 0 Rows |
Sex and Age in Midland
Sex and Age in Midland
The most populous age groups in Midland are Under 5 Years (66 | 17.2%) for men and Under 5 Years (42 | 13.3%) for women.
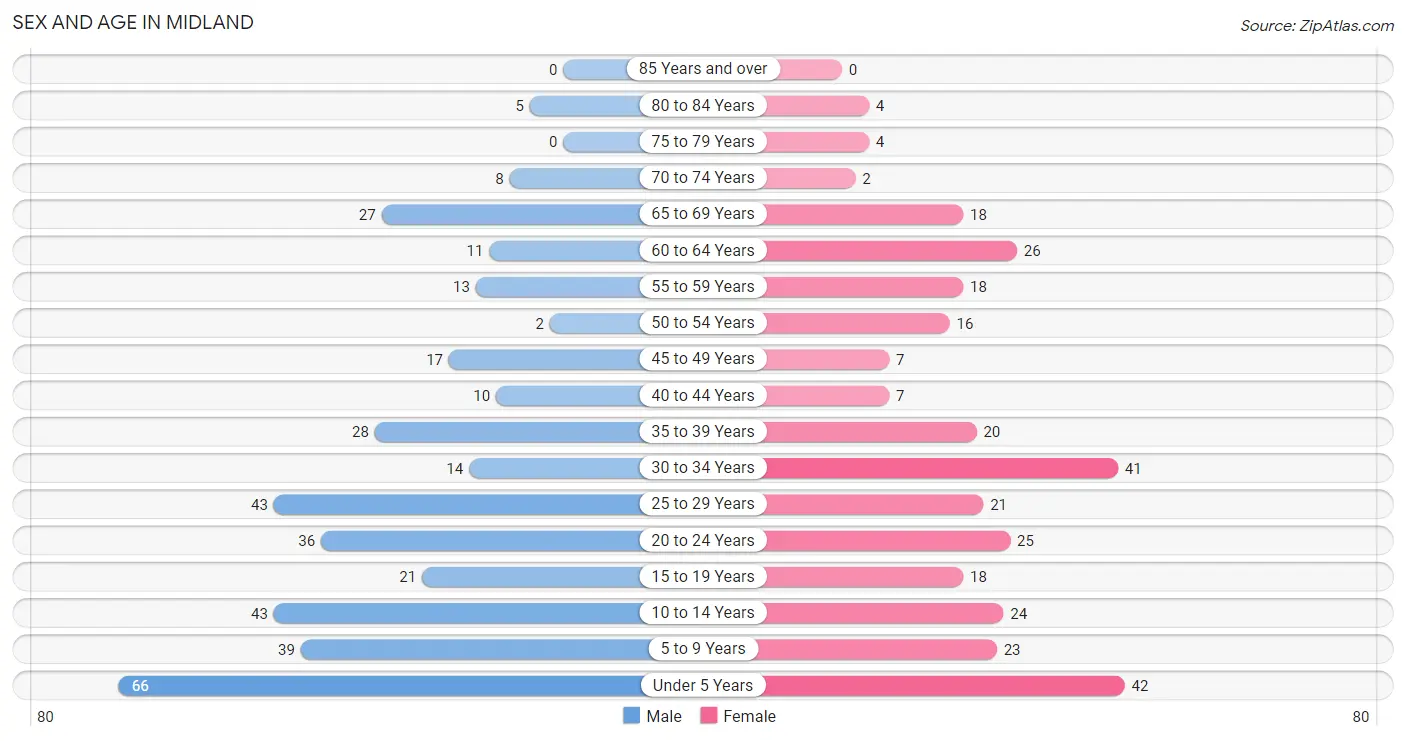
| Age Bracket | Male | Female |
| Under 5 Years | 66 (17.2%) | 42 (13.3%) |
| 5 to 9 Years | 39 (10.2%) | 23 (7.3%) |
| 10 to 14 Years | 43 (11.2%) | 24 (7.6%) |
| 15 to 19 Years | 21 (5.5%) | 18 (5.7%) |
| 20 to 24 Years | 36 (9.4%) | 25 (7.9%) |
| 25 to 29 Years | 43 (11.2%) | 21 (6.7%) |
| 30 to 34 Years | 14 (3.7%) | 41 (13.0%) |
| 35 to 39 Years | 28 (7.3%) | 20 (6.3%) |
| 40 to 44 Years | 10 (2.6%) | 7 (2.2%) |
| 45 to 49 Years | 17 (4.4%) | 7 (2.2%) |
| 50 to 54 Years | 2 (0.5%) | 16 (5.1%) |
| 55 to 59 Years | 13 (3.4%) | 18 (5.7%) |
| 60 to 64 Years | 11 (2.9%) | 26 (8.2%) |
| 65 to 69 Years | 27 (7.0%) | 18 (5.7%) |
| 70 to 74 Years | 8 (2.1%) | 2 (0.6%) |
| 75 to 79 Years | 0 (0.0%) | 4 (1.3%) |
| 80 to 84 Years | 5 (1.3%) | 4 (1.3%) |
| 85 Years and over | 0 (0.0%) | 0 (0.0%) |
| Total | 383 (100.0%) | 316 (100.0%) |
Families and Households in Midland
Median Family Size in Midland
The median family size in Midland is 3.15 persons per family, with married-couple families (130 | 65.3%) accounting for the largest median family size of 3.42 persons per family. On the other hand, single male/father families (37 | 18.6%) represent the smallest median family size with 2.51 persons per family.
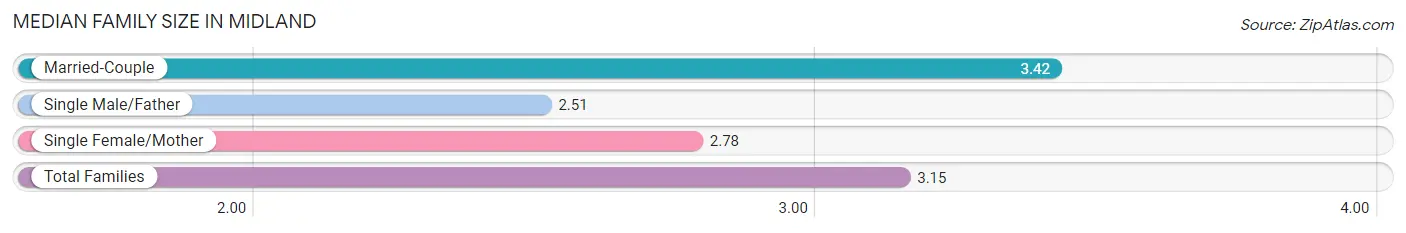
| Family Type | # Families | Family Size |
| Married-Couple | 130 (65.3%) | 3.42 |
| Single Male/Father | 37 (18.6%) | 2.51 |
| Single Female/Mother | 32 (16.1%) | 2.78 |
| Total Families | 199 (100.0%) | 3.15 |
Median Household Size in Midland
The median household size in Midland is 2.90 persons per household, with married-couple households (130 | 53.9%) accounting for the largest median household size of 3.42 persons per household. non-family households (42 | 17.4%) represent the smallest median household size with 1.48 persons per household.
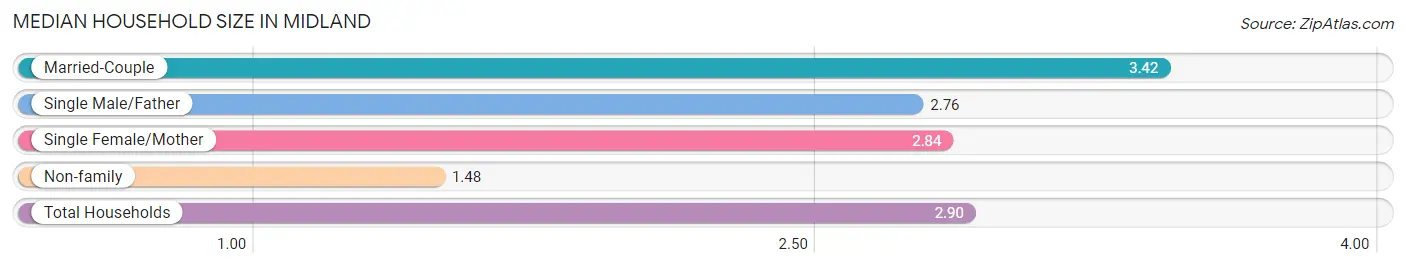
| Household Type | # Households | Household Size |
| Married-Couple | 130 (53.9%) | 3.42 |
| Single Male/Father | 37 (15.3%) | 2.76 |
| Single Female/Mother | 32 (13.3%) | 2.84 |
| Non-family | 42 (17.4%) | 1.48 |
| Total Households | 241 (100.0%) | 2.90 |
Household Size by Marriage Status in Midland
Out of a total of 241 households in Midland, 199 (82.6%) are family households, while 42 (17.4%) are nonfamily households. The most numerous type of family households are 2-person households, comprising 83, and the most common type of nonfamily households are 1-person households, comprising 31.
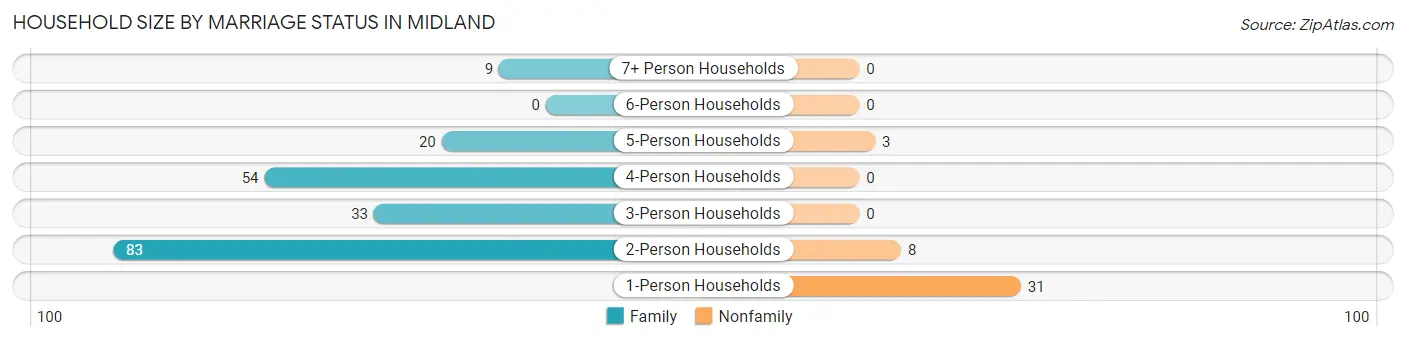
| Household Size | Family Households | Nonfamily Households |
| 1-Person Households | - | 31 (12.9%) |
| 2-Person Households | 83 (34.4%) | 8 (3.3%) |
| 3-Person Households | 33 (13.7%) | 0 (0.0%) |
| 4-Person Households | 54 (22.4%) | 0 (0.0%) |
| 5-Person Households | 20 (8.3%) | 3 (1.2%) |
| 6-Person Households | 0 (0.0%) | 0 (0.0%) |
| 7+ Person Households | 9 (3.7%) | 0 (0.0%) |
| Total | 199 (82.6%) | 42 (17.4%) |
Female Fertility in Midland
Fertility by Age in Midland
Average fertility rate in Midland is 190.0 births per 1,000 women. Women in the age bracket of 15 to 19 years have the highest fertility rate with 444.0 births per 1,000 women. Women in the age bracket of 20 to 34 years acount for 70.4% of all women with births.
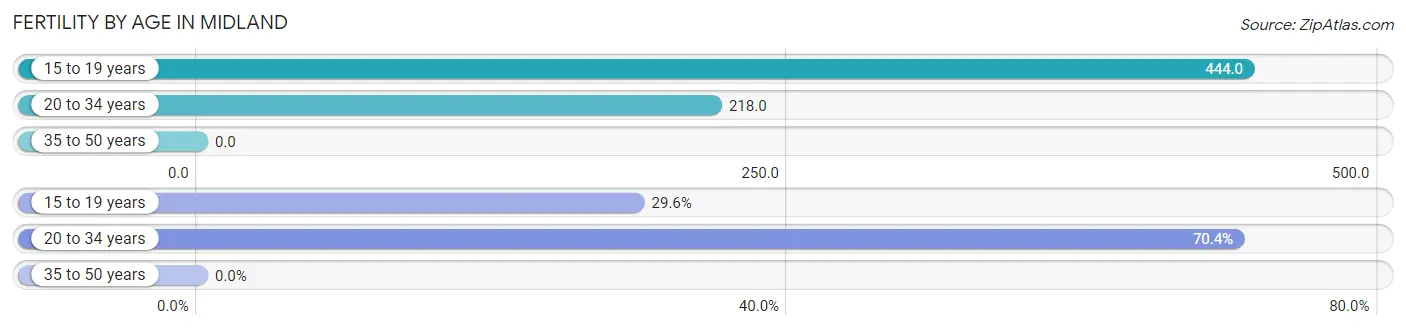
| Age Bracket | Women with Births | Births / 1,000 Women |
| 15 to 19 years | 8 (29.6%) | 444.0 |
| 20 to 34 years | 19 (70.4%) | 218.0 |
| 35 to 50 years | 0 (0.0%) | 0.0 |
| Total | 27 (100.0%) | 190.0 |
Fertility by Age by Marriage Status in Midland
77.8% of women with births (27) in Midland are married. The highest percentage of unmarried women with births falls into 20 to 34 years age bracket with 31.6% of them unmarried at the time of birth, while the lowest percentage of unmarried women with births belong to 15 to 19 years age bracket with 0.0% of them unmarried.
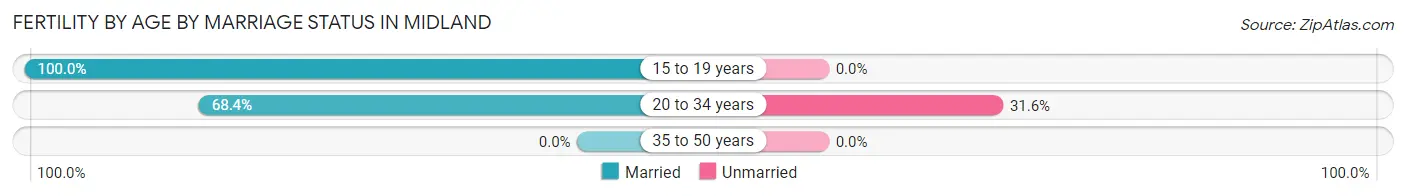
| Age Bracket | Married | Unmarried |
| 15 to 19 years | 8 (100.0%) | 0 (0.0%) |
| 20 to 34 years | 13 (68.4%) | 6 (31.6%) |
| 35 to 50 years | 0 (0.0%) | 0 (0.0%) |
| Total | 21 (77.8%) | 6 (22.2%) |
Fertility by Education in Midland
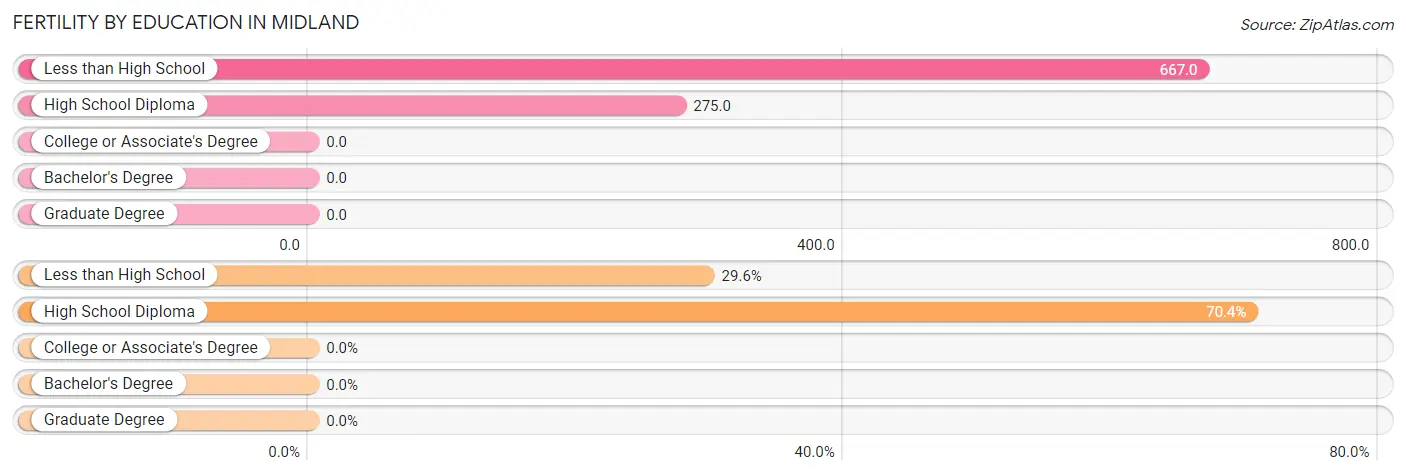
| Educational Attainment | Women with Births | Births / 1,000 Women |
| Less than High School | 8 (29.6%) | 667.0 |
| High School Diploma | 19 (70.4%) | 275.0 |
| College or Associate's Degree | 0 (0.0%) | 0.0 |
| Bachelor's Degree | 0 (0.0%) | 0.0 |
| Graduate Degree | 0 (0.0%) | 0.0 |
| Total | 27 (100.0%) | 190.0 |
Fertility by Education by Marriage Status in Midland
22.2% of women with births in Midland are unmarried. Women with the educational attainment of less than high school are most likely to be married with 100.0% of them married at childbirth, while women with the educational attainment of high school diploma are least likely to be married with 31.6% of them unmarried at childbirth.
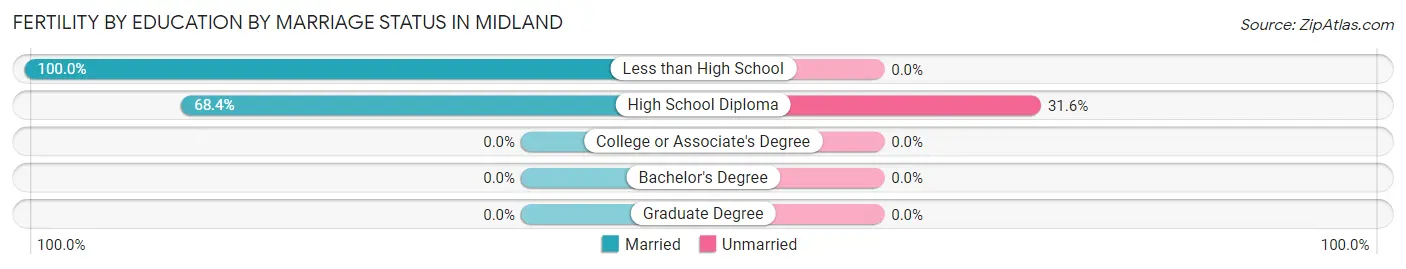
| Educational Attainment | Married | Unmarried |
| Less than High School | 8 (100.0%) | 0 (0.0%) |
| High School Diploma | 13 (68.4%) | 6 (31.6%) |
| College or Associate's Degree | 0 (0.0%) | 0 (0.0%) |
| Bachelor's Degree | 0 (0.0%) | 0 (0.0%) |
| Graduate Degree | 0 (0.0%) | 0 (0.0%) |
| Total | 21 (77.8%) | 6 (22.2%) |
Employment Characteristics in Midland
Employment by Class of Employer in Midland
Among the 290 employed individuals in Midland, private company employees (221 | 76.2%), not-for-profit organizations (23 | 7.9%), and local government employees (23 | 7.9%) make up the most common classes of employment.
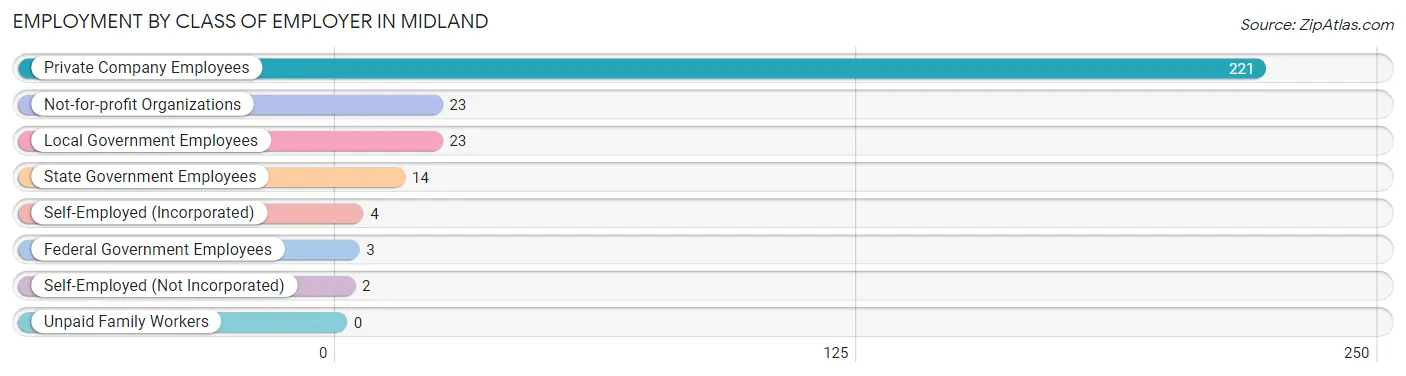
| Employer Class | # Employees | % Employees |
| Private Company Employees | 221 | 76.2% |
| Self-Employed (Incorporated) | 4 | 1.4% |
| Self-Employed (Not Incorporated) | 2 | 0.7% |
| Not-for-profit Organizations | 23 | 7.9% |
| Local Government Employees | 23 | 7.9% |
| State Government Employees | 14 | 4.8% |
| Federal Government Employees | 3 | 1.0% |
| Unpaid Family Workers | 0 | 0.0% |
| Total | 290 | 100.0% |
Employment Status by Age in Midland
According to the labor force statistics for Midland, out of the total population over 16 years of age (459), 69.1% or 317 individuals are in the labor force, with 8.5% or 27 of them unemployed. The age group with the highest labor force participation rate is 25 to 29 years, with 89.1% or 57 individuals in the labor force. Within the labor force, the 16 to 19 years age range has the highest percentage of unemployed individuals, with 76.9% or 10 of them being unemployed.
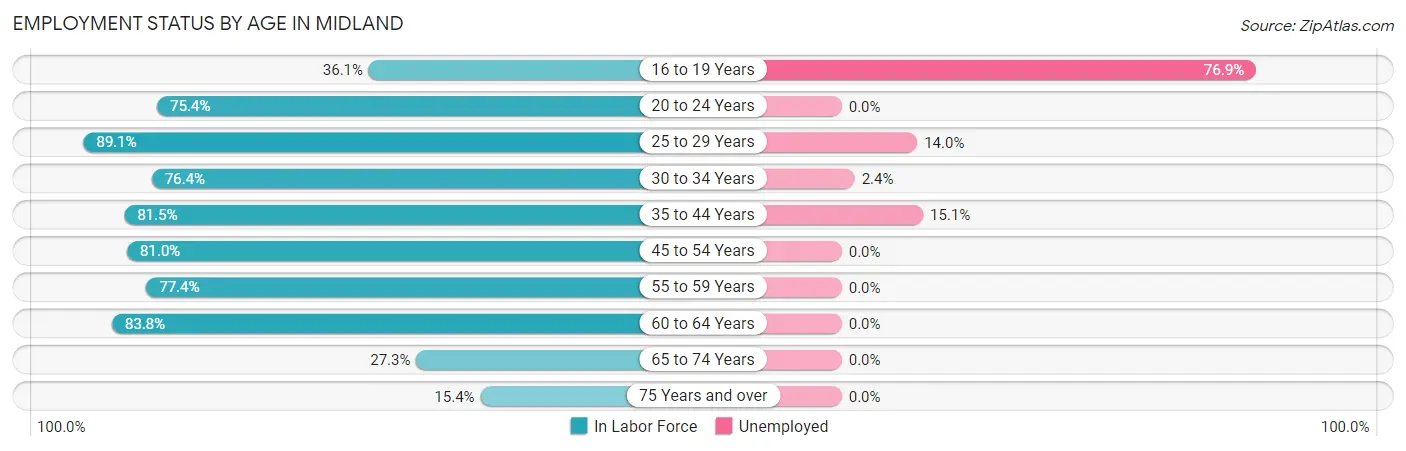
| Age Bracket | In Labor Force | Unemployed |
| 16 to 19 Years | 13 (36.1%) | 10 (76.9%) |
| 20 to 24 Years | 46 (75.4%) | 0 (0.0%) |
| 25 to 29 Years | 57 (89.1%) | 8 (14.0%) |
| 30 to 34 Years | 42 (76.4%) | 1 (2.4%) |
| 35 to 44 Years | 53 (81.5%) | 8 (15.1%) |
| 45 to 54 Years | 34 (81.0%) | 0 (0.0%) |
| 55 to 59 Years | 24 (77.4%) | 0 (0.0%) |
| 60 to 64 Years | 31 (83.8%) | 0 (0.0%) |
| 65 to 74 Years | 15 (27.3%) | 0 (0.0%) |
| 75 Years and over | 2 (15.4%) | 0 (0.0%) |
| Total | 317 (69.1%) | 27 (8.5%) |
Employment Status by Educational Attainment in Midland
According to labor force statistics for Midland, 82.0% of individuals (241) out of the total population between 25 and 64 years of age (294) are in the labor force, with 7.1% or 17 of them being unemployed. The group with the highest labor force participation rate are those with the educational attainment of bachelor's degree or higher, with 95.3% or 41 individuals in the labor force. Within the labor force, individuals with high school diploma education have the highest percentage of unemployment, with 9.9% or 9 of them being unemployed.
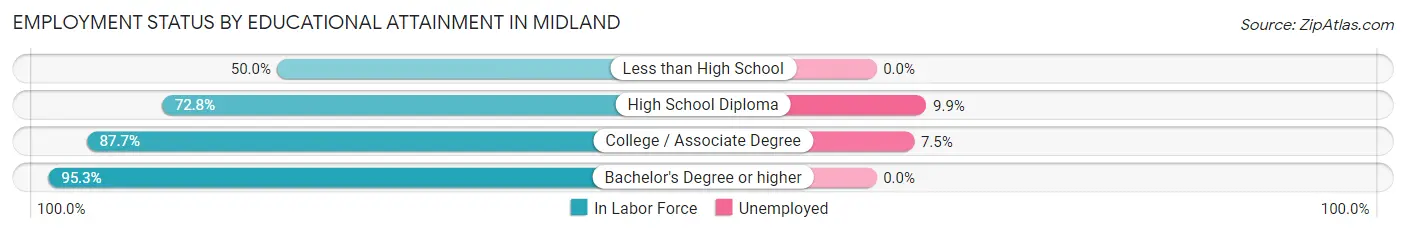
| Educational Attainment | In Labor Force | Unemployed |
| Less than High School | 2 (50.0%) | 0 (0.0%) |
| High School Diploma | 91 (72.8%) | 12 (9.9%) |
| College / Associate Degree | 107 (87.7%) | 9 (7.5%) |
| Bachelor's Degree or higher | 41 (95.3%) | 0 (0.0%) |
| Total | 241 (82.0%) | 21 (7.1%) |
Employment Occupations by Sex in Midland
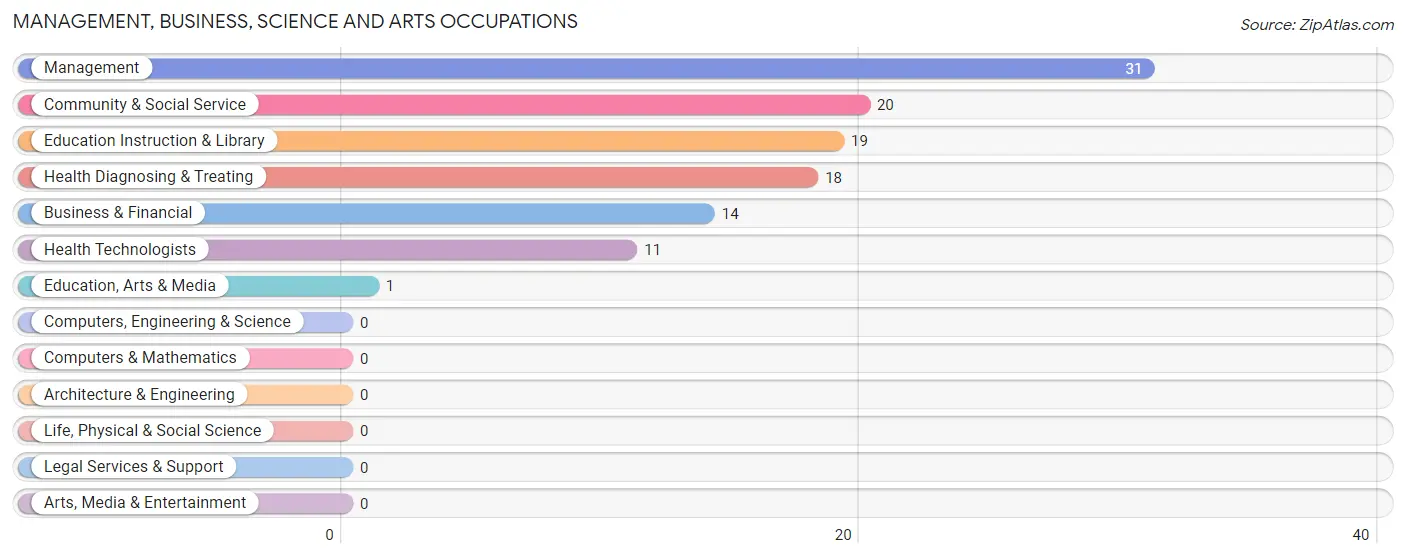
Management, Business, Science and Arts Occupations
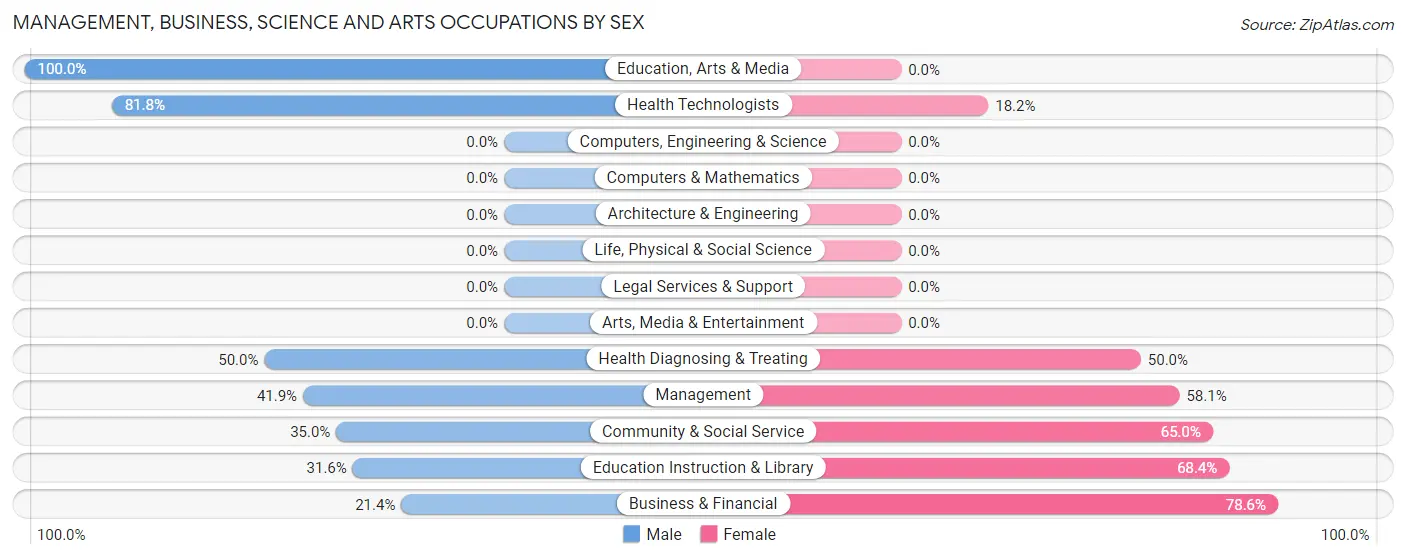
The most common Management, Business, Science and Arts occupations in Midland are Management (31 | 10.7%), Community & Social Service (20 | 6.9%), Education Instruction & Library (19 | 6.6%), Health Diagnosing & Treating (18 | 6.2%), and Business & Financial (14 | 4.8%).
Management, Business, Science and Arts Occupations by Sex
Within the Management, Business, Science and Arts occupations in Midland, the most male-oriented occupations are Education, Arts & Media (100.0%), Health Technologists (81.8%), and Health Diagnosing & Treating (50.0%), while the most female-oriented occupations are Business & Financial (78.6%), Education Instruction & Library (68.4%), and Community & Social Service (65.0%).
| Occupation | Male | Female |
| Management | 13 (41.9%) | 18 (58.1%) |
| Business & Financial | 3 (21.4%) | 11 (78.6%) |
| Computers, Engineering & Science | 0 (0.0%) | 0 (0.0%) |
| Computers & Mathematics | 0 (0.0%) | 0 (0.0%) |
| Architecture & Engineering | 0 (0.0%) | 0 (0.0%) |
| Life, Physical & Social Science | 0 (0.0%) | 0 (0.0%) |
| Community & Social Service | 7 (35.0%) | 13 (65.0%) |
| Education, Arts & Media | 1 (100.0%) | 0 (0.0%) |
| Legal Services & Support | 0 (0.0%) | 0 (0.0%) |
| Education Instruction & Library | 6 (31.6%) | 13 (68.4%) |
| Arts, Media & Entertainment | 0 (0.0%) | 0 (0.0%) |
| Health Diagnosing & Treating | 9 (50.0%) | 9 (50.0%) |
| Health Technologists | 9 (81.8%) | 2 (18.2%) |
| Total (Category) | 32 (38.6%) | 51 (61.5%) |
| Total (Overall) | 166 (57.2%) | 124 (42.8%) |
Services Occupations
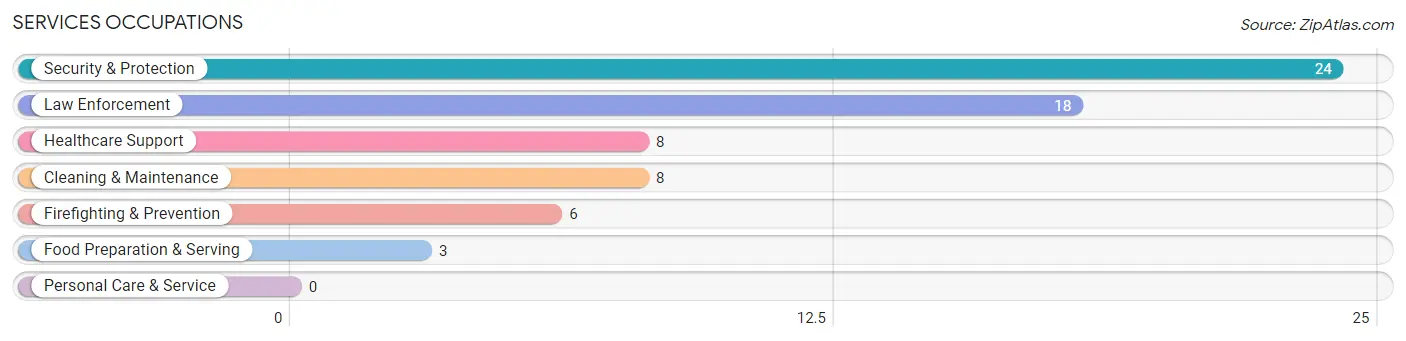
The most common Services occupations in Midland are Security & Protection (24 | 8.3%), Law Enforcement (18 | 6.2%), Healthcare Support (8 | 2.8%), Cleaning & Maintenance (8 | 2.8%), and Firefighting & Prevention (6 | 2.1%).
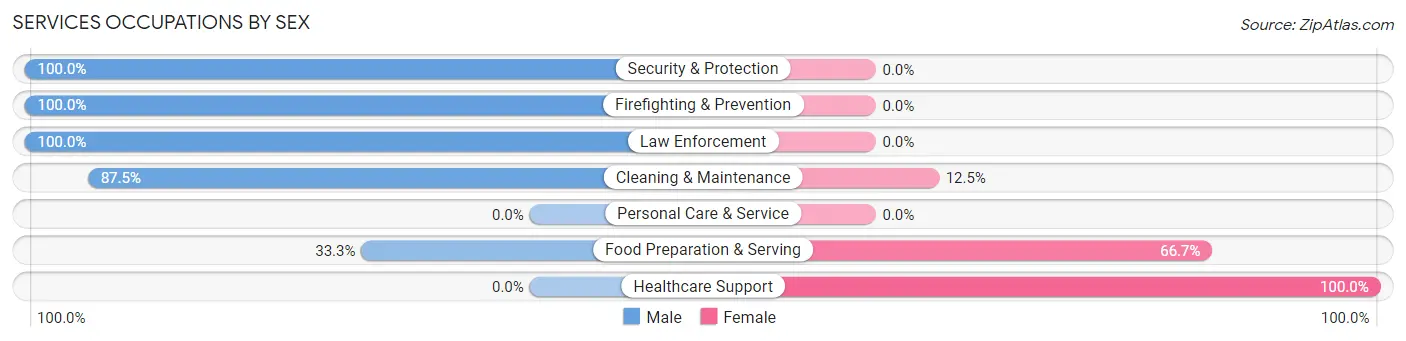
Services Occupations by Sex
Within the Services occupations in Midland, the most male-oriented occupations are Security & Protection (100.0%), Firefighting & Prevention (100.0%), and Law Enforcement (100.0%), while the most female-oriented occupations are Healthcare Support (100.0%), Food Preparation & Serving (66.7%), and Cleaning & Maintenance (12.5%).
| Occupation | Male | Female |
| Healthcare Support | 0 (0.0%) | 8 (100.0%) |
| Security & Protection | 24 (100.0%) | 0 (0.0%) |
| Firefighting & Prevention | 6 (100.0%) | 0 (0.0%) |
| Law Enforcement | 18 (100.0%) | 0 (0.0%) |
| Food Preparation & Serving | 1 (33.3%) | 2 (66.7%) |
| Cleaning & Maintenance | 7 (87.5%) | 1 (12.5%) |
| Personal Care & Service | 0 (0.0%) | 0 (0.0%) |
| Total (Category) | 32 (74.4%) | 11 (25.6%) |
| Total (Overall) | 166 (57.2%) | 124 (42.8%) |
Sales and Office Occupations
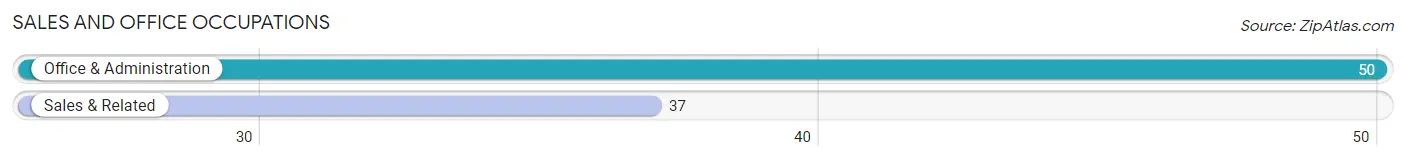
The most common Sales and Office occupations in Midland are Office & Administration (50 | 17.2%), and Sales & Related (37 | 12.8%).
Sales and Office Occupations by Sex
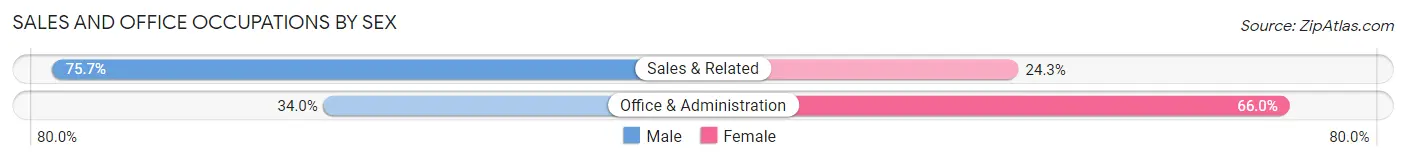
| Occupation | Male | Female |
| Sales & Related | 28 (75.7%) | 9 (24.3%) |
| Office & Administration | 17 (34.0%) | 33 (66.0%) |
| Total (Category) | 45 (51.7%) | 42 (48.3%) |
| Total (Overall) | 166 (57.2%) | 124 (42.8%) |
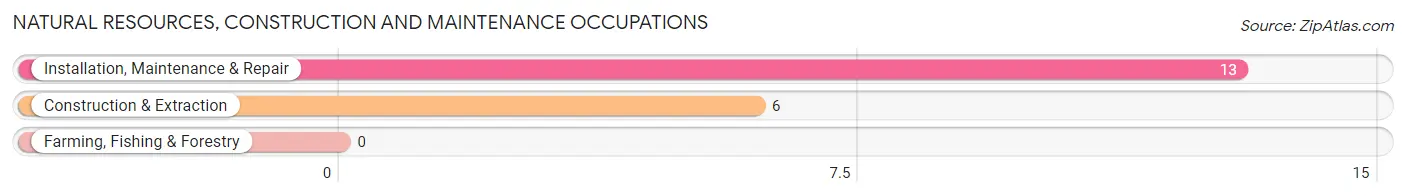
Natural Resources, Construction and Maintenance Occupations
The most common Natural Resources, Construction and Maintenance occupations in Midland are Installation, Maintenance & Repair (13 | 4.5%), and Construction & Extraction (6 | 2.1%).
Natural Resources, Construction and Maintenance Occupations by Sex
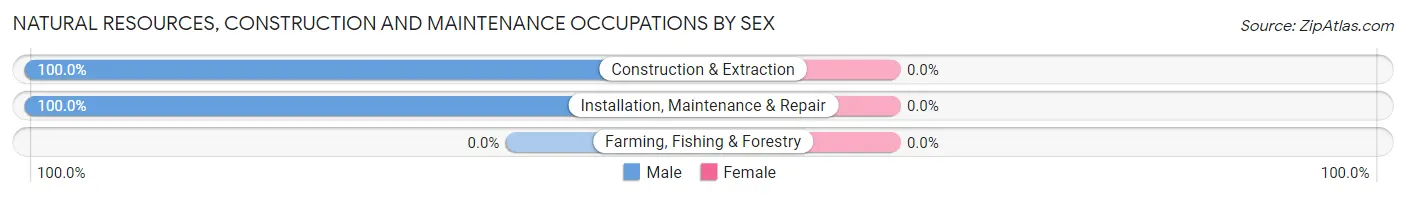
| Occupation | Male | Female |
| Farming, Fishing & Forestry | 0 (0.0%) | 0 (0.0%) |
| Construction & Extraction | 6 (100.0%) | 0 (0.0%) |
| Installation, Maintenance & Repair | 13 (100.0%) | 0 (0.0%) |
| Total (Category) | 19 (100.0%) | 0 (0.0%) |
| Total (Overall) | 166 (57.2%) | 124 (42.8%) |
Production, Transportation and Moving Occupations
The most common Production, Transportation and Moving occupations in Midland are Transportation (21 | 7.2%), Material Moving (19 | 6.6%), and Production (18 | 6.2%).
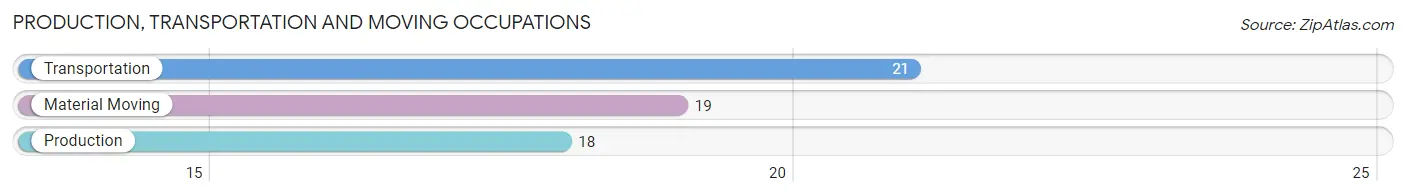
Production, Transportation and Moving Occupations by Sex
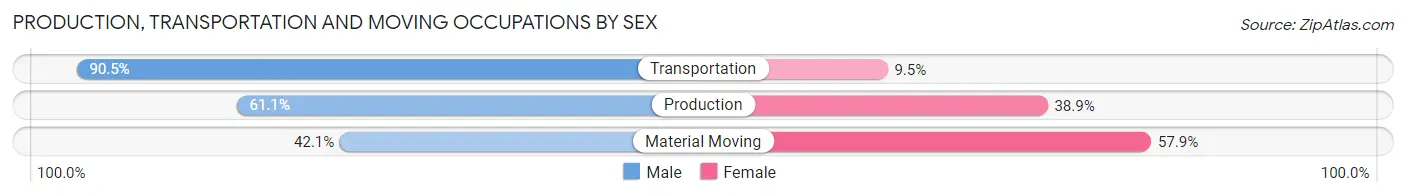
| Occupation | Male | Female |
| Production | 11 (61.1%) | 7 (38.9%) |
| Transportation | 19 (90.5%) | 2 (9.5%) |
| Material Moving | 8 (42.1%) | 11 (57.9%) |
| Total (Category) | 38 (65.5%) | 20 (34.5%) |
| Total (Overall) | 166 (57.2%) | 124 (42.8%) |
Employment Industries by Sex in Midland
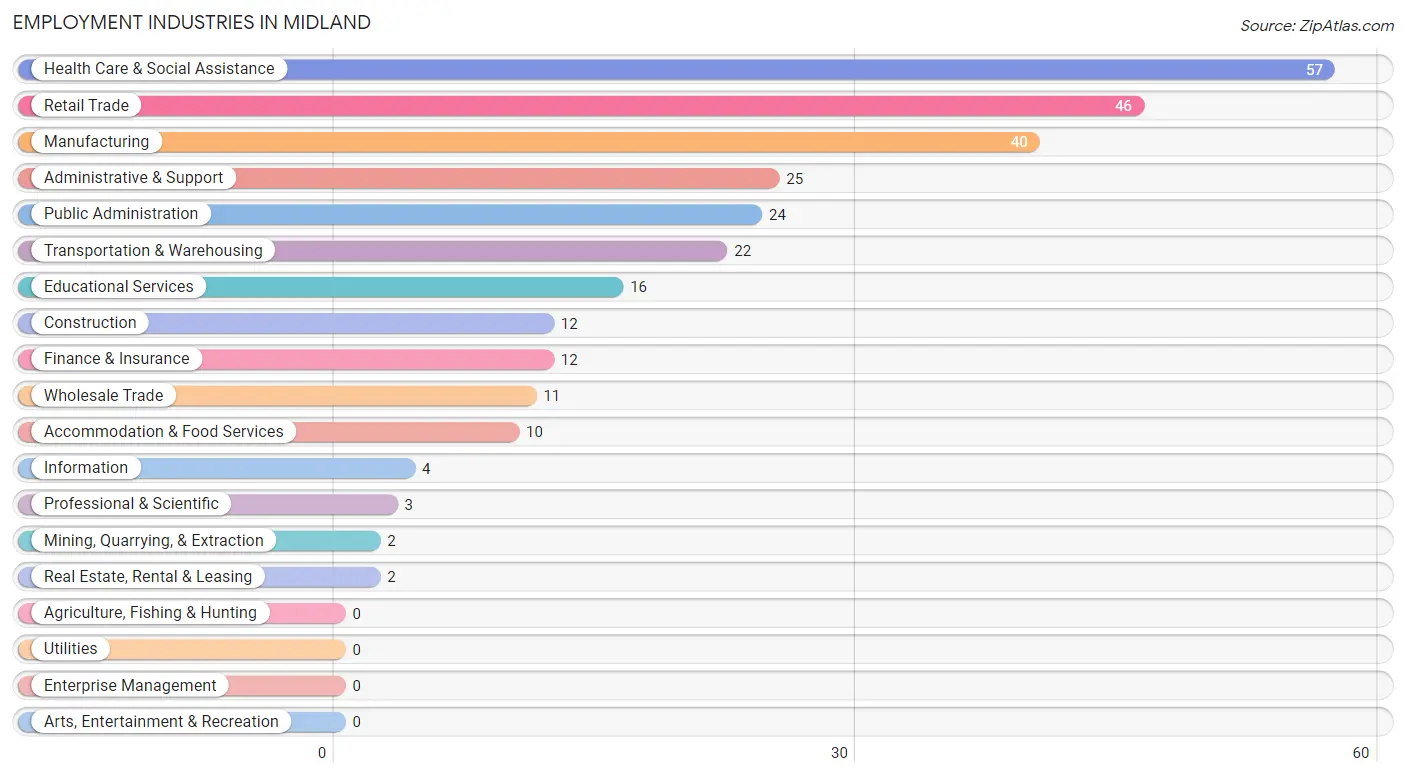
Employment Industries in Midland
The major employment industries in Midland include Health Care & Social Assistance (57 | 19.7%), Retail Trade (46 | 15.9%), Manufacturing (40 | 13.8%), Administrative & Support (25 | 8.6%), and Public Administration (24 | 8.3%).
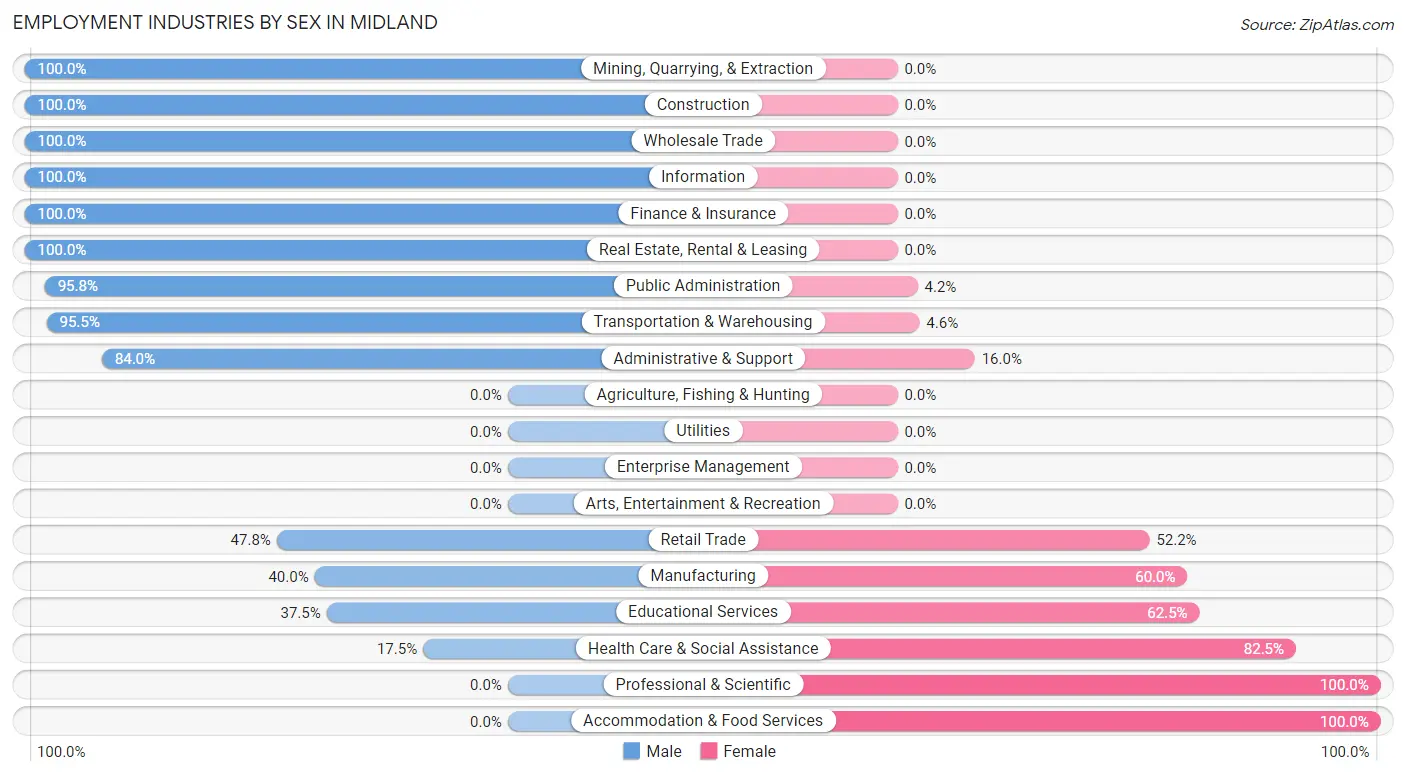
Employment Industries by Sex in Midland
The Midland industries that see more men than women are Mining, Quarrying, & Extraction (100.0%), Construction (100.0%), and Wholesale Trade (100.0%), whereas the industries that tend to have a higher number of women are Professional & Scientific (100.0%), Accommodation & Food Services (100.0%), and Health Care & Social Assistance (82.5%).
| Industry | Male | Female |
| Agriculture, Fishing & Hunting | 0 (0.0%) | 0 (0.0%) |
| Mining, Quarrying, & Extraction | 2 (100.0%) | 0 (0.0%) |
| Construction | 12 (100.0%) | 0 (0.0%) |
| Manufacturing | 16 (40.0%) | 24 (60.0%) |
| Wholesale Trade | 11 (100.0%) | 0 (0.0%) |
| Retail Trade | 22 (47.8%) | 24 (52.2%) |
| Transportation & Warehousing | 21 (95.5%) | 1 (4.5%) |
| Utilities | 0 (0.0%) | 0 (0.0%) |
| Information | 4 (100.0%) | 0 (0.0%) |
| Finance & Insurance | 12 (100.0%) | 0 (0.0%) |
| Real Estate, Rental & Leasing | 2 (100.0%) | 0 (0.0%) |
| Professional & Scientific | 0 (0.0%) | 3 (100.0%) |
| Enterprise Management | 0 (0.0%) | 0 (0.0%) |
| Administrative & Support | 21 (84.0%) | 4 (16.0%) |
| Educational Services | 6 (37.5%) | 10 (62.5%) |
| Health Care & Social Assistance | 10 (17.5%) | 47 (82.5%) |
| Arts, Entertainment & Recreation | 0 (0.0%) | 0 (0.0%) |
| Accommodation & Food Services | 0 (0.0%) | 10 (100.0%) |
| Public Administration | 23 (95.8%) | 1 (4.2%) |
| Total | 166 (57.2%) | 124 (42.8%) |
Education in Midland
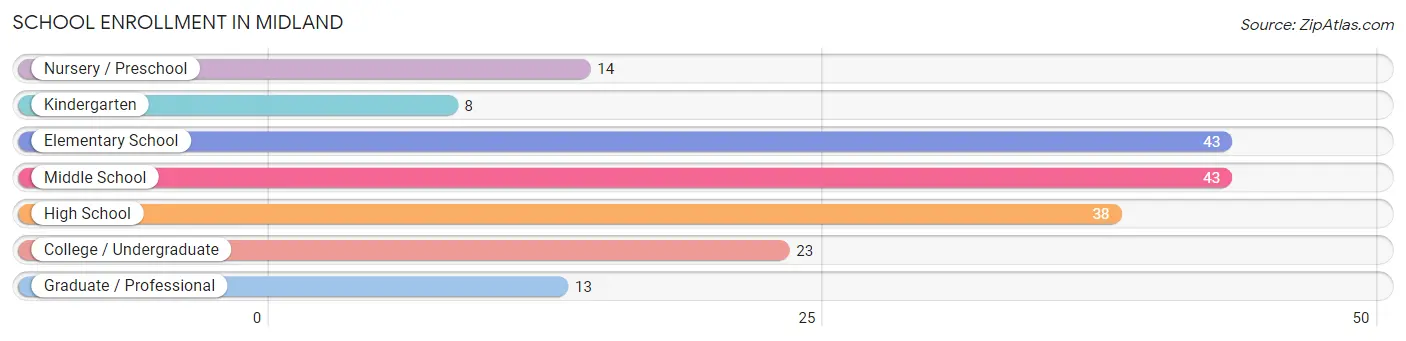
School Enrollment in Midland
The most common levels of schooling among the 182 students in Midland are elementary school (43 | 23.6%), middle school (43 | 23.6%), and high school (38 | 20.9%).
| School Level | # Students | % Students |
| Nursery / Preschool | 14 | 7.7% |
| Kindergarten | 8 | 4.4% |
| Elementary School | 43 | 23.6% |
| Middle School | 43 | 23.6% |
| High School | 38 | 20.9% |
| College / Undergraduate | 23 | 12.6% |
| Graduate / Professional | 13 | 7.1% |
| Total | 182 | 100.0% |
School Enrollment by Age by Funding Source in Midland
Out of a total of 182 students who are enrolled in schools in Midland, 20 (11.0%) attend a private institution, while the remaining 162 (89.0%) are enrolled in public schools. The age group of 35 years and over has the highest likelihood of being enrolled in private schools, with 2 (100.0% in the age bracket) enrolled. Conversely, the age group of 15 to 17 year olds has the lowest likelihood of being enrolled in a private school, with 11 (100.0% in the age bracket) attending a public institution.
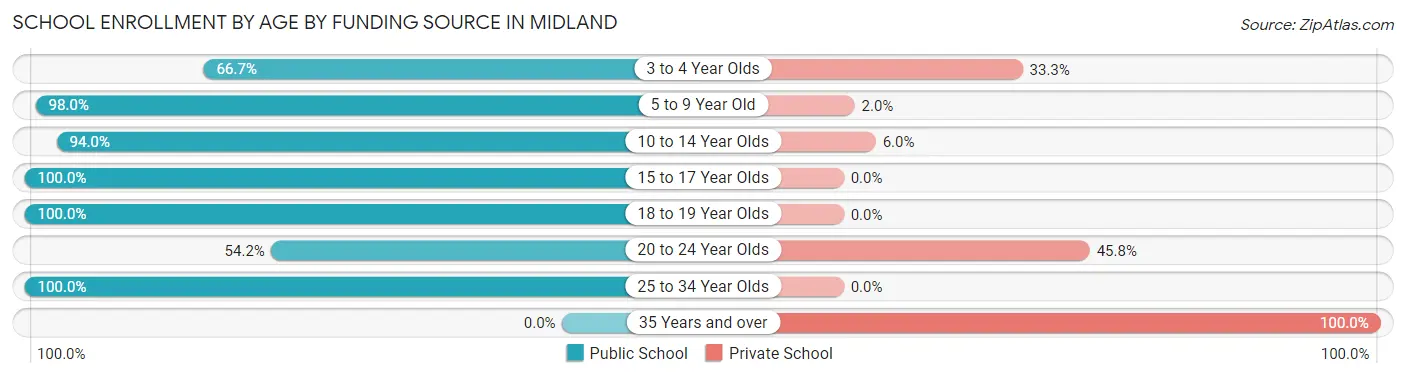
| Age Bracket | Public School | Private School |
| 3 to 4 Year Olds | 4 (66.7%) | 2 (33.3%) |
| 5 to 9 Year Old | 48 (98.0%) | 1 (2.0%) |
| 10 to 14 Year Olds | 63 (94.0%) | 4 (6.0%) |
| 15 to 17 Year Olds | 11 (100.0%) | 0 (0.0%) |
| 18 to 19 Year Olds | 16 (100.0%) | 0 (0.0%) |
| 20 to 24 Year Olds | 13 (54.2%) | 11 (45.8%) |
| 25 to 34 Year Olds | 7 (100.0%) | 0 (0.0%) |
| 35 Years and over | 0 (0.0%) | 2 (100.0%) |
| Total | 162 (89.0%) | 20 (11.0%) |
Educational Attainment by Field of Study in Midland
Social sciences (18 | 28.1%), education (17 | 26.6%), business (10 | 15.6%), bio, nature & agricultural (5 | 7.8%), and arts & humanities (5 | 7.8%) are the most common fields of study among 64 individuals in Midland who have obtained a bachelor's degree or higher.
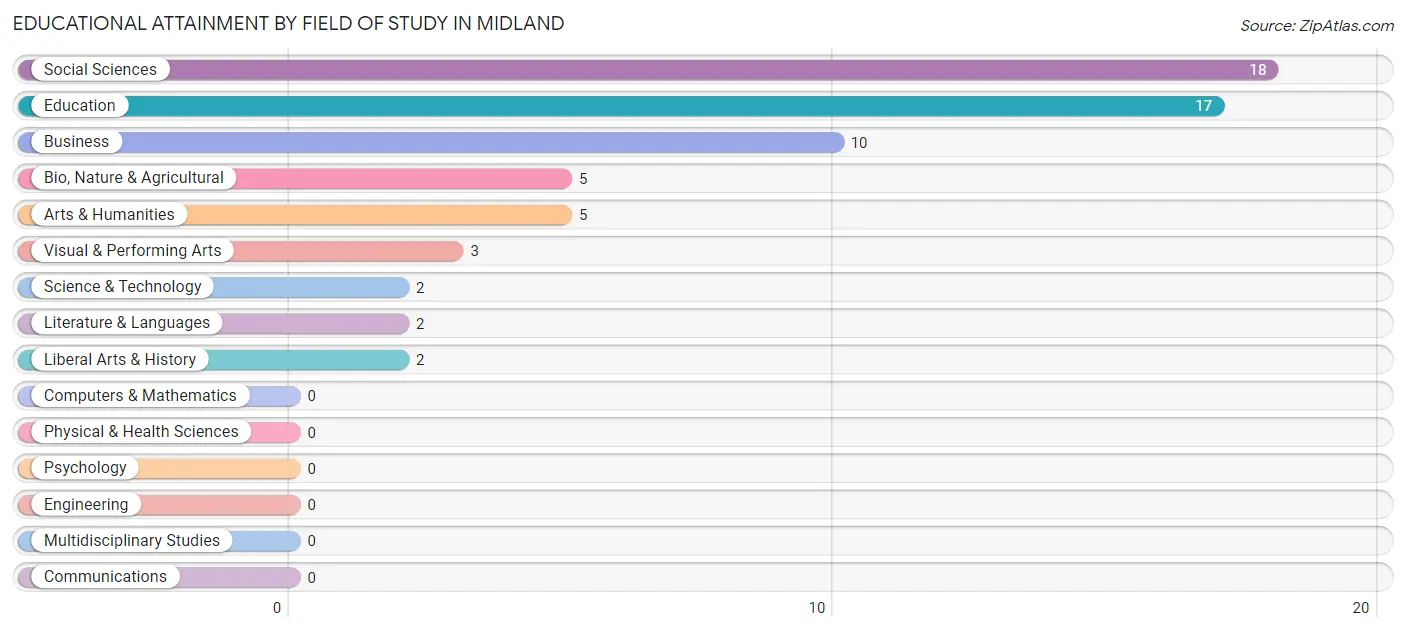
| Field of Study | # Graduates | % Graduates |
| Computers & Mathematics | 0 | 0.0% |
| Bio, Nature & Agricultural | 5 | 7.8% |
| Physical & Health Sciences | 0 | 0.0% |
| Psychology | 0 | 0.0% |
| Social Sciences | 18 | 28.1% |
| Engineering | 0 | 0.0% |
| Multidisciplinary Studies | 0 | 0.0% |
| Science & Technology | 2 | 3.1% |
| Business | 10 | 15.6% |
| Education | 17 | 26.6% |
| Literature & Languages | 2 | 3.1% |
| Liberal Arts & History | 2 | 3.1% |
| Visual & Performing Arts | 3 | 4.7% |
| Communications | 0 | 0.0% |
| Arts & Humanities | 5 | 7.8% |
| Total | 64 | 100.0% |
Transportation & Commute in Midland
Vehicle Availability by Sex in Midland
The most prevalent vehicle ownership categories in Midland are males with 2 vehicles (65, accounting for 39.2%) and females with 2 vehicles (46, making up 52.4%).
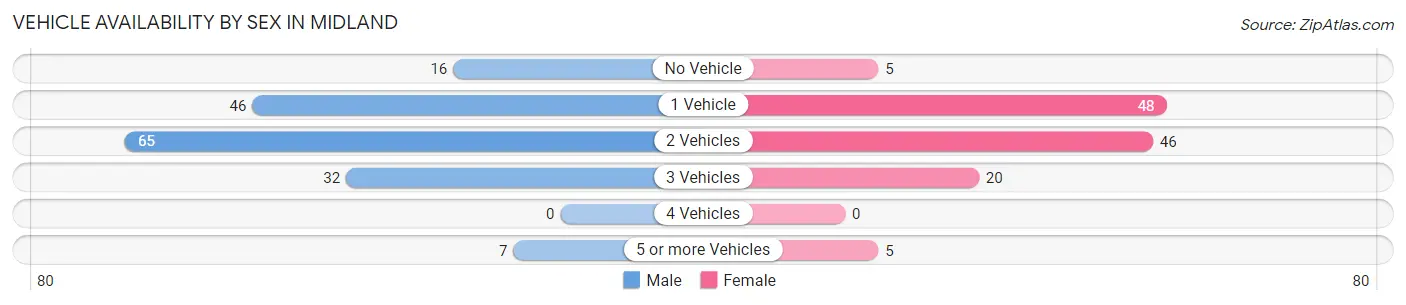
| Vehicles Available | Male | Female |
| No Vehicle | 16 (9.6%) | 5 (4.0%) |
| 1 Vehicle | 46 (27.7%) | 48 (38.7%) |
| 2 Vehicles | 65 (39.2%) | 46 (37.1%) |
| 3 Vehicles | 32 (19.3%) | 20 (16.1%) |
| 4 Vehicles | 0 (0.0%) | 0 (0.0%) |
| 5 or more Vehicles | 7 (4.2%) | 5 (4.0%) |
| Total | 166 (100.0%) | 124 (100.0%) |
Commute Time in Midland
The most frequently occuring commute durations in Midland are 15 to 19 minutes (53 commuters, 18.6%), 20 to 24 minutes (51 commuters, 17.9%), and 25 to 29 minutes (51 commuters, 17.9%).
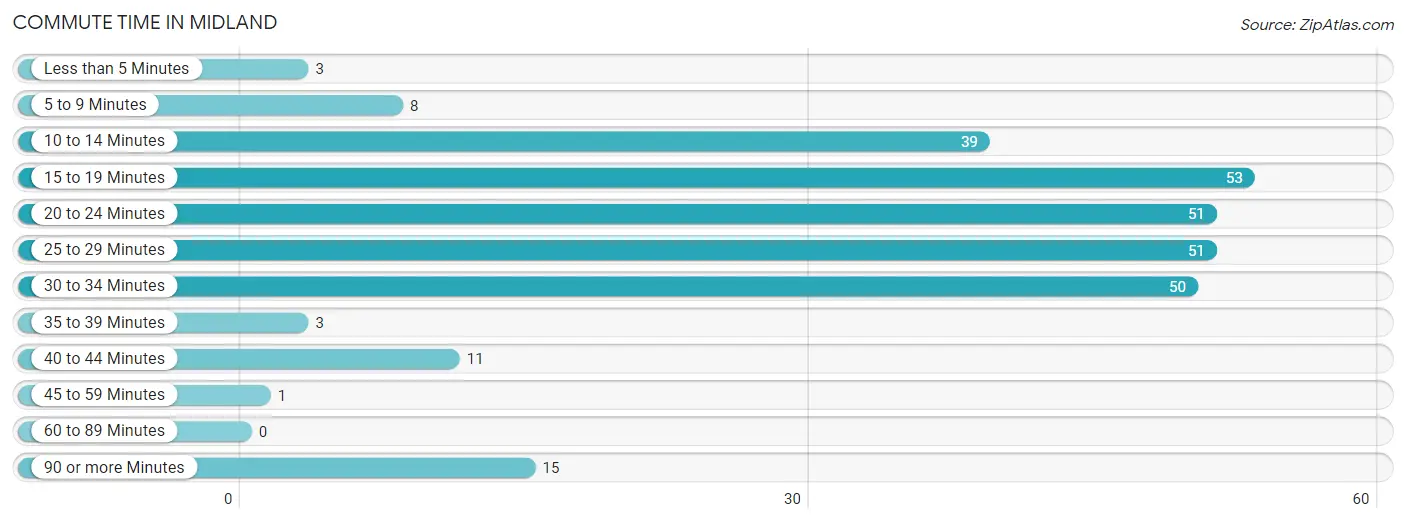
| Commute Time | # Commuters | % Commuters |
| Less than 5 Minutes | 3 | 1.1% |
| 5 to 9 Minutes | 8 | 2.8% |
| 10 to 14 Minutes | 39 | 13.7% |
| 15 to 19 Minutes | 53 | 18.6% |
| 20 to 24 Minutes | 51 | 17.9% |
| 25 to 29 Minutes | 51 | 17.9% |
| 30 to 34 Minutes | 50 | 17.5% |
| 35 to 39 Minutes | 3 | 1.1% |
| 40 to 44 Minutes | 11 | 3.9% |
| 45 to 59 Minutes | 1 | 0.4% |
| 60 to 89 Minutes | 0 | 0.0% |
| 90 or more Minutes | 15 | 5.3% |
Commute Time by Sex in Midland
The most common commute times in Midland are 20 to 24 minutes (37 commuters, 22.3%) for males and 25 to 29 minutes (34 commuters, 28.6%) for females.
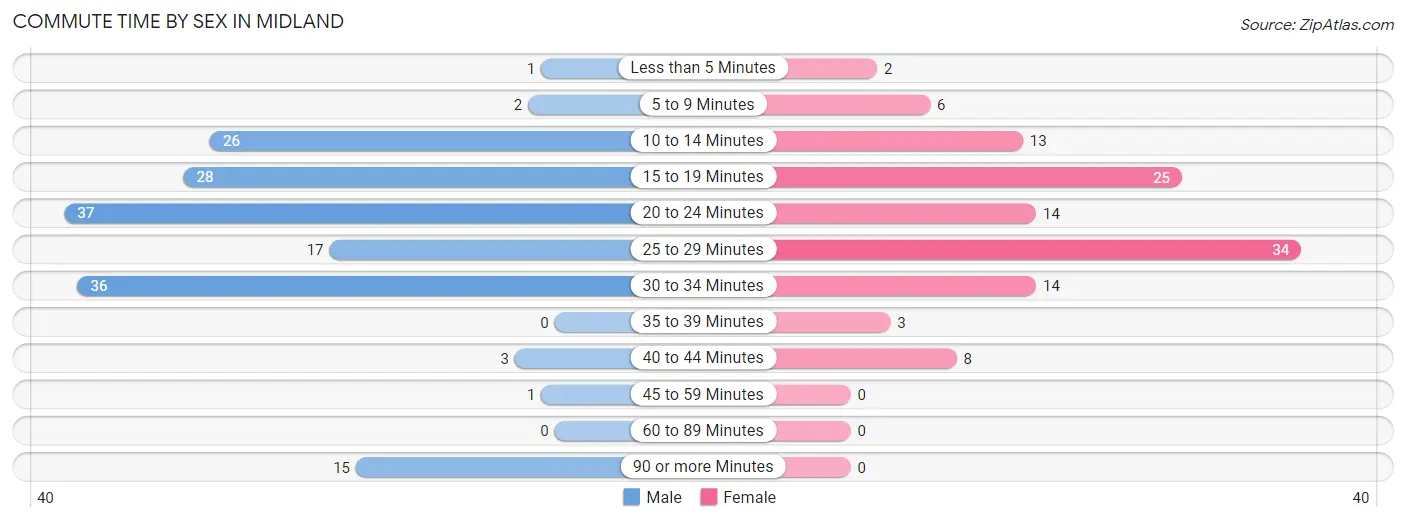
| Commute Time | Male | Female |
| Less than 5 Minutes | 1 (0.6%) | 2 (1.7%) |
| 5 to 9 Minutes | 2 (1.2%) | 6 (5.0%) |
| 10 to 14 Minutes | 26 (15.7%) | 13 (10.9%) |
| 15 to 19 Minutes | 28 (16.9%) | 25 (21.0%) |
| 20 to 24 Minutes | 37 (22.3%) | 14 (11.8%) |
| 25 to 29 Minutes | 17 (10.2%) | 34 (28.6%) |
| 30 to 34 Minutes | 36 (21.7%) | 14 (11.8%) |
| 35 to 39 Minutes | 0 (0.0%) | 3 (2.5%) |
| 40 to 44 Minutes | 3 (1.8%) | 8 (6.7%) |
| 45 to 59 Minutes | 1 (0.6%) | 0 (0.0%) |
| 60 to 89 Minutes | 0 (0.0%) | 0 (0.0%) |
| 90 or more Minutes | 15 (9.0%) | 0 (0.0%) |
Time of Departure to Work by Sex in Midland
The most frequent times of departure to work in Midland are 7:00 AM to 7:29 AM (40, 24.1%) for males and 5:30 AM to 5:59 AM (29, 24.4%) for females.
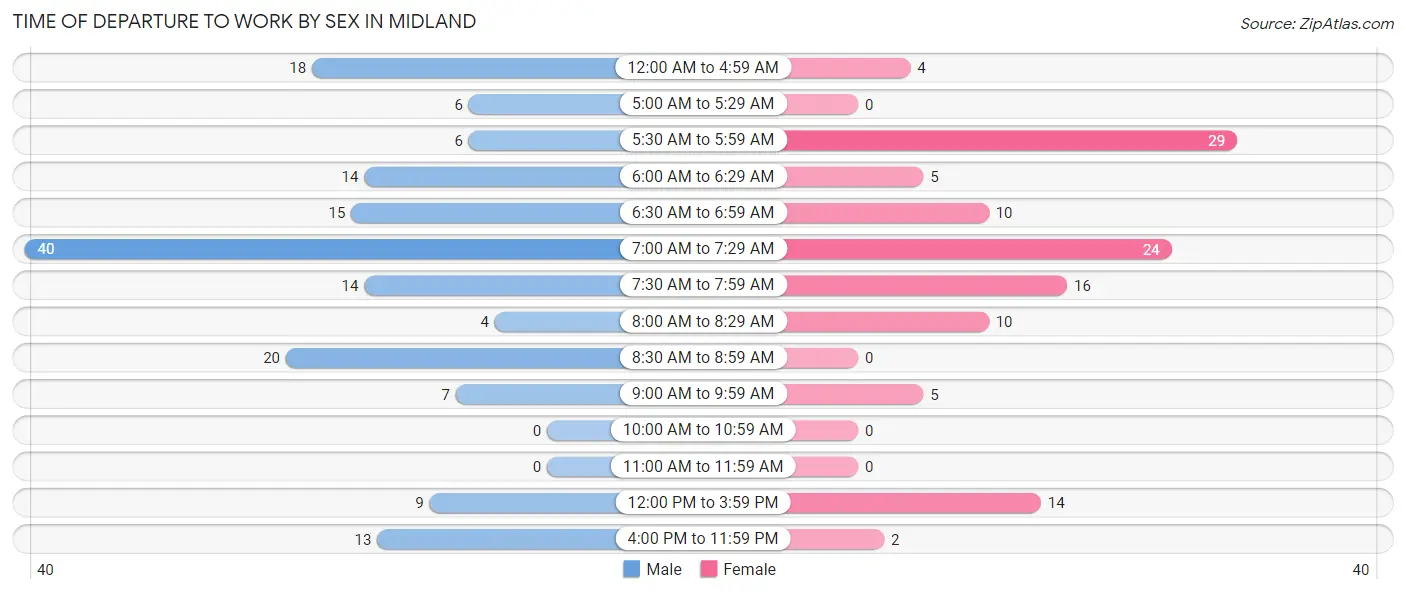
| Time of Departure | Male | Female |
| 12:00 AM to 4:59 AM | 18 (10.8%) | 4 (3.4%) |
| 5:00 AM to 5:29 AM | 6 (3.6%) | 0 (0.0%) |
| 5:30 AM to 5:59 AM | 6 (3.6%) | 29 (24.4%) |
| 6:00 AM to 6:29 AM | 14 (8.4%) | 5 (4.2%) |
| 6:30 AM to 6:59 AM | 15 (9.0%) | 10 (8.4%) |
| 7:00 AM to 7:29 AM | 40 (24.1%) | 24 (20.2%) |
| 7:30 AM to 7:59 AM | 14 (8.4%) | 16 (13.5%) |
| 8:00 AM to 8:29 AM | 4 (2.4%) | 10 (8.4%) |
| 8:30 AM to 8:59 AM | 20 (12.0%) | 0 (0.0%) |
| 9:00 AM to 9:59 AM | 7 (4.2%) | 5 (4.2%) |
| 10:00 AM to 10:59 AM | 0 (0.0%) | 0 (0.0%) |
| 11:00 AM to 11:59 AM | 0 (0.0%) | 0 (0.0%) |
| 12:00 PM to 3:59 PM | 9 (5.4%) | 14 (11.8%) |
| 4:00 PM to 11:59 PM | 13 (7.8%) | 2 (1.7%) |
| Total | 166 (100.0%) | 119 (100.0%) |
Housing Occupancy in Midland
Occupancy by Ownership in Midland
Of the total 241 dwellings in Midland, owner-occupied units account for 148 (61.4%), while renter-occupied units make up 93 (38.6%).
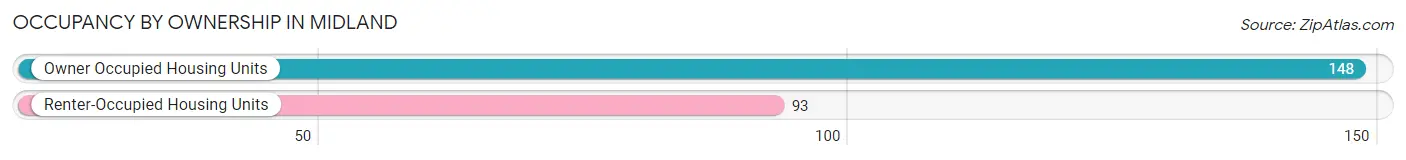
| Occupancy | # Housing Units | % Housing Units |
| Owner Occupied Housing Units | 148 | 61.4% |
| Renter-Occupied Housing Units | 93 | 38.6% |
| Total Occupied Housing Units | 241 | 100.0% |
Occupancy by Household Size in Midland
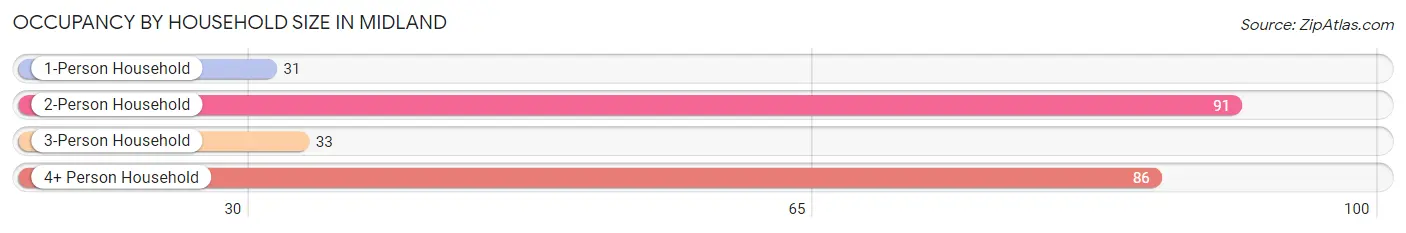
| Household Size | # Housing Units | % Housing Units |
| 1-Person Household | 31 | 12.9% |
| 2-Person Household | 91 | 37.8% |
| 3-Person Household | 33 | 13.7% |
| 4+ Person Household | 86 | 35.7% |
| Total Housing Units | 241 | 100.0% |
Occupancy by Ownership by Household Size in Midland
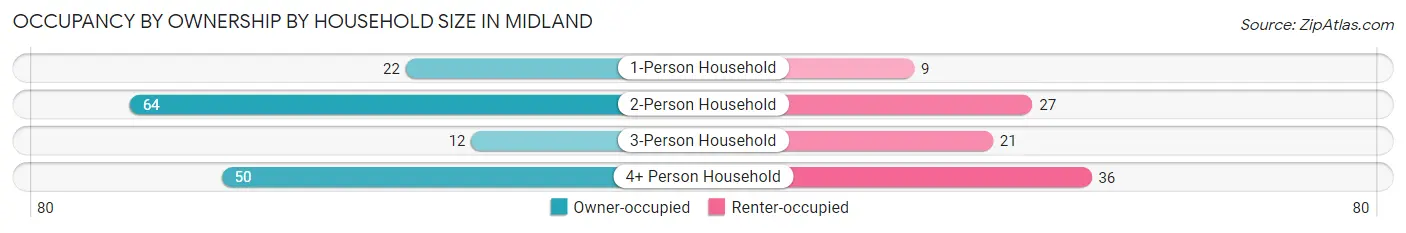
| Household Size | Owner-occupied | Renter-occupied |
| 1-Person Household | 22 (71.0%) | 9 (29.0%) |
| 2-Person Household | 64 (70.3%) | 27 (29.7%) |
| 3-Person Household | 12 (36.4%) | 21 (63.6%) |
| 4+ Person Household | 50 (58.1%) | 36 (41.9%) |
| Total Housing Units | 148 (61.4%) | 93 (38.6%) |
Occupancy by Educational Attainment in Midland
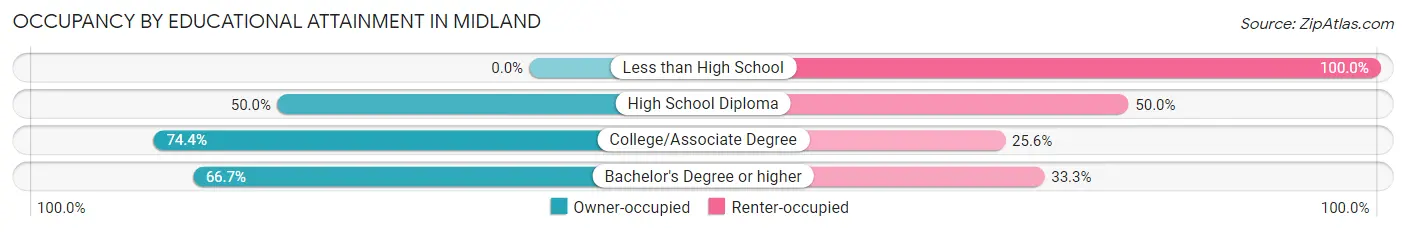
| Household Size | Owner-occupied | Renter-occupied |
| Less than High School | 0 (0.0%) | 8 (100.0%) |
| High School Diploma | 43 (50.0%) | 43 (50.0%) |
| College/Associate Degree | 67 (74.4%) | 23 (25.6%) |
| Bachelor's Degree or higher | 38 (66.7%) | 19 (33.3%) |
Occupancy by Age of Householder in Midland
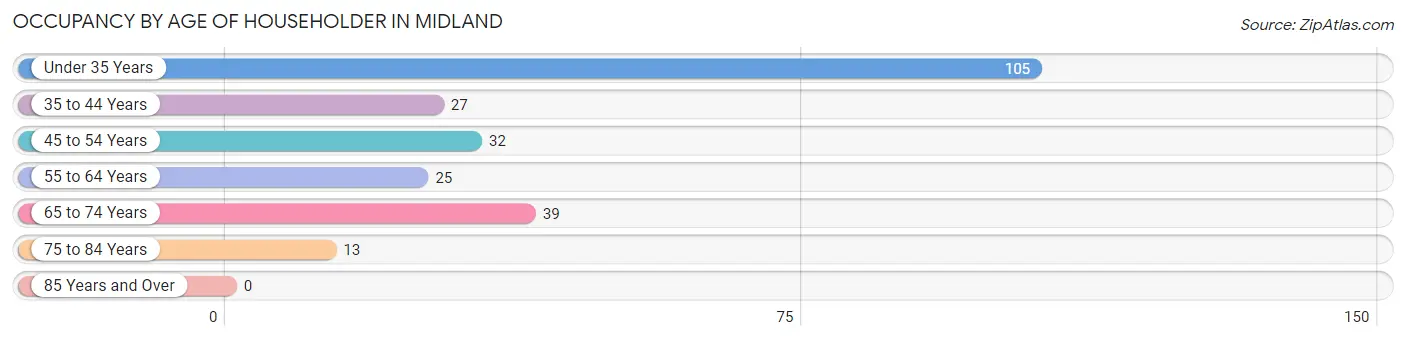
| Age Bracket | # Households | % Households |
| Under 35 Years | 105 | 43.6% |
| 35 to 44 Years | 27 | 11.2% |
| 45 to 54 Years | 32 | 13.3% |
| 55 to 64 Years | 25 | 10.4% |
| 65 to 74 Years | 39 | 16.2% |
| 75 to 84 Years | 13 | 5.4% |
| 85 Years and Over | 0 | 0.0% |
| Total | 241 | 100.0% |
Housing Finances in Midland
Median Income by Occupancy in Midland
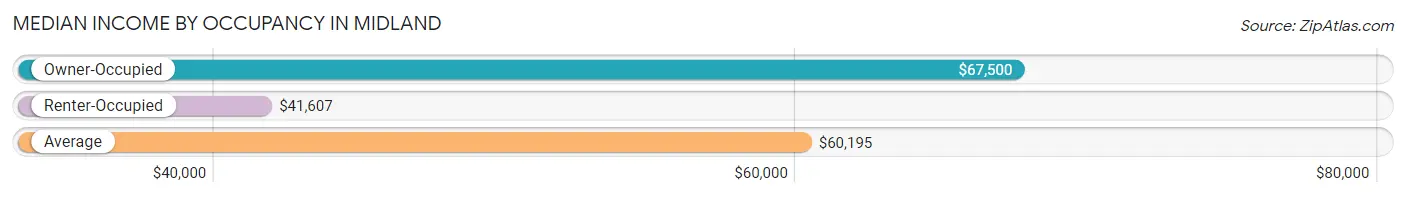
| Occupancy Type | # Households | Median Income |
| Owner-Occupied | 148 (61.4%) | $67,500 |
| Renter-Occupied | 93 (38.6%) | $41,607 |
| Average | 241 (100.0%) | $60,195 |
Occupancy by Householder Income Bracket in Midland
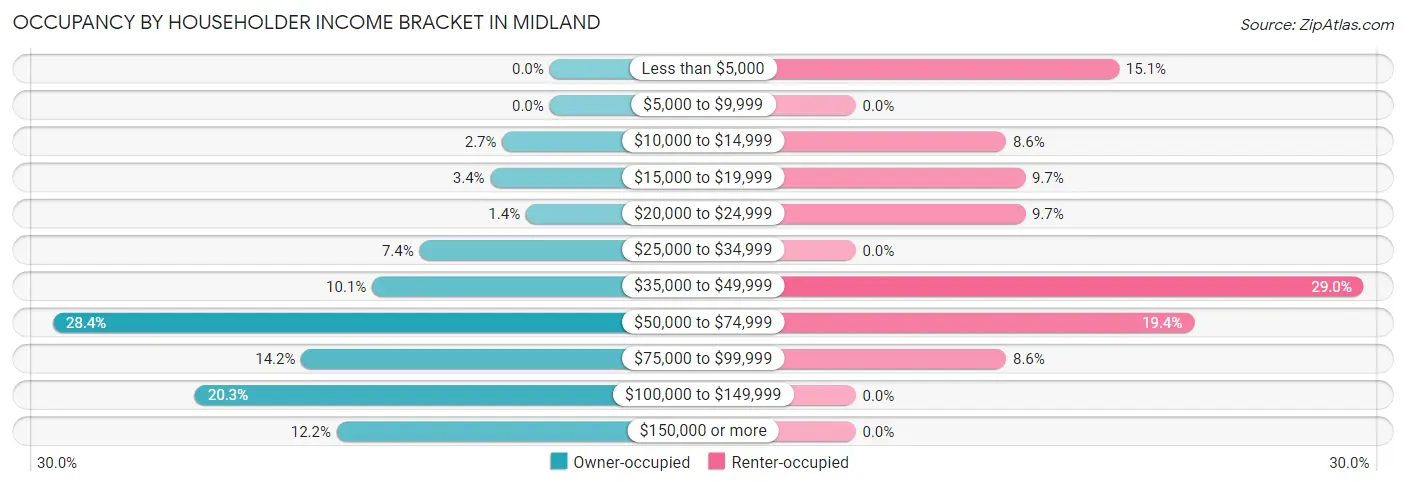
| Income Bracket | Owner-occupied | Renter-occupied |
| Less than $5,000 | 0 (0.0%) | 14 (15.0%) |
| $5,000 to $9,999 | 0 (0.0%) | 0 (0.0%) |
| $10,000 to $14,999 | 4 (2.7%) | 8 (8.6%) |
| $15,000 to $19,999 | 5 (3.4%) | 9 (9.7%) |
| $20,000 to $24,999 | 2 (1.3%) | 9 (9.7%) |
| $25,000 to $34,999 | 11 (7.4%) | 0 (0.0%) |
| $35,000 to $49,999 | 15 (10.1%) | 27 (29.0%) |
| $50,000 to $74,999 | 42 (28.4%) | 18 (19.4%) |
| $75,000 to $99,999 | 21 (14.2%) | 8 (8.6%) |
| $100,000 to $149,999 | 30 (20.3%) | 0 (0.0%) |
| $150,000 or more | 18 (12.2%) | 0 (0.0%) |
| Total | 148 (100.0%) | 93 (100.0%) |
Monthly Housing Cost Tiers in Midland
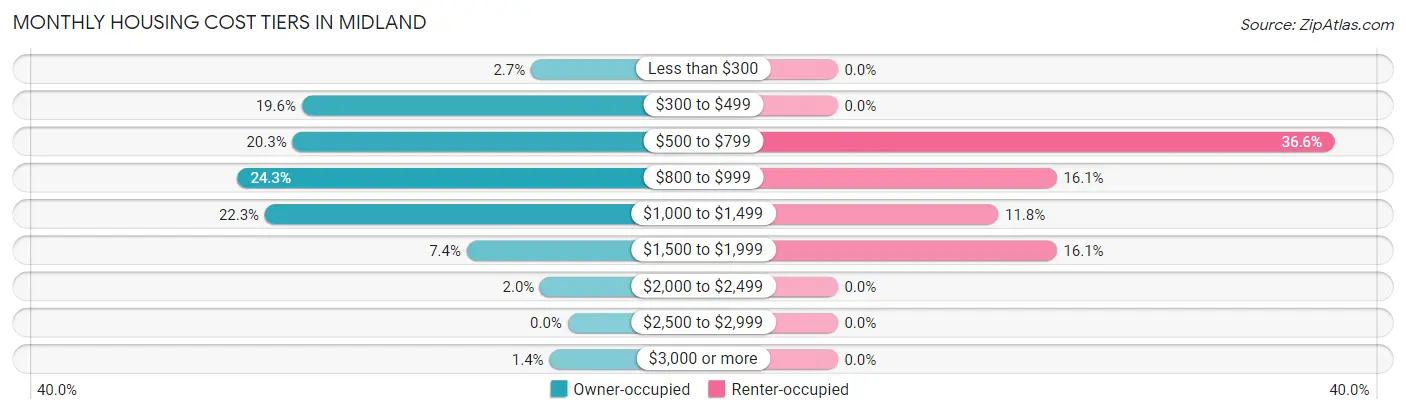
| Monthly Cost | Owner-occupied | Renter-occupied |
| Less than $300 | 4 (2.7%) | 0 (0.0%) |
| $300 to $499 | 29 (19.6%) | 0 (0.0%) |
| $500 to $799 | 30 (20.3%) | 34 (36.6%) |
| $800 to $999 | 36 (24.3%) | 15 (16.1%) |
| $1,000 to $1,499 | 33 (22.3%) | 11 (11.8%) |
| $1,500 to $1,999 | 11 (7.4%) | 15 (16.1%) |
| $2,000 to $2,499 | 3 (2.0%) | 0 (0.0%) |
| $2,500 to $2,999 | 0 (0.0%) | 0 (0.0%) |
| $3,000 or more | 2 (1.3%) | 0 (0.0%) |
| Total | 148 (100.0%) | 93 (100.0%) |
Physical Housing Characteristics in Midland
Housing Structures in Midland
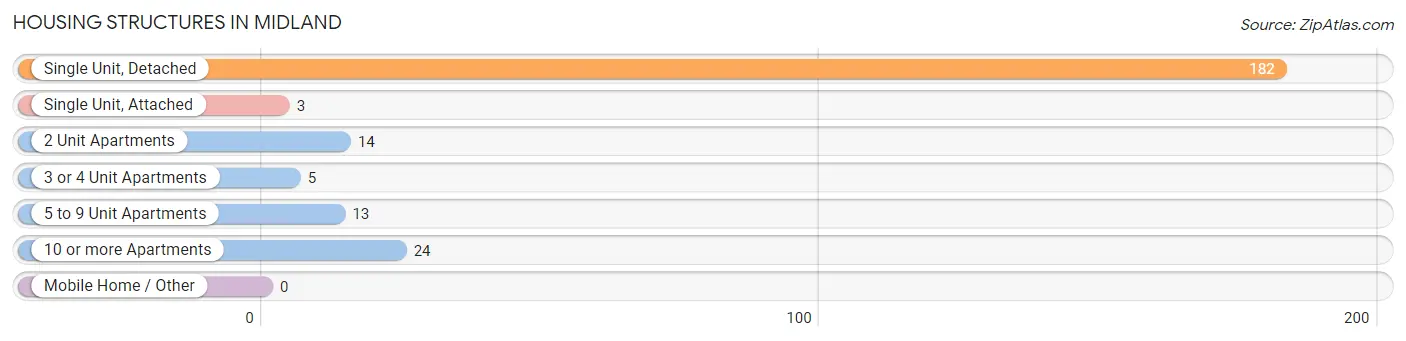
| Structure Type | # Housing Units | % Housing Units |
| Single Unit, Detached | 182 | 75.5% |
| Single Unit, Attached | 3 | 1.2% |
| 2 Unit Apartments | 14 | 5.8% |
| 3 or 4 Unit Apartments | 5 | 2.1% |
| 5 to 9 Unit Apartments | 13 | 5.4% |
| 10 or more Apartments | 24 | 10.0% |
| Mobile Home / Other | 0 | 0.0% |
| Total | 241 | 100.0% |
Housing Structures by Occupancy in Midland
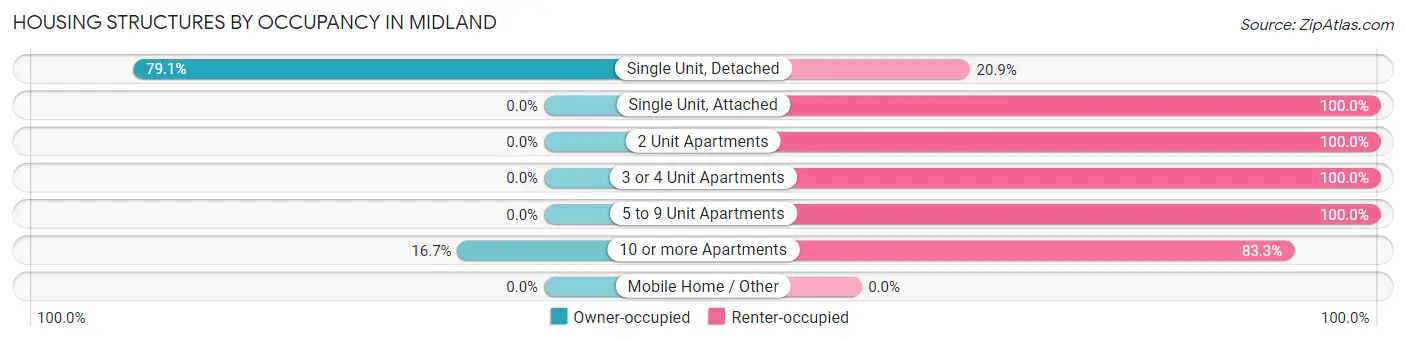
| Structure Type | Owner-occupied | Renter-occupied |
| Single Unit, Detached | 144 (79.1%) | 38 (20.9%) |
| Single Unit, Attached | 0 (0.0%) | 3 (100.0%) |
| 2 Unit Apartments | 0 (0.0%) | 14 (100.0%) |
| 3 or 4 Unit Apartments | 0 (0.0%) | 5 (100.0%) |
| 5 to 9 Unit Apartments | 0 (0.0%) | 13 (100.0%) |
| 10 or more Apartments | 4 (16.7%) | 20 (83.3%) |
| Mobile Home / Other | 0 (0.0%) | 0 (0.0%) |
| Total | 148 (61.4%) | 93 (38.6%) |
Housing Structures by Number of Rooms in Midland
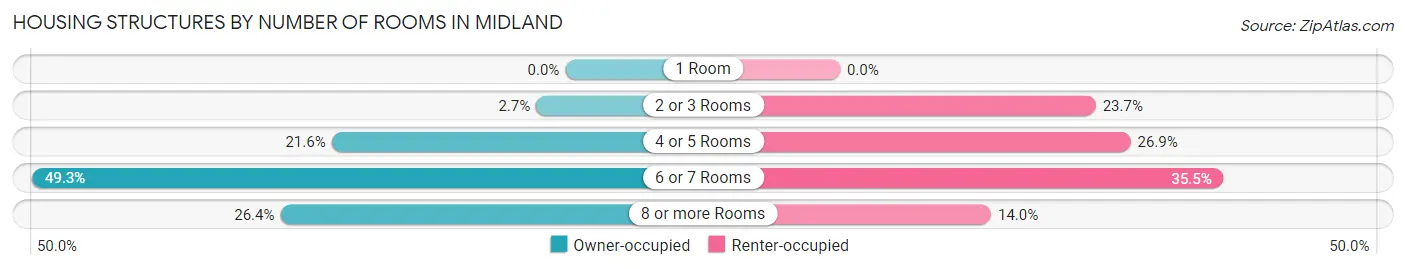
| Number of Rooms | Owner-occupied | Renter-occupied |
| 1 Room | 0 (0.0%) | 0 (0.0%) |
| 2 or 3 Rooms | 4 (2.7%) | 22 (23.7%) |
| 4 or 5 Rooms | 32 (21.6%) | 25 (26.9%) |
| 6 or 7 Rooms | 73 (49.3%) | 33 (35.5%) |
| 8 or more Rooms | 39 (26.4%) | 13 (14.0%) |
| Total | 148 (100.0%) | 93 (100.0%) |
Housing Structure by Heating Type in Midland
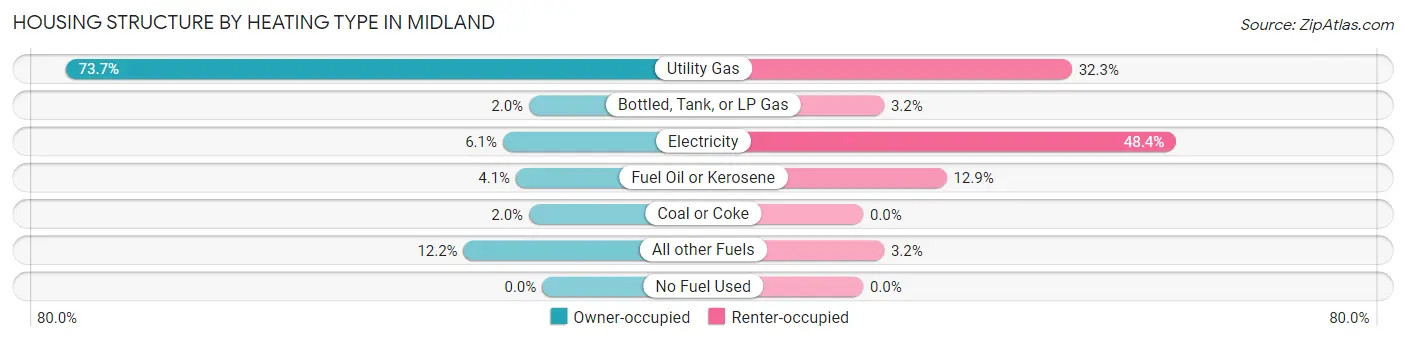
| Heating Type | Owner-occupied | Renter-occupied |
| Utility Gas | 109 (73.7%) | 30 (32.3%) |
| Bottled, Tank, or LP Gas | 3 (2.0%) | 3 (3.2%) |
| Electricity | 9 (6.1%) | 45 (48.4%) |
| Fuel Oil or Kerosene | 6 (4.1%) | 12 (12.9%) |
| Coal or Coke | 3 (2.0%) | 0 (0.0%) |
| All other Fuels | 18 (12.2%) | 3 (3.2%) |
| No Fuel Used | 0 (0.0%) | 0 (0.0%) |
| Total | 148 (100.0%) | 93 (100.0%) |
Household Vehicle Usage in Midland
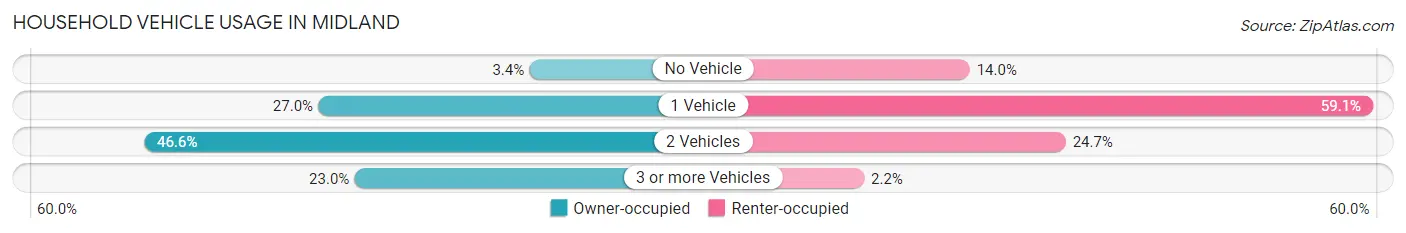
| Vehicles per Household | Owner-occupied | Renter-occupied |
| No Vehicle | 5 (3.4%) | 13 (14.0%) |
| 1 Vehicle | 40 (27.0%) | 55 (59.1%) |
| 2 Vehicles | 69 (46.6%) | 23 (24.7%) |
| 3 or more Vehicles | 34 (23.0%) | 2 (2.1%) |
| Total | 148 (100.0%) | 93 (100.0%) |
Real Estate & Mortgages in Midland
Real Estate and Mortgage Overview in Midland
| Characteristic | Without Mortgage | With Mortgage |
| Housing Units | 50 | 98 |
| Median Property Value | $105,000 | $126,500 |
| Median Household Income | $96,389 | $6 |
| Monthly Housing Costs | $447 | $2 |
| Real Estate Taxes | $1,206 | $7 |
Property Value by Mortgage Status in Midland
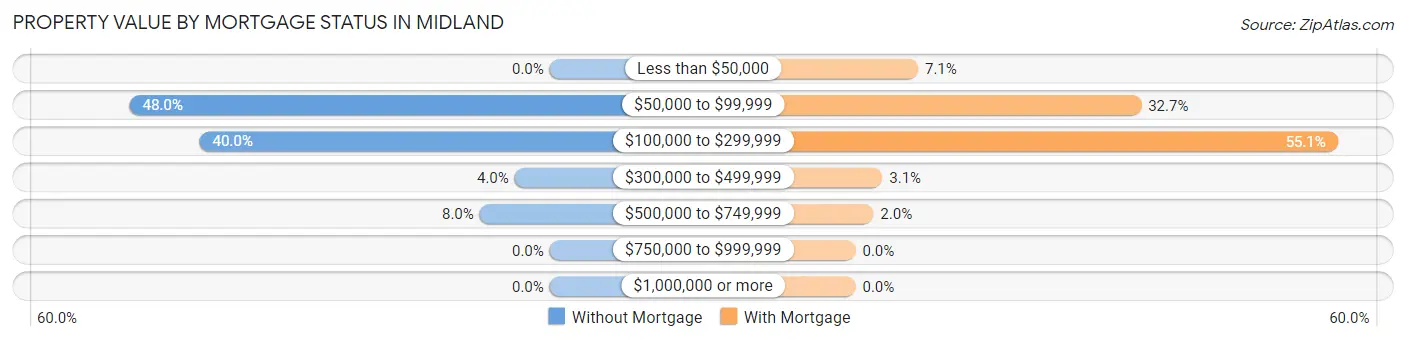
| Property Value | Without Mortgage | With Mortgage |
| Less than $50,000 | 0 (0.0%) | 7 (7.1%) |
| $50,000 to $99,999 | 24 (48.0%) | 32 (32.7%) |
| $100,000 to $299,999 | 20 (40.0%) | 54 (55.1%) |
| $300,000 to $499,999 | 2 (4.0%) | 3 (3.1%) |
| $500,000 to $749,999 | 4 (8.0%) | 2 (2.0%) |
| $750,000 to $999,999 | 0 (0.0%) | 0 (0.0%) |
| $1,000,000 or more | 0 (0.0%) | 0 (0.0%) |
| Total | 50 (100.0%) | 98 (100.0%) |
Household Income by Mortgage Status in Midland
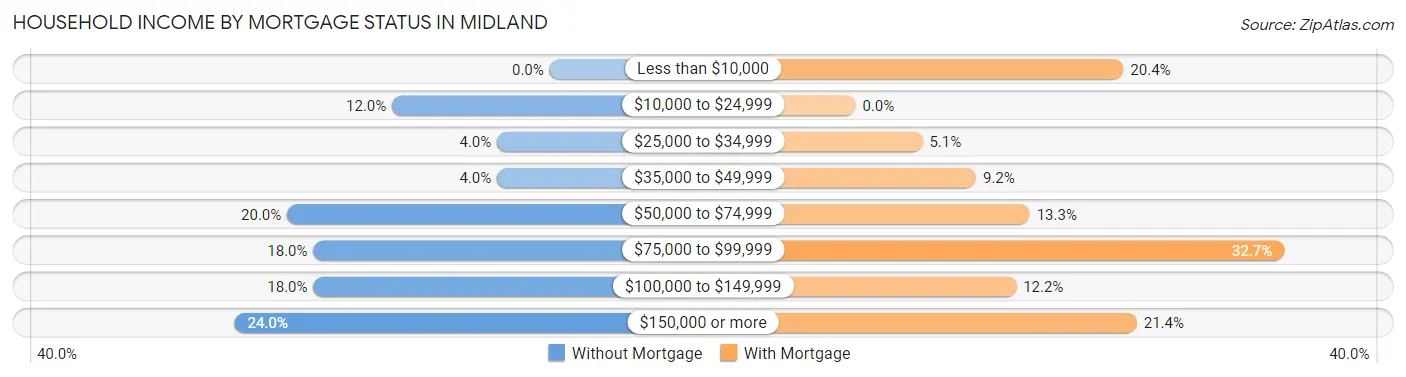
| Household Income | Without Mortgage | With Mortgage |
| Less than $10,000 | 0 (0.0%) | 20 (20.4%) |
| $10,000 to $24,999 | 6 (12.0%) | 0 (0.0%) |
| $25,000 to $34,999 | 2 (4.0%) | 5 (5.1%) |
| $35,000 to $49,999 | 2 (4.0%) | 9 (9.2%) |
| $50,000 to $74,999 | 10 (20.0%) | 13 (13.3%) |
| $75,000 to $99,999 | 9 (18.0%) | 32 (32.7%) |
| $100,000 to $149,999 | 9 (18.0%) | 12 (12.2%) |
| $150,000 or more | 12 (24.0%) | 21 (21.4%) |
| Total | 50 (100.0%) | 98 (100.0%) |
Property Value to Household Income Ratio in Midland
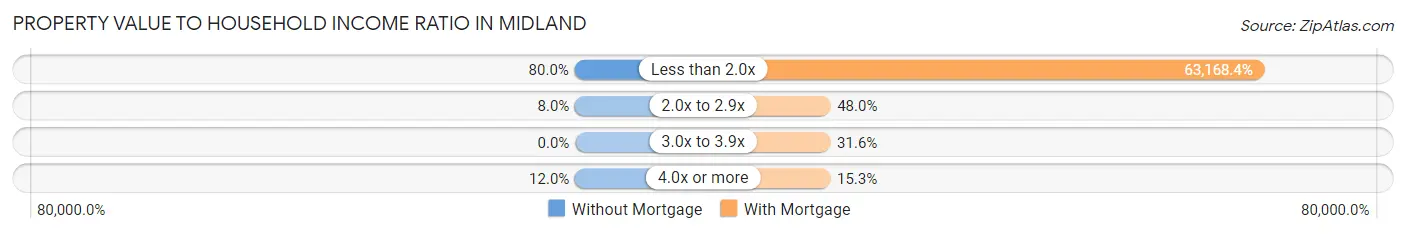
| Value-to-Income Ratio | Without Mortgage | With Mortgage |
| Less than 2.0x | 40 (80.0%) | 61,905 (63,168.4%) |
| 2.0x to 2.9x | 4 (8.0%) | 47 (48.0%) |
| 3.0x to 3.9x | 0 (0.0%) | 31 (31.6%) |
| 4.0x or more | 6 (12.0%) | 15 (15.3%) |
| Total | 50 (100.0%) | 98 (100.0%) |
Real Estate Taxes by Mortgage Status in Midland
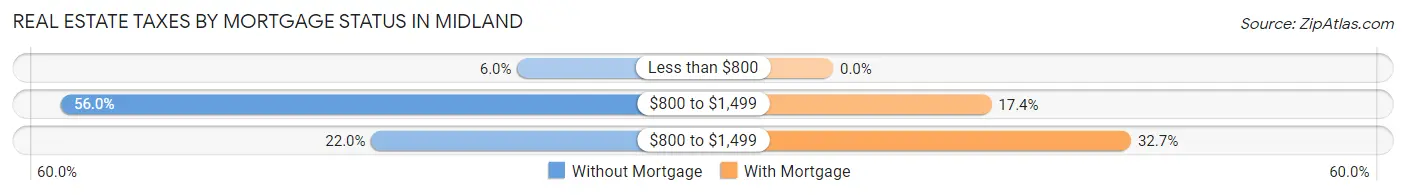
| Property Taxes | Without Mortgage | With Mortgage |
| Less than $800 | 3 (6.0%) | 0 (0.0%) |
| $800 to $1,499 | 28 (56.0%) | 17 (17.3%) |
| $800 to $1,499 | 11 (22.0%) | 32 (32.7%) |
| Total | 50 (100.0%) | 98 (100.0%) |
Health & Disability in Midland
Health Insurance Coverage by Age in Midland
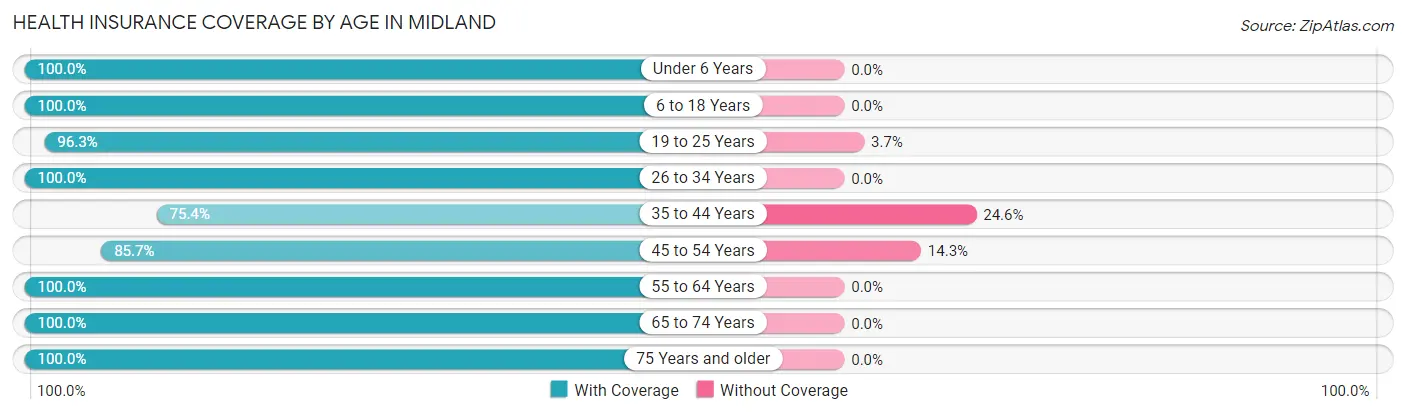
| Age Bracket | With Coverage | Without Coverage |
| Under 6 Years | 120 (100.0%) | 0 (0.0%) |
| 6 to 18 Years | 156 (100.0%) | 0 (0.0%) |
| 19 to 25 Years | 78 (96.3%) | 3 (3.7%) |
| 26 to 34 Years | 99 (100.0%) | 0 (0.0%) |
| 35 to 44 Years | 49 (75.4%) | 16 (24.6%) |
| 45 to 54 Years | 36 (85.7%) | 6 (14.3%) |
| 55 to 64 Years | 68 (100.0%) | 0 (0.0%) |
| 65 to 74 Years | 55 (100.0%) | 0 (0.0%) |
| 75 Years and older | 13 (100.0%) | 0 (0.0%) |
| Total | 674 (96.4%) | 25 (3.6%) |
Health Insurance Coverage by Citizenship Status in Midland
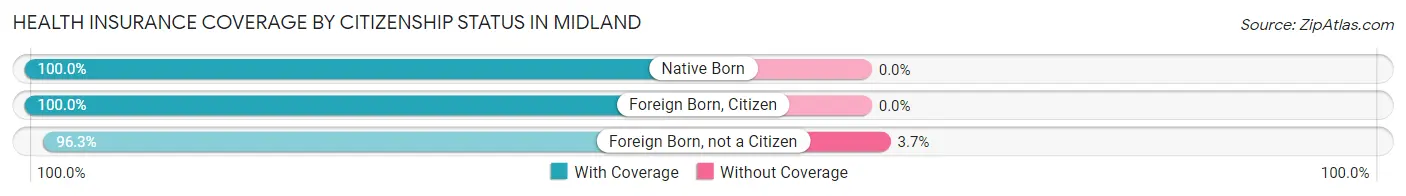
| Citizenship Status | With Coverage | Without Coverage |
| Native Born | 120 (100.0%) | 0 (0.0%) |
| Foreign Born, Citizen | 156 (100.0%) | 0 (0.0%) |
| Foreign Born, not a Citizen | 78 (96.3%) | 3 (3.7%) |
Health Insurance Coverage by Household Income in Midland
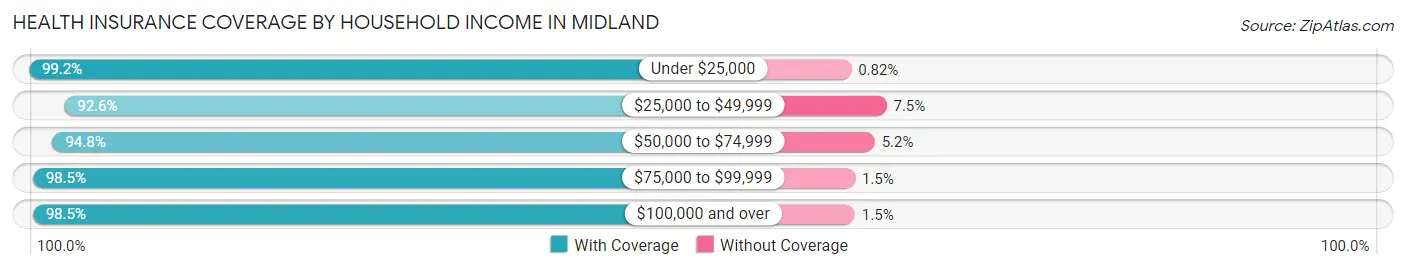
| Household Income | With Coverage | Without Coverage |
| Under $25,000 | 121 (99.2%) | 1 (0.8%) |
| $25,000 to $49,999 | 149 (92.5%) | 12 (7.4%) |
| $50,000 to $74,999 | 145 (94.8%) | 8 (5.2%) |
| $75,000 to $99,999 | 129 (98.5%) | 2 (1.5%) |
| $100,000 and over | 130 (98.5%) | 2 (1.5%) |
Public vs Private Health Insurance Coverage by Age in Midland
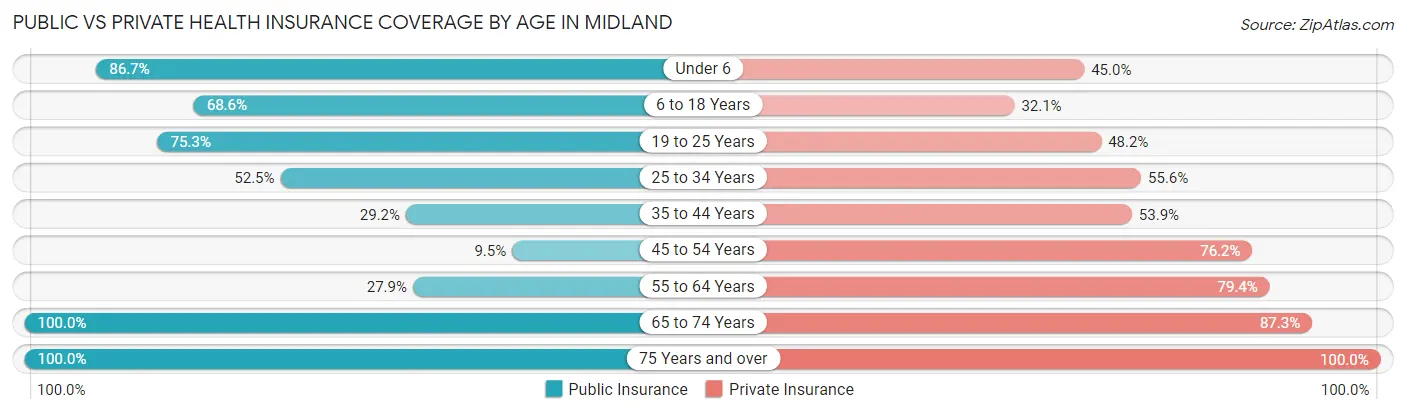
| Age Bracket | Public Insurance | Private Insurance |
| Under 6 | 104 (86.7%) | 54 (45.0%) |
| 6 to 18 Years | 107 (68.6%) | 50 (32.1%) |
| 19 to 25 Years | 61 (75.3%) | 39 (48.1%) |
| 25 to 34 Years | 52 (52.5%) | 55 (55.6%) |
| 35 to 44 Years | 19 (29.2%) | 35 (53.8%) |
| 45 to 54 Years | 4 (9.5%) | 32 (76.2%) |
| 55 to 64 Years | 19 (27.9%) | 54 (79.4%) |
| 65 to 74 Years | 55 (100.0%) | 48 (87.3%) |
| 75 Years and over | 13 (100.0%) | 13 (100.0%) |
| Total | 434 (62.1%) | 380 (54.4%) |
Disability Status by Sex by Age in Midland
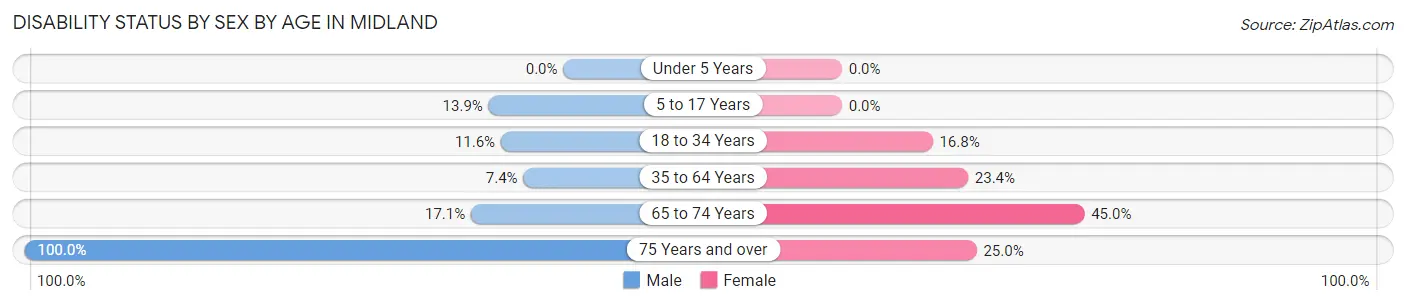
| Age Bracket | Male | Female |
| Under 5 Years | 0 (0.0%) | 0 (0.0%) |
| 5 to 17 Years | 14 (13.9%) | 0 (0.0%) |
| 18 to 34 Years | 11 (11.6%) | 17 (16.8%) |
| 35 to 64 Years | 6 (7.4%) | 22 (23.4%) |
| 65 to 74 Years | 6 (17.1%) | 9 (45.0%) |
| 75 Years and over | 5 (100.0%) | 2 (25.0%) |
Disability Class by Sex by Age in Midland
Disability Class: Hearing Difficulty
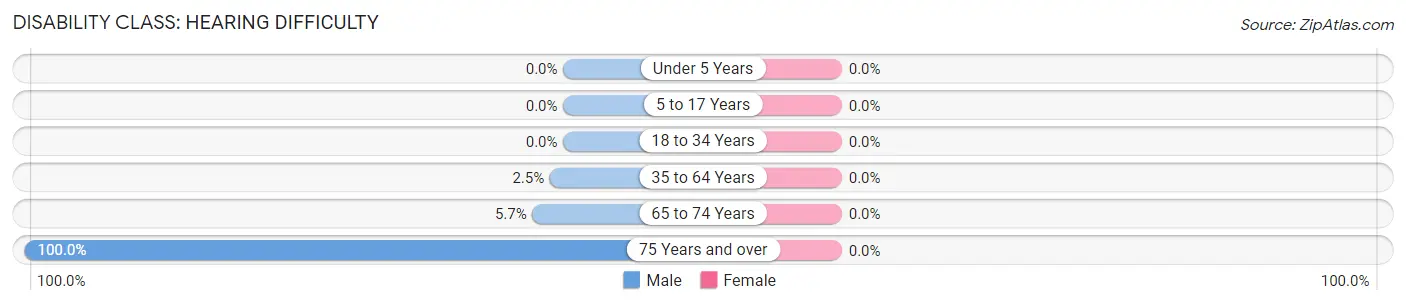
| Age Bracket | Male | Female |
| Under 5 Years | 0 (0.0%) | 0 (0.0%) |
| 5 to 17 Years | 0 (0.0%) | 0 (0.0%) |
| 18 to 34 Years | 0 (0.0%) | 0 (0.0%) |
| 35 to 64 Years | 2 (2.5%) | 0 (0.0%) |
| 65 to 74 Years | 2 (5.7%) | 0 (0.0%) |
| 75 Years and over | 5 (100.0%) | 0 (0.0%) |
Disability Class: Vision Difficulty
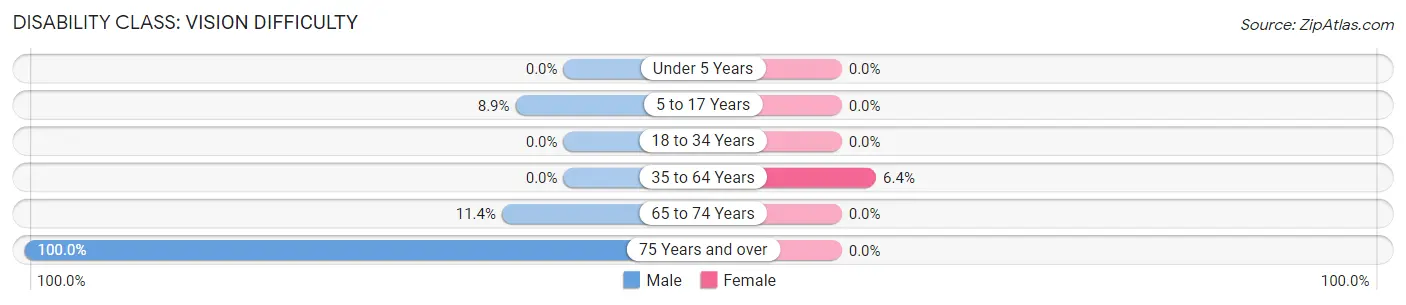
| Age Bracket | Male | Female |
| Under 5 Years | 0 (0.0%) | 0 (0.0%) |
| 5 to 17 Years | 9 (8.9%) | 0 (0.0%) |
| 18 to 34 Years | 0 (0.0%) | 0 (0.0%) |
| 35 to 64 Years | 0 (0.0%) | 6 (6.4%) |
| 65 to 74 Years | 4 (11.4%) | 0 (0.0%) |
| 75 Years and over | 5 (100.0%) | 0 (0.0%) |
Disability Class: Cognitive Difficulty
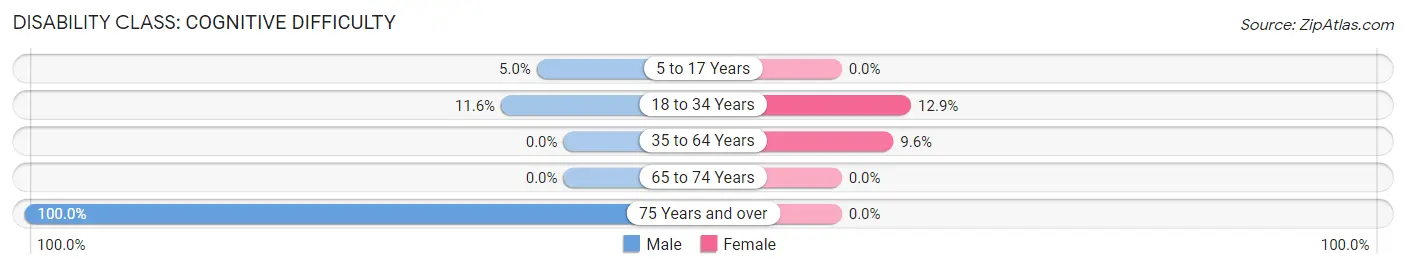
| Age Bracket | Male | Female |
| 5 to 17 Years | 5 (5.0%) | 0 (0.0%) |
| 18 to 34 Years | 11 (11.6%) | 13 (12.9%) |
| 35 to 64 Years | 0 (0.0%) | 9 (9.6%) |
| 65 to 74 Years | 0 (0.0%) | 0 (0.0%) |
| 75 Years and over | 5 (100.0%) | 0 (0.0%) |
Disability Class: Ambulatory Difficulty
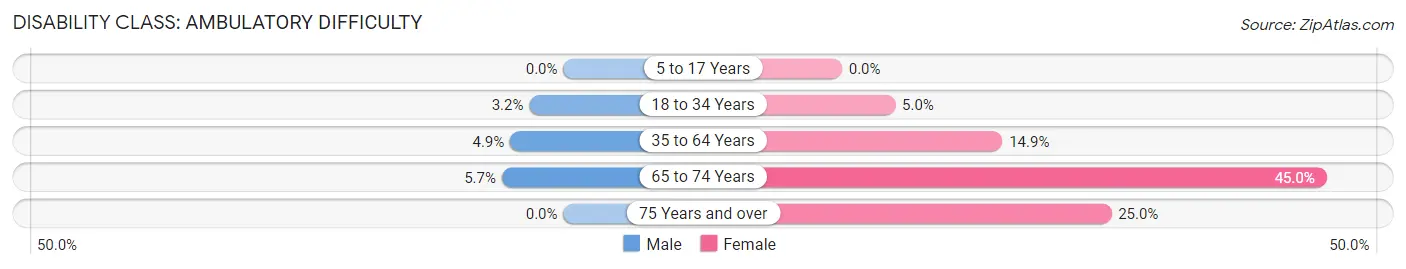
| Age Bracket | Male | Female |
| 5 to 17 Years | 0 (0.0%) | 0 (0.0%) |
| 18 to 34 Years | 3 (3.2%) | 5 (5.0%) |
| 35 to 64 Years | 4 (4.9%) | 14 (14.9%) |
| 65 to 74 Years | 2 (5.7%) | 9 (45.0%) |
| 75 Years and over | 0 (0.0%) | 2 (25.0%) |
Disability Class: Self-Care Difficulty
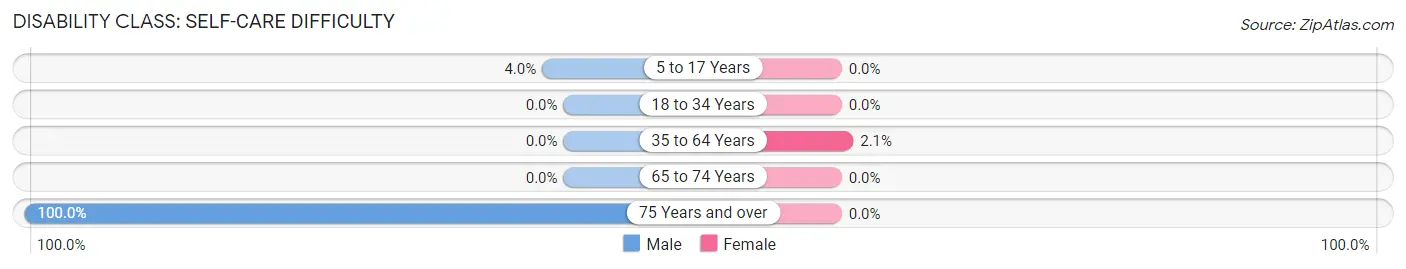
| Age Bracket | Male | Female |
| 5 to 17 Years | 4 (4.0%) | 0 (0.0%) |
| 18 to 34 Years | 0 (0.0%) | 0 (0.0%) |
| 35 to 64 Years | 0 (0.0%) | 2 (2.1%) |
| 65 to 74 Years | 0 (0.0%) | 0 (0.0%) |
| 75 Years and over | 5 (100.0%) | 0 (0.0%) |
Technology Access in Midland
Computing Device Access in Midland
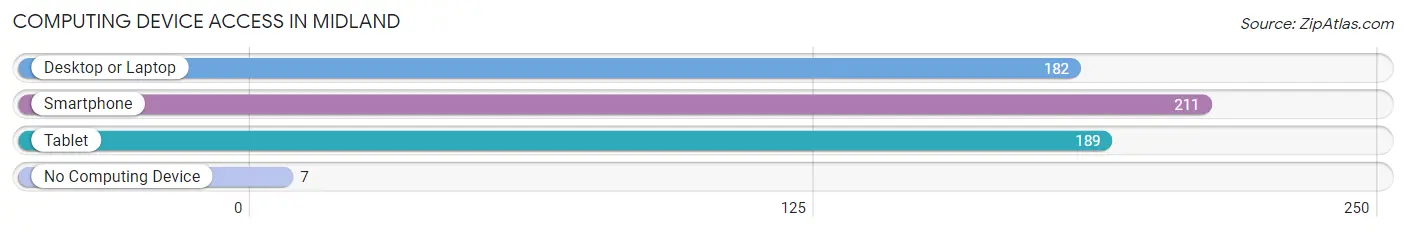
| Device Type | # Households | % Households |
| Desktop or Laptop | 182 | 75.5% |
| Smartphone | 211 | 87.5% |
| Tablet | 189 | 78.4% |
| No Computing Device | 7 | 2.9% |
| Total | 241 | 100.0% |
Internet Access in Midland
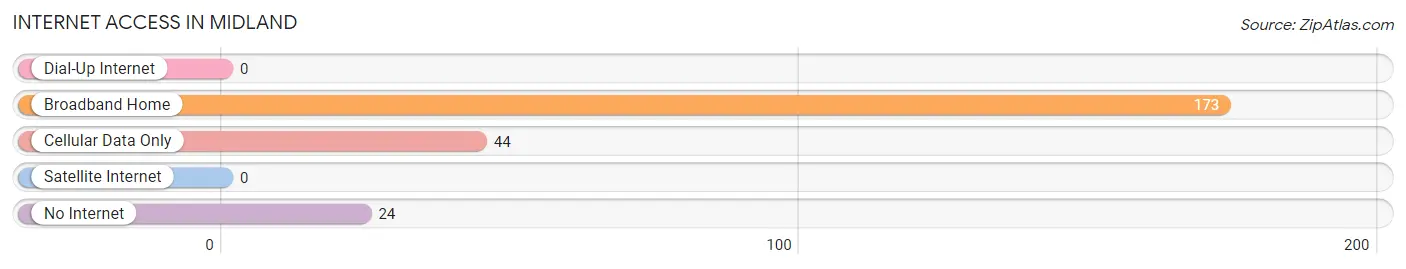
| Internet Type | # Households | % Households |
| Dial-Up Internet | 0 | 0.0% |
| Broadband Home | 173 | 71.8% |
| Cellular Data Only | 44 | 18.3% |
| Satellite Internet | 0 | 0.0% |
| No Internet | 24 | 10.0% |
| Total | 241 | 100.0% |
Midland Summary
Midland, Maryland is a small town located in Washington County, Maryland. It is situated on the Potomac River, just south of the city of Hagerstown. The town has a population of approximately 1,500 people and is part of the Hagerstown-Martinsburg Metropolitan Statistical Area.
History
Midland was first settled in 1750 by German immigrants who were looking for a place to settle and farm. The town was originally known as “Midland Station” and was a stop on the Baltimore and Ohio Railroad. The town was officially incorporated in 1872 and was named after the Midland Railroad.
The town was a major hub for the railroad industry and was home to several factories and mills. The town was also home to a large number of coal mines, which provided employment for many of the town’s residents.
In the early 20th century, Midland was a popular tourist destination due to its proximity to the Potomac River. The town was home to several resorts and hotels, as well as a number of amusement parks.
Geography
Midland is located in Washington County, Maryland, on the Potomac River. The town is situated on the western edge of the Appalachian Mountains and is surrounded by rolling hills and forests. The town is located approximately 30 miles south of Hagerstown and is part of the Hagerstown-Martinsburg Metropolitan Statistical Area.
The town is located at an elevation of approximately 1,000 feet and has a total area of 1.2 square miles. The town is located in a humid subtropical climate zone and experiences hot, humid summers and cold, wet winters.
Economy
Midland’s economy is largely based on tourism and agriculture. The town is home to several resorts and hotels, as well as a number of amusement parks. The town is also home to several farms, which produce a variety of crops, including corn, soybeans, and wheat.
The town is also home to several manufacturing companies, which produce a variety of products, including furniture, clothing, and electronics. The town is also home to a number of small businesses, including restaurants, shops, and services.
Demographics
As of the 2010 census, Midland had a population of 1,500 people. The town has a median household income of $45,000 and a median family income of $50,000. The town is predominantly white, with approximately 90% of the population being white. The town also has a small Hispanic population, with approximately 5% of the population being Hispanic.
The town is home to a number of churches, including the Midland United Methodist Church, the Midland Presbyterian Church, and the Midland Baptist Church. The town is also home to a number of schools, including Midland Elementary School, Midland Middle School, and Midland High School.
Common Questions
What is Per Capita Income in Midland?
Per Capita income in Midland is $23,008.
What is the Median Family Income in Midland?
Median Family Income in Midland is $60,139.
What is the Median Household income in Midland?
Median Household Income in Midland is $60,195.
What is Income or Wage Gap in Midland?
Income or Wage Gap in Midland is 49.3%.
Women in Midland earn 50.7 cents for every dollar earned by a man.
What is Inequality or Gini Index in Midland?
Inequality or Gini Index in Midland is 0.41.
What is the Total Population of Midland?
Total Population of Midland is 699.
What is the Total Male Population of Midland?
Total Male Population of Midland is 383.
What is the Total Female Population of Midland?
Total Female Population of Midland is 316.
What is the Ratio of Males per 100 Females in Midland?
There are 121.20 Males per 100 Females in Midland.
What is the Ratio of Females per 100 Males in Midland?
There are 82.51 Females per 100 Males in Midland.
What is the Median Population Age in Midland?
Median Population Age in Midland is 25.6 Years.
What is the Average Family Size in Midland
Average Family Size in Midland is 3.1 People.
What is the Average Household Size in Midland
Average Household Size in Midland is 2.9 People.
How Large is the Labor Force in Midland?
There are 317 People in the Labor Forcein in Midland.
What is the Percentage of People in the Labor Force in Midland?
69.1% of People are in the Labor Force in Midland.
What is the Unemployment Rate in Midland?
Unemployment Rate in Midland is 8.5%.