Snow Hill, MD Map & Demographics
Snow Hill Map
Snow Hill Overview
$28,224
PER CAPITA INCOME
$64,563
AVG FAMILY INCOME
$51,667
AVG HOUSEHOLD INCOME
1.7%
WAGE / INCOME GAP [ % ]
98.3¢/ $1
WAGE / INCOME GAP [ $ ]
0.47
INEQUALITY / GINI INDEX
2,359
TOTAL POPULATION
1,215
MALE POPULATION
1,144
FEMALE POPULATION
106.21
MALES / 100 FEMALES
94.16
FEMALES / 100 MALES
39.2
MEDIAN AGE
3.4
AVG FAMILY SIZE
2.5
AVG HOUSEHOLD SIZE
1,257
LABOR FORCE [ PEOPLE ]
67.7%
PERCENT IN LABOR FORCE
10.4%
UNEMPLOYMENT RATE
Snow Hill Zip Codes
Income in Snow Hill
Income Overview in Snow Hill
Per Capita Income in Snow Hill is $28,224, while median incomes of families and households are $64,563 and $51,667 respectively.
| Characteristic | Number | Measure |
| Per Capita Income | 2,359 | $28,224 |
| Median Family Income | 503 | $64,563 |
| Mean Family Income | 503 | $88,217 |
| Median Household Income | 900 | $51,667 |
| Mean Household Income | 900 | $71,956 |
| Income Deficit | 503 | $0 |
| Wage / Income Gap (%) | 2,359 | 1.68% |
| Wage / Income Gap ($) | 2,359 | 98.32¢ per $1 |
| Gini / Inequality Index | 2,359 | 0.47 |
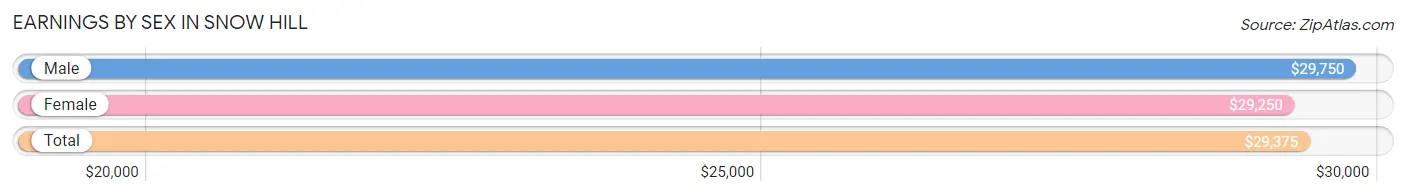
Earnings by Sex in Snow Hill
Average Earnings in Snow Hill are $29,375, $29,750 for men and $29,250 for women, a difference of 1.7%.
| Sex | Number | Average Earnings |
| Male | 620 (49.0%) | $29,750 |
| Female | 644 (50.9%) | $29,250 |
| Total | 1,264 (100.0%) | $29,375 |
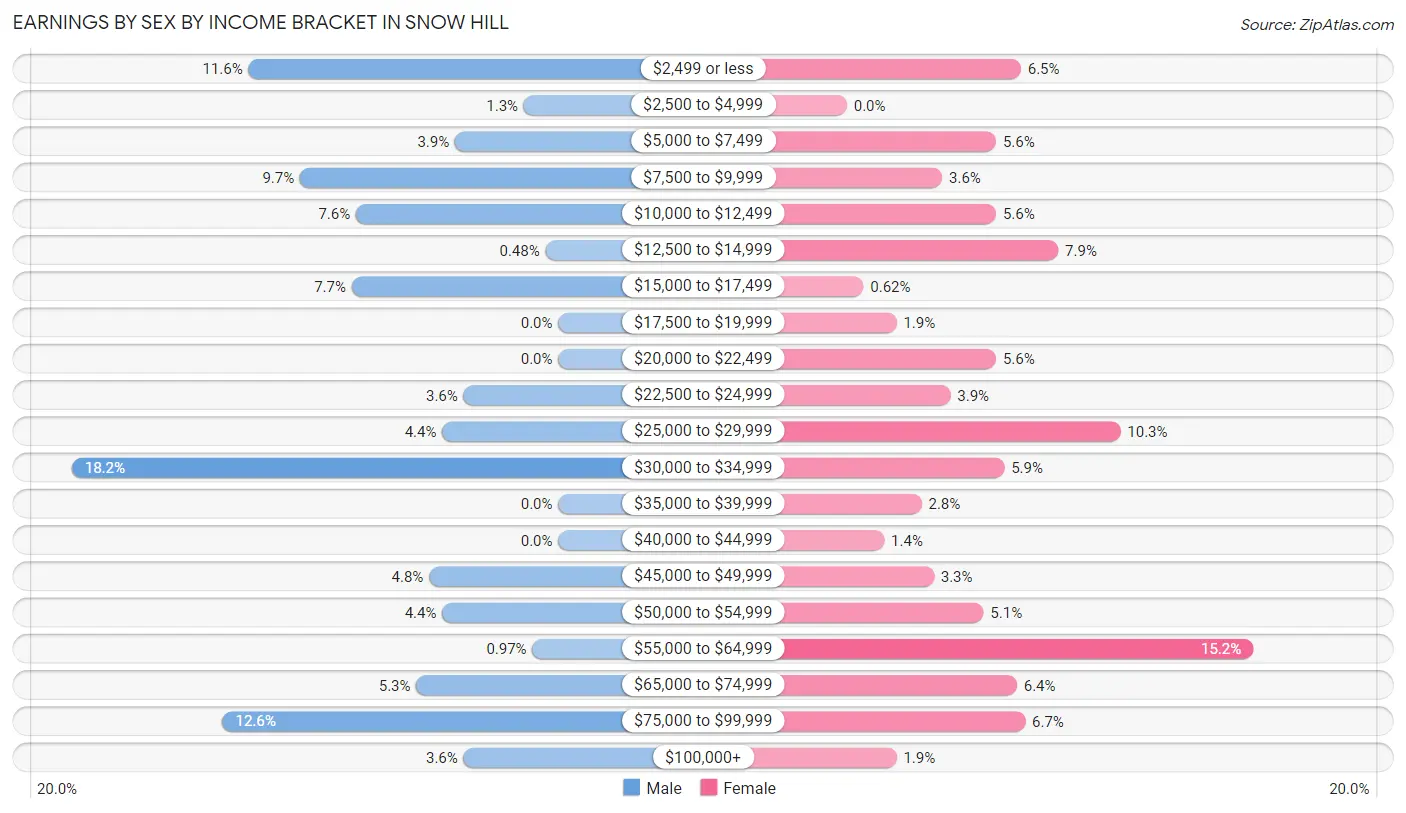
Earnings by Sex by Income Bracket in Snow Hill
The most common earnings brackets in Snow Hill are $30,000 to $34,999 for men (113 | 18.2%) and $55,000 to $64,999 for women (98 | 15.2%).
| Income | Male | Female |
| $2,499 or less | 72 (11.6%) | 42 (6.5%) |
| $2,500 to $4,999 | 8 (1.3%) | 0 (0.0%) |
| $5,000 to $7,499 | 24 (3.9%) | 36 (5.6%) |
| $7,500 to $9,999 | 60 (9.7%) | 23 (3.6%) |
| $10,000 to $12,499 | 47 (7.6%) | 36 (5.6%) |
| $12,500 to $14,999 | 3 (0.5%) | 51 (7.9%) |
| $15,000 to $17,499 | 48 (7.7%) | 4 (0.6%) |
| $17,500 to $19,999 | 0 (0.0%) | 12 (1.9%) |
| $20,000 to $22,499 | 0 (0.0%) | 36 (5.6%) |
| $22,500 to $24,999 | 22 (3.5%) | 25 (3.9%) |
| $25,000 to $29,999 | 27 (4.3%) | 66 (10.2%) |
| $30,000 to $34,999 | 113 (18.2%) | 38 (5.9%) |
| $35,000 to $39,999 | 0 (0.0%) | 18 (2.8%) |
| $40,000 to $44,999 | 0 (0.0%) | 9 (1.4%) |
| $45,000 to $49,999 | 30 (4.8%) | 21 (3.3%) |
| $50,000 to $54,999 | 27 (4.3%) | 33 (5.1%) |
| $55,000 to $64,999 | 6 (1.0%) | 98 (15.2%) |
| $65,000 to $74,999 | 33 (5.3%) | 41 (6.4%) |
| $75,000 to $99,999 | 78 (12.6%) | 43 (6.7%) |
| $100,000+ | 22 (3.5%) | 12 (1.9%) |
| Total | 620 (100.0%) | 644 (100.0%) |
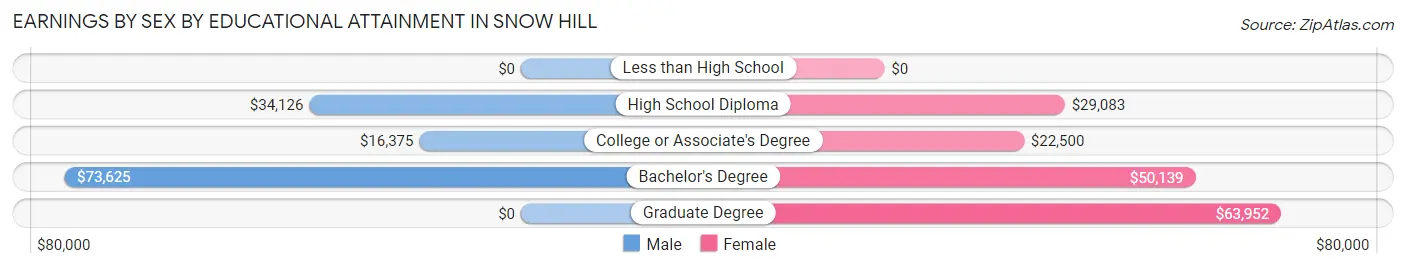
Earnings by Sex by Educational Attainment in Snow Hill
Average earnings in Snow Hill are $33,794 for men and $39,514 for women, a difference of 14.5%. Men with an educational attainment of bachelor's degree enjoy the highest average annual earnings of $73,625, while those with college or associate's degree education earn the least with $16,375. Women with an educational attainment of graduate degree earn the most with the average annual earnings of $63,952, while those with college or associate's degree education have the smallest earnings of $22,500.
| Educational Attainment | Male Income | Female Income |
| Less than High School | - | - |
| High School Diploma | $34,126 | $29,083 |
| College or Associate's Degree | $16,375 | $22,500 |
| Bachelor's Degree | $73,625 | $50,139 |
| Graduate Degree | - | - |
| Total | $33,794 | $39,514 |
Family Income in Snow Hill
Family Income Brackets in Snow Hill
According to the Snow Hill family income data, there are 124 families falling into the $50,000 to $74,999 income range, which is the most common income bracket and makes up 24.6% of all families. Conversely, the less than $10,000 income bracket is the least frequent group with only 4 families (0.8%) belonging to this category.
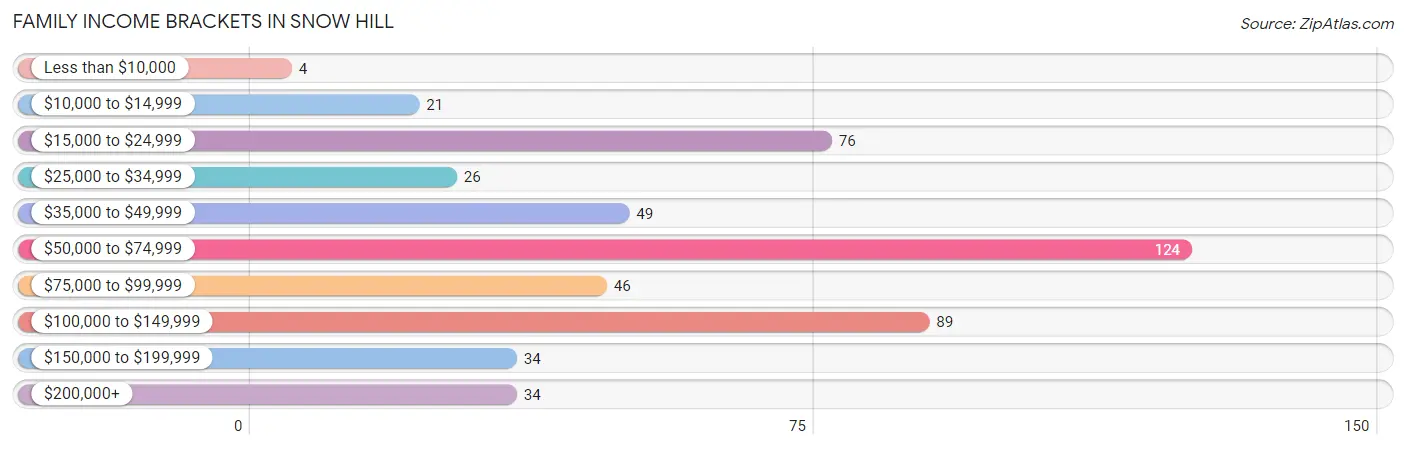
| Income Bracket | # Families | % Families |
| Less than $10,000 | 4 | 0.8% |
| $10,000 to $14,999 | 21 | 4.2% |
| $15,000 to $24,999 | 76 | 15.1% |
| $25,000 to $34,999 | 26 | 5.2% |
| $35,000 to $49,999 | 49 | 9.7% |
| $50,000 to $74,999 | 124 | 24.7% |
| $75,000 to $99,999 | 46 | 9.1% |
| $100,000 to $149,999 | 89 | 17.7% |
| $150,000 to $199,999 | 34 | 6.8% |
| $200,000+ | 34 | 6.8% |
Family Income by Famaliy Size in Snow Hill
5-person families (27 | 5.4%) account for the highest median family income in Snow Hill with $151,705 per family, while 2-person families (240 | 47.7%) have the highest median income of $31,416 per family member.
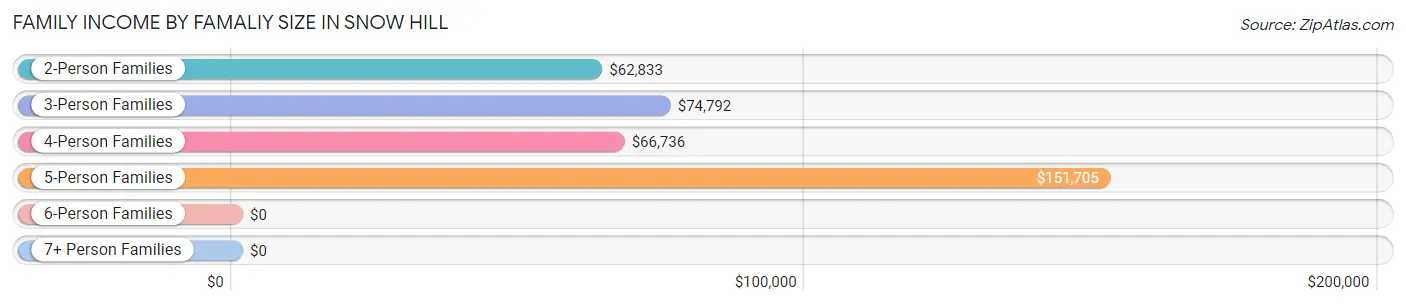
| Income Bracket | # Families | Median Income |
| 2-Person Families | 240 (47.7%) | $62,833 |
| 3-Person Families | 125 (24.8%) | $74,792 |
| 4-Person Families | 95 (18.9%) | $66,736 |
| 5-Person Families | 27 (5.4%) | $151,705 |
| 6-Person Families | 6 (1.2%) | $0 |
| 7+ Person Families | 10 (2.0%) | $0 |
| Total | 503 (100.0%) | $64,563 |
Family Income by Number of Earners in Snow Hill
The median family income in Snow Hill is $64,563, with families comprising 2 earners (94) having the highest median family income of $120,625, while families with no earners (59) have the lowest median family income of $33,393, accounting for 18.7% and 11.7% of families, respectively.
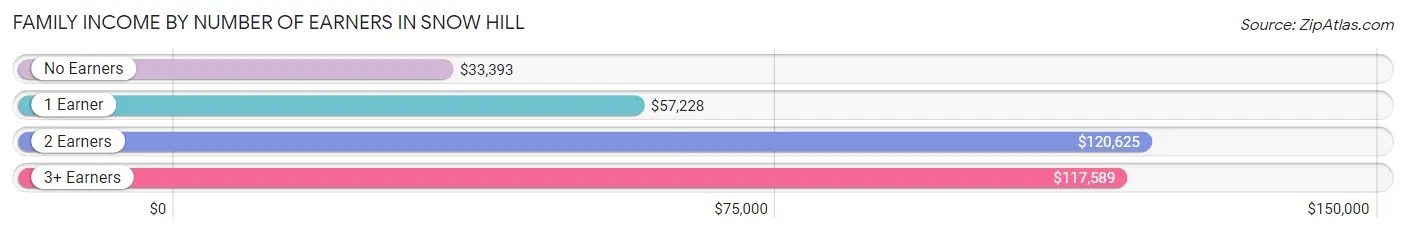
| Number of Earners | # Families | Median Income |
| No Earners | 59 (11.7%) | $33,393 |
| 1 Earner | 241 (47.9%) | $57,228 |
| 2 Earners | 94 (18.7%) | $120,625 |
| 3+ Earners | 109 (21.7%) | $117,589 |
| Total | 503 (100.0%) | $64,563 |
Household Income in Snow Hill
Household Income Brackets in Snow Hill
With 151 households falling in the category, the $25,000 to $34,999 income range is the most frequent in Snow Hill, accounting for 16.8% of all households. In contrast, only 38 households (4.2%) fall into the $200,000+ income bracket, making it the least populous group.
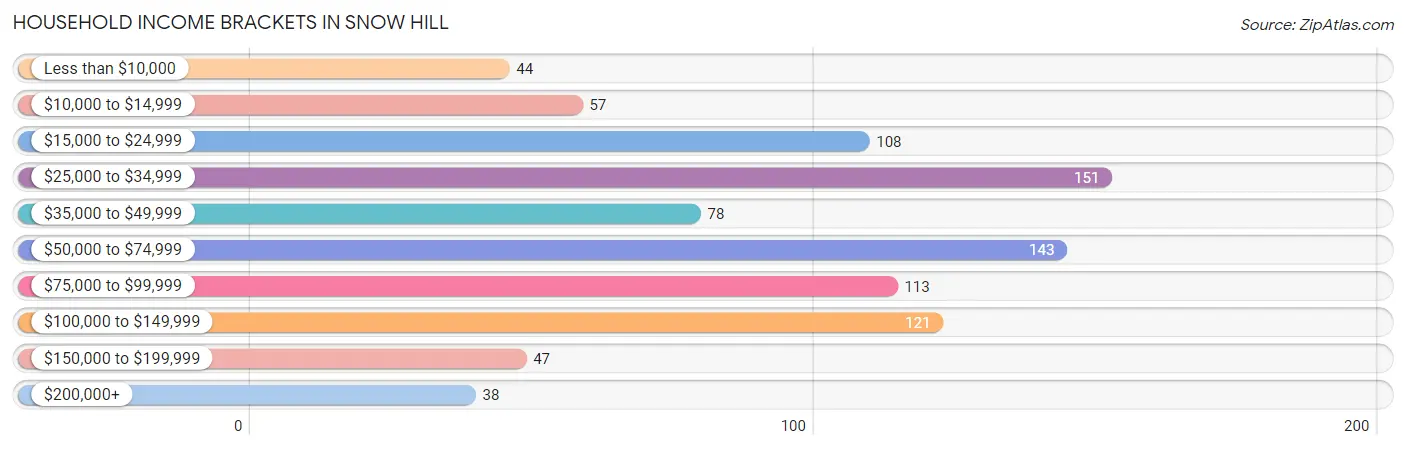
| Income Bracket | # Households | % Households |
| Less than $10,000 | 44 | 4.9% |
| $10,000 to $14,999 | 57 | 6.3% |
| $15,000 to $24,999 | 108 | 12.0% |
| $25,000 to $34,999 | 151 | 16.8% |
| $35,000 to $49,999 | 78 | 8.7% |
| $50,000 to $74,999 | 143 | 15.9% |
| $75,000 to $99,999 | 113 | 12.6% |
| $100,000 to $149,999 | 121 | 13.4% |
| $150,000 to $199,999 | 47 | 5.2% |
| $200,000+ | 38 | 4.2% |
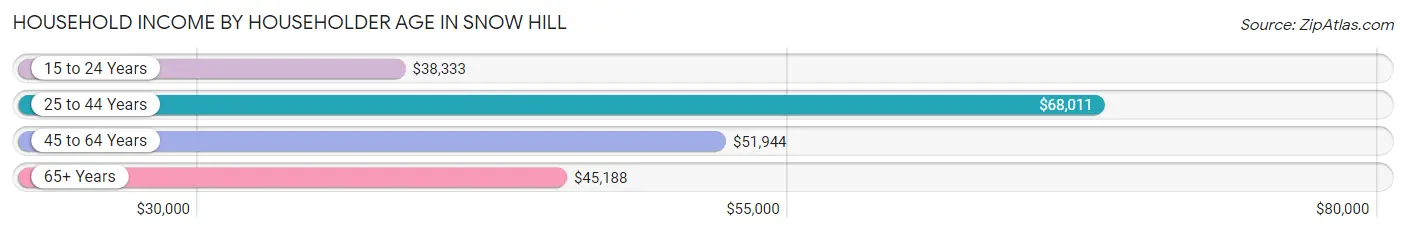
Household Income by Householder Age in Snow Hill
The median household income in Snow Hill is $51,667, with the highest median household income of $68,011 found in the 25 to 44 years age bracket for the primary householder. A total of 333 households (37.0%) fall into this category. Meanwhile, the 15 to 24 years age bracket for the primary householder has the lowest median household income of $38,333, with 34 households (3.8%) in this group.
| Income Bracket | # Households | Median Income |
| 15 to 24 Years | 34 (3.8%) | $38,333 |
| 25 to 44 Years | 333 (37.0%) | $68,011 |
| 45 to 64 Years | 292 (32.4%) | $51,944 |
| 65+ Years | 241 (26.8%) | $45,188 |
| Total | 900 (100.0%) | $51,667 |
Poverty in Snow Hill
Income Below Poverty by Sex and Age in Snow Hill
With 17.5% poverty level for males and 25.7% for females among the residents of Snow Hill, 5 year old males and 12 to 14 year old females are the most vulnerable to poverty, with 4 males (100.0%) and 38 females (76.0%) in their respective age groups living below the poverty level.
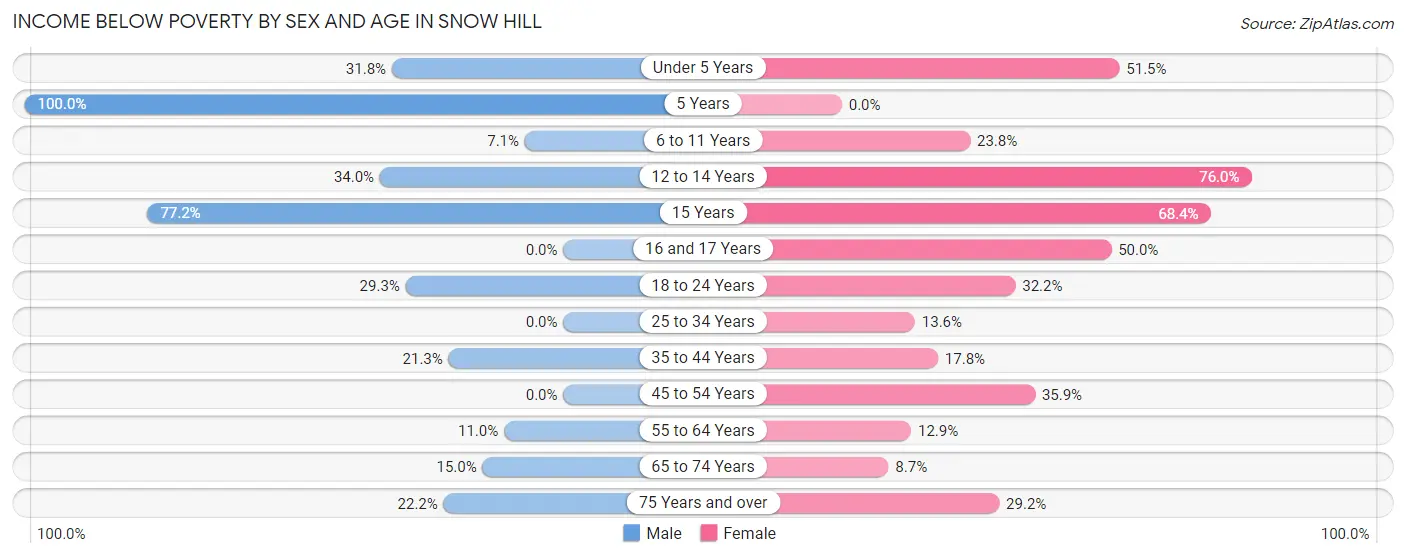
| Age Bracket | Male | Female |
| Under 5 Years | 7 (31.8%) | 17 (51.5%) |
| 5 Years | 4 (100.0%) | 0 (0.0%) |
| 6 to 11 Years | 14 (7.1%) | 15 (23.8%) |
| 12 to 14 Years | 16 (34.0%) | 38 (76.0%) |
| 15 Years | 44 (77.2%) | 13 (68.4%) |
| 16 and 17 Years | 0 (0.0%) | 15 (50.0%) |
| 18 to 24 Years | 36 (29.3%) | 38 (32.2%) |
| 25 to 34 Years | 0 (0.0%) | 16 (13.6%) |
| 35 to 44 Years | 46 (21.3%) | 43 (17.8%) |
| 45 to 54 Years | 0 (0.0%) | 38 (35.8%) |
| 55 to 64 Years | 12 (11.0%) | 18 (12.9%) |
| 65 to 74 Years | 15 (15.0%) | 9 (8.6%) |
| 75 Years and over | 14 (22.2%) | 26 (29.2%) |
| Total | 208 (17.5%) | 286 (25.7%) |
Income Above Poverty by Sex and Age in Snow Hill
According to the poverty statistics in Snow Hill, males aged 16 and 17 years and females aged 5 years are the age groups that are most secure financially, with 100.0% of males and 100.0% of females in these age groups living above the poverty line.
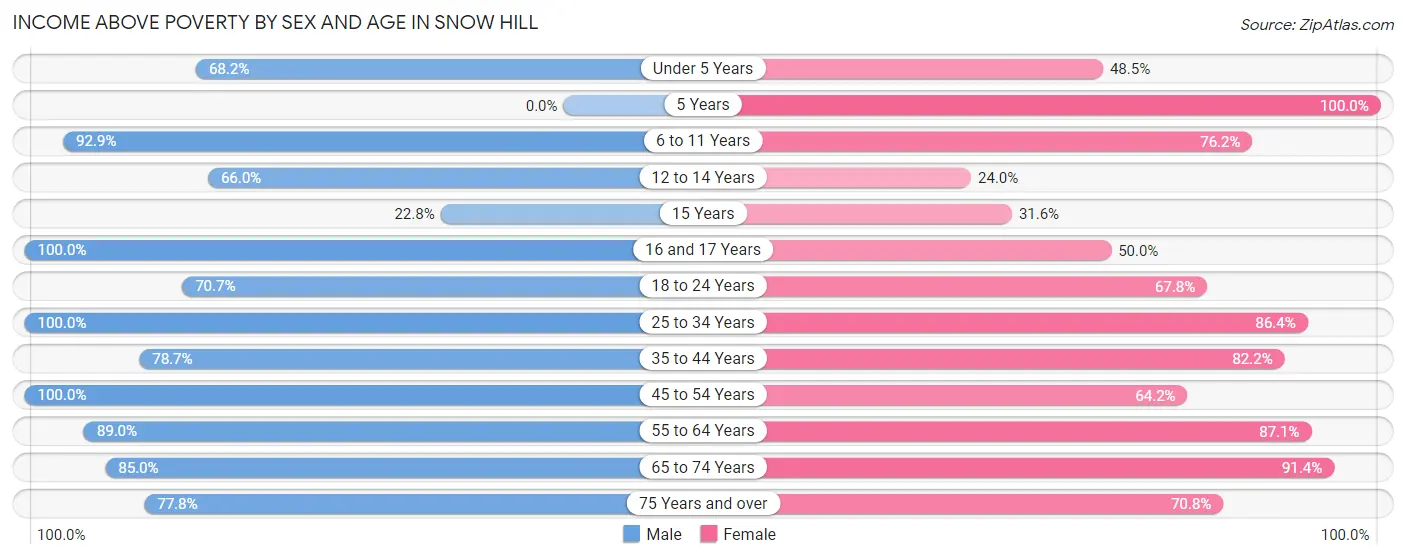
| Age Bracket | Male | Female |
| Under 5 Years | 15 (68.2%) | 16 (48.5%) |
| 5 Years | 0 (0.0%) | 4 (100.0%) |
| 6 to 11 Years | 182 (92.9%) | 48 (76.2%) |
| 12 to 14 Years | 31 (66.0%) | 12 (24.0%) |
| 15 Years | 13 (22.8%) | 6 (31.6%) |
| 16 and 17 Years | 86 (100.0%) | 15 (50.0%) |
| 18 to 24 Years | 87 (70.7%) | 80 (67.8%) |
| 25 to 34 Years | 70 (100.0%) | 102 (86.4%) |
| 35 to 44 Years | 170 (78.7%) | 198 (82.2%) |
| 45 to 54 Years | 93 (100.0%) | 68 (64.1%) |
| 55 to 64 Years | 97 (89.0%) | 122 (87.1%) |
| 65 to 74 Years | 85 (85.0%) | 95 (91.3%) |
| 75 Years and over | 49 (77.8%) | 63 (70.8%) |
| Total | 978 (82.5%) | 829 (74.4%) |
Income Below Poverty Among Married-Couple Families in Snow Hill
The poverty statistics for married-couple families in Snow Hill show that 4.6% or 12 of the total 263 families live below the poverty line. Families with no children have the highest poverty rate of 6.8%, comprising of 12 families. On the other hand, families with 1 or 2 children have the lowest poverty rate of 0.0%, which includes 0 families.
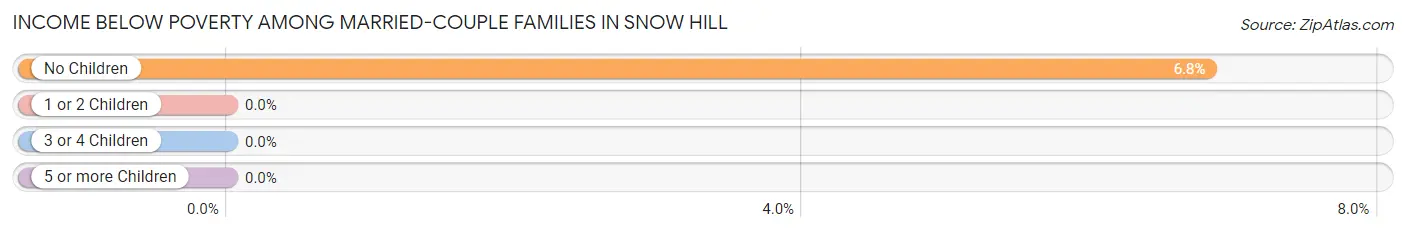
| Children | Above Poverty | Below Poverty |
| No Children | 164 (93.2%) | 12 (6.8%) |
| 1 or 2 Children | 76 (100.0%) | 0 (0.0%) |
| 3 or 4 Children | 11 (100.0%) | 0 (0.0%) |
| 5 or more Children | 0 (0.0%) | 0 (0.0%) |
| Total | 251 (95.4%) | 12 (4.6%) |
Income Below Poverty Among Single-Parent Households in Snow Hill
According to the poverty data in Snow Hill, 12.9% or 4 single-father households and 40.2% or 84 single-mother households are living below the poverty line. Among single-father households, those with no children have the highest poverty rate, with 4 households (23.5%) experiencing poverty. Likewise, among single-mother households, those with 5 or more children have the highest poverty rate, with 5 households (100.0%) falling below the poverty line.
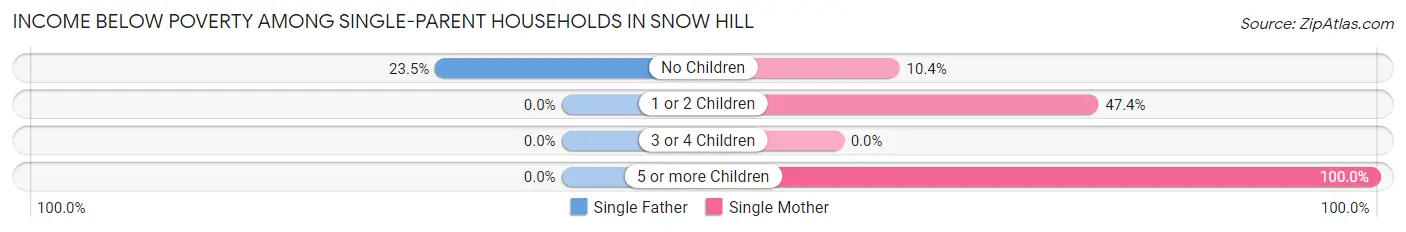
| Children | Single Father | Single Mother |
| No Children | 4 (23.5%) | 5 (10.4%) |
| 1 or 2 Children | 0 (0.0%) | 74 (47.4%) |
| 3 or 4 Children | 0 (0.0%) | 0 (0.0%) |
| 5 or more Children | 0 (0.0%) | 5 (100.0%) |
| Total | 4 (12.9%) | 84 (40.2%) |
Income Below Poverty Among Married-Couple vs Single-Parent Households in Snow Hill
The poverty data for Snow Hill shows that 12 of the married-couple family households (4.6%) and 88 of the single-parent households (36.7%) are living below the poverty level. Within the married-couple family households, those with no children have the highest poverty rate, with 12 households (6.8%) falling below the poverty line. Among the single-parent households, those with 5 or more children have the highest poverty rate, with 5 household (100.0%) living below poverty.
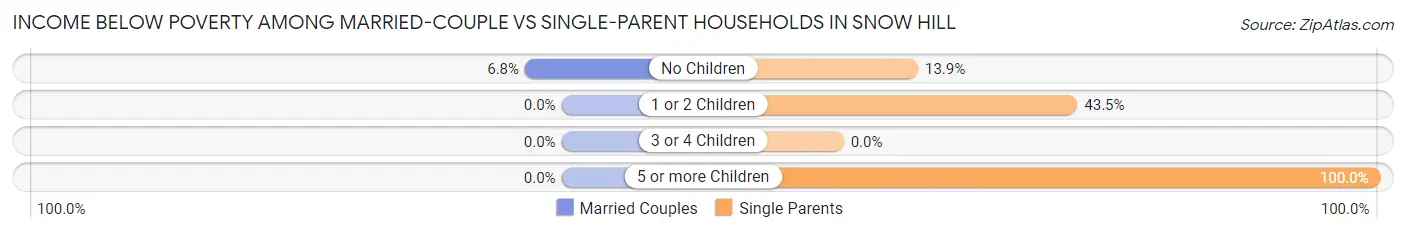
| Children | Married-Couple Families | Single-Parent Households |
| No Children | 12 (6.8%) | 9 (13.9%) |
| 1 or 2 Children | 0 (0.0%) | 74 (43.5%) |
| 3 or 4 Children | 0 (0.0%) | 0 (0.0%) |
| 5 or more Children | 0 (0.0%) | 5 (100.0%) |
| Total | 12 (4.6%) | 88 (36.7%) |
Race in Snow Hill
The most populous races in Snow Hill are White / Caucasian (1,440 | 61.0%), Black / African American (725 | 30.7%), and Two or more Races (125 | 5.3%).
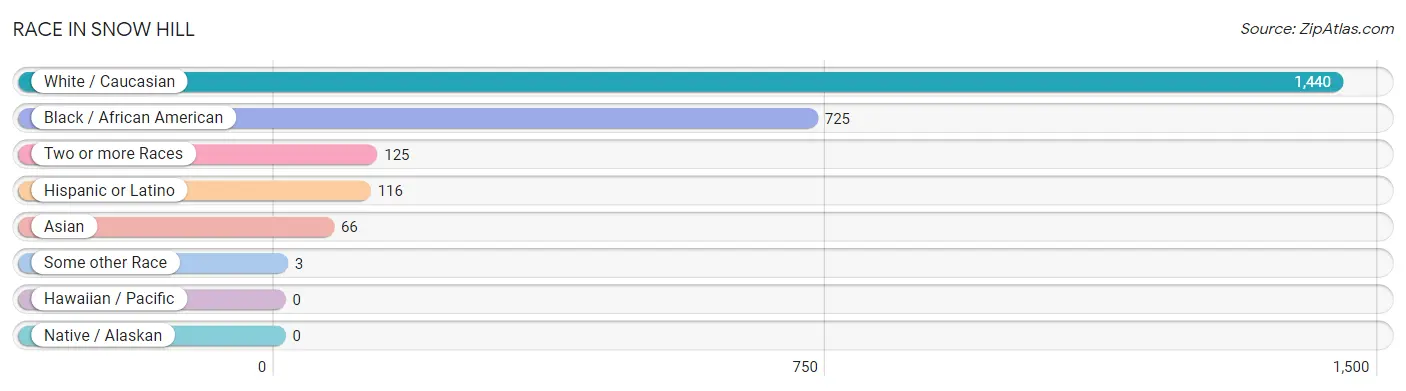
| Race | # Population | % Population |
| Asian | 66 | 2.8% |
| Black / African American | 725 | 30.7% |
| Hawaiian / Pacific | 0 | 0.0% |
| Hispanic or Latino | 116 | 4.9% |
| Native / Alaskan | 0 | 0.0% |
| White / Caucasian | 1,440 | 61.0% |
| Two or more Races | 125 | 5.3% |
| Some other Race | 3 | 0.1% |
| Total | 2,359 | 100.0% |
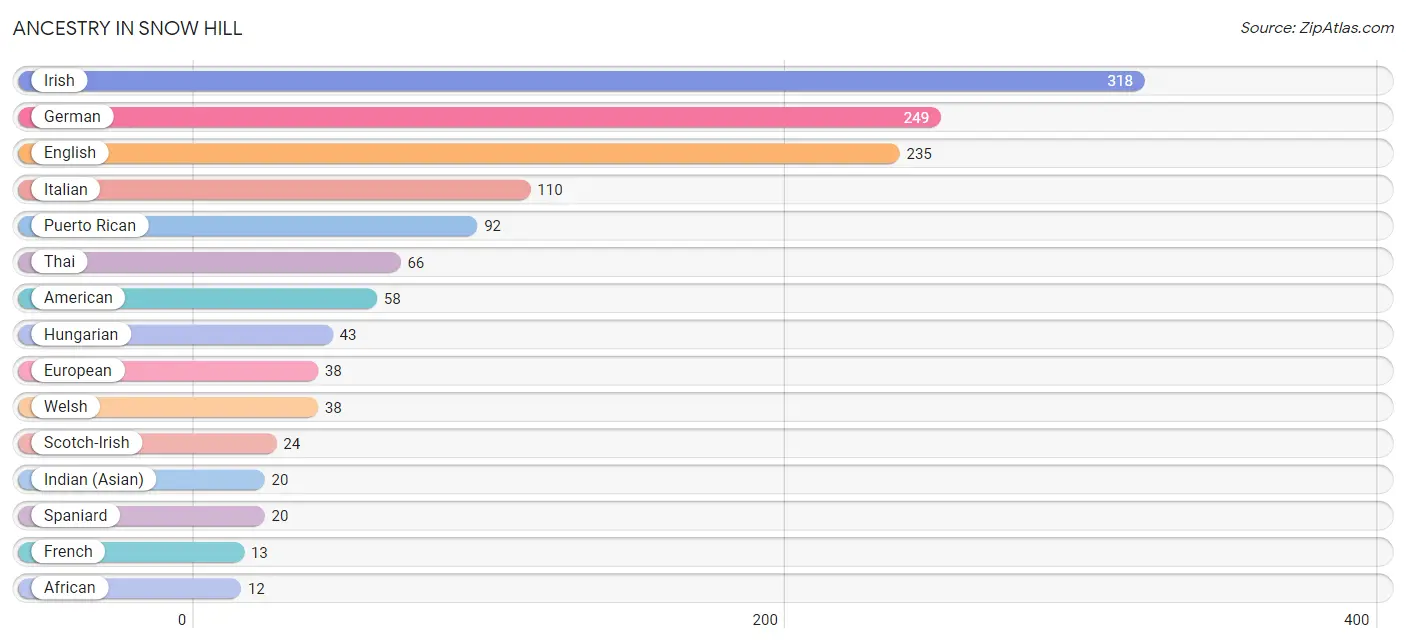
Ancestry in Snow Hill
The most populous ancestries reported in Snow Hill are Irish (318 | 13.5%), German (249 | 10.6%), English (235 | 10.0%), Italian (110 | 4.7%), and Puerto Rican (92 | 3.9%), together accounting for 42.6% of all Snow Hill residents.
| Ancestry | # Population | % Population |
| African | 12 | 0.5% |
| American | 58 | 2.5% |
| Austrian | 6 | 0.3% |
| British | 10 | 0.4% |
| Canadian | 3 | 0.1% |
| Colombian | 4 | 0.2% |
| Danish | 12 | 0.5% |
| Dutch | 4 | 0.2% |
| English | 235 | 10.0% |
| European | 38 | 1.6% |
| French | 13 | 0.5% |
| French Canadian | 11 | 0.5% |
| German | 249 | 10.6% |
| Hungarian | 43 | 1.8% |
| Indian (Asian) | 20 | 0.9% |
| Irish | 318 | 13.5% |
| Italian | 110 | 4.7% |
| Norwegian | 6 | 0.3% |
| Polish | 4 | 0.2% |
| Puerto Rican | 92 | 3.9% |
| Scotch-Irish | 24 | 1.0% |
| Scottish | 12 | 0.5% |
| South American | 4 | 0.2% |
| Spaniard | 20 | 0.9% |
| Subsaharan African | 12 | 0.5% |
| Thai | 66 | 2.8% |
| Ukrainian | 12 | 0.5% |
| Welsh | 38 | 1.6% | View All 28 Rows |
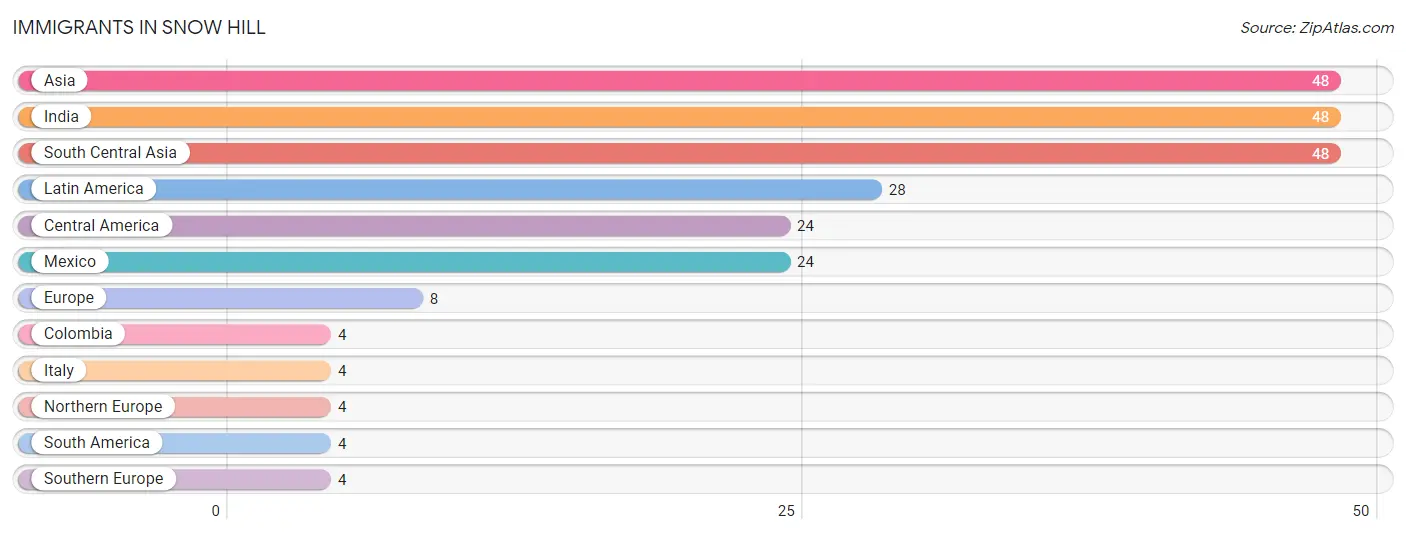
Immigrants in Snow Hill
The most numerous immigrant groups reported in Snow Hill came from Asia (48 | 2.0%), India (48 | 2.0%), South Central Asia (48 | 2.0%), Latin America (28 | 1.2%), and Central America (24 | 1.0%), together accounting for 8.3% of all Snow Hill residents.
| Immigration Origin | # Population | % Population |
| Asia | 48 | 2.0% |
| Central America | 24 | 1.0% |
| Colombia | 4 | 0.2% |
| Europe | 8 | 0.3% |
| India | 48 | 2.0% |
| Italy | 4 | 0.2% |
| Latin America | 28 | 1.2% |
| Mexico | 24 | 1.0% |
| Northern Europe | 4 | 0.2% |
| South America | 4 | 0.2% |
| South Central Asia | 48 | 2.0% |
| Southern Europe | 4 | 0.2% | View All 12 Rows |
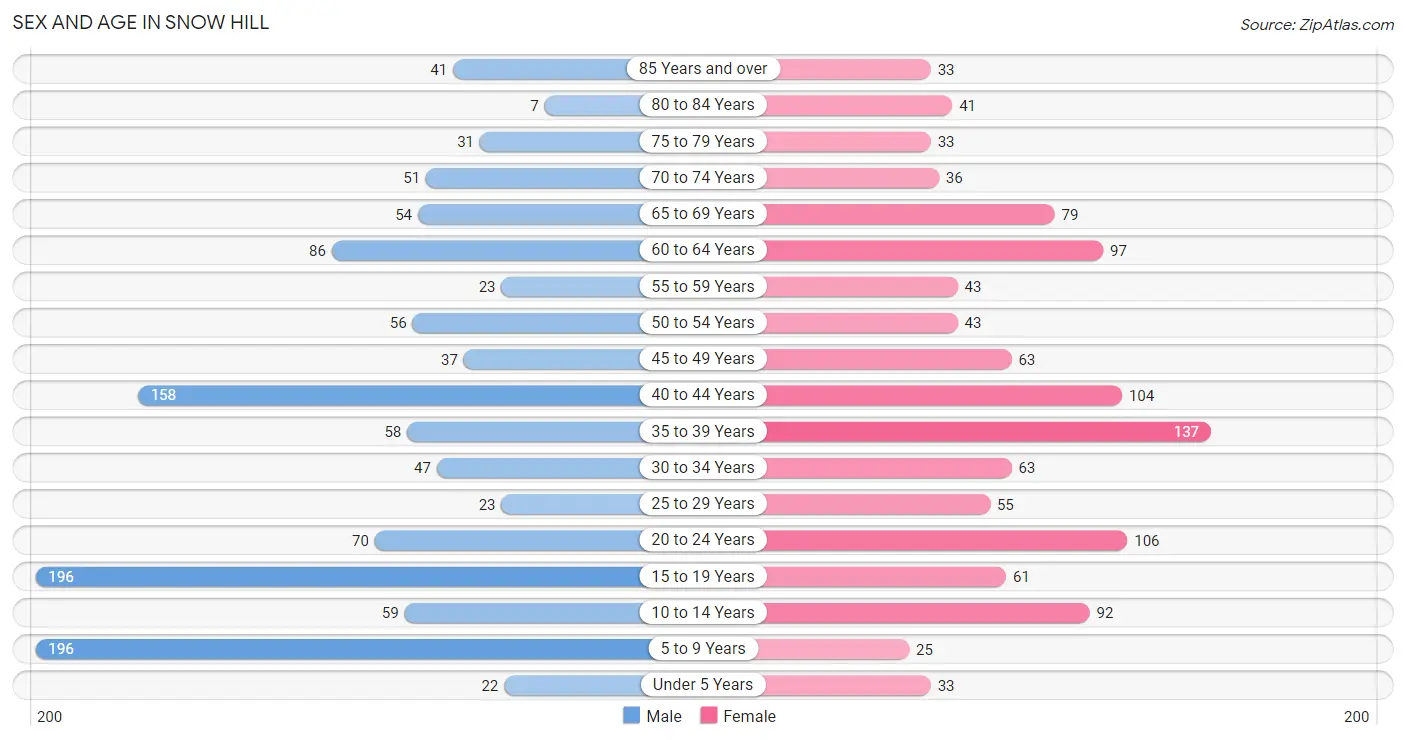
Sex and Age in Snow Hill
Sex and Age in Snow Hill
The most populous age groups in Snow Hill are 5 to 9 Years (196 | 16.1%) for men and 35 to 39 Years (137 | 12.0%) for women.
| Age Bracket | Male | Female |
| Under 5 Years | 22 (1.8%) | 33 (2.9%) |
| 5 to 9 Years | 196 (16.1%) | 25 (2.2%) |
| 10 to 14 Years | 59 (4.9%) | 92 (8.0%) |
| 15 to 19 Years | 196 (16.1%) | 61 (5.3%) |
| 20 to 24 Years | 70 (5.8%) | 106 (9.3%) |
| 25 to 29 Years | 23 (1.9%) | 55 (4.8%) |
| 30 to 34 Years | 47 (3.9%) | 63 (5.5%) |
| 35 to 39 Years | 58 (4.8%) | 137 (12.0%) |
| 40 to 44 Years | 158 (13.0%) | 104 (9.1%) |
| 45 to 49 Years | 37 (3.0%) | 63 (5.5%) |
| 50 to 54 Years | 56 (4.6%) | 43 (3.8%) |
| 55 to 59 Years | 23 (1.9%) | 43 (3.8%) |
| 60 to 64 Years | 86 (7.1%) | 97 (8.5%) |
| 65 to 69 Years | 54 (4.4%) | 79 (6.9%) |
| 70 to 74 Years | 51 (4.2%) | 36 (3.2%) |
| 75 to 79 Years | 31 (2.5%) | 33 (2.9%) |
| 80 to 84 Years | 7 (0.6%) | 41 (3.6%) |
| 85 Years and over | 41 (3.4%) | 33 (2.9%) |
| Total | 1,215 (100.0%) | 1,144 (100.0%) |
Families and Households in Snow Hill
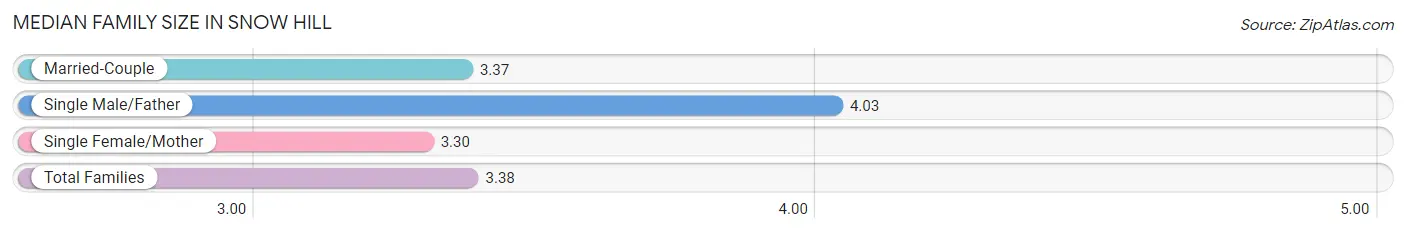
Median Family Size in Snow Hill
The median family size in Snow Hill is 3.38 persons per family, with single male/father families (31 | 6.2%) accounting for the largest median family size of 4.03 persons per family. On the other hand, single female/mother families (209 | 41.5%) represent the smallest median family size with 3.30 persons per family.
| Family Type | # Families | Family Size |
| Married-Couple | 263 (52.3%) | 3.37 |
| Single Male/Father | 31 (6.2%) | 4.03 |
| Single Female/Mother | 209 (41.5%) | 3.30 |
| Total Families | 503 (100.0%) | 3.38 |
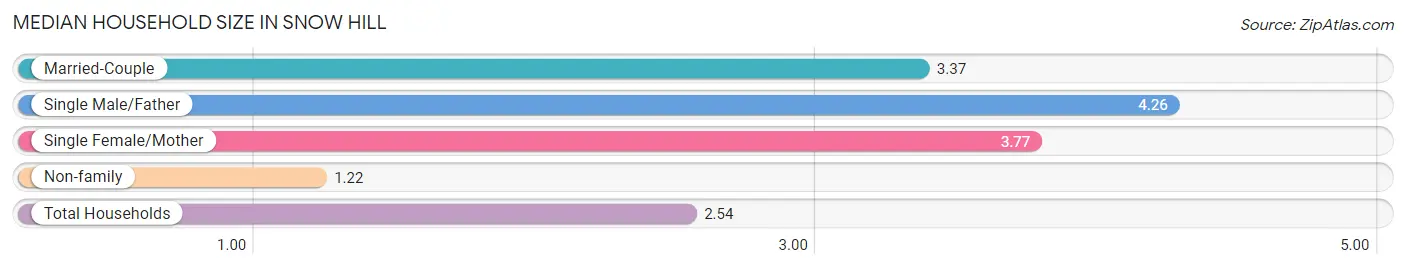
Median Household Size in Snow Hill
The median household size in Snow Hill is 2.54 persons per household, with single male/father households (31 | 3.4%) accounting for the largest median household size of 4.26 persons per household. non-family households (397 | 44.1%) represent the smallest median household size with 1.22 persons per household.
| Household Type | # Households | Household Size |
| Married-Couple | 263 (29.2%) | 3.37 |
| Single Male/Father | 31 (3.4%) | 4.26 |
| Single Female/Mother | 209 (23.2%) | 3.77 |
| Non-family | 397 (44.1%) | 1.22 |
| Total Households | 900 (100.0%) | 2.54 |
Household Size by Marriage Status in Snow Hill
Out of a total of 900 households in Snow Hill, 503 (55.9%) are family households, while 397 (44.1%) are nonfamily households. The most numerous type of family households are 3-person households, comprising 191, and the most common type of nonfamily households are 1-person households, comprising 319.
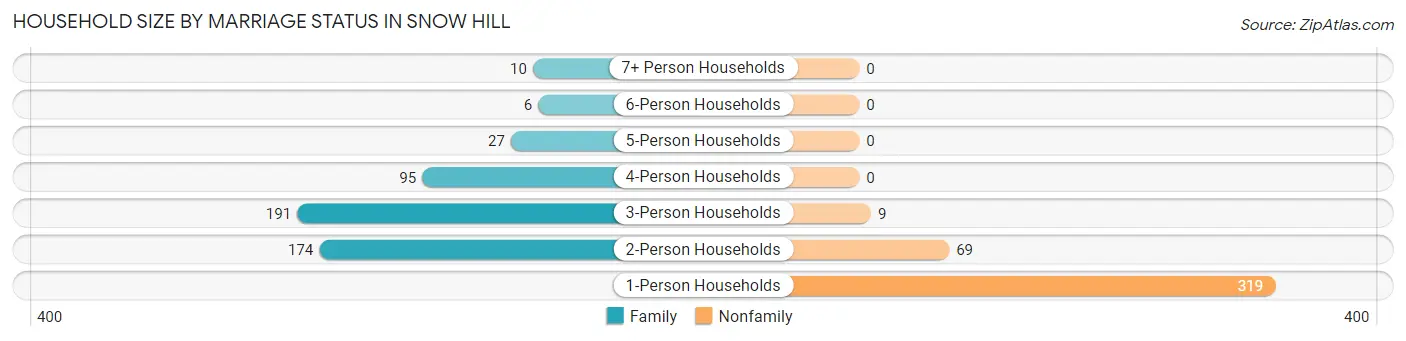
| Household Size | Family Households | Nonfamily Households |
| 1-Person Households | - | 319 (35.4%) |
| 2-Person Households | 174 (19.3%) | 69 (7.7%) |
| 3-Person Households | 191 (21.2%) | 9 (1.0%) |
| 4-Person Households | 95 (10.6%) | 0 (0.0%) |
| 5-Person Households | 27 (3.0%) | 0 (0.0%) |
| 6-Person Households | 6 (0.7%) | 0 (0.0%) |
| 7+ Person Households | 10 (1.1%) | 0 (0.0%) |
| Total | 503 (55.9%) | 397 (44.1%) |
Female Fertility in Snow Hill
Fertility by Age in Snow Hill
Average fertility rate in Snow Hill is 54.0 births per 1,000 women. Women in the age bracket of 20 to 34 years have the highest fertility rate with 116.0 births per 1,000 women. Women in the age bracket of 20 to 34 years acount for 81.2% of all women with births.
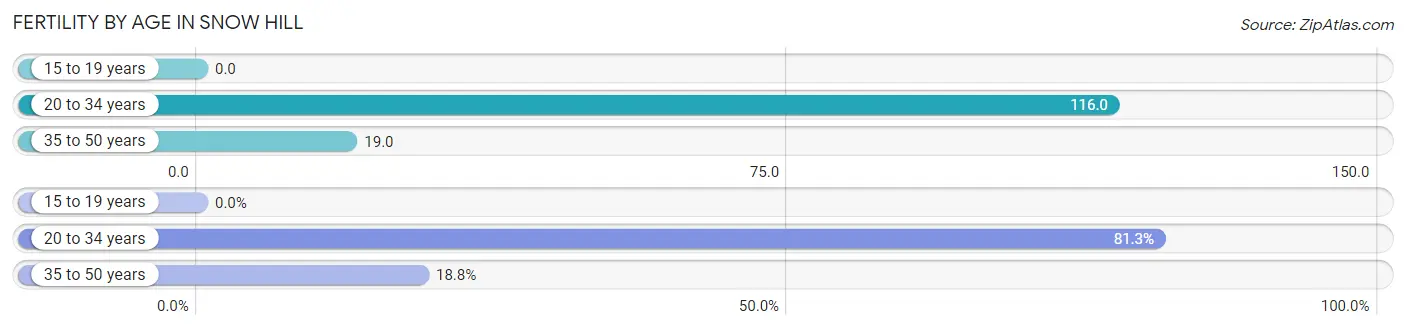
| Age Bracket | Women with Births | Births / 1,000 Women |
| 15 to 19 years | 0 (0.0%) | 0.0 |
| 20 to 34 years | 26 (81.2%) | 116.0 |
| 35 to 50 years | 6 (18.8%) | 19.0 |
| Total | 32 (100.0%) | 54.0 |
Fertility by Age by Marriage Status in Snow Hill
34.4% of women with births (32) in Snow Hill are married. The highest percentage of unmarried women with births falls into 20 to 34 years age bracket with 80.8% of them unmarried at the time of birth, while the lowest percentage of unmarried women with births belong to 35 to 50 years age bracket with 0.0% of them unmarried.
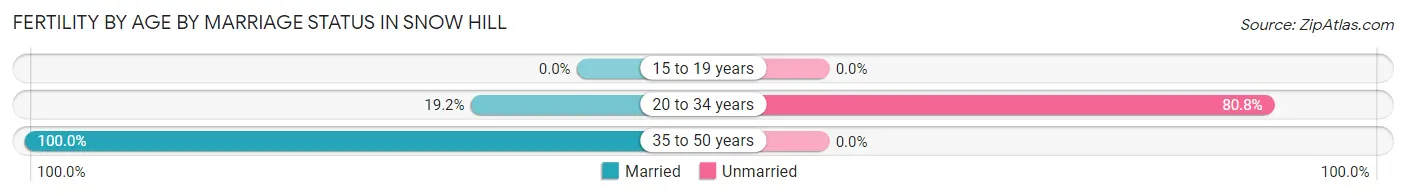
| Age Bracket | Married | Unmarried |
| 15 to 19 years | 0 (0.0%) | 0 (0.0%) |
| 20 to 34 years | 5 (19.2%) | 21 (80.8%) |
| 35 to 50 years | 6 (100.0%) | 0 (0.0%) |
| Total | 11 (34.4%) | 21 (65.6%) |
Fertility by Education in Snow Hill
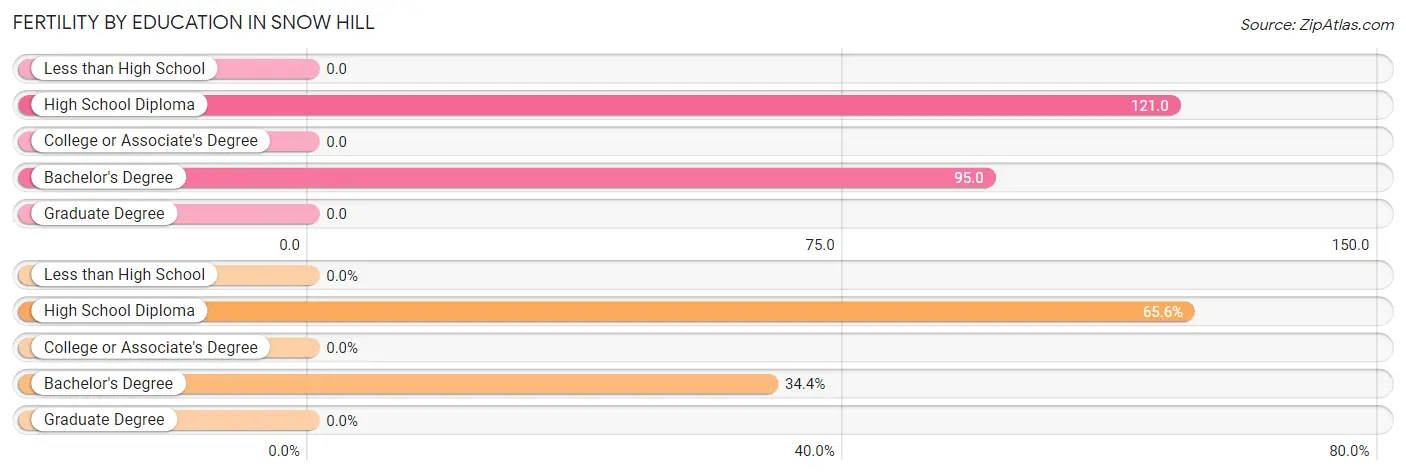
| Educational Attainment | Women with Births | Births / 1,000 Women |
| Less than High School | 0 (0.0%) | 0.0 |
| High School Diploma | 21 (65.6%) | 121.0 |
| College or Associate's Degree | 0 (0.0%) | 0.0 |
| Bachelor's Degree | 11 (34.4%) | 95.0 |
| Graduate Degree | 0 (0.0%) | 0.0 |
| Total | 32 (100.0%) | 54.0 |
Fertility by Education by Marriage Status in Snow Hill
65.6% of women with births in Snow Hill are unmarried. Women with the educational attainment of bachelor's degree are most likely to be married with 100.0% of them married at childbirth, while women with the educational attainment of high school diploma are least likely to be married with 100.0% of them unmarried at childbirth.
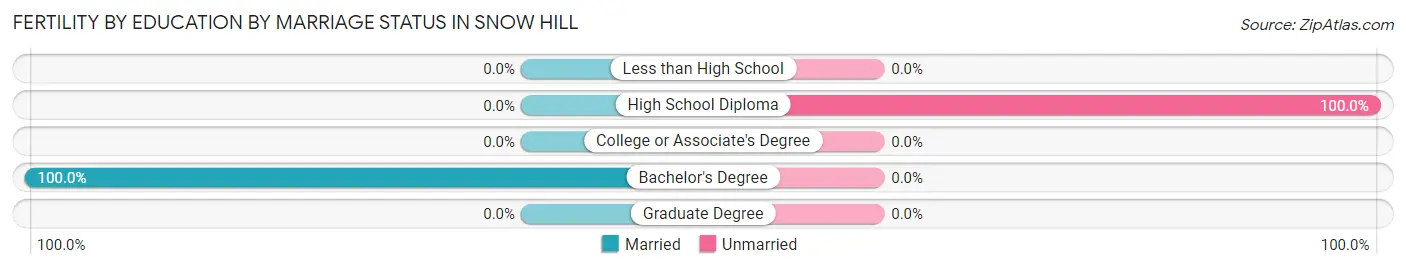
| Educational Attainment | Married | Unmarried |
| Less than High School | 0 (0.0%) | 0 (0.0%) |
| High School Diploma | 0 (0.0%) | 21 (100.0%) |
| College or Associate's Degree | 0 (0.0%) | 0 (0.0%) |
| Bachelor's Degree | 11 (100.0%) | 0 (0.0%) |
| Graduate Degree | 0 (0.0%) | 0 (0.0%) |
| Total | 11 (34.4%) | 21 (65.6%) |
Employment Characteristics in Snow Hill
Employment by Class of Employer in Snow Hill
Among the 1,090 employed individuals in Snow Hill, private company employees (670 | 61.5%), not-for-profit organizations (110 | 10.1%), and state government employees (103 | 9.5%) make up the most common classes of employment.
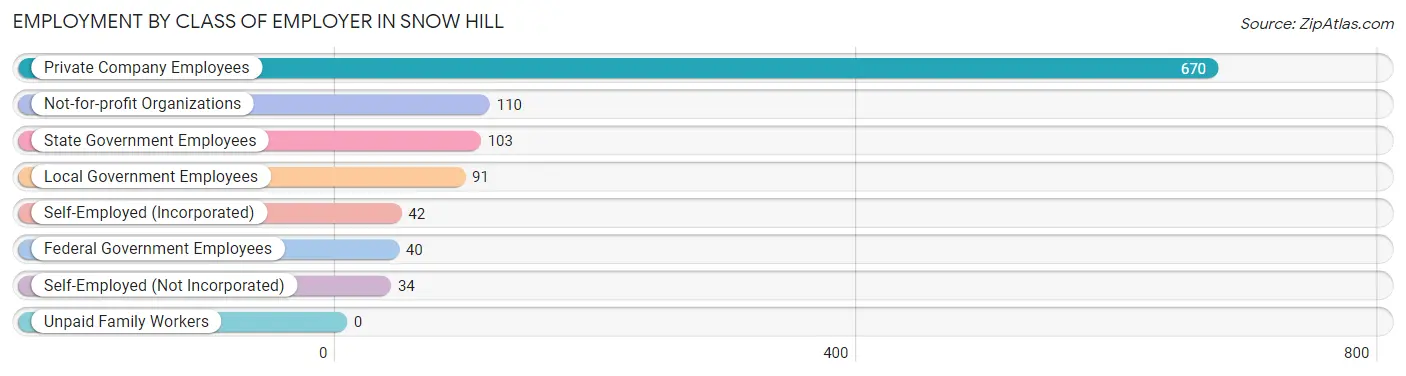
| Employer Class | # Employees | % Employees |
| Private Company Employees | 670 | 61.5% |
| Self-Employed (Incorporated) | 42 | 3.8% |
| Self-Employed (Not Incorporated) | 34 | 3.1% |
| Not-for-profit Organizations | 110 | 10.1% |
| Local Government Employees | 91 | 8.4% |
| State Government Employees | 103 | 9.5% |
| Federal Government Employees | 40 | 3.7% |
| Unpaid Family Workers | 0 | 0.0% |
| Total | 1,090 | 100.0% |
Employment Status by Age in Snow Hill
According to the labor force statistics for Snow Hill, out of the total population over 16 years of age (1,856), 67.7% or 1,257 individuals are in the labor force, with 10.4% or 131 of them unemployed. The age group with the highest labor force participation rate is 45 to 54 years, with 95.0% or 189 individuals in the labor force. Within the labor force, the 20 to 24 years age range has the highest percentage of unemployed individuals, with 26.5% or 41 of them being unemployed.
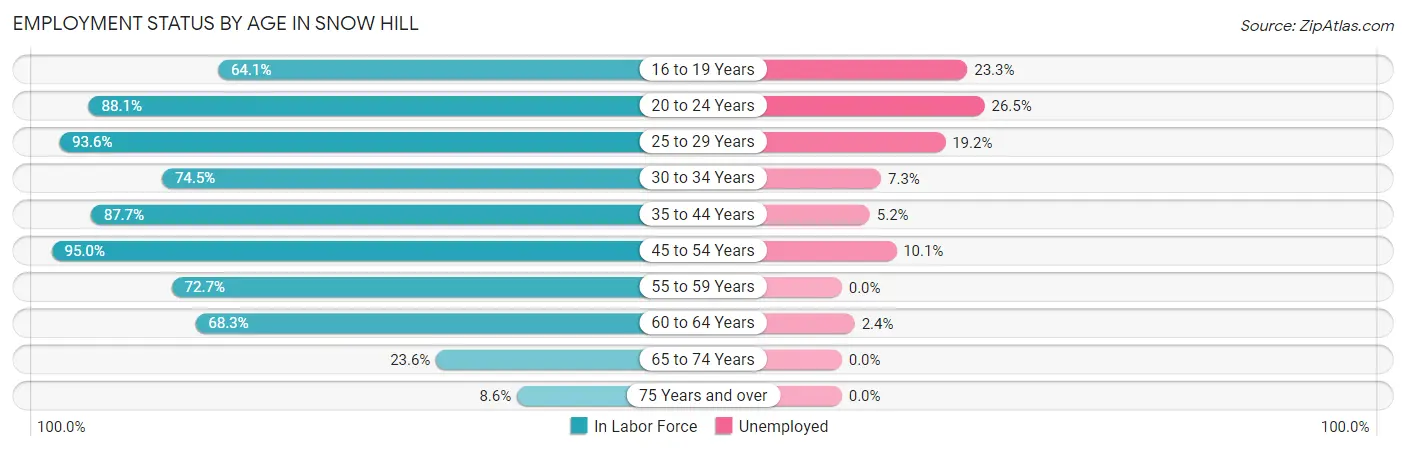
| Age Bracket | In Labor Force | Unemployed |
| 16 to 19 Years | 116 (64.1%) | 27 (23.3%) |
| 20 to 24 Years | 155 (88.1%) | 41 (26.5%) |
| 25 to 29 Years | 73 (93.6%) | 14 (19.2%) |
| 30 to 34 Years | 82 (74.5%) | 6 (7.3%) |
| 35 to 44 Years | 401 (87.7%) | 21 (5.2%) |
| 45 to 54 Years | 189 (95.0%) | 19 (10.1%) |
| 55 to 59 Years | 48 (72.7%) | 0 (0.0%) |
| 60 to 64 Years | 125 (68.3%) | 3 (2.4%) |
| 65 to 74 Years | 52 (23.6%) | 0 (0.0%) |
| 75 Years and over | 16 (8.6%) | 0 (0.0%) |
| Total | 1,257 (67.7%) | 131 (10.4%) |
Employment Status by Educational Attainment in Snow Hill
According to labor force statistics for Snow Hill, 84.0% of individuals (918) out of the total population between 25 and 64 years of age (1,093) are in the labor force, with 6.9% or 63 of them being unemployed. The group with the highest labor force participation rate are those with the educational attainment of bachelor's degree or higher, with 87.3% or 281 individuals in the labor force. Within the labor force, individuals with college / associate degree education have the highest percentage of unemployment, with 10.0% or 21 of them being unemployed.
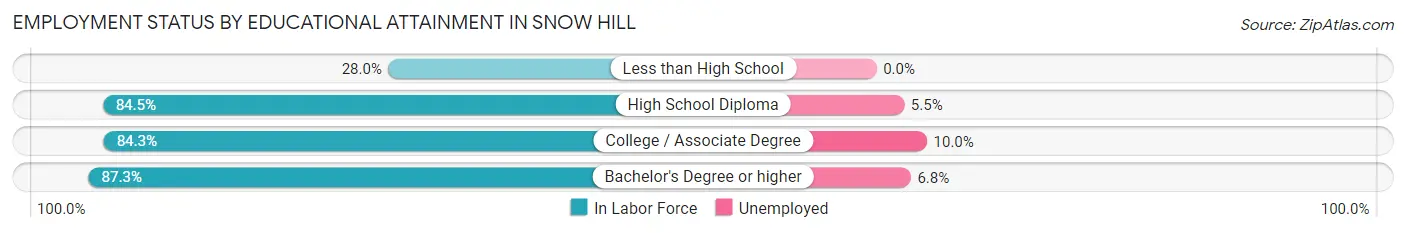
| Educational Attainment | In Labor Force | Unemployed |
| Less than High School | 7 (28.0%) | 0 (0.0%) |
| High School Diploma | 420 (84.5%) | 27 (5.5%) |
| College / Associate Degree | 210 (84.3%) | 25 (10.0%) |
| Bachelor's Degree or higher | 281 (87.3%) | 22 (6.8%) |
| Total | 918 (84.0%) | 75 (6.9%) |
Employment Occupations by Sex in Snow Hill
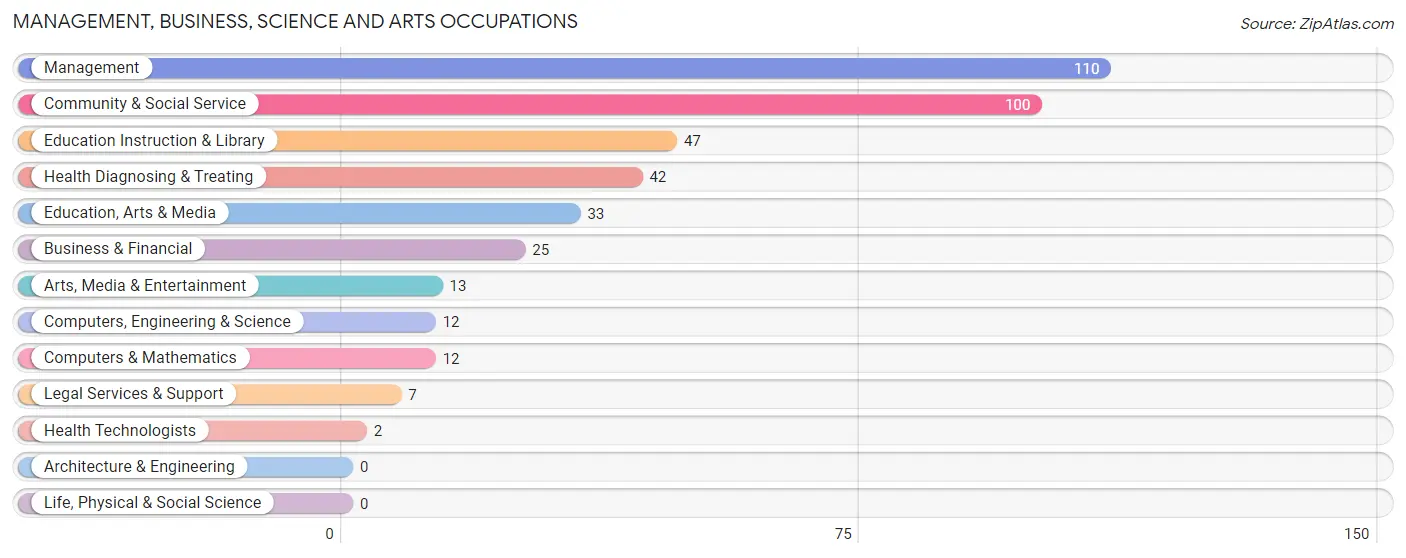
Management, Business, Science and Arts Occupations
The most common Management, Business, Science and Arts occupations in Snow Hill are Management (110 | 9.8%), Community & Social Service (100 | 8.9%), Education Instruction & Library (47 | 4.2%), Health Diagnosing & Treating (42 | 3.7%), and Education, Arts & Media (33 | 2.9%).
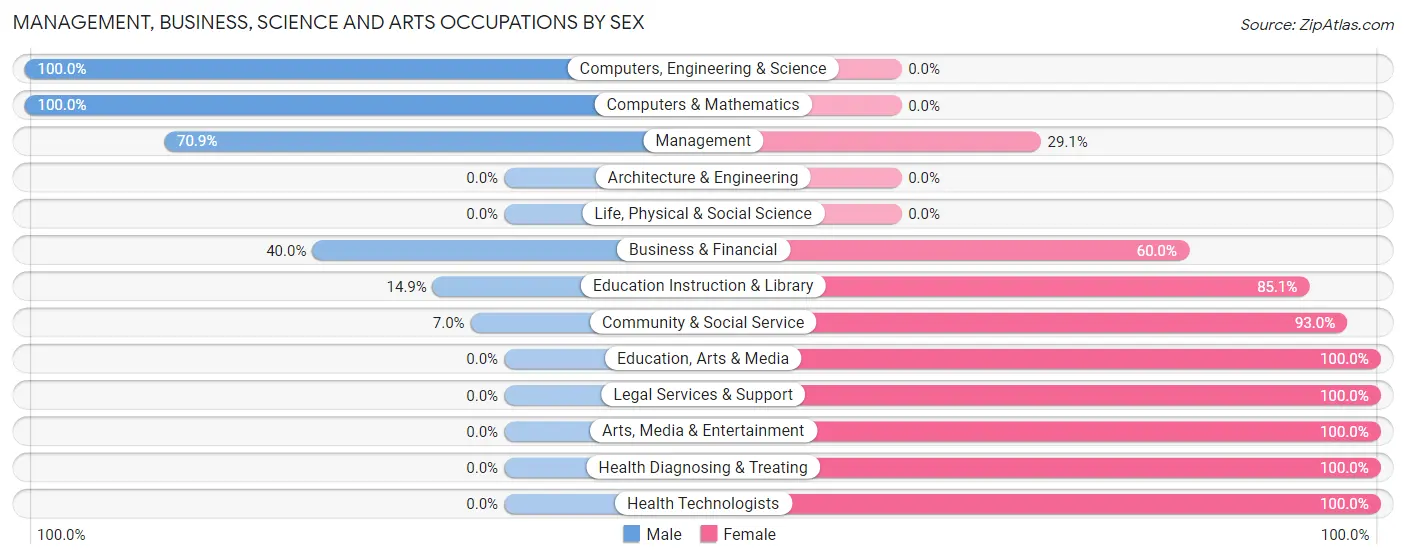
Management, Business, Science and Arts Occupations by Sex
Within the Management, Business, Science and Arts occupations in Snow Hill, the most male-oriented occupations are Computers, Engineering & Science (100.0%), Computers & Mathematics (100.0%), and Management (70.9%), while the most female-oriented occupations are Education, Arts & Media (100.0%), Legal Services & Support (100.0%), and Arts, Media & Entertainment (100.0%).
| Occupation | Male | Female |
| Management | 78 (70.9%) | 32 (29.1%) |
| Business & Financial | 10 (40.0%) | 15 (60.0%) |
| Computers, Engineering & Science | 12 (100.0%) | 0 (0.0%) |
| Computers & Mathematics | 12 (100.0%) | 0 (0.0%) |
| Architecture & Engineering | 0 (0.0%) | 0 (0.0%) |
| Life, Physical & Social Science | 0 (0.0%) | 0 (0.0%) |
| Community & Social Service | 7 (7.0%) | 93 (93.0%) |
| Education, Arts & Media | 0 (0.0%) | 33 (100.0%) |
| Legal Services & Support | 0 (0.0%) | 7 (100.0%) |
| Education Instruction & Library | 7 (14.9%) | 40 (85.1%) |
| Arts, Media & Entertainment | 0 (0.0%) | 13 (100.0%) |
| Health Diagnosing & Treating | 0 (0.0%) | 42 (100.0%) |
| Health Technologists | 0 (0.0%) | 2 (100.0%) |
| Total (Category) | 107 (37.0%) | 182 (63.0%) |
| Total (Overall) | 532 (47.2%) | 594 (52.7%) |
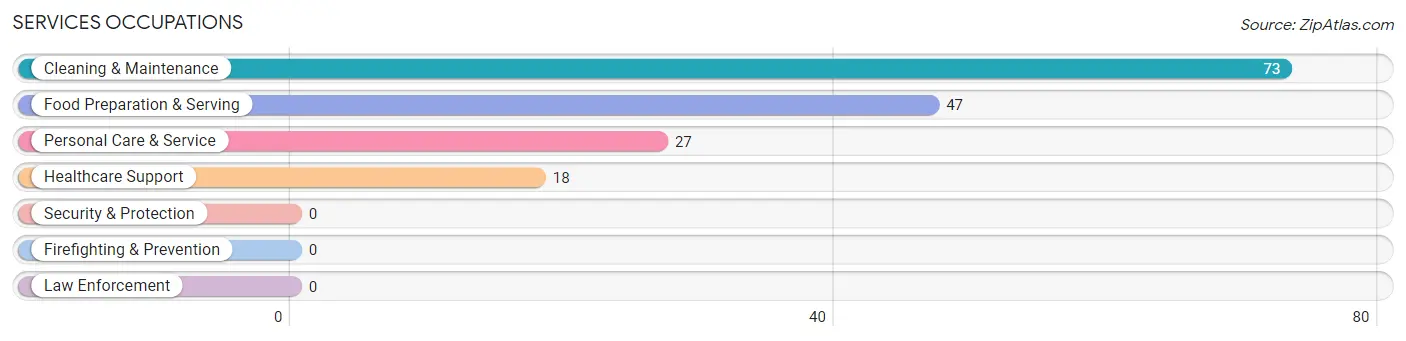
Services Occupations
The most common Services occupations in Snow Hill are Cleaning & Maintenance (73 | 6.5%), Food Preparation & Serving (47 | 4.2%), Personal Care & Service (27 | 2.4%), and Healthcare Support (18 | 1.6%).
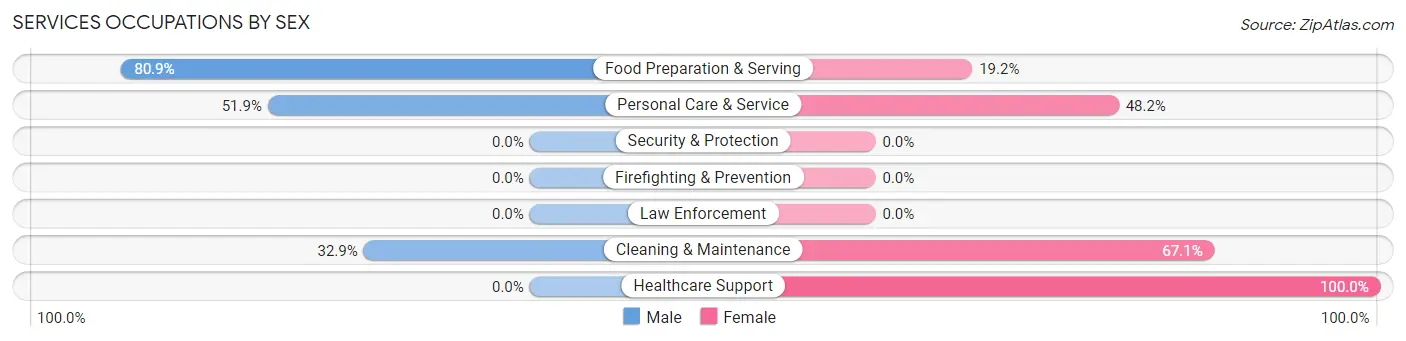
Services Occupations by Sex
Within the Services occupations in Snow Hill, the most male-oriented occupations are Food Preparation & Serving (80.8%), Personal Care & Service (51.8%), and Cleaning & Maintenance (32.9%), while the most female-oriented occupations are Healthcare Support (100.0%), Cleaning & Maintenance (67.1%), and Personal Care & Service (48.1%).
| Occupation | Male | Female |
| Healthcare Support | 0 (0.0%) | 18 (100.0%) |
| Security & Protection | 0 (0.0%) | 0 (0.0%) |
| Firefighting & Prevention | 0 (0.0%) | 0 (0.0%) |
| Law Enforcement | 0 (0.0%) | 0 (0.0%) |
| Food Preparation & Serving | 38 (80.8%) | 9 (19.2%) |
| Cleaning & Maintenance | 24 (32.9%) | 49 (67.1%) |
| Personal Care & Service | 14 (51.8%) | 13 (48.1%) |
| Total (Category) | 76 (46.1%) | 89 (53.9%) |
| Total (Overall) | 532 (47.2%) | 594 (52.7%) |
Sales and Office Occupations
The most common Sales and Office occupations in Snow Hill are Office & Administration (251 | 22.3%), and Sales & Related (76 | 6.8%).

Sales and Office Occupations by Sex

| Occupation | Male | Female |
| Sales & Related | 8 (10.5%) | 68 (89.5%) |
| Office & Administration | 27 (10.8%) | 224 (89.2%) |
| Total (Category) | 35 (10.7%) | 292 (89.3%) |
| Total (Overall) | 532 (47.2%) | 594 (52.7%) |
Natural Resources, Construction and Maintenance Occupations
The most common Natural Resources, Construction and Maintenance occupations in Snow Hill are Installation, Maintenance & Repair (101 | 9.0%), and Construction & Extraction (56 | 5.0%).
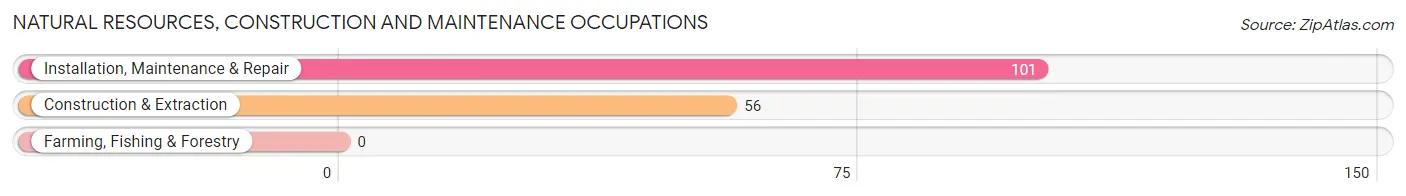
Natural Resources, Construction and Maintenance Occupations by Sex

| Occupation | Male | Female |
| Farming, Fishing & Forestry | 0 (0.0%) | 0 (0.0%) |
| Construction & Extraction | 56 (100.0%) | 0 (0.0%) |
| Installation, Maintenance & Repair | 101 (100.0%) | 0 (0.0%) |
| Total (Category) | 157 (100.0%) | 0 (0.0%) |
| Total (Overall) | 532 (47.2%) | 594 (52.7%) |
Production, Transportation and Moving Occupations
The most common Production, Transportation and Moving occupations in Snow Hill are Material Moving (83 | 7.4%), Transportation (54 | 4.8%), and Production (51 | 4.5%).
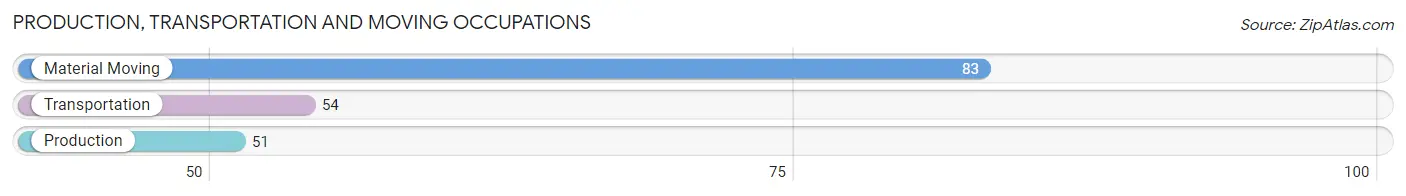
Production, Transportation and Moving Occupations by Sex
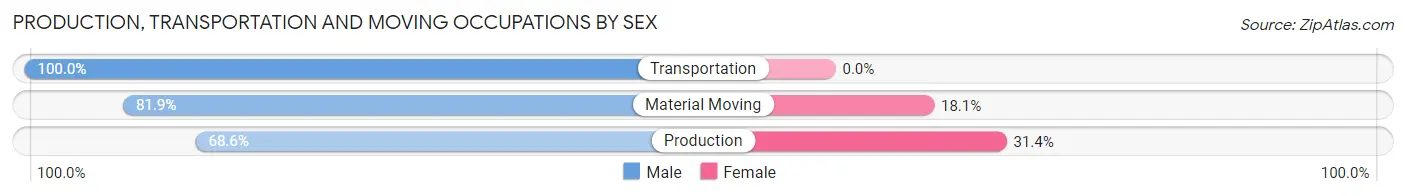
| Occupation | Male | Female |
| Production | 35 (68.6%) | 16 (31.4%) |
| Transportation | 54 (100.0%) | 0 (0.0%) |
| Material Moving | 68 (81.9%) | 15 (18.1%) |
| Total (Category) | 157 (83.5%) | 31 (16.5%) |
| Total (Overall) | 532 (47.2%) | 594 (52.7%) |
Employment Industries by Sex in Snow Hill
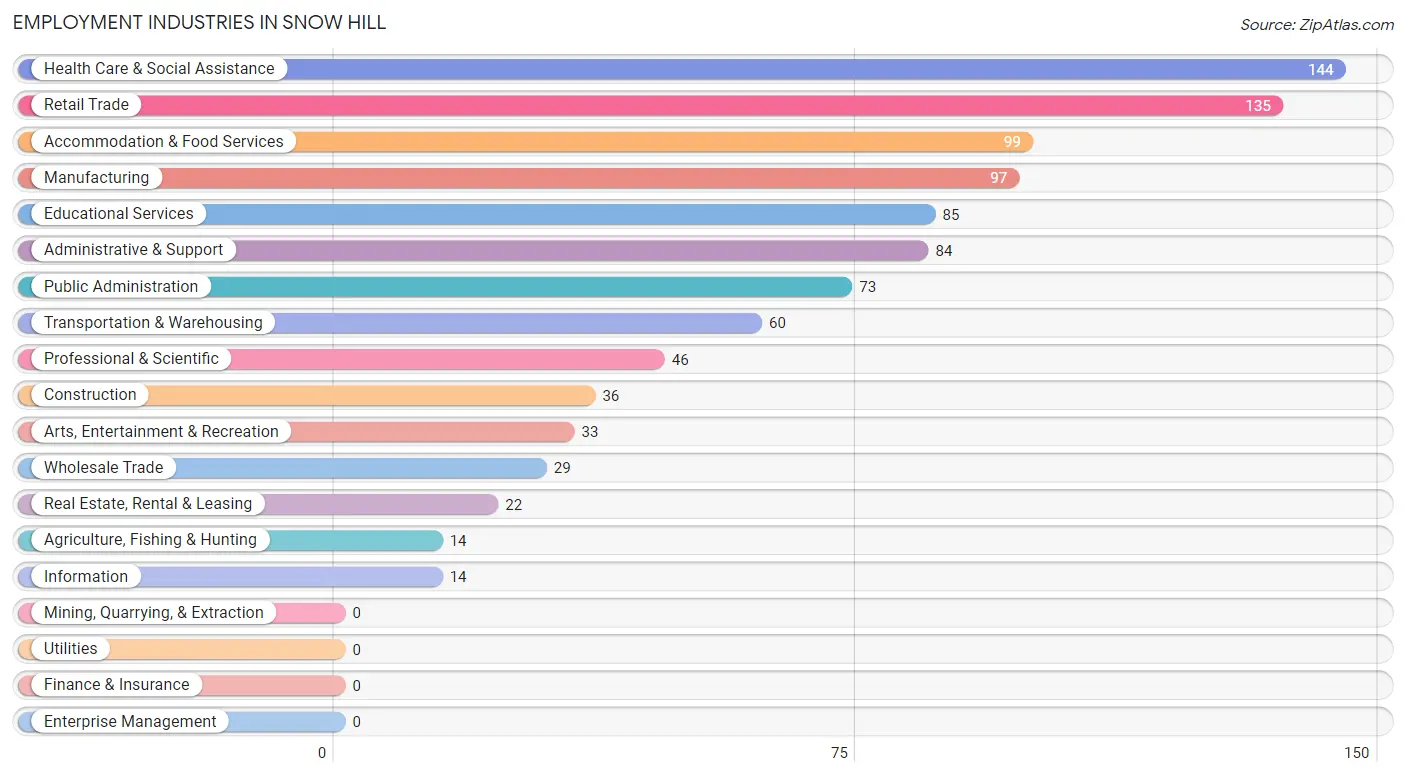
Employment Industries in Snow Hill
The major employment industries in Snow Hill include Health Care & Social Assistance (144 | 12.8%), Retail Trade (135 | 12.0%), Accommodation & Food Services (99 | 8.8%), Manufacturing (97 | 8.6%), and Educational Services (85 | 7.5%).
Employment Industries by Sex in Snow Hill
The Snow Hill industries that see more men than women are Construction (100.0%), Information (100.0%), and Manufacturing (83.5%), whereas the industries that tend to have a higher number of women are Real Estate, Rental & Leasing (100.0%), Health Care & Social Assistance (100.0%), and Transportation & Warehousing (73.3%).
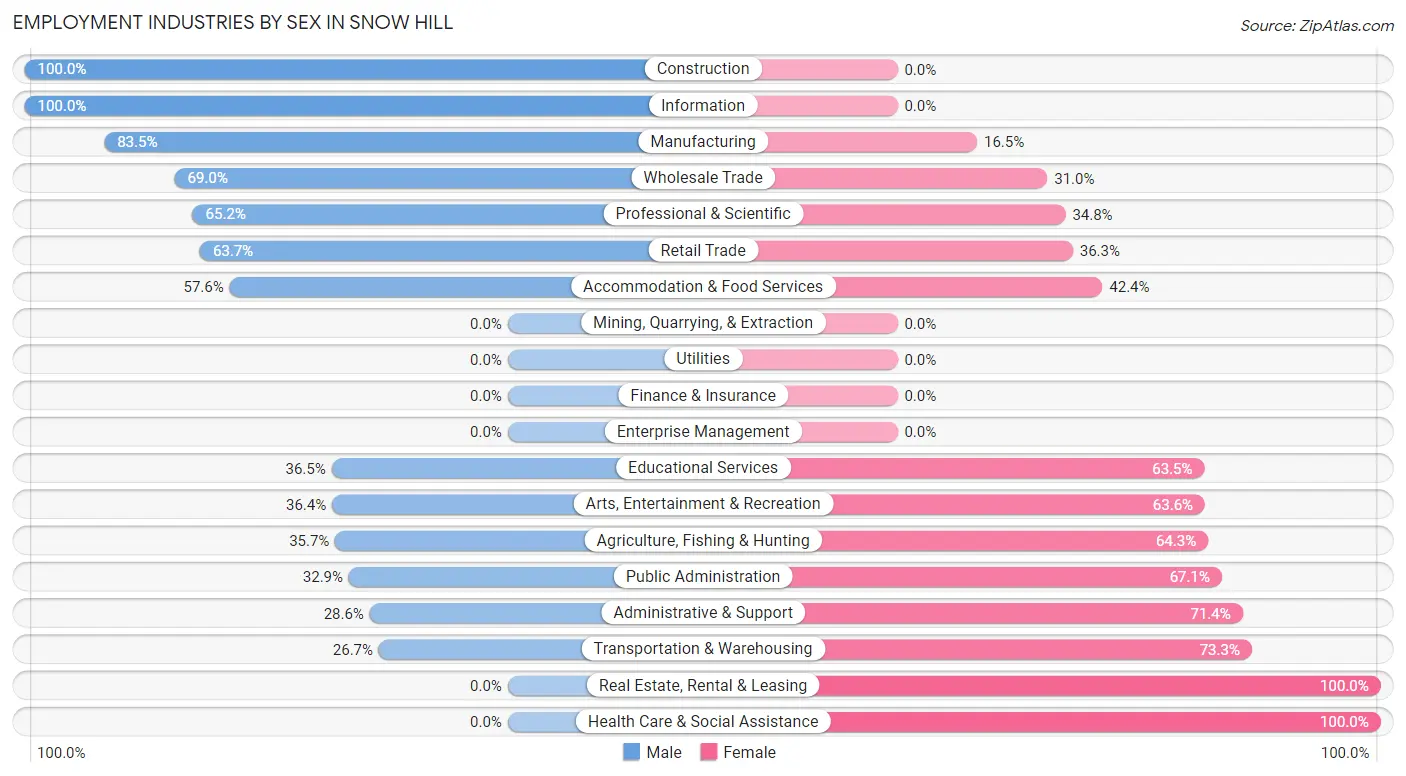
| Industry | Male | Female |
| Agriculture, Fishing & Hunting | 5 (35.7%) | 9 (64.3%) |
| Mining, Quarrying, & Extraction | 0 (0.0%) | 0 (0.0%) |
| Construction | 36 (100.0%) | 0 (0.0%) |
| Manufacturing | 81 (83.5%) | 16 (16.5%) |
| Wholesale Trade | 20 (69.0%) | 9 (31.0%) |
| Retail Trade | 86 (63.7%) | 49 (36.3%) |
| Transportation & Warehousing | 16 (26.7%) | 44 (73.3%) |
| Utilities | 0 (0.0%) | 0 (0.0%) |
| Information | 14 (100.0%) | 0 (0.0%) |
| Finance & Insurance | 0 (0.0%) | 0 (0.0%) |
| Real Estate, Rental & Leasing | 0 (0.0%) | 22 (100.0%) |
| Professional & Scientific | 30 (65.2%) | 16 (34.8%) |
| Enterprise Management | 0 (0.0%) | 0 (0.0%) |
| Administrative & Support | 24 (28.6%) | 60 (71.4%) |
| Educational Services | 31 (36.5%) | 54 (63.5%) |
| Health Care & Social Assistance | 0 (0.0%) | 144 (100.0%) |
| Arts, Entertainment & Recreation | 12 (36.4%) | 21 (63.6%) |
| Accommodation & Food Services | 57 (57.6%) | 42 (42.4%) |
| Public Administration | 24 (32.9%) | 49 (67.1%) |
| Total | 532 (47.2%) | 594 (52.7%) |
Education in Snow Hill
School Enrollment in Snow Hill
The most common levels of schooling among the 673 students in Snow Hill are elementary school (243 | 36.1%), high school (220 | 32.7%), and middle school (103 | 15.3%).
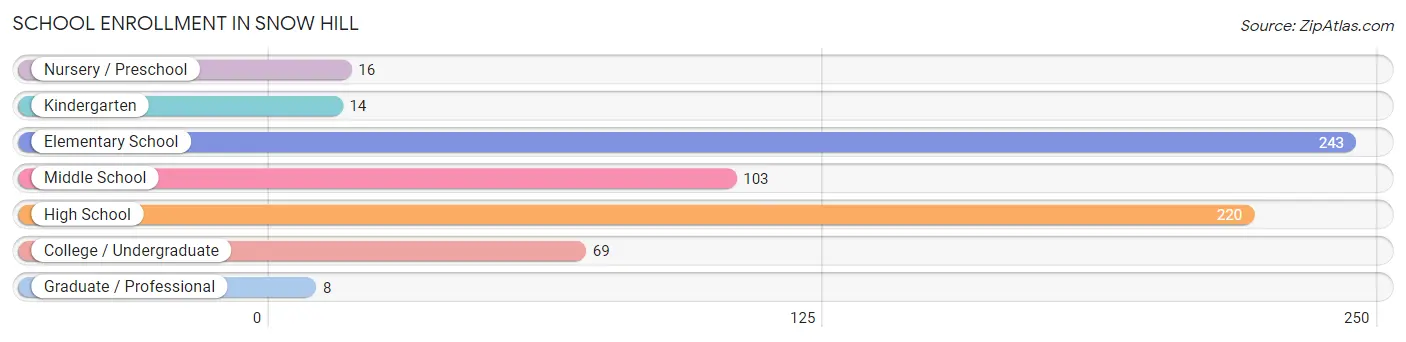
| School Level | # Students | % Students |
| Nursery / Preschool | 16 | 2.4% |
| Kindergarten | 14 | 2.1% |
| Elementary School | 243 | 36.1% |
| Middle School | 103 | 15.3% |
| High School | 220 | 32.7% |
| College / Undergraduate | 69 | 10.2% |
| Graduate / Professional | 8 | 1.2% |
| Total | 673 | 100.0% |
School Enrollment by Age by Funding Source in Snow Hill
Out of a total of 673 students who are enrolled in schools in Snow Hill, 24 (3.6%) attend a private institution, while the remaining 649 (96.4%) are enrolled in public schools. The age group of 35 years and over has the highest likelihood of being enrolled in private schools, with 8 (50.0% in the age bracket) enrolled. Conversely, the age group of 5 to 9 year old has the lowest likelihood of being enrolled in a private school, with 215 (100.0% in the age bracket) attending a public institution.
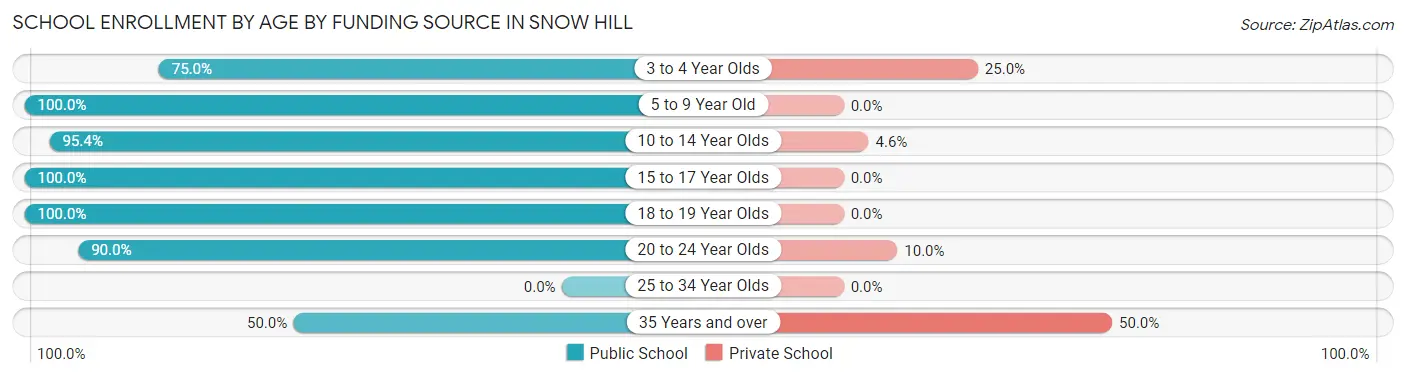
| Age Bracket | Public School | Private School |
| 3 to 4 Year Olds | 12 (75.0%) | 4 (25.0%) |
| 5 to 9 Year Old | 215 (100.0%) | 0 (0.0%) |
| 10 to 14 Year Olds | 144 (95.4%) | 7 (4.6%) |
| 15 to 17 Year Olds | 192 (100.0%) | 0 (0.0%) |
| 18 to 19 Year Olds | 33 (100.0%) | 0 (0.0%) |
| 20 to 24 Year Olds | 45 (90.0%) | 5 (10.0%) |
| 25 to 34 Year Olds | 0 (0.0%) | 0 (0.0%) |
| 35 Years and over | 8 (50.0%) | 8 (50.0%) |
| Total | 649 (96.4%) | 24 (3.6%) |
Educational Attainment by Field of Study in Snow Hill
Business (129 | 31.4%), education (63 | 15.3%), visual & performing arts (56 | 13.6%), liberal arts & history (39 | 9.5%), and science & technology (26 | 6.3%) are the most common fields of study among 411 individuals in Snow Hill who have obtained a bachelor's degree or higher.
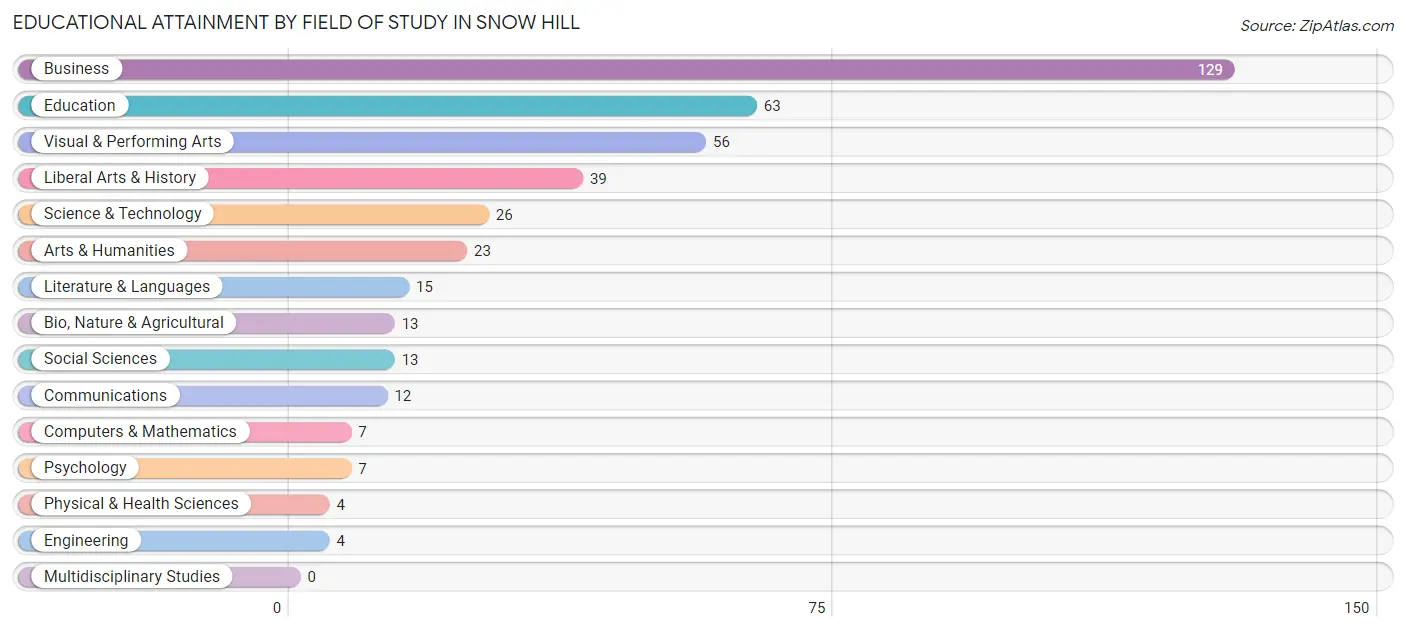
| Field of Study | # Graduates | % Graduates |
| Computers & Mathematics | 7 | 1.7% |
| Bio, Nature & Agricultural | 13 | 3.2% |
| Physical & Health Sciences | 4 | 1.0% |
| Psychology | 7 | 1.7% |
| Social Sciences | 13 | 3.2% |
| Engineering | 4 | 1.0% |
| Multidisciplinary Studies | 0 | 0.0% |
| Science & Technology | 26 | 6.3% |
| Business | 129 | 31.4% |
| Education | 63 | 15.3% |
| Literature & Languages | 15 | 3.6% |
| Liberal Arts & History | 39 | 9.5% |
| Visual & Performing Arts | 56 | 13.6% |
| Communications | 12 | 2.9% |
| Arts & Humanities | 23 | 5.6% |
| Total | 411 | 100.0% |
Transportation & Commute in Snow Hill
Vehicle Availability by Sex in Snow Hill
The most prevalent vehicle ownership categories in Snow Hill are males with 3 vehicles (238, accounting for 47.5%) and females with 3 vehicles (169, making up 41.0%).
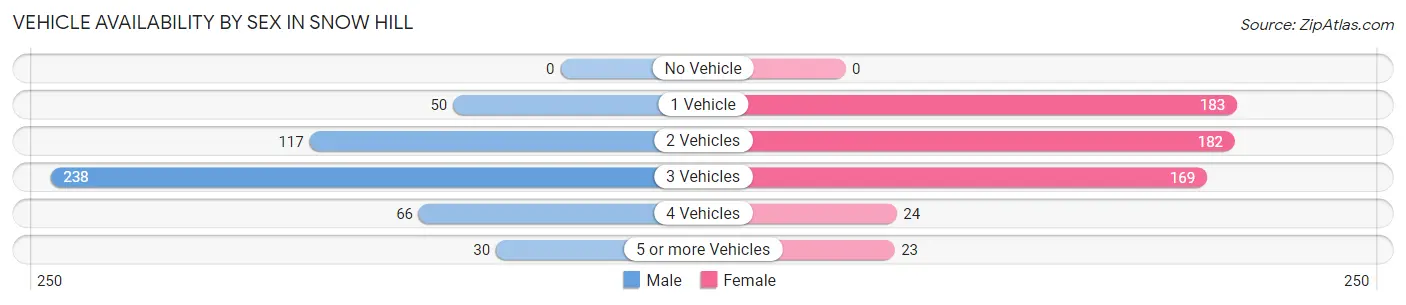
| Vehicles Available | Male | Female |
| No Vehicle | 0 (0.0%) | 0 (0.0%) |
| 1 Vehicle | 50 (10.0%) | 183 (31.5%) |
| 2 Vehicles | 117 (23.4%) | 182 (31.3%) |
| 3 Vehicles | 238 (47.5%) | 169 (29.1%) |
| 4 Vehicles | 66 (13.2%) | 24 (4.1%) |
| 5 or more Vehicles | 30 (6.0%) | 23 (4.0%) |
| Total | 501 (100.0%) | 581 (100.0%) |
Commute Time in Snow Hill
The most frequently occuring commute durations in Snow Hill are 30 to 34 minutes (244 commuters, 24.1%), 20 to 24 minutes (229 commuters, 22.6%), and 5 to 9 minutes (190 commuters, 18.8%).
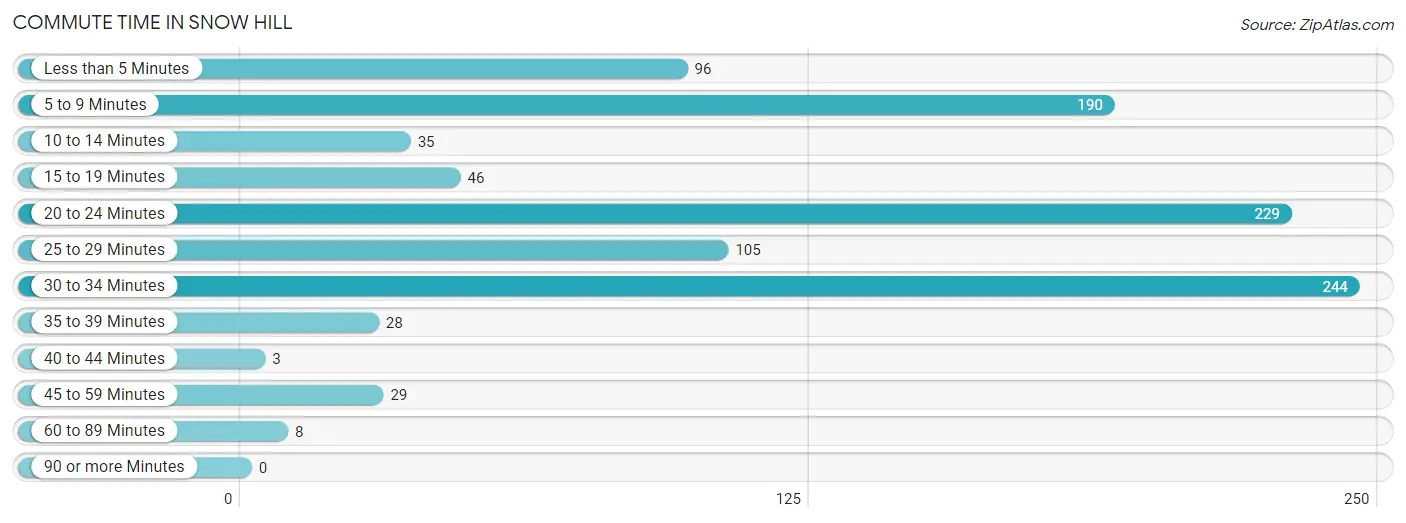
| Commute Time | # Commuters | % Commuters |
| Less than 5 Minutes | 96 | 9.5% |
| 5 to 9 Minutes | 190 | 18.8% |
| 10 to 14 Minutes | 35 | 3.5% |
| 15 to 19 Minutes | 46 | 4.5% |
| 20 to 24 Minutes | 229 | 22.6% |
| 25 to 29 Minutes | 105 | 10.4% |
| 30 to 34 Minutes | 244 | 24.1% |
| 35 to 39 Minutes | 28 | 2.8% |
| 40 to 44 Minutes | 3 | 0.3% |
| 45 to 59 Minutes | 29 | 2.9% |
| 60 to 89 Minutes | 8 | 0.8% |
| 90 or more Minutes | 0 | 0.0% |
Commute Time by Sex in Snow Hill
The most common commute times in Snow Hill are 30 to 34 minutes (118 commuters, 24.9%) for males and 30 to 34 minutes (126 commuters, 23.3%) for females.
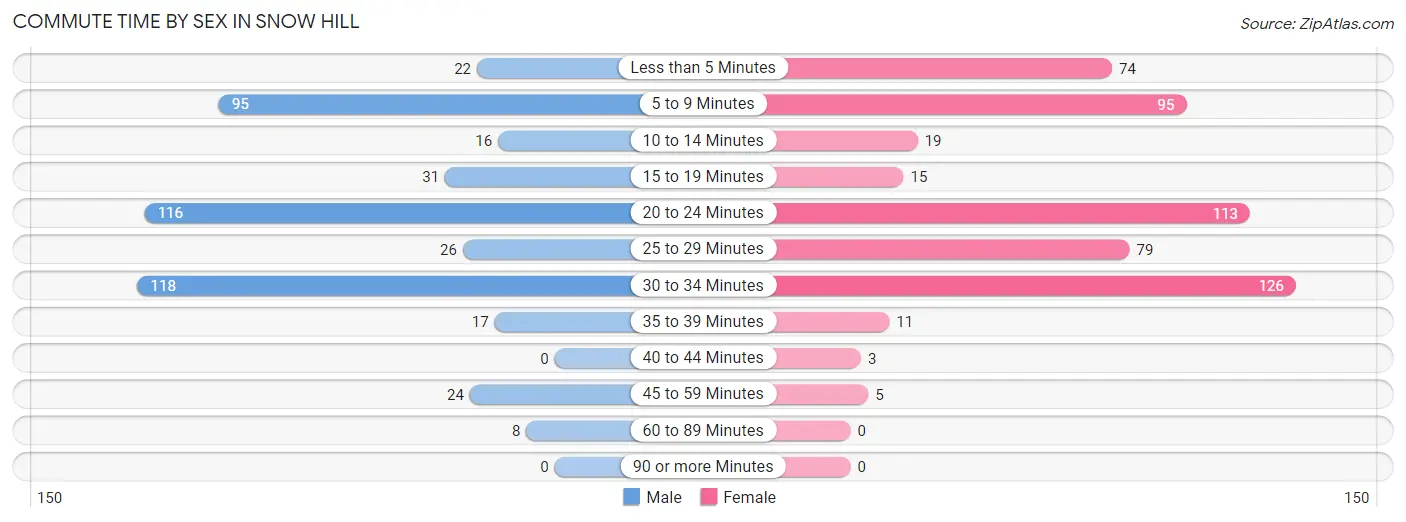
| Commute Time | Male | Female |
| Less than 5 Minutes | 22 (4.6%) | 74 (13.7%) |
| 5 to 9 Minutes | 95 (20.1%) | 95 (17.6%) |
| 10 to 14 Minutes | 16 (3.4%) | 19 (3.5%) |
| 15 to 19 Minutes | 31 (6.6%) | 15 (2.8%) |
| 20 to 24 Minutes | 116 (24.5%) | 113 (20.9%) |
| 25 to 29 Minutes | 26 (5.5%) | 79 (14.6%) |
| 30 to 34 Minutes | 118 (24.9%) | 126 (23.3%) |
| 35 to 39 Minutes | 17 (3.6%) | 11 (2.0%) |
| 40 to 44 Minutes | 0 (0.0%) | 3 (0.6%) |
| 45 to 59 Minutes | 24 (5.1%) | 5 (0.9%) |
| 60 to 89 Minutes | 8 (1.7%) | 0 (0.0%) |
| 90 or more Minutes | 0 (0.0%) | 0 (0.0%) |
Time of Departure to Work by Sex in Snow Hill
The most frequent times of departure to work in Snow Hill are 12:00 PM to 3:59 PM (164, 34.7%) for males and 7:00 AM to 7:29 AM (146, 27.0%) for females.
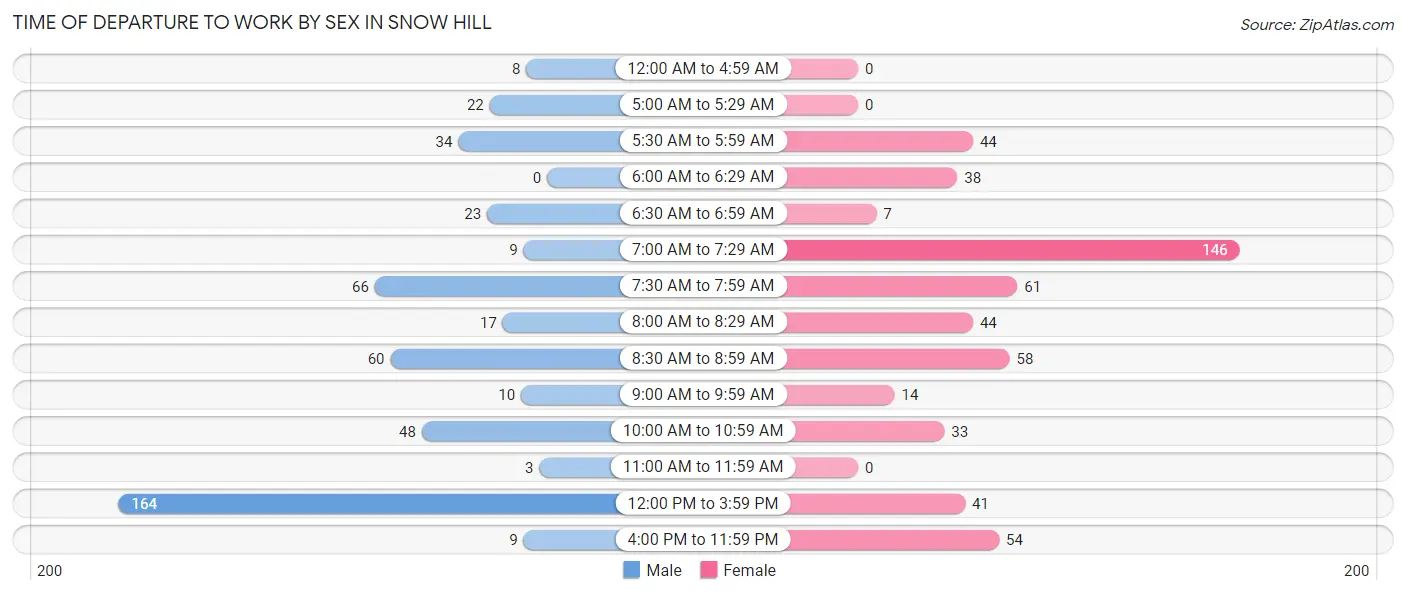
| Time of Departure | Male | Female |
| 12:00 AM to 4:59 AM | 8 (1.7%) | 0 (0.0%) |
| 5:00 AM to 5:29 AM | 22 (4.6%) | 0 (0.0%) |
| 5:30 AM to 5:59 AM | 34 (7.2%) | 44 (8.2%) |
| 6:00 AM to 6:29 AM | 0 (0.0%) | 38 (7.0%) |
| 6:30 AM to 6:59 AM | 23 (4.9%) | 7 (1.3%) |
| 7:00 AM to 7:29 AM | 9 (1.9%) | 146 (27.0%) |
| 7:30 AM to 7:59 AM | 66 (14.0%) | 61 (11.3%) |
| 8:00 AM to 8:29 AM | 17 (3.6%) | 44 (8.2%) |
| 8:30 AM to 8:59 AM | 60 (12.7%) | 58 (10.7%) |
| 9:00 AM to 9:59 AM | 10 (2.1%) | 14 (2.6%) |
| 10:00 AM to 10:59 AM | 48 (10.2%) | 33 (6.1%) |
| 11:00 AM to 11:59 AM | 3 (0.6%) | 0 (0.0%) |
| 12:00 PM to 3:59 PM | 164 (34.7%) | 41 (7.6%) |
| 4:00 PM to 11:59 PM | 9 (1.9%) | 54 (10.0%) |
| Total | 473 (100.0%) | 540 (100.0%) |
Housing Occupancy in Snow Hill
Occupancy by Ownership in Snow Hill
Of the total 900 dwellings in Snow Hill, owner-occupied units account for 559 (62.1%), while renter-occupied units make up 341 (37.9%).
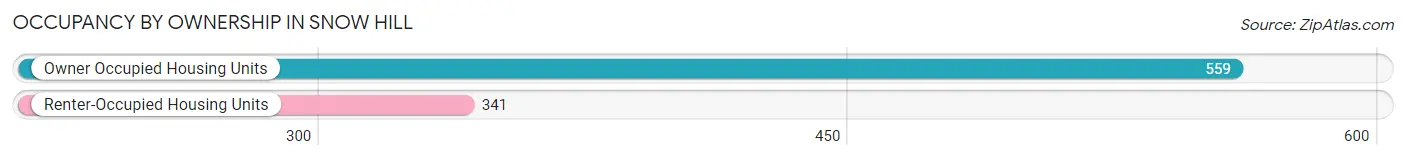
| Occupancy | # Housing Units | % Housing Units |
| Owner Occupied Housing Units | 559 | 62.1% |
| Renter-Occupied Housing Units | 341 | 37.9% |
| Total Occupied Housing Units | 900 | 100.0% |
Occupancy by Household Size in Snow Hill
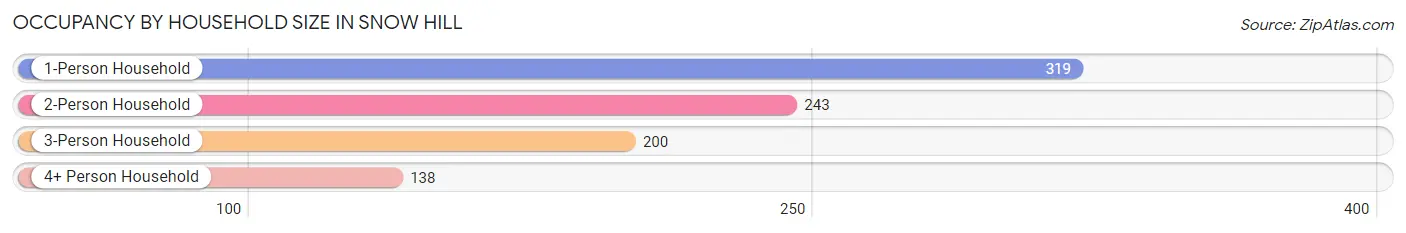
| Household Size | # Housing Units | % Housing Units |
| 1-Person Household | 319 | 35.4% |
| 2-Person Household | 243 | 27.0% |
| 3-Person Household | 200 | 22.2% |
| 4+ Person Household | 138 | 15.3% |
| Total Housing Units | 900 | 100.0% |
Occupancy by Ownership by Household Size in Snow Hill
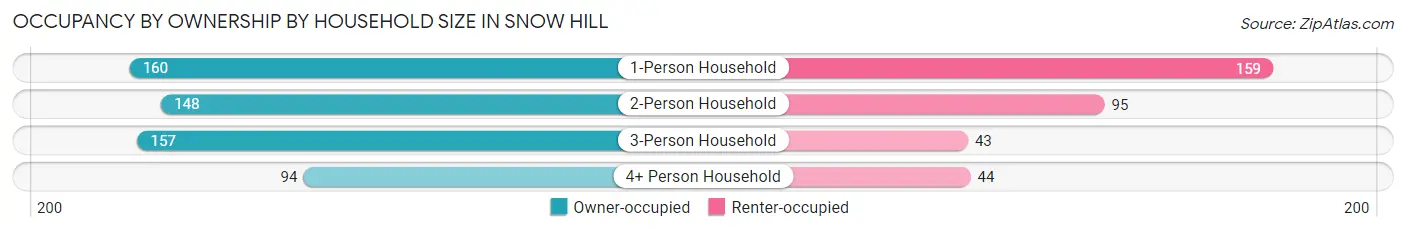
| Household Size | Owner-occupied | Renter-occupied |
| 1-Person Household | 160 (50.2%) | 159 (49.8%) |
| 2-Person Household | 148 (60.9%) | 95 (39.1%) |
| 3-Person Household | 157 (78.5%) | 43 (21.5%) |
| 4+ Person Household | 94 (68.1%) | 44 (31.9%) |
| Total Housing Units | 559 (62.1%) | 341 (37.9%) |
Occupancy by Educational Attainment in Snow Hill
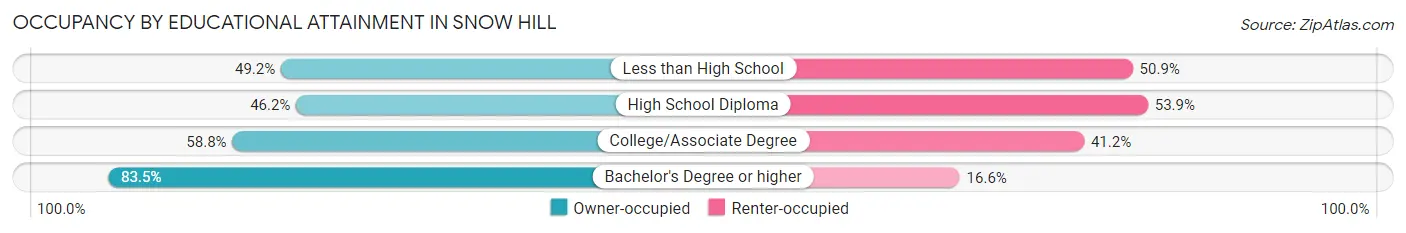
| Household Size | Owner-occupied | Renter-occupied |
| Less than High School | 29 (49.1%) | 30 (50.8%) |
| High School Diploma | 126 (46.2%) | 147 (53.8%) |
| College/Associate Degree | 167 (58.8%) | 117 (41.2%) |
| Bachelor's Degree or higher | 237 (83.5%) | 47 (16.6%) |
Occupancy by Age of Householder in Snow Hill
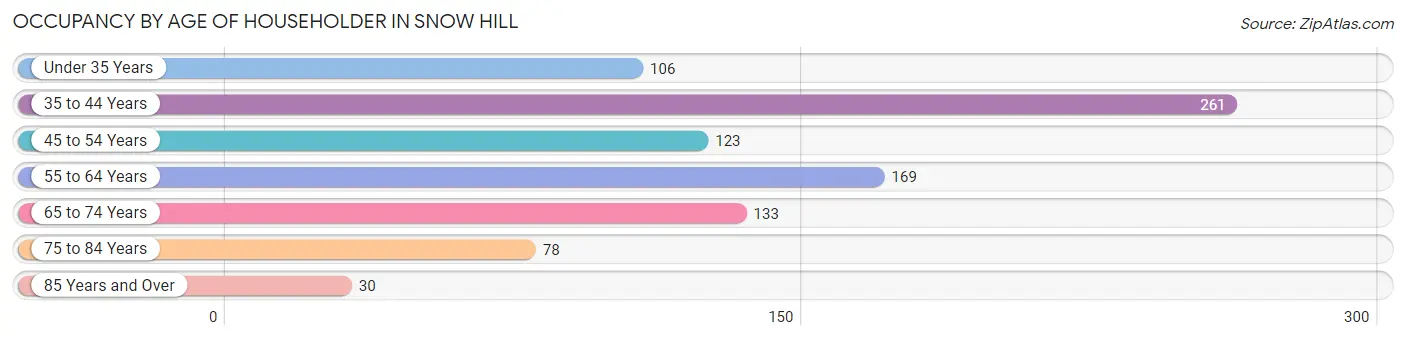
| Age Bracket | # Households | % Households |
| Under 35 Years | 106 | 11.8% |
| 35 to 44 Years | 261 | 29.0% |
| 45 to 54 Years | 123 | 13.7% |
| 55 to 64 Years | 169 | 18.8% |
| 65 to 74 Years | 133 | 14.8% |
| 75 to 84 Years | 78 | 8.7% |
| 85 Years and Over | 30 | 3.3% |
| Total | 900 | 100.0% |
Housing Finances in Snow Hill
Median Income by Occupancy in Snow Hill
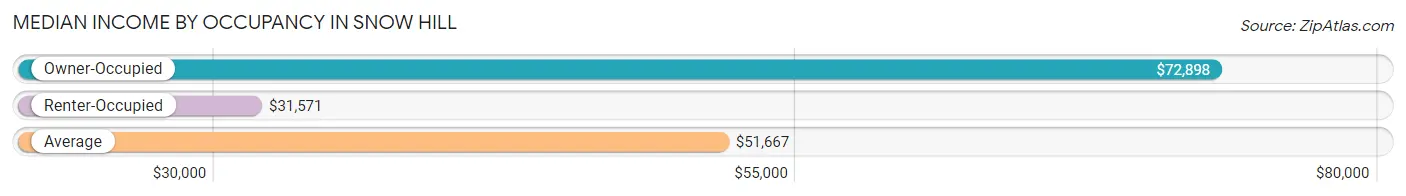
| Occupancy Type | # Households | Median Income |
| Owner-Occupied | 559 (62.1%) | $72,898 |
| Renter-Occupied | 341 (37.9%) | $31,571 |
| Average | 900 (100.0%) | $51,667 |
Occupancy by Householder Income Bracket in Snow Hill
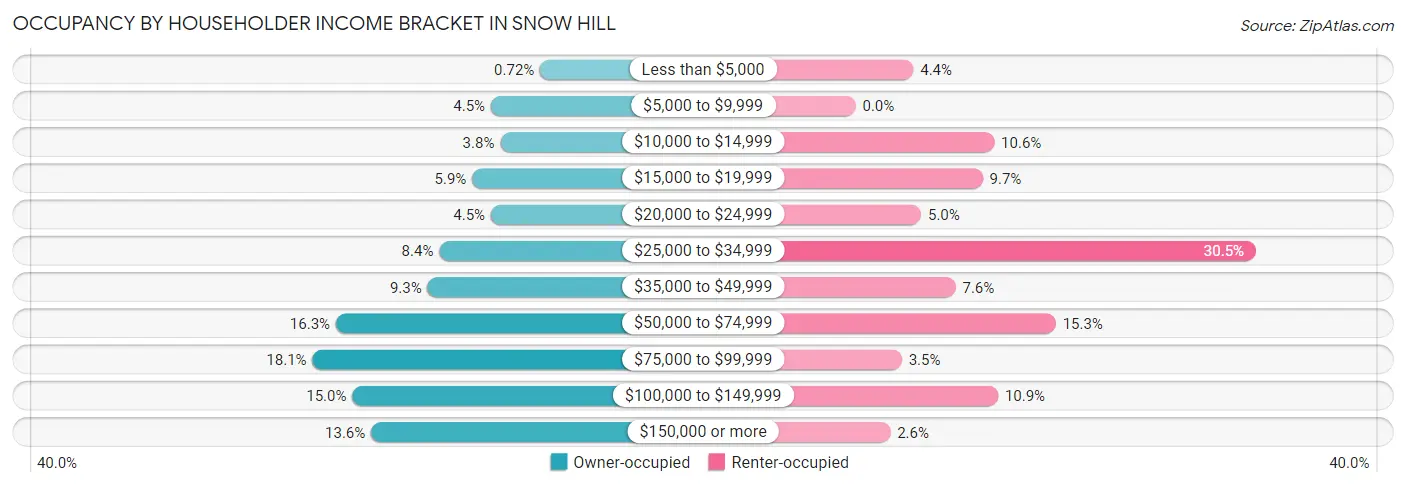
| Income Bracket | Owner-occupied | Renter-occupied |
| Less than $5,000 | 4 (0.7%) | 15 (4.4%) |
| $5,000 to $9,999 | 25 (4.5%) | 0 (0.0%) |
| $10,000 to $14,999 | 21 (3.8%) | 36 (10.6%) |
| $15,000 to $19,999 | 33 (5.9%) | 33 (9.7%) |
| $20,000 to $24,999 | 25 (4.5%) | 17 (5.0%) |
| $25,000 to $34,999 | 47 (8.4%) | 104 (30.5%) |
| $35,000 to $49,999 | 52 (9.3%) | 26 (7.6%) |
| $50,000 to $74,999 | 91 (16.3%) | 52 (15.2%) |
| $75,000 to $99,999 | 101 (18.1%) | 12 (3.5%) |
| $100,000 to $149,999 | 84 (15.0%) | 37 (10.8%) |
| $150,000 or more | 76 (13.6%) | 9 (2.6%) |
| Total | 559 (100.0%) | 341 (100.0%) |
Monthly Housing Cost Tiers in Snow Hill
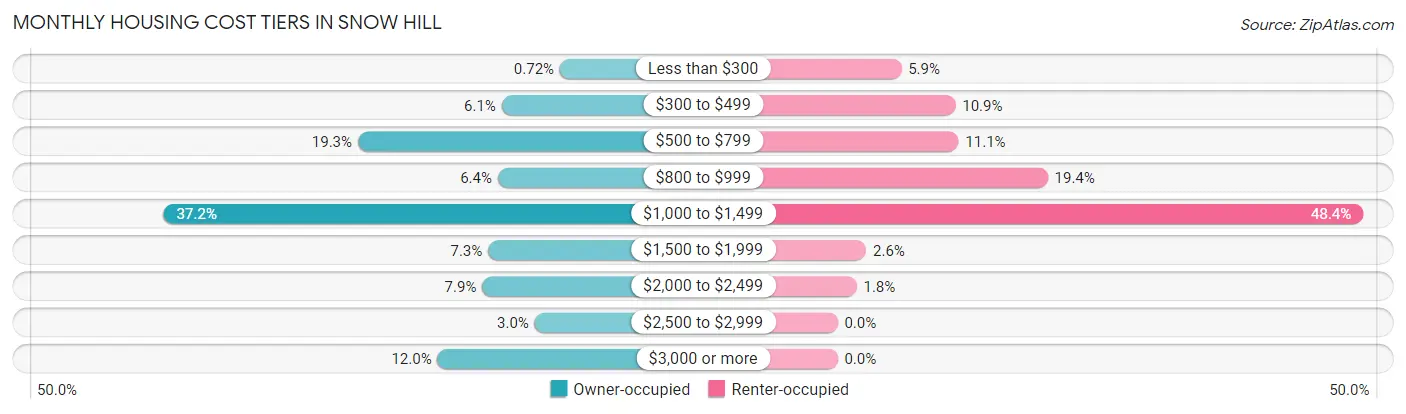
| Monthly Cost | Owner-occupied | Renter-occupied |
| Less than $300 | 4 (0.7%) | 20 (5.9%) |
| $300 to $499 | 34 (6.1%) | 37 (10.8%) |
| $500 to $799 | 108 (19.3%) | 38 (11.1%) |
| $800 to $999 | 36 (6.4%) | 66 (19.4%) |
| $1,000 to $1,499 | 208 (37.2%) | 165 (48.4%) |
| $1,500 to $1,999 | 41 (7.3%) | 9 (2.6%) |
| $2,000 to $2,499 | 44 (7.9%) | 6 (1.8%) |
| $2,500 to $2,999 | 17 (3.0%) | 0 (0.0%) |
| $3,000 or more | 67 (12.0%) | 0 (0.0%) |
| Total | 559 (100.0%) | 341 (100.0%) |
Physical Housing Characteristics in Snow Hill
Housing Structures in Snow Hill
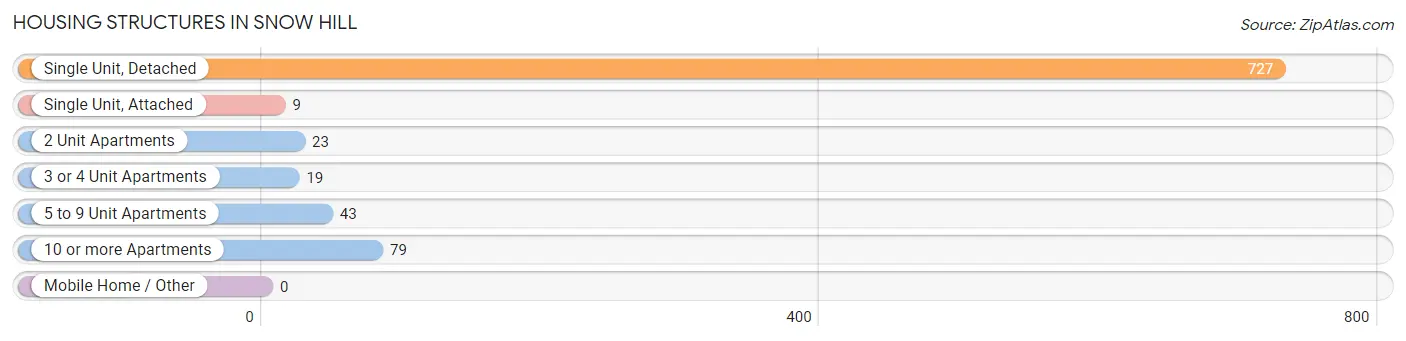
| Structure Type | # Housing Units | % Housing Units |
| Single Unit, Detached | 727 | 80.8% |
| Single Unit, Attached | 9 | 1.0% |
| 2 Unit Apartments | 23 | 2.6% |
| 3 or 4 Unit Apartments | 19 | 2.1% |
| 5 to 9 Unit Apartments | 43 | 4.8% |
| 10 or more Apartments | 79 | 8.8% |
| Mobile Home / Other | 0 | 0.0% |
| Total | 900 | 100.0% |
Housing Structures by Occupancy in Snow Hill
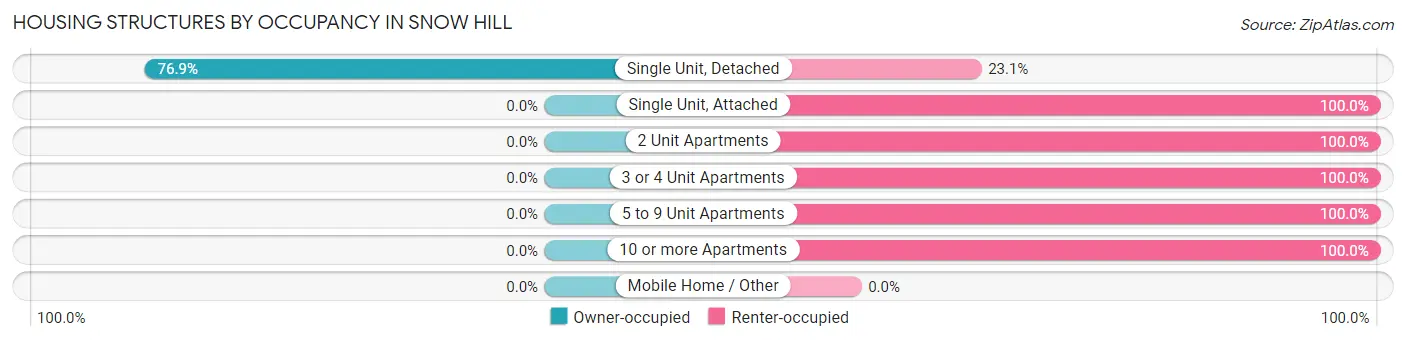
| Structure Type | Owner-occupied | Renter-occupied |
| Single Unit, Detached | 559 (76.9%) | 168 (23.1%) |
| Single Unit, Attached | 0 (0.0%) | 9 (100.0%) |
| 2 Unit Apartments | 0 (0.0%) | 23 (100.0%) |
| 3 or 4 Unit Apartments | 0 (0.0%) | 19 (100.0%) |
| 5 to 9 Unit Apartments | 0 (0.0%) | 43 (100.0%) |
| 10 or more Apartments | 0 (0.0%) | 79 (100.0%) |
| Mobile Home / Other | 0 (0.0%) | 0 (0.0%) |
| Total | 559 (62.1%) | 341 (37.9%) |
Housing Structures by Number of Rooms in Snow Hill
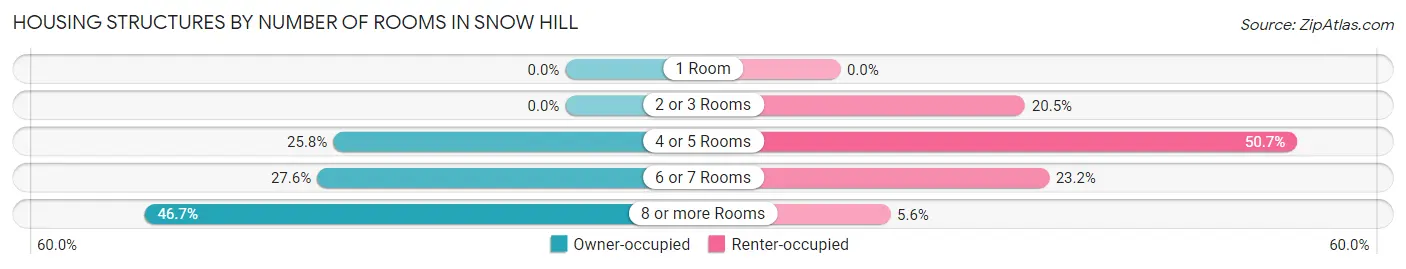
| Number of Rooms | Owner-occupied | Renter-occupied |
| 1 Room | 0 (0.0%) | 0 (0.0%) |
| 2 or 3 Rooms | 0 (0.0%) | 70 (20.5%) |
| 4 or 5 Rooms | 144 (25.8%) | 173 (50.7%) |
| 6 or 7 Rooms | 154 (27.6%) | 79 (23.2%) |
| 8 or more Rooms | 261 (46.7%) | 19 (5.6%) |
| Total | 559 (100.0%) | 341 (100.0%) |
Housing Structure by Heating Type in Snow Hill
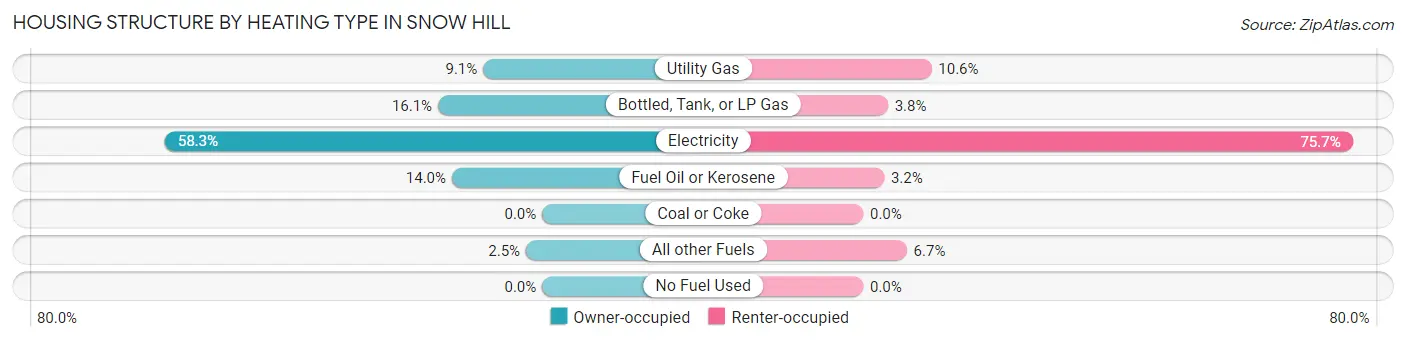
| Heating Type | Owner-occupied | Renter-occupied |
| Utility Gas | 51 (9.1%) | 36 (10.6%) |
| Bottled, Tank, or LP Gas | 90 (16.1%) | 13 (3.8%) |
| Electricity | 326 (58.3%) | 258 (75.7%) |
| Fuel Oil or Kerosene | 78 (14.0%) | 11 (3.2%) |
| Coal or Coke | 0 (0.0%) | 0 (0.0%) |
| All other Fuels | 14 (2.5%) | 23 (6.7%) |
| No Fuel Used | 0 (0.0%) | 0 (0.0%) |
| Total | 559 (100.0%) | 341 (100.0%) |
Household Vehicle Usage in Snow Hill
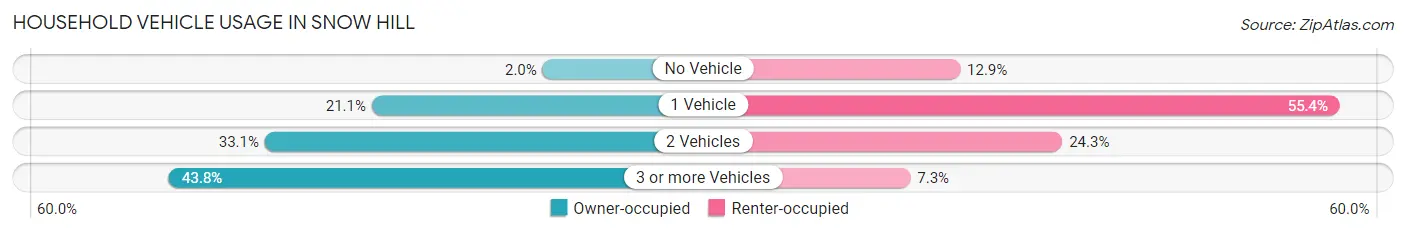
| Vehicles per Household | Owner-occupied | Renter-occupied |
| No Vehicle | 11 (2.0%) | 44 (12.9%) |
| 1 Vehicle | 118 (21.1%) | 189 (55.4%) |
| 2 Vehicles | 185 (33.1%) | 83 (24.3%) |
| 3 or more Vehicles | 245 (43.8%) | 25 (7.3%) |
| Total | 559 (100.0%) | 341 (100.0%) |
Real Estate & Mortgages in Snow Hill
Real Estate and Mortgage Overview in Snow Hill
| Characteristic | Without Mortgage | With Mortgage |
| Housing Units | 157 | 402 |
| Median Property Value | $129,500 | $193,200 |
| Median Household Income | $60,417 | $71 |
| Monthly Housing Costs | $606 | $67 |
| Real Estate Taxes | $1,919 | $15 |
Property Value by Mortgage Status in Snow Hill
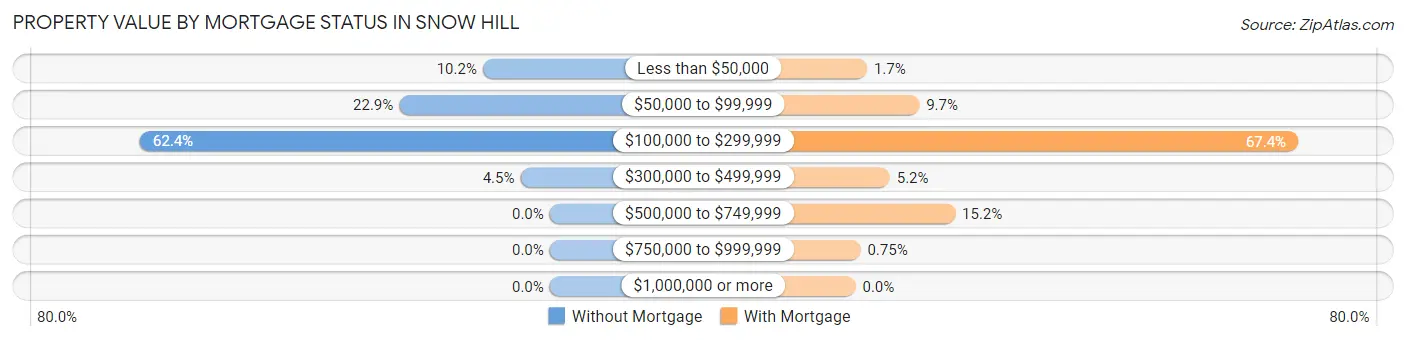
| Property Value | Without Mortgage | With Mortgage |
| Less than $50,000 | 16 (10.2%) | 7 (1.7%) |
| $50,000 to $99,999 | 36 (22.9%) | 39 (9.7%) |
| $100,000 to $299,999 | 98 (62.4%) | 271 (67.4%) |
| $300,000 to $499,999 | 7 (4.5%) | 21 (5.2%) |
| $500,000 to $749,999 | 0 (0.0%) | 61 (15.2%) |
| $750,000 to $999,999 | 0 (0.0%) | 3 (0.7%) |
| $1,000,000 or more | 0 (0.0%) | 0 (0.0%) |
| Total | 157 (100.0%) | 402 (100.0%) |
Household Income by Mortgage Status in Snow Hill
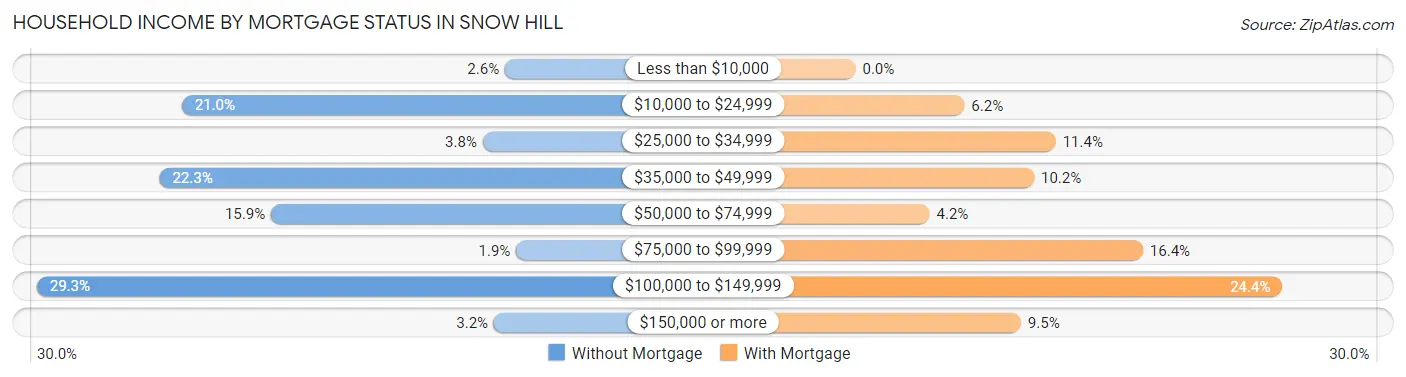
| Household Income | Without Mortgage | With Mortgage |
| Less than $10,000 | 4 (2.5%) | 0 (0.0%) |
| $10,000 to $24,999 | 33 (21.0%) | 25 (6.2%) |
| $25,000 to $34,999 | 6 (3.8%) | 46 (11.4%) |
| $35,000 to $49,999 | 35 (22.3%) | 41 (10.2%) |
| $50,000 to $74,999 | 25 (15.9%) | 17 (4.2%) |
| $75,000 to $99,999 | 3 (1.9%) | 66 (16.4%) |
| $100,000 to $149,999 | 46 (29.3%) | 98 (24.4%) |
| $150,000 or more | 5 (3.2%) | 38 (9.5%) |
| Total | 157 (100.0%) | 402 (100.0%) |
Property Value to Household Income Ratio in Snow Hill
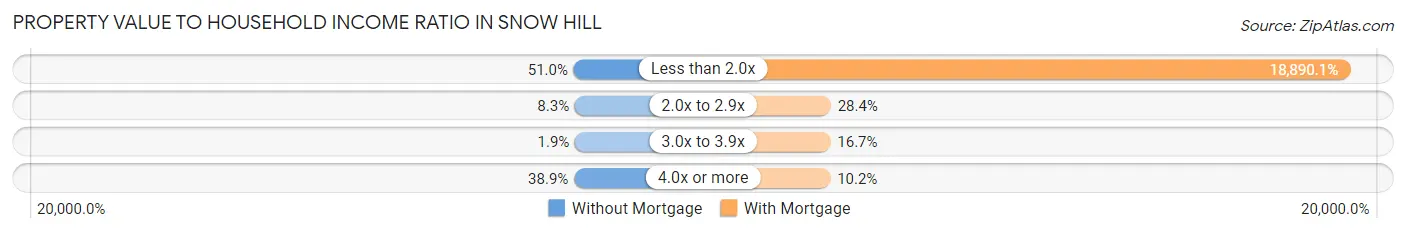
| Value-to-Income Ratio | Without Mortgage | With Mortgage |
| Less than 2.0x | 80 (51.0%) | 75,938 (18,890.0%) |
| 2.0x to 2.9x | 13 (8.3%) | 114 (28.4%) |
| 3.0x to 3.9x | 3 (1.9%) | 67 (16.7%) |
| 4.0x or more | 61 (38.9%) | 41 (10.2%) |
| Total | 157 (100.0%) | 402 (100.0%) |
Real Estate Taxes by Mortgage Status in Snow Hill
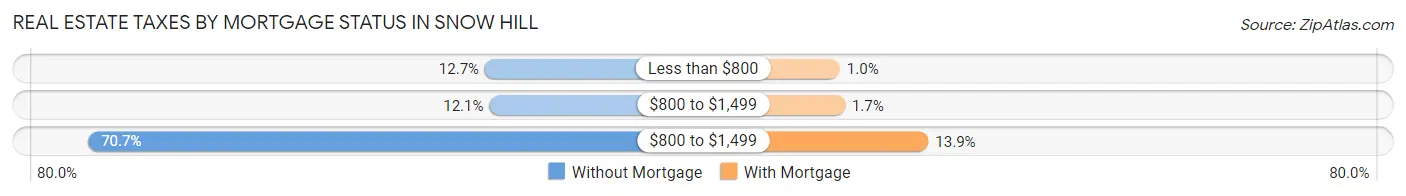
| Property Taxes | Without Mortgage | With Mortgage |
| Less than $800 | 20 (12.7%) | 4 (1.0%) |
| $800 to $1,499 | 19 (12.1%) | 7 (1.7%) |
| $800 to $1,499 | 111 (70.7%) | 56 (13.9%) |
| Total | 157 (100.0%) | 402 (100.0%) |
Health & Disability in Snow Hill
Health Insurance Coverage by Age in Snow Hill
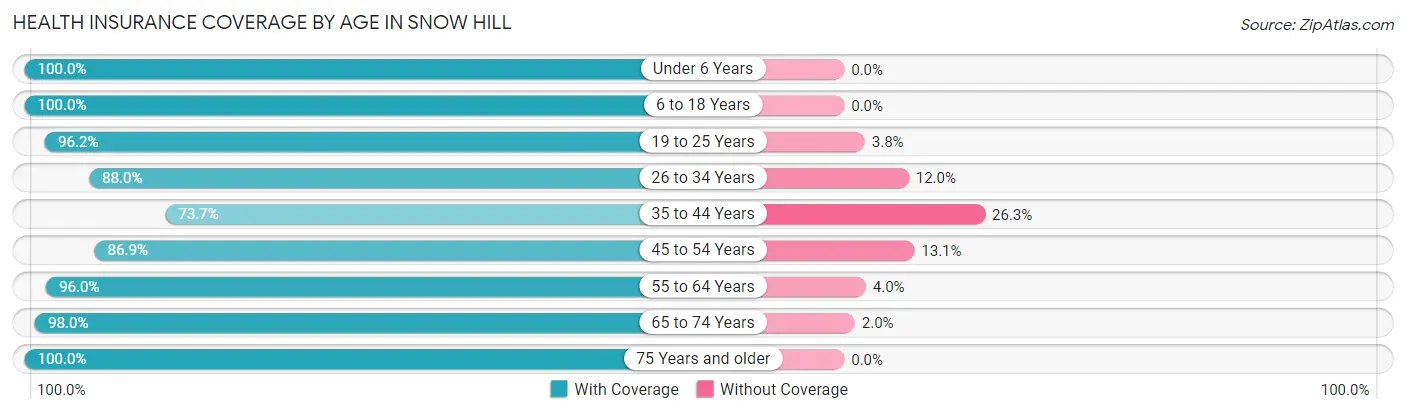
| Age Bracket | With Coverage | Without Coverage |
| Under 6 Years | 63 (100.0%) | 0 (0.0%) |
| 6 to 18 Years | 593 (100.0%) | 0 (0.0%) |
| 19 to 25 Years | 201 (96.2%) | 8 (3.8%) |
| 26 to 34 Years | 161 (88.0%) | 22 (12.0%) |
| 35 to 44 Years | 337 (73.7%) | 120 (26.3%) |
| 45 to 54 Years | 173 (86.9%) | 26 (13.1%) |
| 55 to 64 Years | 239 (96.0%) | 10 (4.0%) |
| 65 to 74 Years | 200 (98.0%) | 4 (2.0%) |
| 75 Years and older | 152 (100.0%) | 0 (0.0%) |
| Total | 2,119 (91.8%) | 190 (8.2%) |
Health Insurance Coverage by Citizenship Status in Snow Hill
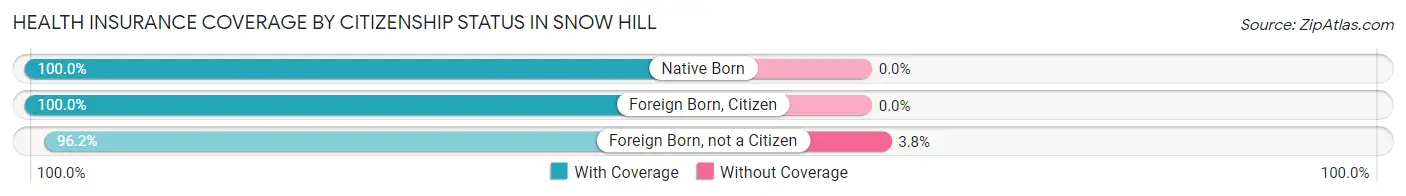
| Citizenship Status | With Coverage | Without Coverage |
| Native Born | 63 (100.0%) | 0 (0.0%) |
| Foreign Born, Citizen | 593 (100.0%) | 0 (0.0%) |
| Foreign Born, not a Citizen | 201 (96.2%) | 8 (3.8%) |
Health Insurance Coverage by Household Income in Snow Hill
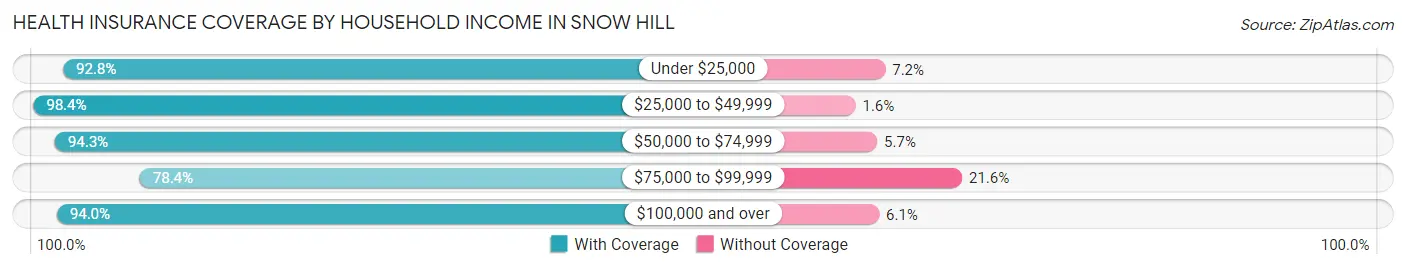
| Household Income | With Coverage | Without Coverage |
| Under $25,000 | 412 (92.8%) | 32 (7.2%) |
| $25,000 to $49,999 | 420 (98.4%) | 7 (1.6%) |
| $50,000 to $74,999 | 282 (94.3%) | 17 (5.7%) |
| $75,000 to $99,999 | 334 (78.4%) | 92 (21.6%) |
| $100,000 and over | 652 (94.0%) | 42 (6.0%) |
Public vs Private Health Insurance Coverage by Age in Snow Hill
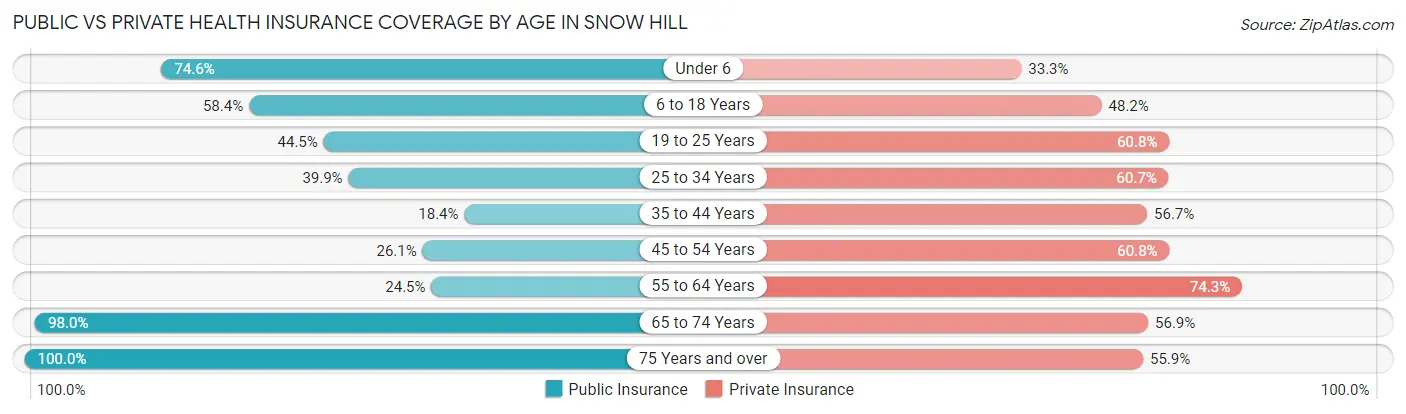
| Age Bracket | Public Insurance | Private Insurance |
| Under 6 | 47 (74.6%) | 21 (33.3%) |
| 6 to 18 Years | 346 (58.4%) | 286 (48.2%) |
| 19 to 25 Years | 93 (44.5%) | 127 (60.8%) |
| 25 to 34 Years | 73 (39.9%) | 111 (60.7%) |
| 35 to 44 Years | 84 (18.4%) | 259 (56.7%) |
| 45 to 54 Years | 52 (26.1%) | 121 (60.8%) |
| 55 to 64 Years | 61 (24.5%) | 185 (74.3%) |
| 65 to 74 Years | 200 (98.0%) | 116 (56.9%) |
| 75 Years and over | 152 (100.0%) | 85 (55.9%) |
| Total | 1,108 (48.0%) | 1,311 (56.8%) |
Disability Status by Sex by Age in Snow Hill
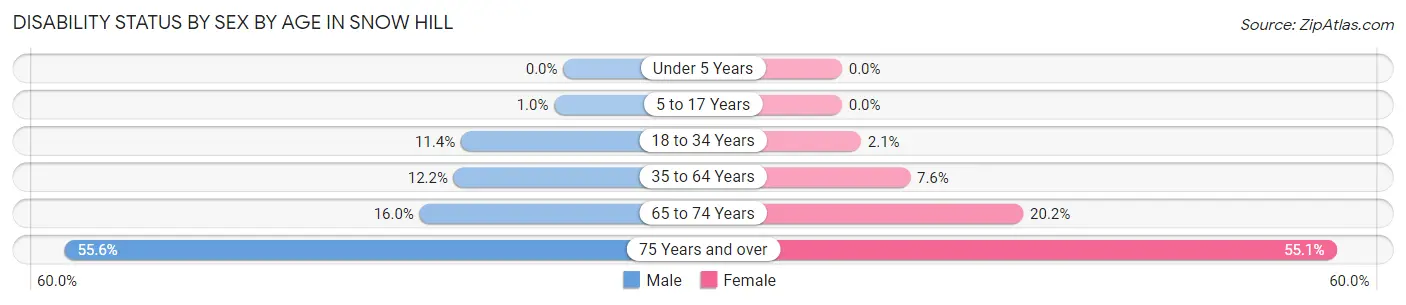
| Age Bracket | Male | Female |
| Under 5 Years | 0 (0.0%) | 0 (0.0%) |
| 5 to 17 Years | 4 (1.0%) | 0 (0.0%) |
| 18 to 34 Years | 22 (11.4%) | 5 (2.1%) |
| 35 to 64 Years | 51 (12.2%) | 37 (7.6%) |
| 65 to 74 Years | 16 (16.0%) | 21 (20.2%) |
| 75 Years and over | 35 (55.6%) | 49 (55.1%) |
Disability Class by Sex by Age in Snow Hill
Disability Class: Hearing Difficulty
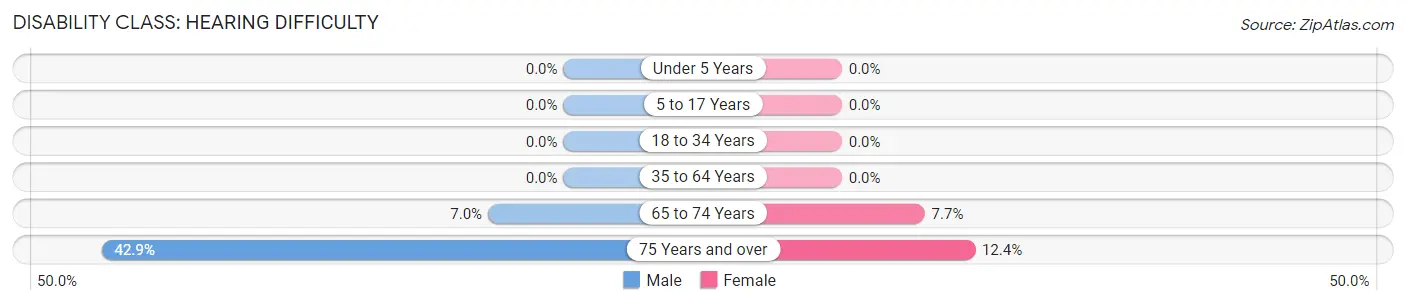
| Age Bracket | Male | Female |
| Under 5 Years | 0 (0.0%) | 0 (0.0%) |
| 5 to 17 Years | 0 (0.0%) | 0 (0.0%) |
| 18 to 34 Years | 0 (0.0%) | 0 (0.0%) |
| 35 to 64 Years | 0 (0.0%) | 0 (0.0%) |
| 65 to 74 Years | 7 (7.0%) | 8 (7.7%) |
| 75 Years and over | 27 (42.9%) | 11 (12.4%) |
Disability Class: Vision Difficulty
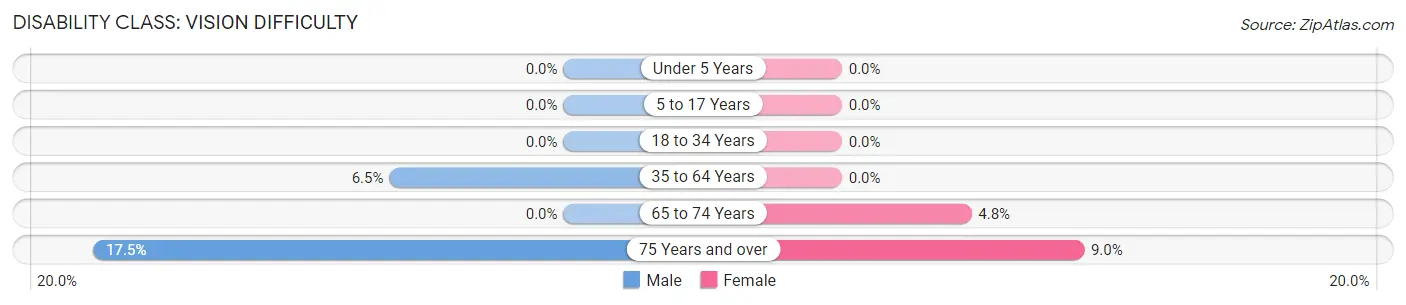
| Age Bracket | Male | Female |
| Under 5 Years | 0 (0.0%) | 0 (0.0%) |
| 5 to 17 Years | 0 (0.0%) | 0 (0.0%) |
| 18 to 34 Years | 0 (0.0%) | 0 (0.0%) |
| 35 to 64 Years | 27 (6.5%) | 0 (0.0%) |
| 65 to 74 Years | 0 (0.0%) | 5 (4.8%) |
| 75 Years and over | 11 (17.5%) | 8 (9.0%) |
Disability Class: Cognitive Difficulty
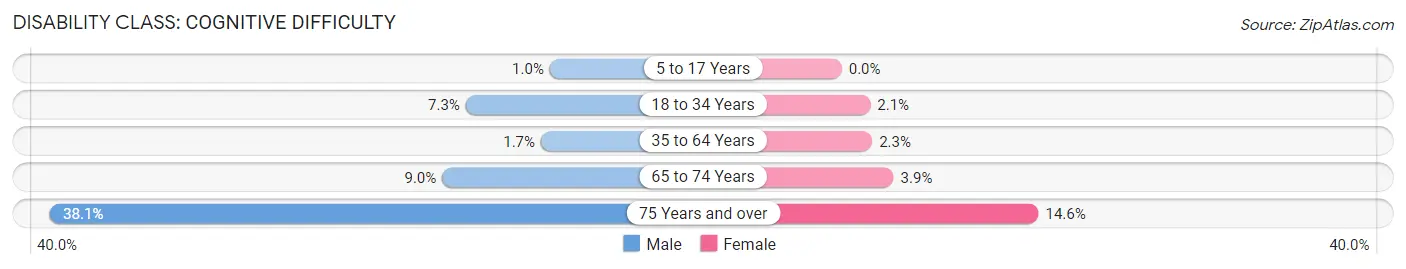
| Age Bracket | Male | Female |
| 5 to 17 Years | 4 (1.0%) | 0 (0.0%) |
| 18 to 34 Years | 14 (7.2%) | 5 (2.1%) |
| 35 to 64 Years | 7 (1.7%) | 11 (2.3%) |
| 65 to 74 Years | 9 (9.0%) | 4 (3.8%) |
| 75 Years and over | 24 (38.1%) | 13 (14.6%) |
Disability Class: Ambulatory Difficulty
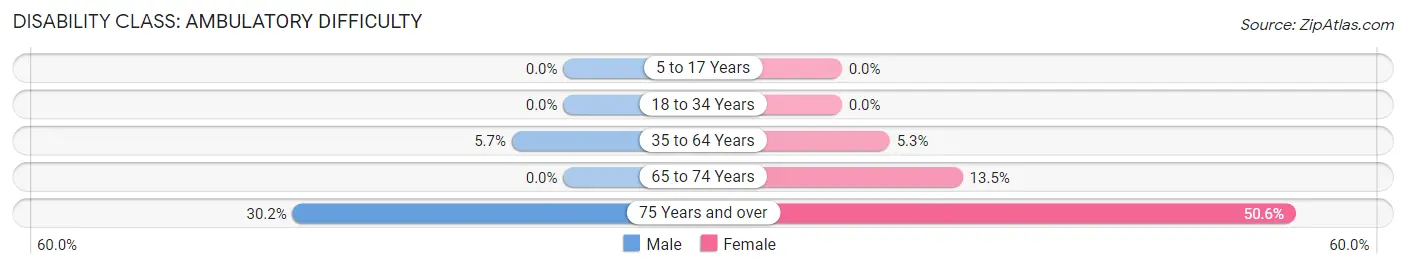
| Age Bracket | Male | Female |
| 5 to 17 Years | 0 (0.0%) | 0 (0.0%) |
| 18 to 34 Years | 0 (0.0%) | 0 (0.0%) |
| 35 to 64 Years | 24 (5.7%) | 26 (5.3%) |
| 65 to 74 Years | 0 (0.0%) | 14 (13.5%) |
| 75 Years and over | 19 (30.2%) | 45 (50.6%) |
Disability Class: Self-Care Difficulty
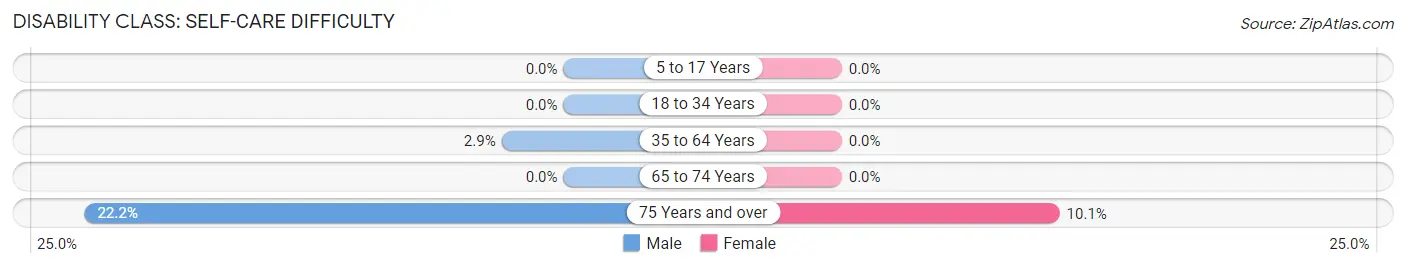
| Age Bracket | Male | Female |
| 5 to 17 Years | 0 (0.0%) | 0 (0.0%) |
| 18 to 34 Years | 0 (0.0%) | 0 (0.0%) |
| 35 to 64 Years | 12 (2.9%) | 0 (0.0%) |
| 65 to 74 Years | 0 (0.0%) | 0 (0.0%) |
| 75 Years and over | 14 (22.2%) | 9 (10.1%) |
Technology Access in Snow Hill
Computing Device Access in Snow Hill
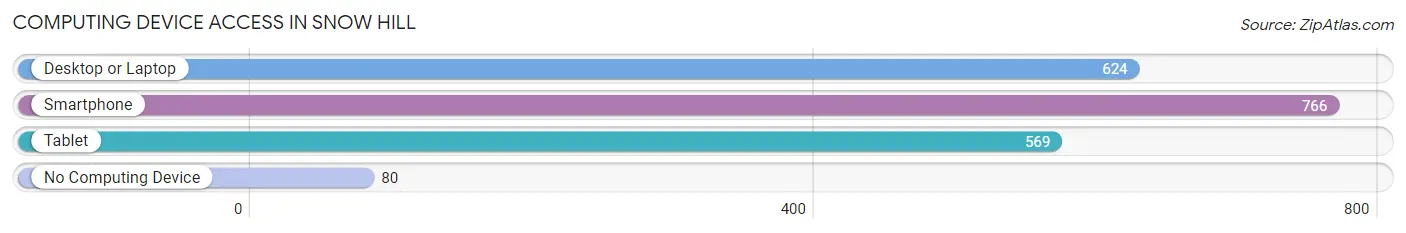
| Device Type | # Households | % Households |
| Desktop or Laptop | 624 | 69.3% |
| Smartphone | 766 | 85.1% |
| Tablet | 569 | 63.2% |
| No Computing Device | 80 | 8.9% |
| Total | 900 | 100.0% |
Internet Access in Snow Hill
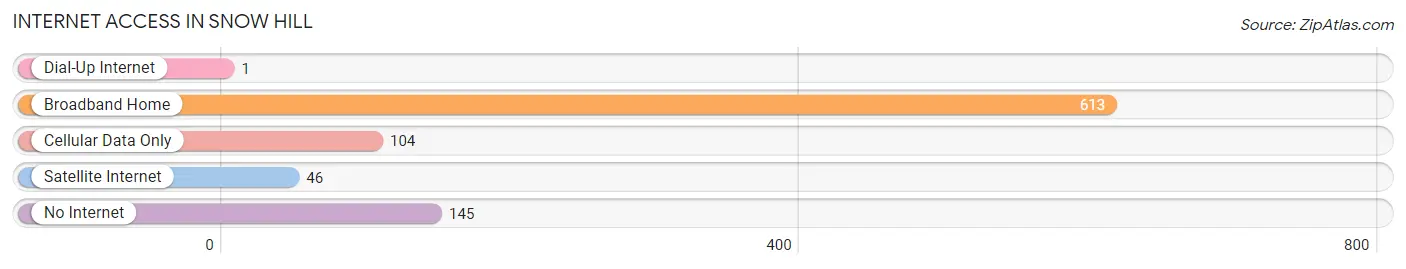
| Internet Type | # Households | % Households |
| Dial-Up Internet | 1 | 0.1% |
| Broadband Home | 613 | 68.1% |
| Cellular Data Only | 104 | 11.6% |
| Satellite Internet | 46 | 5.1% |
| No Internet | 145 | 16.1% |
| Total | 900 | 100.0% |
Snow Hill Summary
History
Snow Hill is a small town located in Worcester County, Maryland. It is situated on the banks of the Pocomoke River, which is the longest river in the state. The town was founded in 1742 and was originally known as “Snow Hill Town”. It was named after the nearby Snow Hill Plantation, which was owned by the prominent local family of the same name. The town was incorporated in 1868 and has since grown to a population of 2,521 as of the 2010 census.
The town has a rich history that dates back to the colonial era. During the American Revolution, Snow Hill was a major port for the British Navy. The town was also a major center for the slave trade in the early 19th century. In the mid-19th century, the town was a major center for the oyster industry. The town was also a major stop on the Underground Railroad, with many escaped slaves passing through the town on their way to freedom.
Geography
Snow Hill is located in Worcester County, Maryland, on the banks of the Pocomoke River. The town is situated at an elevation of 10 feet above sea level. The town is located in the Atlantic Coastal Plain region of Maryland, and is characterized by flat terrain and sandy soils. The town is located approximately 30 miles from the Atlantic Ocean.
The town is located in a humid subtropical climate zone, with hot, humid summers and mild winters. The average annual temperature is around 60 degrees Fahrenheit, with an average high of around 80 degrees in the summer and an average low of around 40 degrees in the winter. The town receives an average of 45 inches of precipitation per year, with most of it falling in the summer months.
Economy
The economy of Snow Hill is largely based on agriculture and tourism. The town is home to several farms, which produce a variety of crops, including corn, soybeans, wheat, and hay. The town is also home to several seafood processing plants, which process oysters, crabs, and other seafood for local consumption and export.
The town is also a popular tourist destination, with many visitors coming to enjoy the town’s historic sites, outdoor activities, and scenic views. The town is home to several bed and breakfasts, as well as a variety of restaurants, shops, and other attractions.
Demographics
As of the 2010 census, the population of Snow Hill was 2,521. The town is predominantly white, with a population that is 94.3% white, 2.2% African American, 0.7% Asian, and 2.8% other. The median household income in the town is $41,944, and the median age is 44.7 years. The town has a poverty rate of 11.3%, which is slightly higher than the national average.
Common Questions
What is Per Capita Income in Snow Hill?
Per Capita income in Snow Hill is $28,224.
What is the Median Family Income in Snow Hill?
Median Family Income in Snow Hill is $64,563.
What is the Median Household income in Snow Hill?
Median Household Income in Snow Hill is $51,667.
What is Income or Wage Gap in Snow Hill?
Income or Wage Gap in Snow Hill is 1.7%.
Women in Snow Hill earn 98.3 cents for every dollar earned by a man.
What is Inequality or Gini Index in Snow Hill?
Inequality or Gini Index in Snow Hill is 0.47.
What is the Total Population of Snow Hill?
Total Population of Snow Hill is 2,359.
What is the Total Male Population of Snow Hill?
Total Male Population of Snow Hill is 1,215.
What is the Total Female Population of Snow Hill?
Total Female Population of Snow Hill is 1,144.
What is the Ratio of Males per 100 Females in Snow Hill?
There are 106.21 Males per 100 Females in Snow Hill.
What is the Ratio of Females per 100 Males in Snow Hill?
There are 94.16 Females per 100 Males in Snow Hill.
What is the Median Population Age in Snow Hill?
Median Population Age in Snow Hill is 39.2 Years.
What is the Average Family Size in Snow Hill
Average Family Size in Snow Hill is 3.4 People.
What is the Average Household Size in Snow Hill
Average Household Size in Snow Hill is 2.5 People.
How Large is the Labor Force in Snow Hill?
There are 1,257 People in the Labor Forcein in Snow Hill.
What is the Percentage of People in the Labor Force in Snow Hill?
67.7% of People are in the Labor Force in Snow Hill.
What is the Unemployment Rate in Snow Hill?
Unemployment Rate in Snow Hill is 10.4%.