Charlestown, MD Map & Demographics
Charlestown Map
Charlestown Overview
$37,733
PER CAPITA INCOME
$130,294
AVG FAMILY INCOME
$103,098
AVG HOUSEHOLD INCOME
20.3%
WAGE / INCOME GAP [ % ]
79.7¢/ $1
WAGE / INCOME GAP [ $ ]
0.33
INEQUALITY / GINI INDEX
2,050
TOTAL POPULATION
1,003
MALE POPULATION
1,047
FEMALE POPULATION
95.80
MALES / 100 FEMALES
104.39
FEMALES / 100 MALES
35.3
MEDIAN AGE
3.2
AVG FAMILY SIZE
2.8
AVG HOUSEHOLD SIZE
900
LABOR FORCE [ PEOPLE ]
62.6%
PERCENT IN LABOR FORCE
3.2%
UNEMPLOYMENT RATE
Charlestown Zip Codes
Charlestown Area Codes
Income in Charlestown
Income Overview in Charlestown
Per Capita Income in Charlestown is $37,733, while median incomes of families and households are $130,294 and $103,098 respectively.
| Characteristic | Number | Measure |
| Per Capita Income | 2,050 | $37,733 |
| Median Family Income | 546 | $130,294 |
| Mean Family Income | 546 | $120,860 |
| Median Household Income | 737 | $103,098 |
| Mean Household Income | 737 | $105,834 |
| Income Deficit | 546 | $0 |
| Wage / Income Gap (%) | 2,050 | 20.34% |
| Wage / Income Gap ($) | 2,050 | 79.66¢ per $1 |
| Gini / Inequality Index | 2,050 | 0.33 |
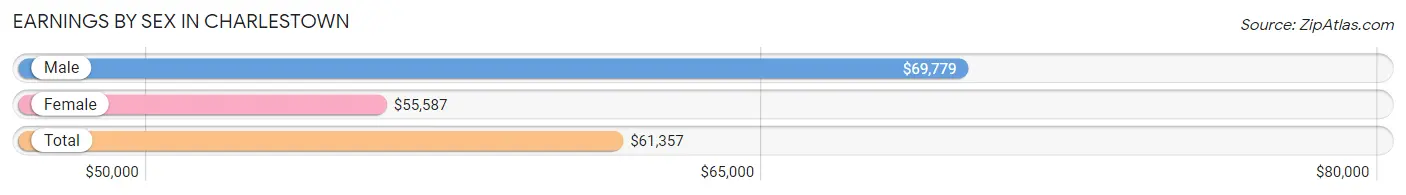
Earnings by Sex in Charlestown
Average Earnings in Charlestown are $61,357, $69,779 for men and $55,587 for women, a difference of 20.3%.
| Sex | Number | Average Earnings |
| Male | 497 (55.6%) | $69,779 |
| Female | 397 (44.4%) | $55,587 |
| Total | 894 (100.0%) | $61,357 |
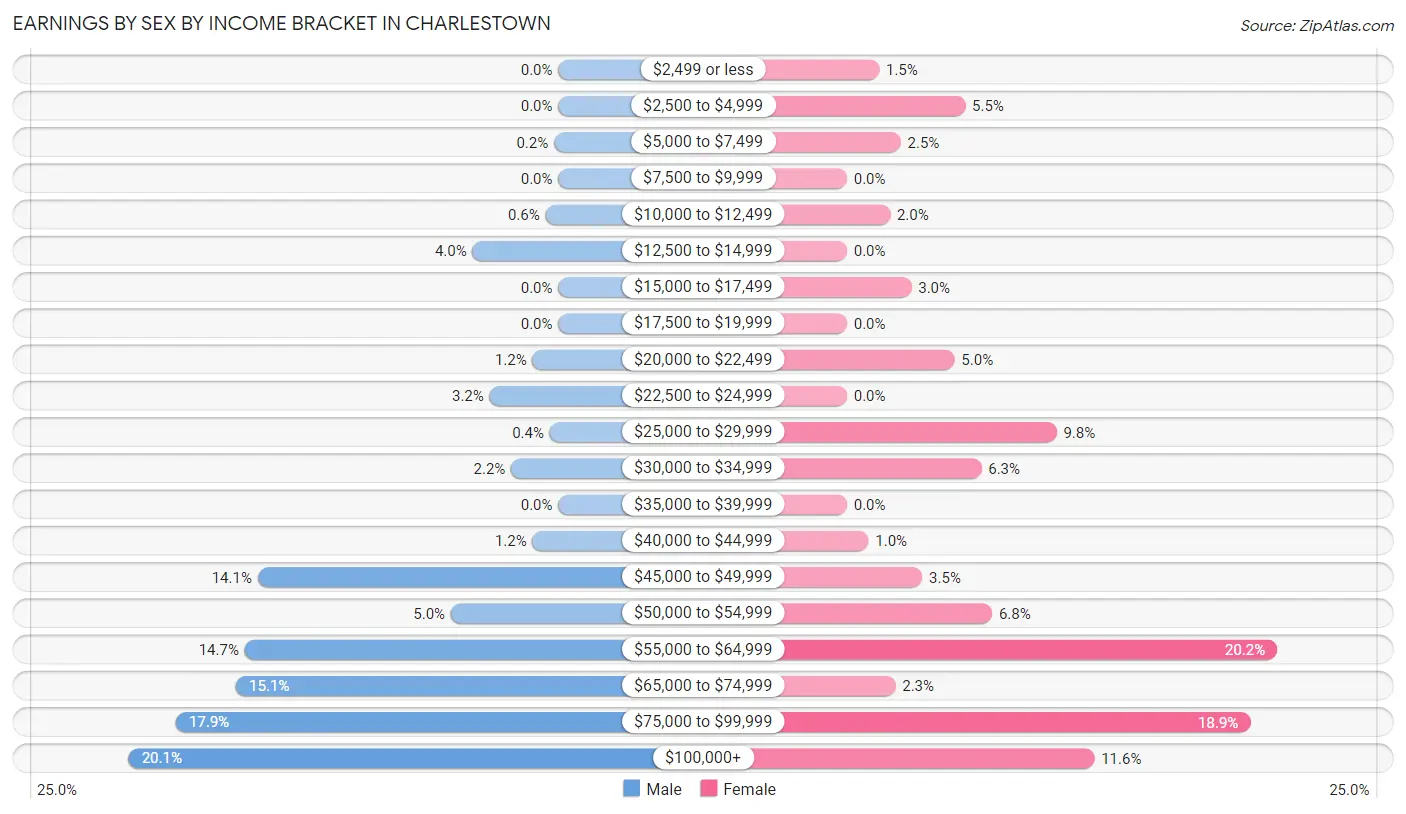
Earnings by Sex by Income Bracket in Charlestown
The most common earnings brackets in Charlestown are $100,000+ for men (100 | 20.1%) and $55,000 to $64,999 for women (80 | 20.2%).
| Income | Male | Female |
| $2,499 or less | 0 (0.0%) | 6 (1.5%) |
| $2,500 to $4,999 | 0 (0.0%) | 22 (5.5%) |
| $5,000 to $7,499 | 1 (0.2%) | 10 (2.5%) |
| $7,500 to $9,999 | 0 (0.0%) | 0 (0.0%) |
| $10,000 to $12,499 | 3 (0.6%) | 8 (2.0%) |
| $12,500 to $14,999 | 20 (4.0%) | 0 (0.0%) |
| $15,000 to $17,499 | 0 (0.0%) | 12 (3.0%) |
| $17,500 to $19,999 | 0 (0.0%) | 0 (0.0%) |
| $20,000 to $22,499 | 6 (1.2%) | 20 (5.0%) |
| $22,500 to $24,999 | 16 (3.2%) | 0 (0.0%) |
| $25,000 to $29,999 | 2 (0.4%) | 39 (9.8%) |
| $30,000 to $34,999 | 11 (2.2%) | 25 (6.3%) |
| $35,000 to $39,999 | 0 (0.0%) | 0 (0.0%) |
| $40,000 to $44,999 | 6 (1.2%) | 4 (1.0%) |
| $45,000 to $49,999 | 70 (14.1%) | 14 (3.5%) |
| $50,000 to $54,999 | 25 (5.0%) | 27 (6.8%) |
| $55,000 to $64,999 | 73 (14.7%) | 80 (20.2%) |
| $65,000 to $74,999 | 75 (15.1%) | 9 (2.3%) |
| $75,000 to $99,999 | 89 (17.9%) | 75 (18.9%) |
| $100,000+ | 100 (20.1%) | 46 (11.6%) |
| Total | 497 (100.0%) | 397 (100.0%) |
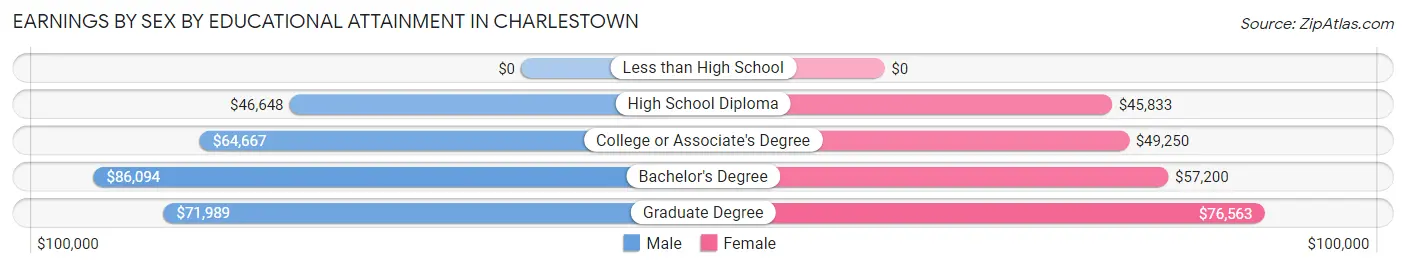
Earnings by Sex by Educational Attainment in Charlestown
Average earnings in Charlestown are $69,853 for men and $55,893 for women, a difference of 20.0%. Men with an educational attainment of bachelor's degree enjoy the highest average annual earnings of $86,094, while those with high school diploma education earn the least with $46,648. Women with an educational attainment of graduate degree earn the most with the average annual earnings of $76,563, while those with high school diploma education have the smallest earnings of $45,833.
| Educational Attainment | Male Income | Female Income |
| Less than High School | - | - |
| High School Diploma | $46,648 | $45,833 |
| College or Associate's Degree | $64,667 | $49,250 |
| Bachelor's Degree | $86,094 | $57,200 |
| Graduate Degree | $71,989 | $76,563 |
| Total | $69,853 | $55,893 |
Family Income in Charlestown
Family Income Brackets in Charlestown
According to the Charlestown family income data, there are 171 families falling into the $100,000 to $149,999 income range, which is the most common income bracket and makes up 31.3% of all families.
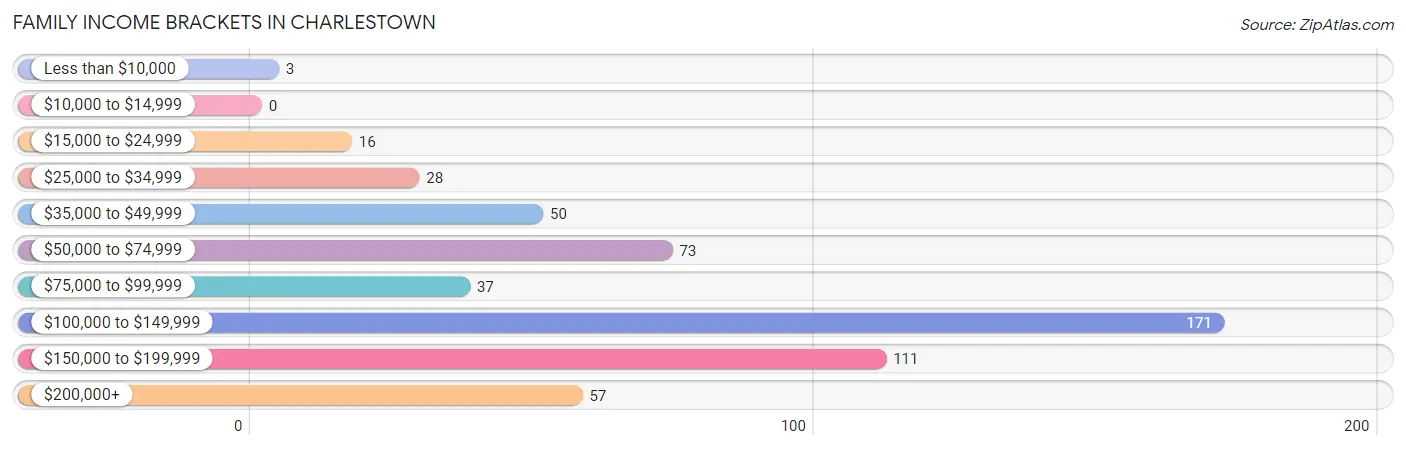
| Income Bracket | # Families | % Families |
| Less than $10,000 | 3 | 0.5% |
| $10,000 to $14,999 | 0 | 0.0% |
| $15,000 to $24,999 | 16 | 2.9% |
| $25,000 to $34,999 | 28 | 5.1% |
| $35,000 to $49,999 | 50 | 9.2% |
| $50,000 to $74,999 | 73 | 13.4% |
| $75,000 to $99,999 | 37 | 6.8% |
| $100,000 to $149,999 | 171 | 31.3% |
| $150,000 to $199,999 | 111 | 20.3% |
| $200,000+ | 57 | 10.4% |
Family Income by Famaliy Size in Charlestown
4-person families (169 | 30.9%) account for the highest median family income in Charlestown with $147,798 per family, while 2-person families (197 | 36.1%) have the highest median income of $40,729 per family member.
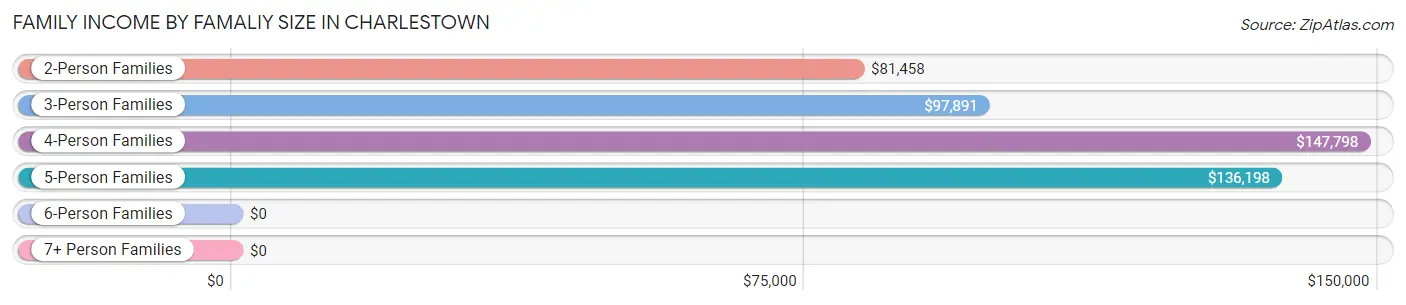
| Income Bracket | # Families | Median Income |
| 2-Person Families | 197 (36.1%) | $81,458 |
| 3-Person Families | 121 (22.2%) | $97,891 |
| 4-Person Families | 169 (30.9%) | $147,798 |
| 5-Person Families | 35 (6.4%) | $136,198 |
| 6-Person Families | 13 (2.4%) | $0 |
| 7+ Person Families | 11 (2.0%) | $0 |
| Total | 546 (100.0%) | $130,294 |
Family Income by Number of Earners in Charlestown
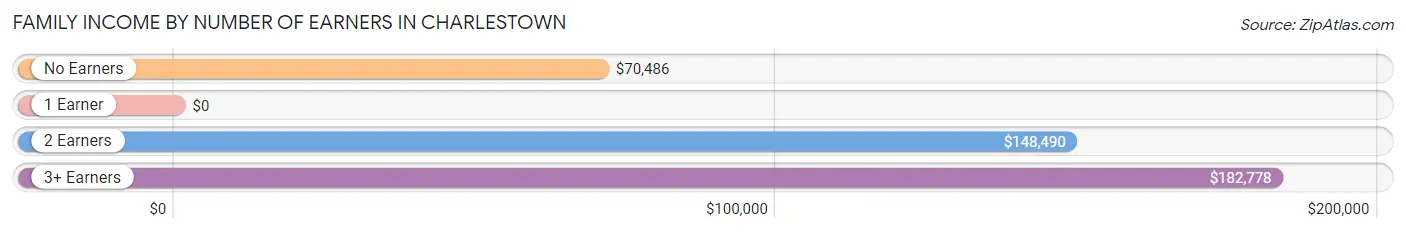
| Number of Earners | # Families | Median Income |
| No Earners | 133 (24.4%) | $70,486 |
| 1 Earner | 132 (24.2%) | $0 |
| 2 Earners | 245 (44.9%) | $148,490 |
| 3+ Earners | 36 (6.6%) | $182,778 |
| Total | 546 (100.0%) | $130,294 |
Household Income in Charlestown
Household Income Brackets in Charlestown
With 206 households falling in the category, the $100,000 to $149,999 income range is the most frequent in Charlestown, accounting for 28.0% of all households. In contrast, only 8 households (1.1%) fall into the less than $10,000 income bracket, making it the least populous group.
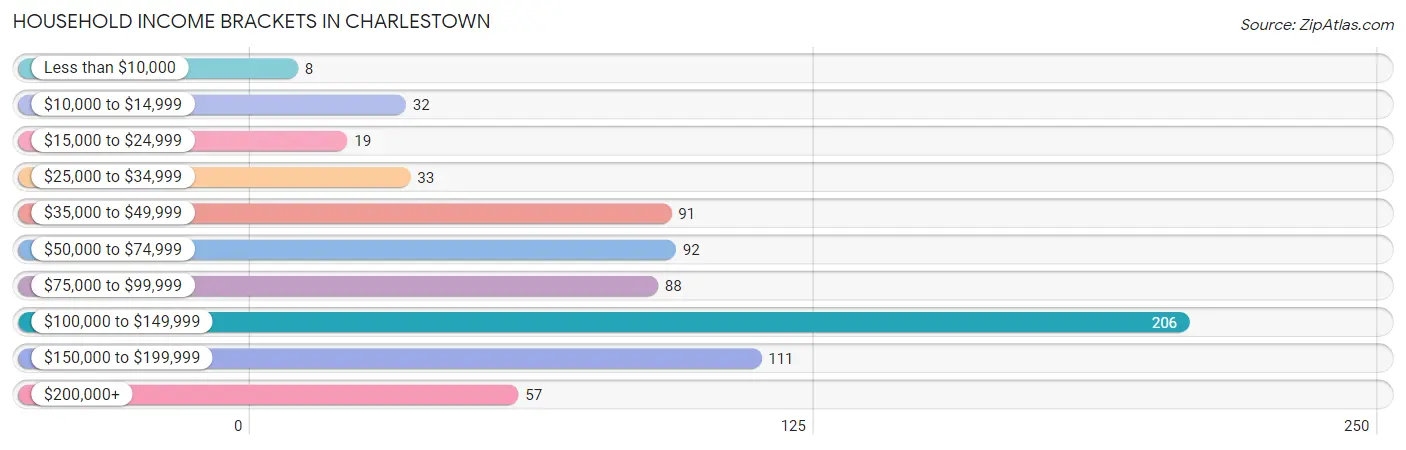
| Income Bracket | # Households | % Households |
| Less than $10,000 | 8 | 1.1% |
| $10,000 to $14,999 | 32 | 4.3% |
| $15,000 to $24,999 | 19 | 2.6% |
| $25,000 to $34,999 | 33 | 4.5% |
| $35,000 to $49,999 | 91 | 12.3% |
| $50,000 to $74,999 | 92 | 12.5% |
| $75,000 to $99,999 | 88 | 11.9% |
| $100,000 to $149,999 | 206 | 28.0% |
| $150,000 to $199,999 | 111 | 15.1% |
| $200,000+ | 57 | 7.7% |
Household Income by Householder Age in Charlestown
The median household income in Charlestown is $103,098, with the highest median household income of $133,056 found in the 25 to 44 years age bracket for the primary householder. A total of 320 households (43.4%) fall into this category.
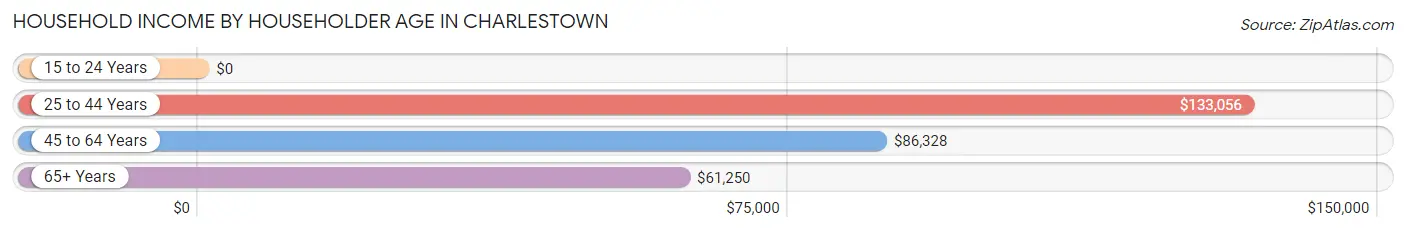
| Income Bracket | # Households | Median Income |
| 15 to 24 Years | 0 (0.0%) | $0 |
| 25 to 44 Years | 320 (43.4%) | $133,056 |
| 45 to 64 Years | 239 (32.4%) | $86,328 |
| 65+ Years | 178 (24.1%) | $61,250 |
| Total | 737 (100.0%) | $103,098 |
Poverty in Charlestown
Income Below Poverty by Sex and Age in Charlestown
With 1.3% poverty level for males and 9.4% for females among the residents of Charlestown, 75 year old and over males and 18 to 24 year old females are the most vulnerable to poverty, with 5 males (5.4%) and 10 females (83.3%) in their respective age groups living below the poverty level.
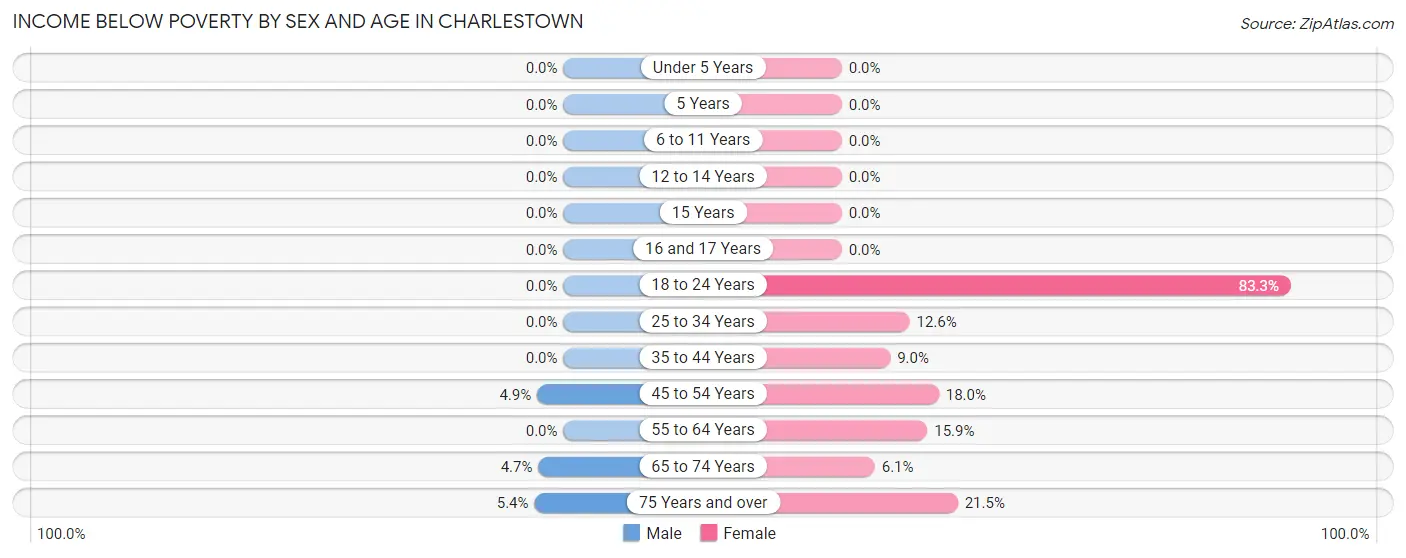
| Age Bracket | Male | Female |
| Under 5 Years | 0 (0.0%) | 0 (0.0%) |
| 5 Years | 0 (0.0%) | 0 (0.0%) |
| 6 to 11 Years | 0 (0.0%) | 0 (0.0%) |
| 12 to 14 Years | 0 (0.0%) | 0 (0.0%) |
| 15 Years | 0 (0.0%) | 0 (0.0%) |
| 16 and 17 Years | 0 (0.0%) | 0 (0.0%) |
| 18 to 24 Years | 0 (0.0%) | 10 (83.3%) |
| 25 to 34 Years | 0 (0.0%) | 20 (12.6%) |
| 35 to 44 Years | 0 (0.0%) | 17 (9.0%) |
| 45 to 54 Years | 6 (4.9%) | 18 (18.0%) |
| 55 to 64 Years | 0 (0.0%) | 10 (15.9%) |
| 65 to 74 Years | 2 (4.6%) | 6 (6.1%) |
| 75 Years and over | 5 (5.4%) | 17 (21.5%) |
| Total | 13 (1.3%) | 98 (9.4%) |
Income Above Poverty by Sex and Age in Charlestown
According to the poverty statistics in Charlestown, males aged under 5 years and females aged under 5 years are the age groups that are most secure financially, with 100.0% of males and 100.0% of females in these age groups living above the poverty line.
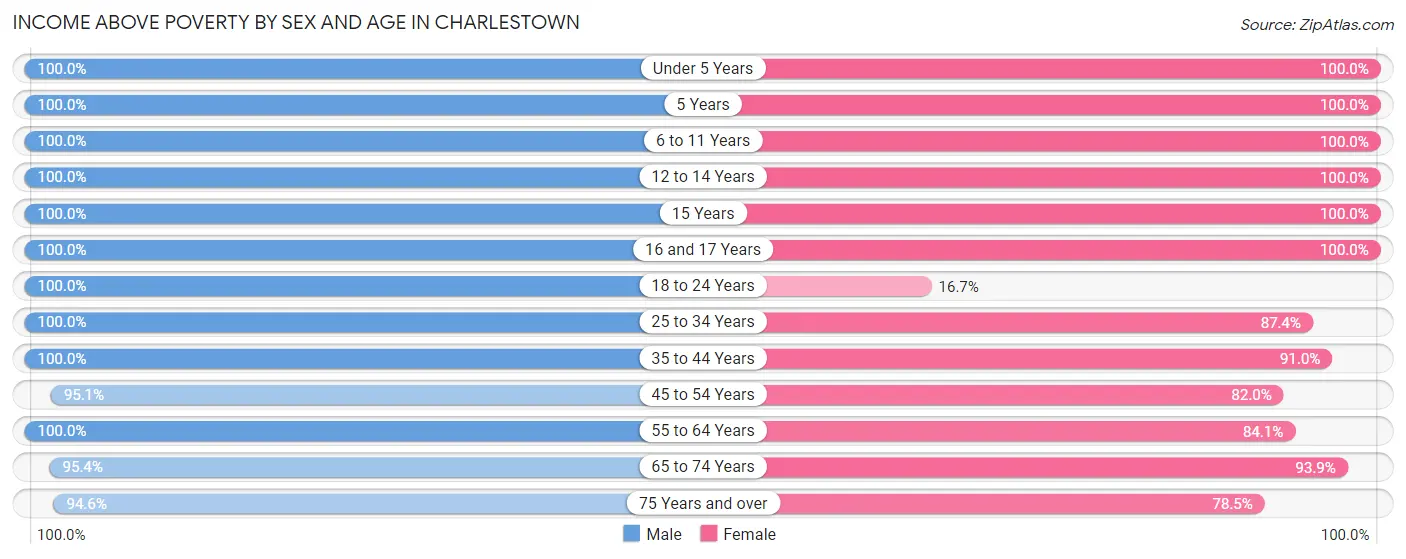
| Age Bracket | Male | Female |
| Under 5 Years | 88 (100.0%) | 84 (100.0%) |
| 5 Years | 14 (100.0%) | 59 (100.0%) |
| 6 to 11 Years | 140 (100.0%) | 125 (100.0%) |
| 12 to 14 Years | 15 (100.0%) | 54 (100.0%) |
| 15 Years | 27 (100.0%) | 7 (100.0%) |
| 16 and 17 Years | 63 (100.0%) | 18 (100.0%) |
| 18 to 24 Years | 1 (100.0%) | 2 (16.7%) |
| 25 to 34 Years | 132 (100.0%) | 139 (87.4%) |
| 35 to 44 Years | 165 (100.0%) | 172 (91.0%) |
| 45 to 54 Years | 117 (95.1%) | 82 (82.0%) |
| 55 to 64 Years | 99 (100.0%) | 53 (84.1%) |
| 65 to 74 Years | 41 (95.4%) | 92 (93.9%) |
| 75 Years and over | 88 (94.6%) | 62 (78.5%) |
| Total | 990 (98.7%) | 949 (90.6%) |
Income Below Poverty Among Married-Couple Families in Charlestown
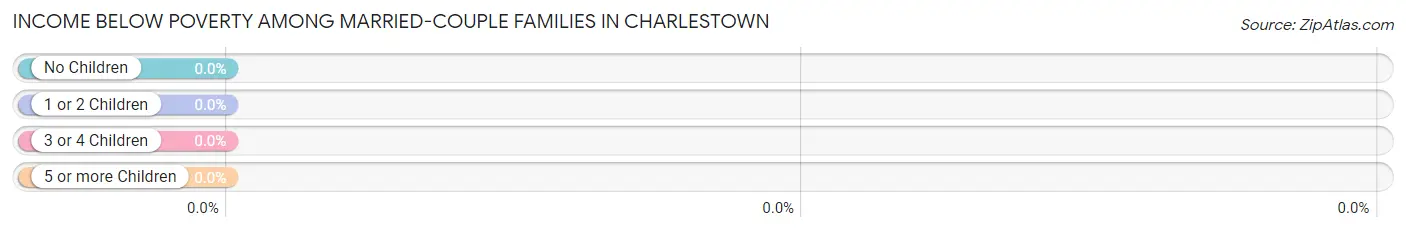
| Children | Above Poverty | Below Poverty |
| No Children | 173 (100.0%) | 0 (0.0%) |
| 1 or 2 Children | 229 (100.0%) | 0 (0.0%) |
| 3 or 4 Children | 46 (100.0%) | 0 (0.0%) |
| 5 or more Children | 0 (0.0%) | 0 (0.0%) |
| Total | 448 (100.0%) | 0 (0.0%) |
Income Below Poverty Among Single-Parent Households in Charlestown
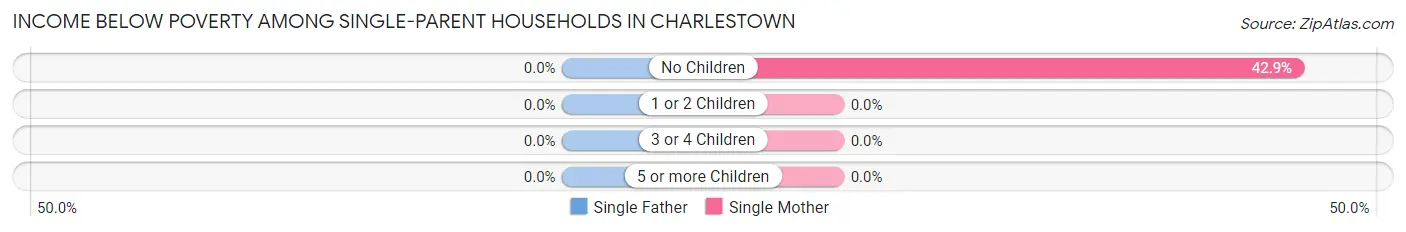
| Children | Single Father | Single Mother |
| No Children | 0 (0.0%) | 3 (42.9%) |
| 1 or 2 Children | 0 (0.0%) | 0 (0.0%) |
| 3 or 4 Children | 0 (0.0%) | 0 (0.0%) |
| 5 or more Children | 0 (0.0%) | 0 (0.0%) |
| Total | 0 (0.0%) | 3 (7.7%) |
Income Below Poverty Among Married-Couple vs Single-Parent Households in Charlestown
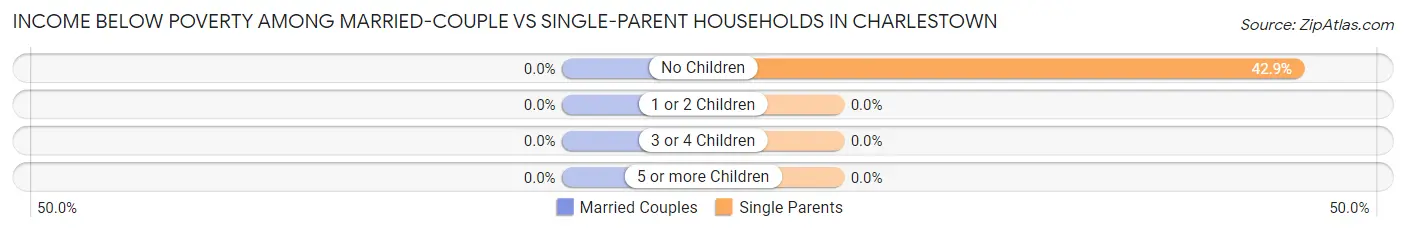
| Children | Married-Couple Families | Single-Parent Households |
| No Children | 0 (0.0%) | 3 (42.9%) |
| 1 or 2 Children | 0 (0.0%) | 0 (0.0%) |
| 3 or 4 Children | 0 (0.0%) | 0 (0.0%) |
| 5 or more Children | 0 (0.0%) | 0 (0.0%) |
| Total | 0 (0.0%) | 3 (3.1%) |
Race in Charlestown
The most populous races in Charlestown are White / Caucasian (1,886 | 92.0%), Black / African American (90 | 4.4%), and Hispanic or Latino (84 | 4.1%).
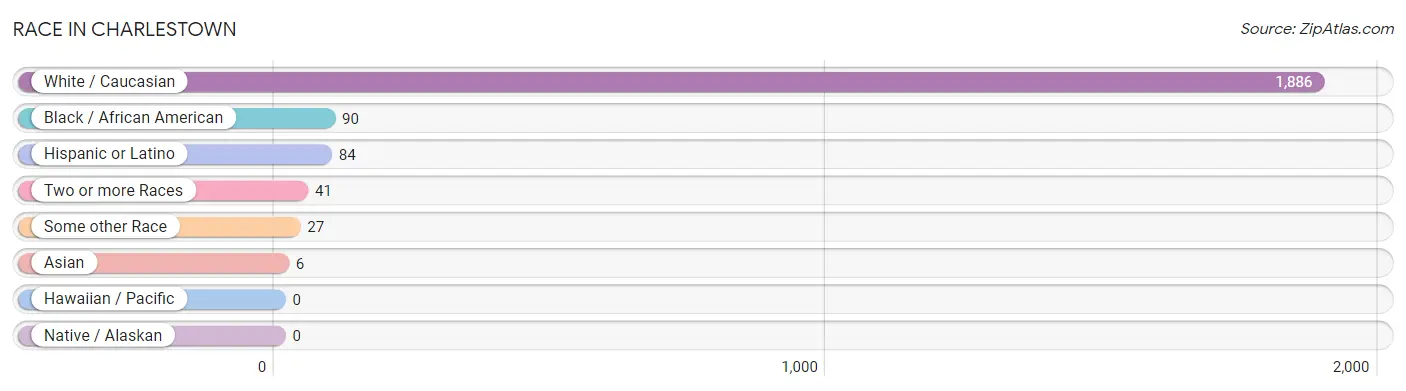
| Race | # Population | % Population |
| Asian | 6 | 0.3% |
| Black / African American | 90 | 4.4% |
| Hawaiian / Pacific | 0 | 0.0% |
| Hispanic or Latino | 84 | 4.1% |
| Native / Alaskan | 0 | 0.0% |
| White / Caucasian | 1,886 | 92.0% |
| Two or more Races | 41 | 2.0% |
| Some other Race | 27 | 1.3% |
| Total | 2,050 | 100.0% |
Ancestry in Charlestown
The most populous ancestries reported in Charlestown are German (547 | 26.7%), Irish (540 | 26.3%), English (327 | 16.0%), Italian (182 | 8.9%), and American (159 | 7.8%), together accounting for 85.6% of all Charlestown residents.
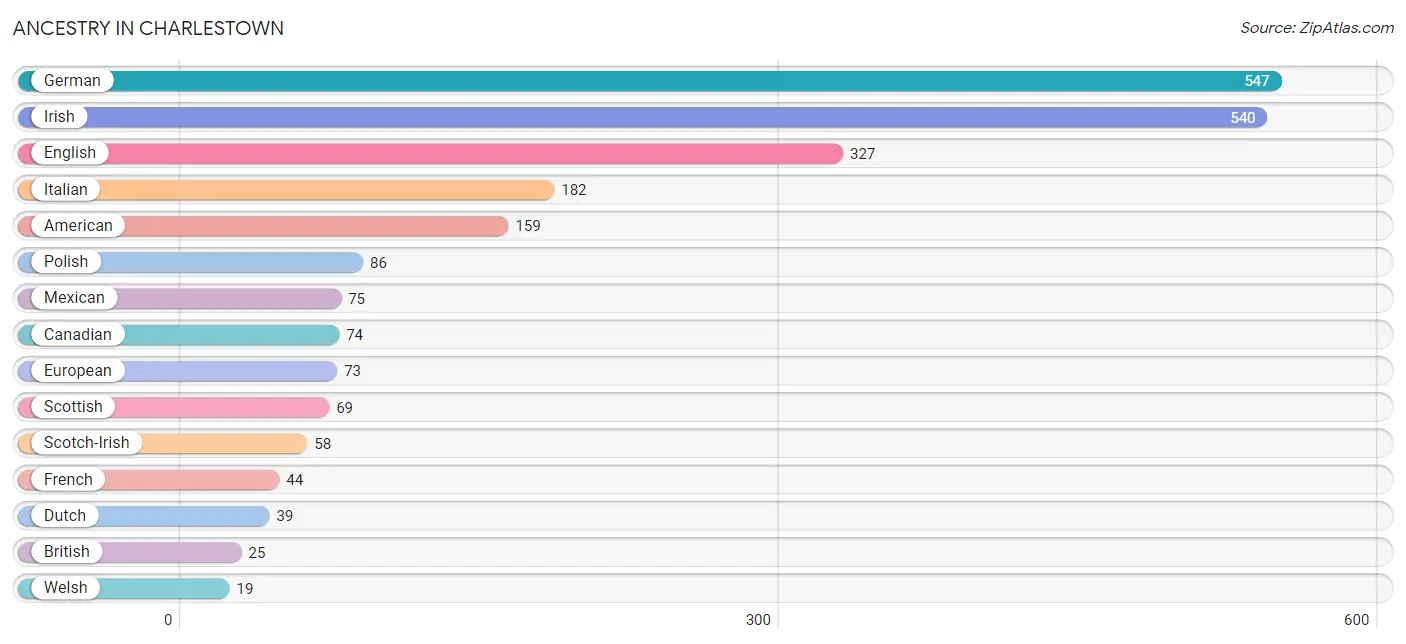
| Ancestry | # Population | % Population |
| American | 159 | 7.8% |
| Belgian | 4 | 0.2% |
| British | 25 | 1.2% |
| Burmese | 2 | 0.1% |
| Canadian | 74 | 3.6% |
| Cherokee | 2 | 0.1% |
| Czech | 16 | 0.8% |
| Dutch | 39 | 1.9% |
| English | 327 | 16.0% |
| European | 73 | 3.6% |
| Finnish | 6 | 0.3% |
| French | 44 | 2.1% |
| German | 547 | 26.7% |
| Greek | 5 | 0.2% |
| Irish | 540 | 26.3% |
| Italian | 182 | 8.9% |
| Korean | 10 | 0.5% |
| Lithuanian | 5 | 0.2% |
| Mexican | 75 | 3.7% |
| Norwegian | 4 | 0.2% |
| Pennsylvania German | 11 | 0.5% |
| Polish | 86 | 4.2% |
| Puerto Rican | 7 | 0.3% |
| Romanian | 1 | 0.1% |
| Russian | 13 | 0.6% |
| Scotch-Irish | 58 | 2.8% |
| Scottish | 69 | 3.4% |
| South American | 2 | 0.1% |
| Swedish | 2 | 0.1% |
| Venezuelan | 2 | 0.1% |
| Welsh | 19 | 0.9% | View All 31 Rows |
Immigrants in Charlestown
The most numerous immigrant groups reported in Charlestown came from Asia (2 | 0.1%), Eastern Asia (2 | 0.1%), and Korea (2 | 0.1%), together accounting for 0.3% of all Charlestown residents.
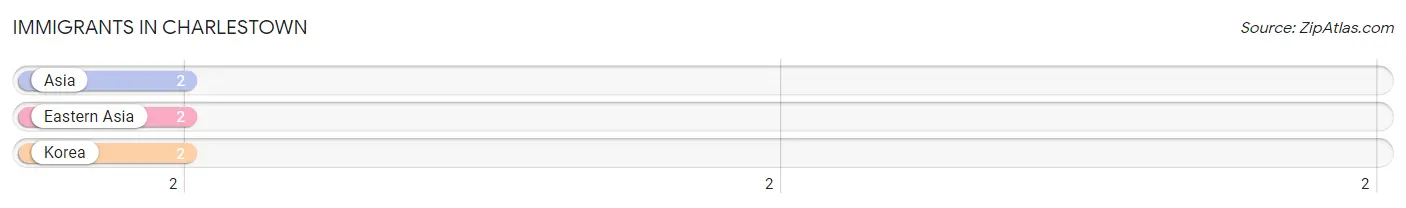
| Immigration Origin | # Population | % Population |
| Asia | 2 | 0.1% |
| Eastern Asia | 2 | 0.1% |
| Korea | 2 | 0.1% | View All 3 Rows |
Sex and Age in Charlestown
Sex and Age in Charlestown
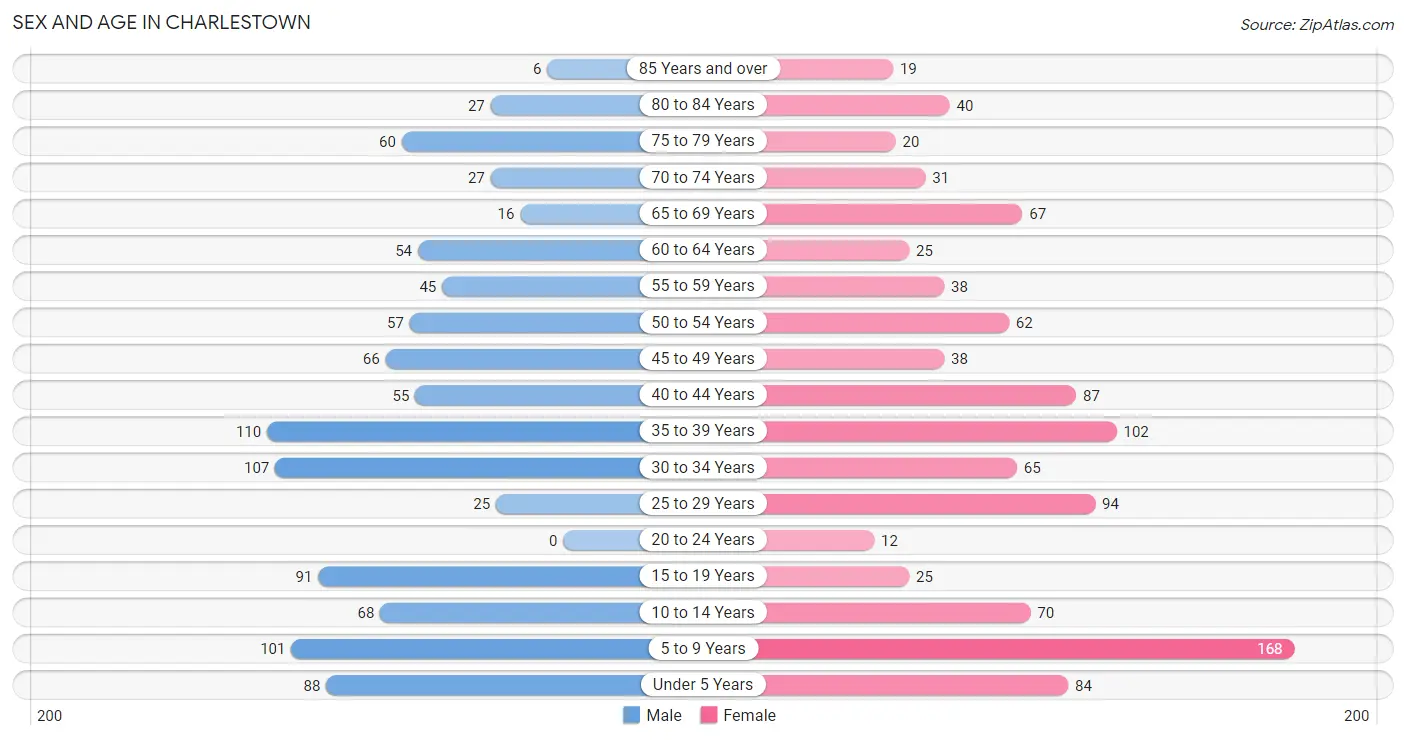
The most populous age groups in Charlestown are 35 to 39 Years (110 | 11.0%) for men and 5 to 9 Years (168 | 16.1%) for women.
| Age Bracket | Male | Female |
| Under 5 Years | 88 (8.8%) | 84 (8.0%) |
| 5 to 9 Years | 101 (10.1%) | 168 (16.1%) |
| 10 to 14 Years | 68 (6.8%) | 70 (6.7%) |
| 15 to 19 Years | 91 (9.1%) | 25 (2.4%) |
| 20 to 24 Years | 0 (0.0%) | 12 (1.1%) |
| 25 to 29 Years | 25 (2.5%) | 94 (9.0%) |
| 30 to 34 Years | 107 (10.7%) | 65 (6.2%) |
| 35 to 39 Years | 110 (11.0%) | 102 (9.7%) |
| 40 to 44 Years | 55 (5.5%) | 87 (8.3%) |
| 45 to 49 Years | 66 (6.6%) | 38 (3.6%) |
| 50 to 54 Years | 57 (5.7%) | 62 (5.9%) |
| 55 to 59 Years | 45 (4.5%) | 38 (3.6%) |
| 60 to 64 Years | 54 (5.4%) | 25 (2.4%) |
| 65 to 69 Years | 16 (1.6%) | 67 (6.4%) |
| 70 to 74 Years | 27 (2.7%) | 31 (3.0%) |
| 75 to 79 Years | 60 (6.0%) | 20 (1.9%) |
| 80 to 84 Years | 27 (2.7%) | 40 (3.8%) |
| 85 Years and over | 6 (0.6%) | 19 (1.8%) |
| Total | 1,003 (100.0%) | 1,047 (100.0%) |
Families and Households in Charlestown
Median Family Size in Charlestown
The median family size in Charlestown is 3.25 persons per family, with married-couple families (448 | 82.1%) accounting for the largest median family size of 3.35 persons per family. On the other hand, single male/father families (59 | 10.8%) represent the smallest median family size with 2.66 persons per family.
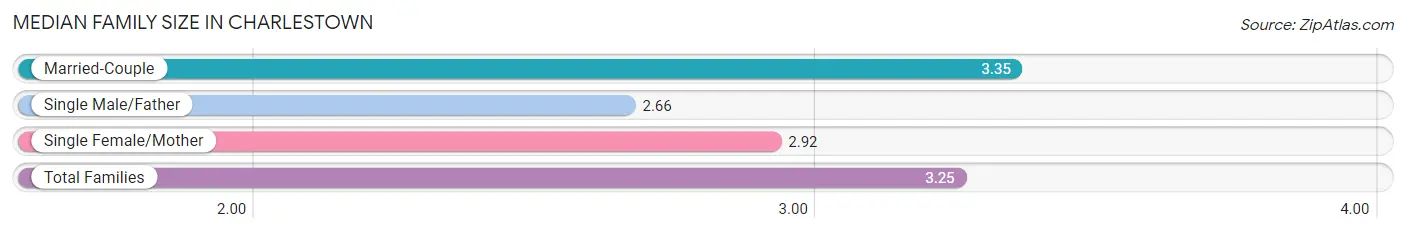
| Family Type | # Families | Family Size |
| Married-Couple | 448 (82.1%) | 3.35 |
| Single Male/Father | 59 (10.8%) | 2.66 |
| Single Female/Mother | 39 (7.1%) | 2.92 |
| Total Families | 546 (100.0%) | 3.25 |
Median Household Size in Charlestown
The median household size in Charlestown is 2.77 persons per household, with single female/mother households (39 | 5.3%) accounting for the largest median household size of 3.49 persons per household. non-family households (191 | 25.9%) represent the smallest median household size with 1.10 persons per household.
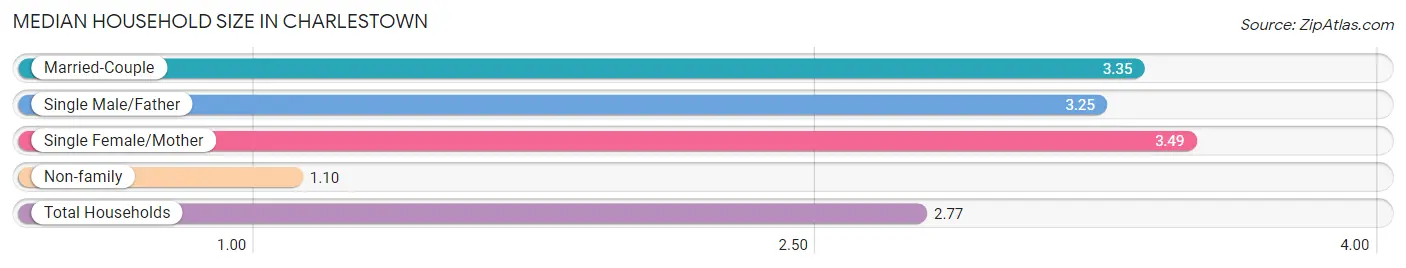
| Household Type | # Households | Household Size |
| Married-Couple | 448 (60.8%) | 3.35 |
| Single Male/Father | 59 (8.0%) | 3.25 |
| Single Female/Mother | 39 (5.3%) | 3.49 |
| Non-family | 191 (25.9%) | 1.10 |
| Total Households | 737 (100.0%) | 2.77 |
Household Size by Marriage Status in Charlestown
Out of a total of 737 households in Charlestown, 546 (74.1%) are family households, while 191 (25.9%) are nonfamily households. The most numerous type of family households are 4-person households, comprising 205, and the most common type of nonfamily households are 1-person households, comprising 162.
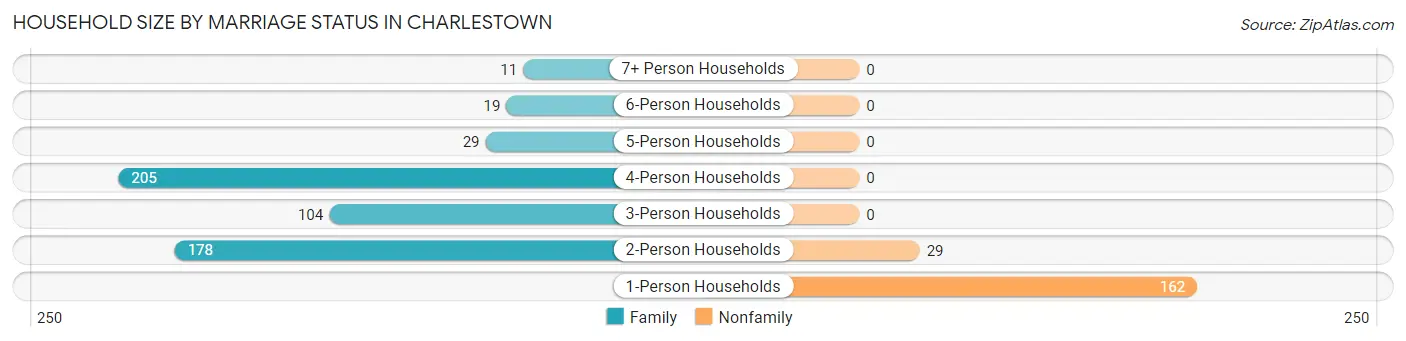
| Household Size | Family Households | Nonfamily Households |
| 1-Person Households | - | 162 (22.0%) |
| 2-Person Households | 178 (24.1%) | 29 (3.9%) |
| 3-Person Households | 104 (14.1%) | 0 (0.0%) |
| 4-Person Households | 205 (27.8%) | 0 (0.0%) |
| 5-Person Households | 29 (3.9%) | 0 (0.0%) |
| 6-Person Households | 19 (2.6%) | 0 (0.0%) |
| 7+ Person Households | 11 (1.5%) | 0 (0.0%) |
| Total | 546 (74.1%) | 191 (25.9%) |
Female Fertility in Charlestown
Fertility by Age in Charlestown
Average fertility rate in Charlestown is 65.0 births per 1,000 women. Women in the age bracket of 20 to 34 years have the highest fertility rate with 99.0 births per 1,000 women. Women in the age bracket of 20 to 34 years acount for 58.6% of all women with births.
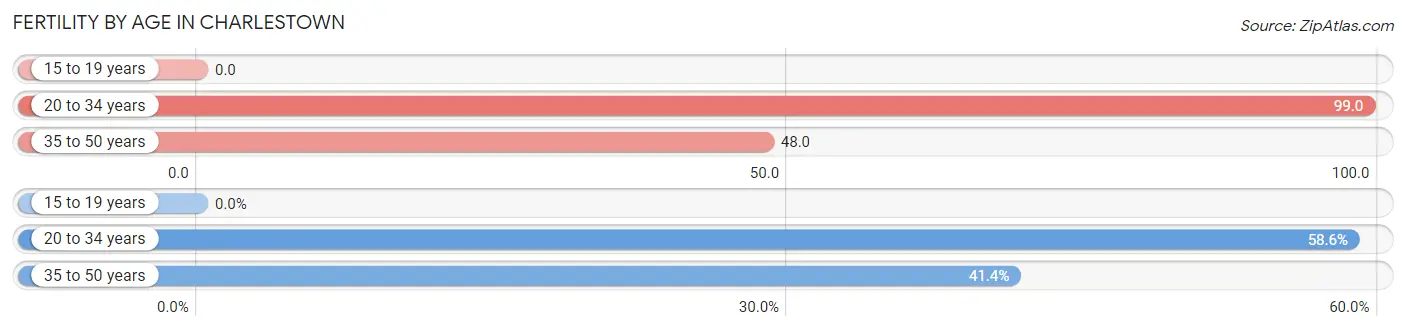
| Age Bracket | Women with Births | Births / 1,000 Women |
| 15 to 19 years | 0 (0.0%) | 0.0 |
| 20 to 34 years | 17 (58.6%) | 99.0 |
| 35 to 50 years | 12 (41.4%) | 48.0 |
| Total | 29 (100.0%) | 65.0 |
Fertility by Age by Marriage Status in Charlestown
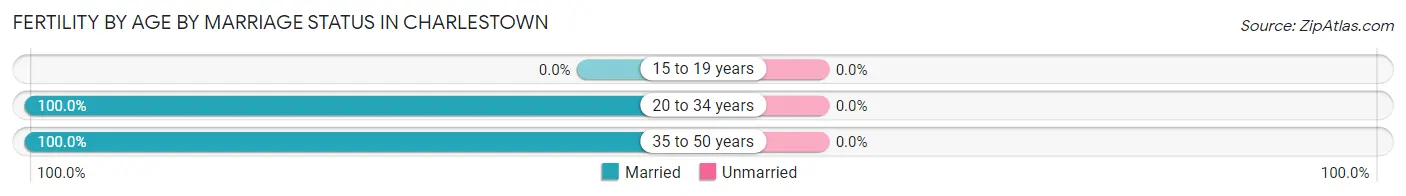
| Age Bracket | Married | Unmarried |
| 15 to 19 years | 0 (0.0%) | 0 (0.0%) |
| 20 to 34 years | 17 (100.0%) | 0 (0.0%) |
| 35 to 50 years | 12 (100.0%) | 0 (0.0%) |
| Total | 29 (100.0%) | 0 (0.0%) |
Fertility by Education in Charlestown
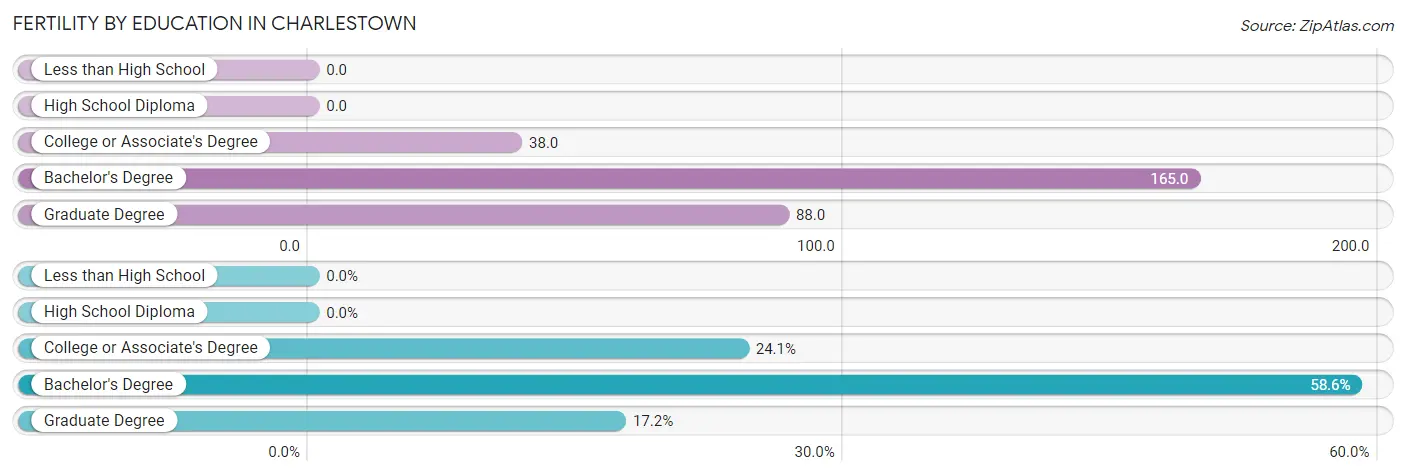
| Educational Attainment | Women with Births | Births / 1,000 Women |
| Less than High School | 0 (0.0%) | 0.0 |
| High School Diploma | 0 (0.0%) | 0.0 |
| College or Associate's Degree | 7 (24.1%) | 38.0 |
| Bachelor's Degree | 17 (58.6%) | 165.0 |
| Graduate Degree | 5 (17.2%) | 88.0 |
| Total | 29 (100.0%) | 65.0 |
Fertility by Education by Marriage Status in Charlestown
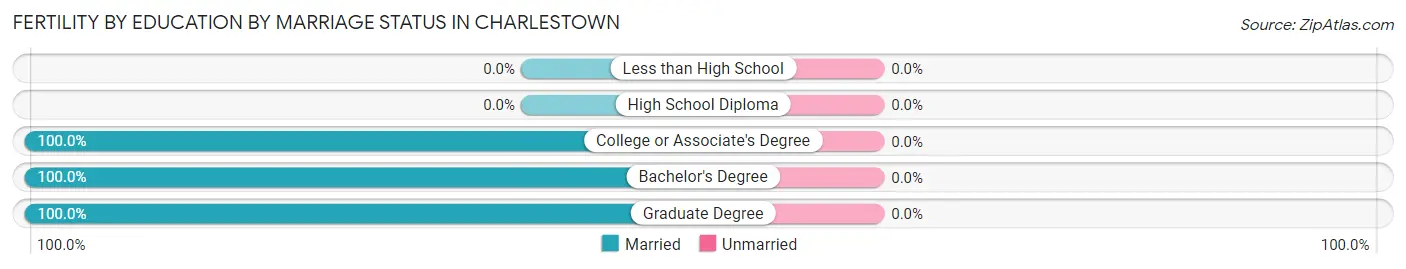
| Educational Attainment | Married | Unmarried |
| Less than High School | 0 (0.0%) | 0 (0.0%) |
| High School Diploma | 0 (0.0%) | 0 (0.0%) |
| College or Associate's Degree | 7 (100.0%) | 0 (0.0%) |
| Bachelor's Degree | 17 (100.0%) | 0 (0.0%) |
| Graduate Degree | 5 (100.0%) | 0 (0.0%) |
| Total | 29 (100.0%) | 0 (0.0%) |
Employment Characteristics in Charlestown
Employment by Class of Employer in Charlestown
Among the 871 employed individuals in Charlestown, private company employees (493 | 56.6%), federal government employees (154 | 17.7%), and local government employees (114 | 13.1%) make up the most common classes of employment.
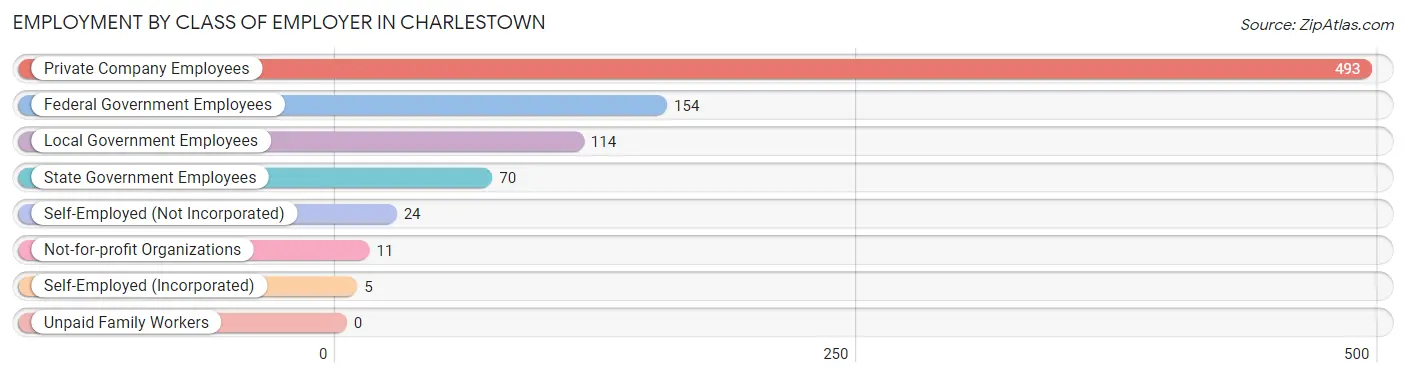
| Employer Class | # Employees | % Employees |
| Private Company Employees | 493 | 56.6% |
| Self-Employed (Incorporated) | 5 | 0.6% |
| Self-Employed (Not Incorporated) | 24 | 2.8% |
| Not-for-profit Organizations | 11 | 1.3% |
| Local Government Employees | 114 | 13.1% |
| State Government Employees | 70 | 8.0% |
| Federal Government Employees | 154 | 17.7% |
| Unpaid Family Workers | 0 | 0.0% |
| Total | 871 | 100.0% |
Employment Status by Age in Charlestown
According to the labor force statistics for Charlestown, out of the total population over 16 years of age (1,437), 62.6% or 900 individuals are in the labor force, with 3.2% or 29 of them unemployed. The age group with the highest labor force participation rate is 20 to 24 years, with 100.0% or 12 individuals in the labor force. Within the labor force, the 30 to 34 years age range has the highest percentage of unemployed individuals, with 11.9% or 20 of them being unemployed.
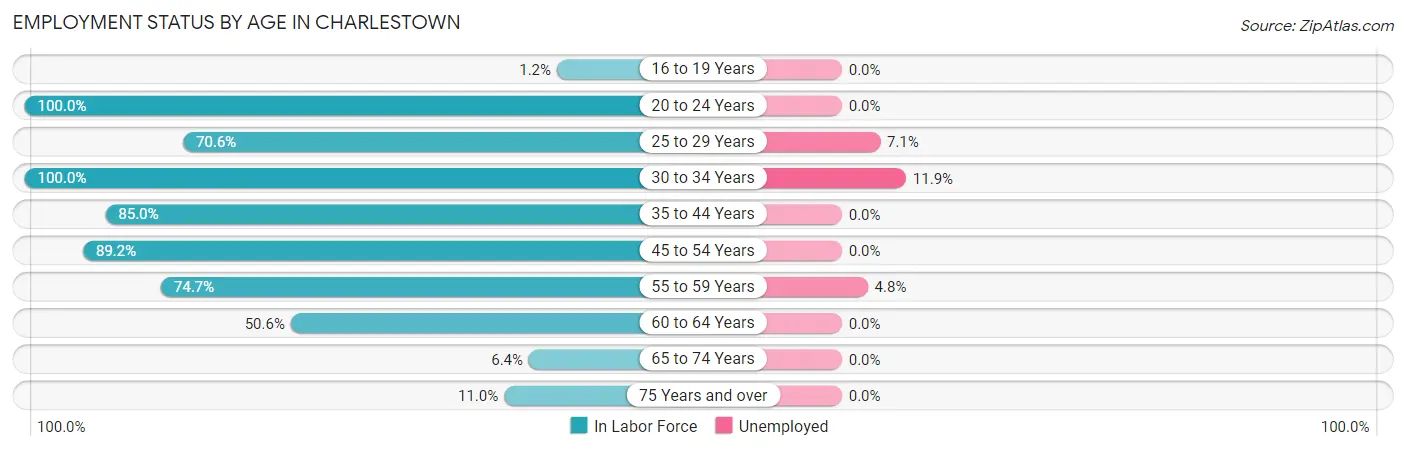
| Age Bracket | In Labor Force | Unemployed |
| 16 to 19 Years | 1 (1.2%) | 0 (0.0%) |
| 20 to 24 Years | 12 (100.0%) | 0 (0.0%) |
| 25 to 29 Years | 84 (70.6%) | 6 (7.1%) |
| 30 to 34 Years | 172 (100.0%) | 20 (11.9%) |
| 35 to 44 Years | 301 (85.0%) | 0 (0.0%) |
| 45 to 54 Years | 199 (89.2%) | 0 (0.0%) |
| 55 to 59 Years | 62 (74.7%) | 3 (4.8%) |
| 60 to 64 Years | 40 (50.6%) | 0 (0.0%) |
| 65 to 74 Years | 9 (6.4%) | 0 (0.0%) |
| 75 Years and over | 19 (11.0%) | 0 (0.0%) |
| Total | 900 (62.6%) | 29 (3.2%) |
Employment Status by Educational Attainment in Charlestown
According to labor force statistics for Charlestown, 83.3% of individuals (858) out of the total population between 25 and 64 years of age (1,030) are in the labor force, with 3.3% or 28 of them being unemployed. The group with the highest labor force participation rate are those with the educational attainment of college / associate degree, with 84.9% or 310 individuals in the labor force. Within the labor force, individuals with less than high school education have the highest percentage of unemployment, with 12.5% or 4 of them being unemployed.
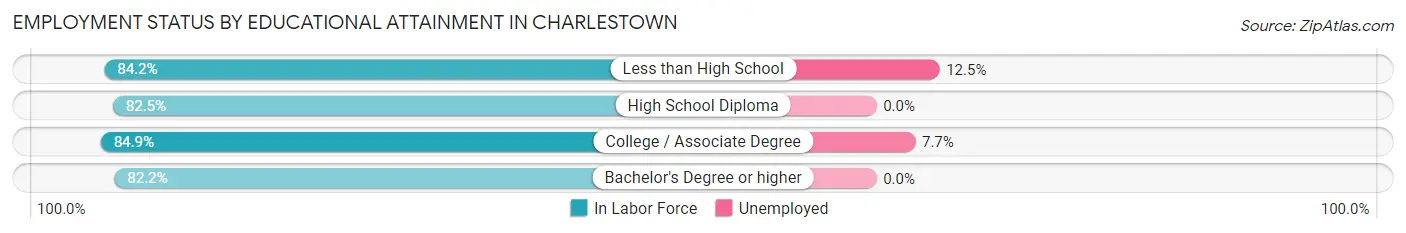
| Educational Attainment | In Labor Force | Unemployed |
| Less than High School | 32 (84.2%) | 5 (12.5%) |
| High School Diploma | 203 (82.5%) | 0 (0.0%) |
| College / Associate Degree | 310 (84.9%) | 28 (7.7%) |
| Bachelor's Degree or higher | 313 (82.2%) | 0 (0.0%) |
| Total | 858 (83.3%) | 34 (3.3%) |
Employment Occupations by Sex in Charlestown
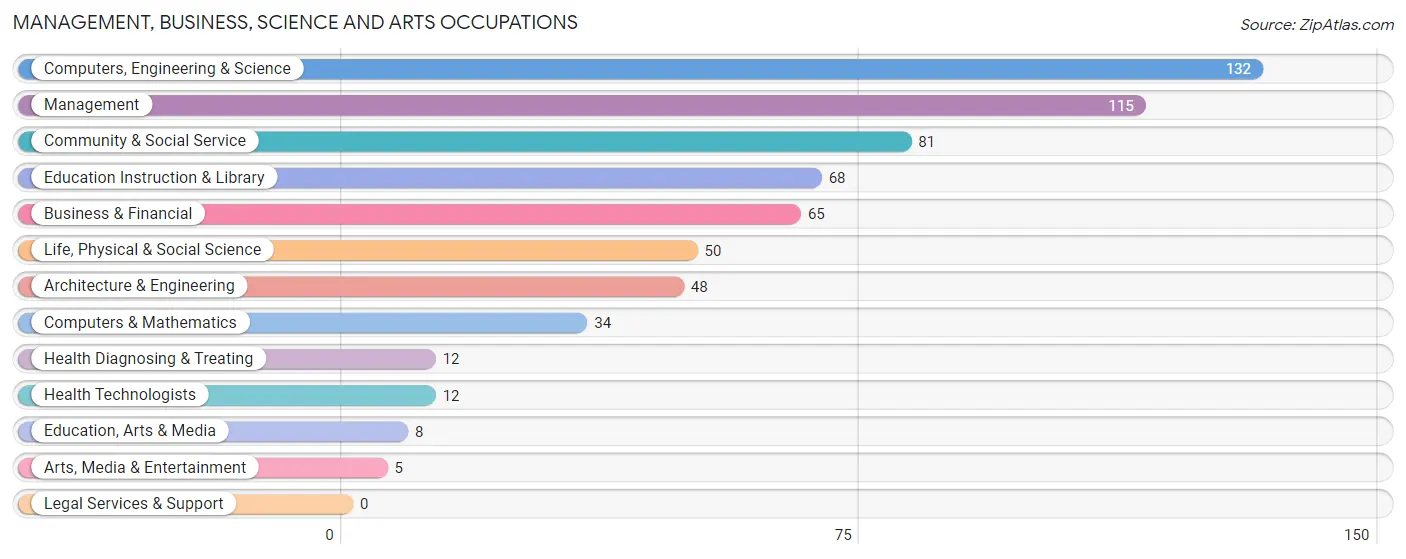
Management, Business, Science and Arts Occupations
The most common Management, Business, Science and Arts occupations in Charlestown are Computers, Engineering & Science (132 | 15.5%), Management (115 | 13.5%), Community & Social Service (81 | 9.5%), Education Instruction & Library (68 | 8.0%), and Business & Financial (65 | 7.6%).
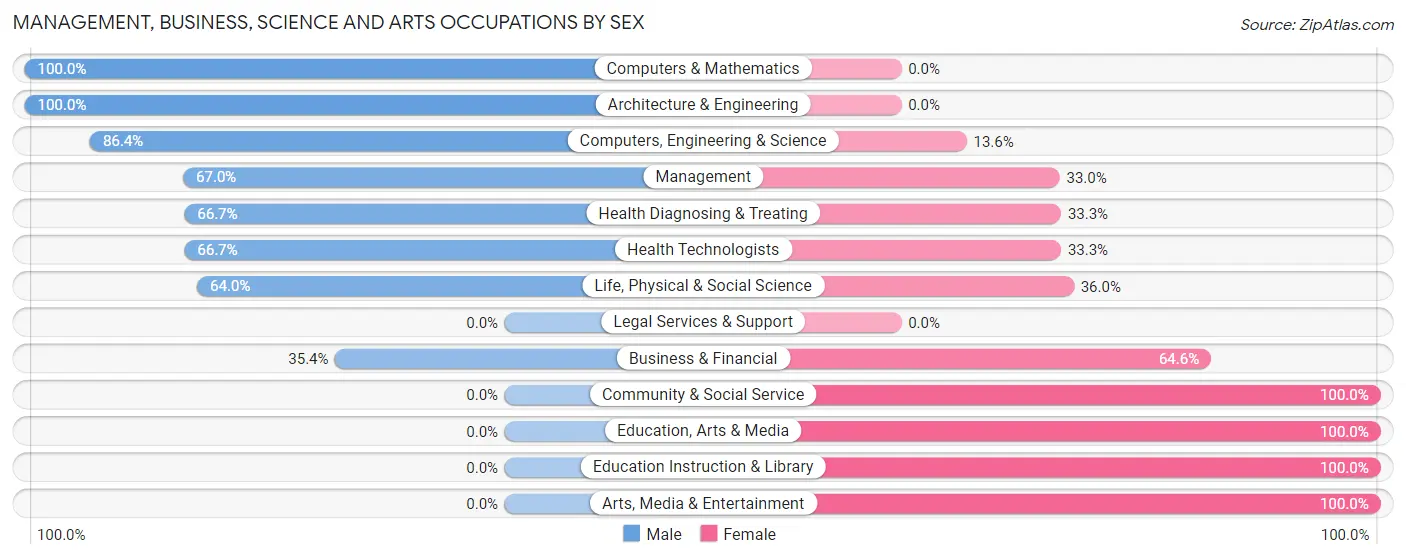
Management, Business, Science and Arts Occupations by Sex
Within the Management, Business, Science and Arts occupations in Charlestown, the most male-oriented occupations are Computers & Mathematics (100.0%), Architecture & Engineering (100.0%), and Computers, Engineering & Science (86.4%), while the most female-oriented occupations are Community & Social Service (100.0%), Education, Arts & Media (100.0%), and Education Instruction & Library (100.0%).
| Occupation | Male | Female |
| Management | 77 (67.0%) | 38 (33.0%) |
| Business & Financial | 23 (35.4%) | 42 (64.6%) |
| Computers, Engineering & Science | 114 (86.4%) | 18 (13.6%) |
| Computers & Mathematics | 34 (100.0%) | 0 (0.0%) |
| Architecture & Engineering | 48 (100.0%) | 0 (0.0%) |
| Life, Physical & Social Science | 32 (64.0%) | 18 (36.0%) |
| Community & Social Service | 0 (0.0%) | 81 (100.0%) |
| Education, Arts & Media | 0 (0.0%) | 8 (100.0%) |
| Legal Services & Support | 0 (0.0%) | 0 (0.0%) |
| Education Instruction & Library | 0 (0.0%) | 68 (100.0%) |
| Arts, Media & Entertainment | 0 (0.0%) | 5 (100.0%) |
| Health Diagnosing & Treating | 8 (66.7%) | 4 (33.3%) |
| Health Technologists | 8 (66.7%) | 4 (33.3%) |
| Total (Category) | 222 (54.8%) | 183 (45.2%) |
| Total (Overall) | 461 (54.0%) | 393 (46.0%) |
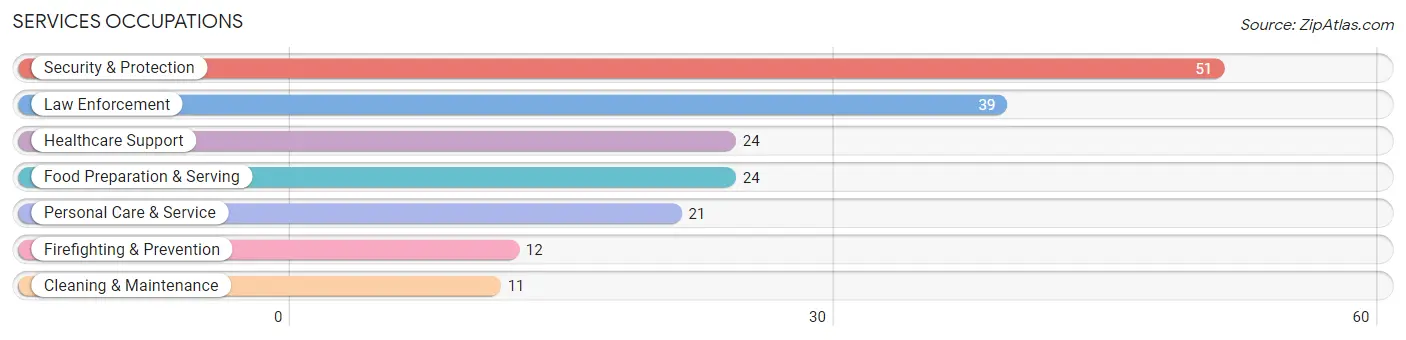
Services Occupations
The most common Services occupations in Charlestown are Security & Protection (51 | 6.0%), Law Enforcement (39 | 4.6%), Healthcare Support (24 | 2.8%), Food Preparation & Serving (24 | 2.8%), and Personal Care & Service (21 | 2.5%).
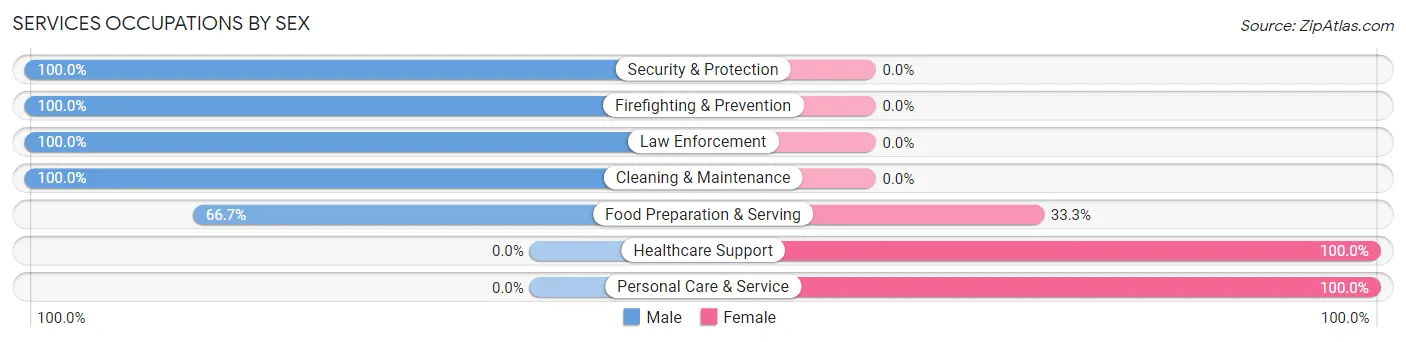
Services Occupations by Sex
Within the Services occupations in Charlestown, the most male-oriented occupations are Security & Protection (100.0%), Firefighting & Prevention (100.0%), and Law Enforcement (100.0%), while the most female-oriented occupations are Healthcare Support (100.0%), Personal Care & Service (100.0%), and Food Preparation & Serving (33.3%).
| Occupation | Male | Female |
| Healthcare Support | 0 (0.0%) | 24 (100.0%) |
| Security & Protection | 51 (100.0%) | 0 (0.0%) |
| Firefighting & Prevention | 12 (100.0%) | 0 (0.0%) |
| Law Enforcement | 39 (100.0%) | 0 (0.0%) |
| Food Preparation & Serving | 16 (66.7%) | 8 (33.3%) |
| Cleaning & Maintenance | 11 (100.0%) | 0 (0.0%) |
| Personal Care & Service | 0 (0.0%) | 21 (100.0%) |
| Total (Category) | 78 (59.5%) | 53 (40.5%) |
| Total (Overall) | 461 (54.0%) | 393 (46.0%) |
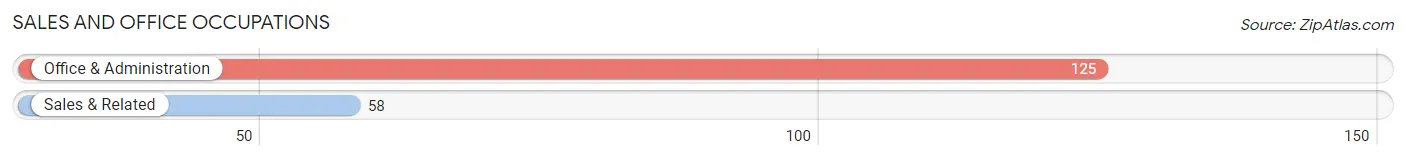
Sales and Office Occupations
The most common Sales and Office occupations in Charlestown are Office & Administration (125 | 14.6%), and Sales & Related (58 | 6.8%).
Sales and Office Occupations by Sex
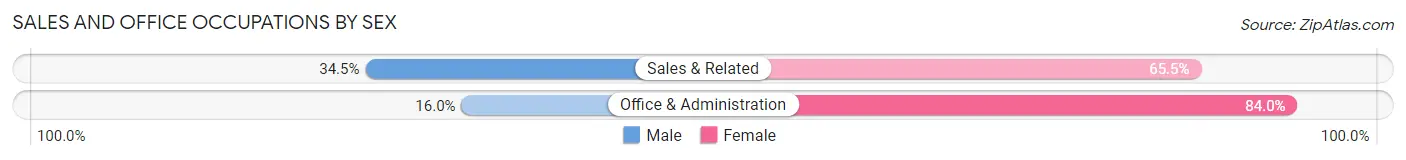
| Occupation | Male | Female |
| Sales & Related | 20 (34.5%) | 38 (65.5%) |
| Office & Administration | 20 (16.0%) | 105 (84.0%) |
| Total (Category) | 40 (21.9%) | 143 (78.1%) |
| Total (Overall) | 461 (54.0%) | 393 (46.0%) |
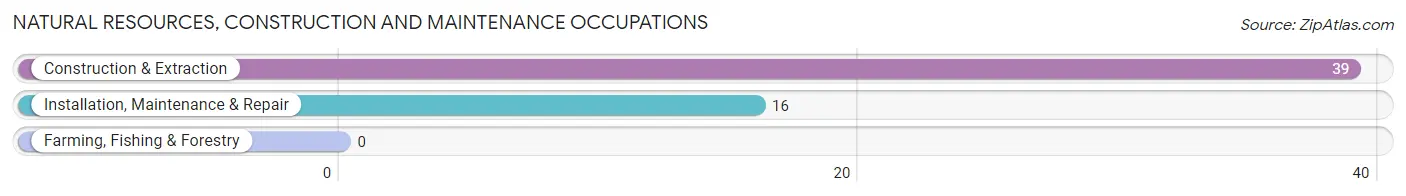
Natural Resources, Construction and Maintenance Occupations
The most common Natural Resources, Construction and Maintenance occupations in Charlestown are Construction & Extraction (39 | 4.6%), and Installation, Maintenance & Repair (16 | 1.9%).
Natural Resources, Construction and Maintenance Occupations by Sex
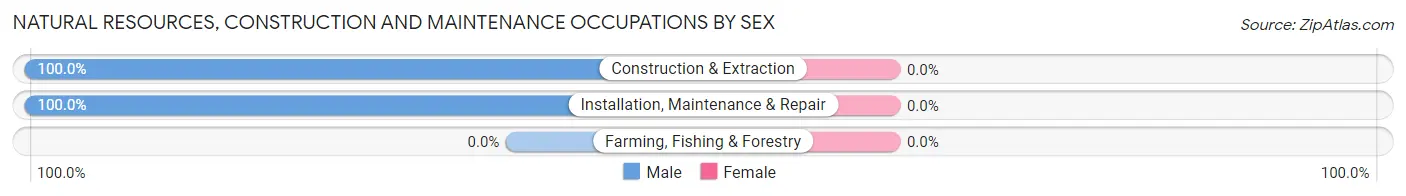
| Occupation | Male | Female |
| Farming, Fishing & Forestry | 0 (0.0%) | 0 (0.0%) |
| Construction & Extraction | 39 (100.0%) | 0 (0.0%) |
| Installation, Maintenance & Repair | 16 (100.0%) | 0 (0.0%) |
| Total (Category) | 55 (100.0%) | 0 (0.0%) |
| Total (Overall) | 461 (54.0%) | 393 (46.0%) |
Production, Transportation and Moving Occupations
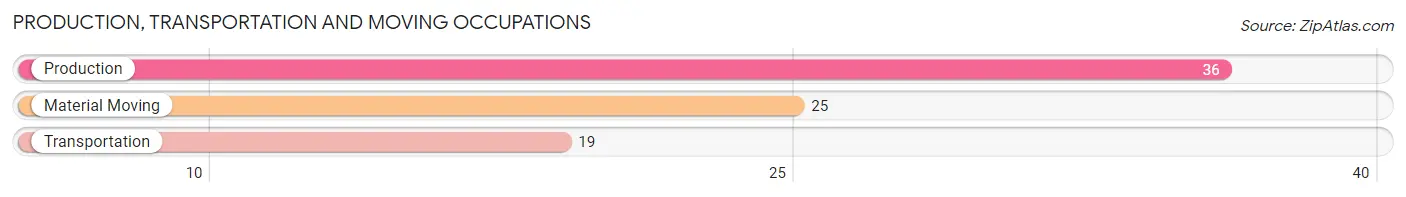
The most common Production, Transportation and Moving occupations in Charlestown are Production (36 | 4.2%), Material Moving (25 | 2.9%), and Transportation (19 | 2.2%).
Production, Transportation and Moving Occupations by Sex
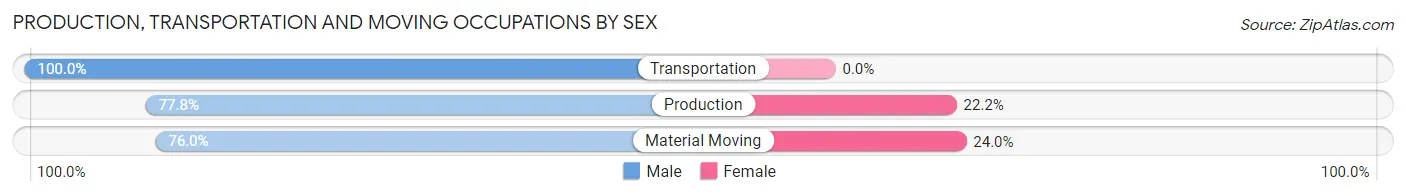
| Occupation | Male | Female |
| Production | 28 (77.8%) | 8 (22.2%) |
| Transportation | 19 (100.0%) | 0 (0.0%) |
| Material Moving | 19 (76.0%) | 6 (24.0%) |
| Total (Category) | 66 (82.5%) | 14 (17.5%) |
| Total (Overall) | 461 (54.0%) | 393 (46.0%) |
Employment Industries by Sex in Charlestown
Employment Industries in Charlestown
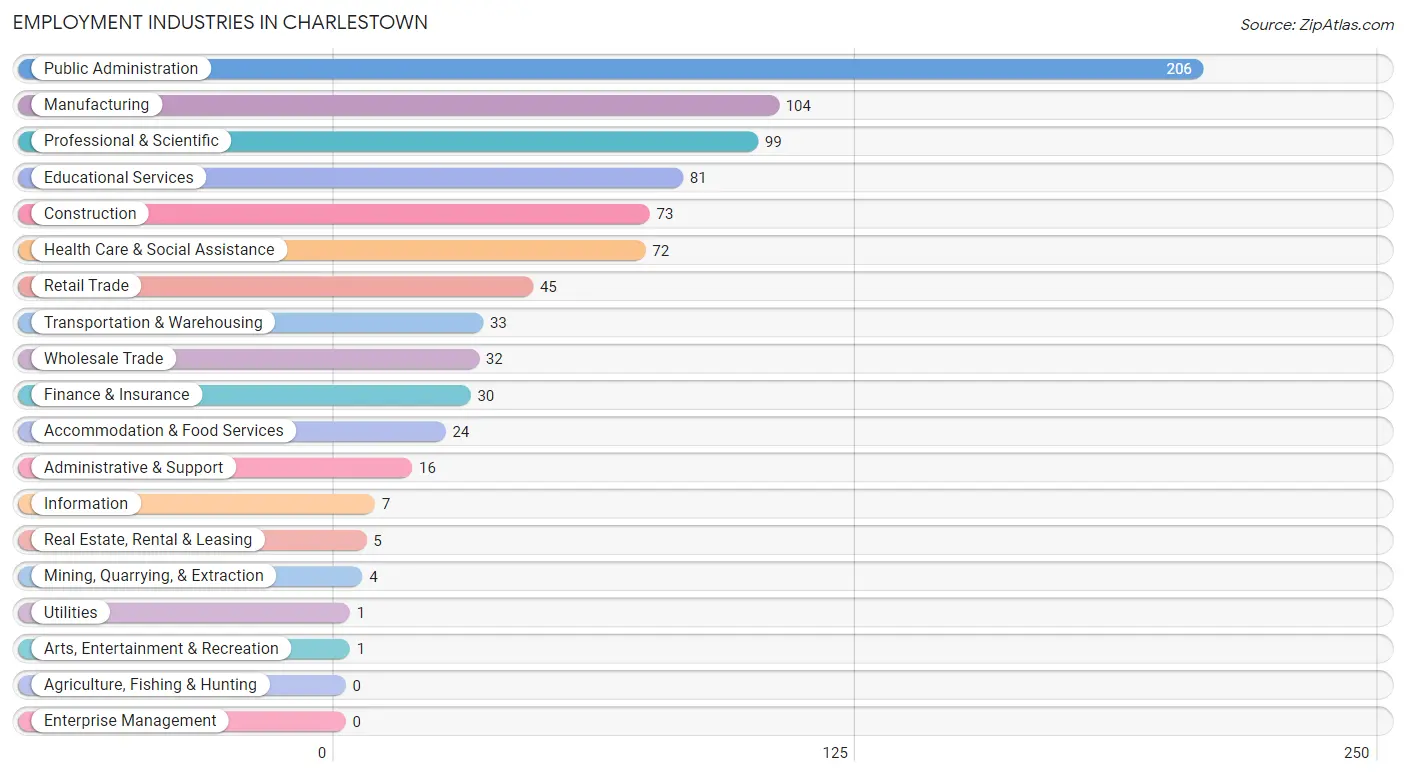
The major employment industries in Charlestown include Public Administration (206 | 24.1%), Manufacturing (104 | 12.2%), Professional & Scientific (99 | 11.6%), Educational Services (81 | 9.5%), and Construction (73 | 8.6%).
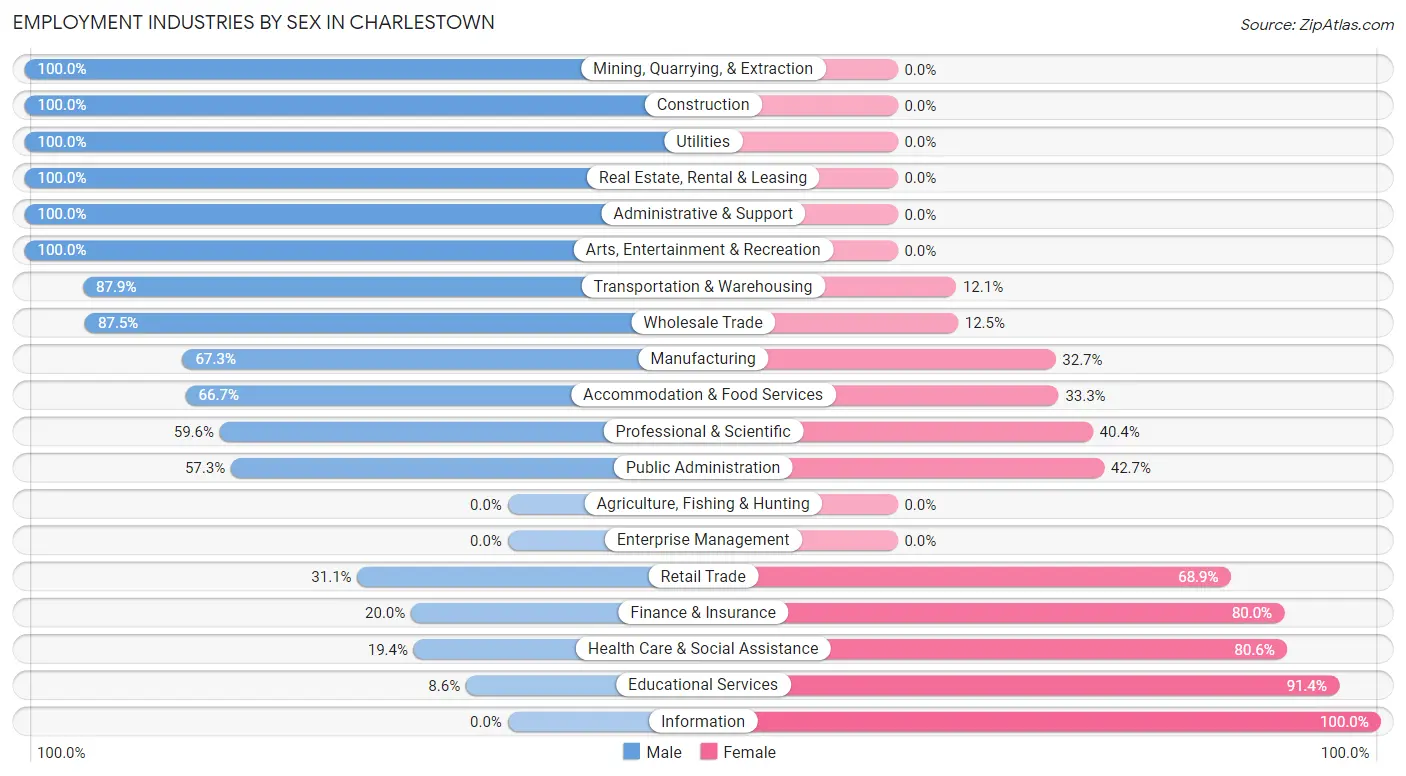
Employment Industries by Sex in Charlestown
The Charlestown industries that see more men than women are Mining, Quarrying, & Extraction (100.0%), Construction (100.0%), and Utilities (100.0%), whereas the industries that tend to have a higher number of women are Information (100.0%), Educational Services (91.4%), and Health Care & Social Assistance (80.6%).
| Industry | Male | Female |
| Agriculture, Fishing & Hunting | 0 (0.0%) | 0 (0.0%) |
| Mining, Quarrying, & Extraction | 4 (100.0%) | 0 (0.0%) |
| Construction | 73 (100.0%) | 0 (0.0%) |
| Manufacturing | 70 (67.3%) | 34 (32.7%) |
| Wholesale Trade | 28 (87.5%) | 4 (12.5%) |
| Retail Trade | 14 (31.1%) | 31 (68.9%) |
| Transportation & Warehousing | 29 (87.9%) | 4 (12.1%) |
| Utilities | 1 (100.0%) | 0 (0.0%) |
| Information | 0 (0.0%) | 7 (100.0%) |
| Finance & Insurance | 6 (20.0%) | 24 (80.0%) |
| Real Estate, Rental & Leasing | 5 (100.0%) | 0 (0.0%) |
| Professional & Scientific | 59 (59.6%) | 40 (40.4%) |
| Enterprise Management | 0 (0.0%) | 0 (0.0%) |
| Administrative & Support | 16 (100.0%) | 0 (0.0%) |
| Educational Services | 7 (8.6%) | 74 (91.4%) |
| Health Care & Social Assistance | 14 (19.4%) | 58 (80.6%) |
| Arts, Entertainment & Recreation | 1 (100.0%) | 0 (0.0%) |
| Accommodation & Food Services | 16 (66.7%) | 8 (33.3%) |
| Public Administration | 118 (57.3%) | 88 (42.7%) |
| Total | 461 (54.0%) | 393 (46.0%) |
Education in Charlestown
School Enrollment in Charlestown
The most common levels of schooling among the 584 students in Charlestown are elementary school (209 | 35.8%), high school (120 | 20.5%), and middle school (93 | 15.9%).
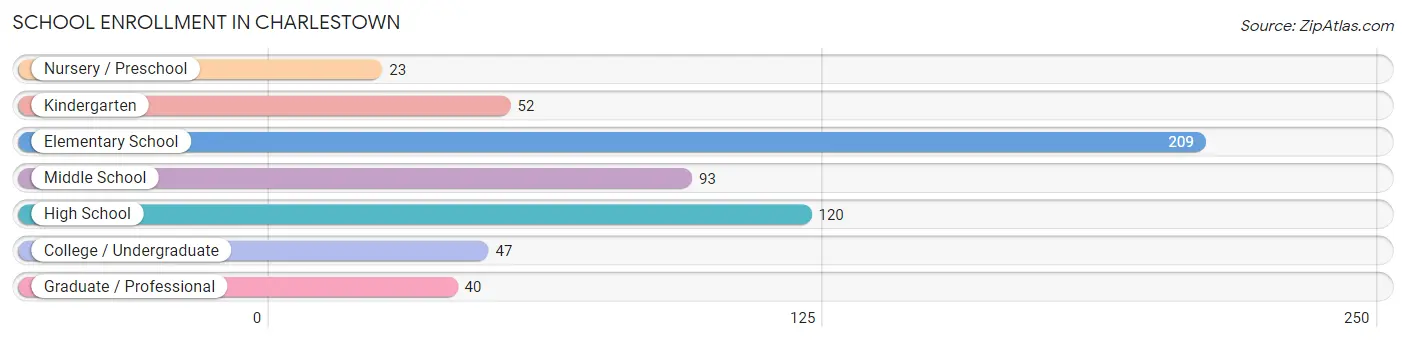
| School Level | # Students | % Students |
| Nursery / Preschool | 23 | 3.9% |
| Kindergarten | 52 | 8.9% |
| Elementary School | 209 | 35.8% |
| Middle School | 93 | 15.9% |
| High School | 120 | 20.5% |
| College / Undergraduate | 47 | 8.1% |
| Graduate / Professional | 40 | 6.9% |
| Total | 584 | 100.0% |
School Enrollment by Age by Funding Source in Charlestown
Out of a total of 584 students who are enrolled in schools in Charlestown, 126 (21.6%) attend a private institution, while the remaining 458 (78.4%) are enrolled in public schools. The age group of 10 to 14 year olds has the highest likelihood of being enrolled in private schools, with 45 (32.6% in the age bracket) enrolled. Conversely, the age group of 3 to 4 year olds has the lowest likelihood of being enrolled in a private school, with 2 (100.0% in the age bracket) attending a public institution.
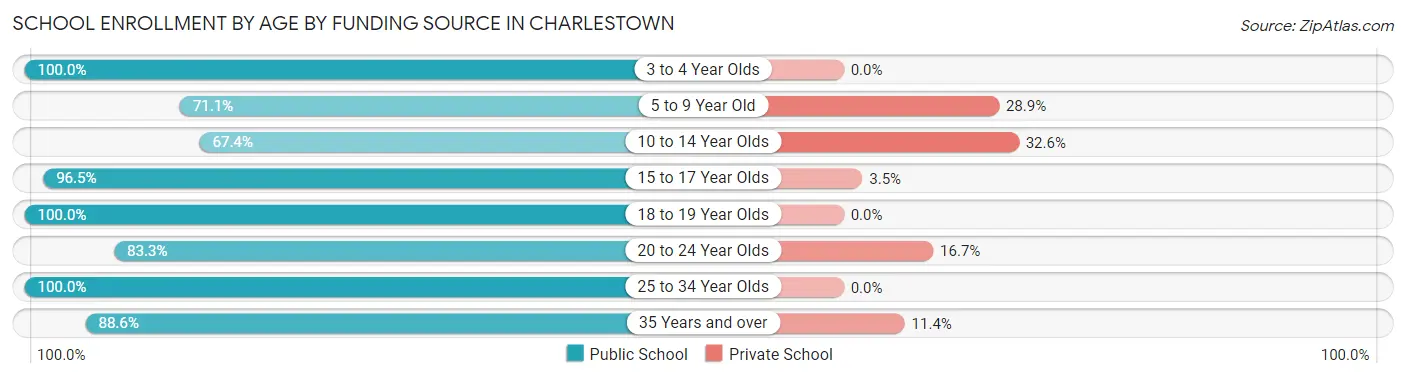
| Age Bracket | Public School | Private School |
| 3 to 4 Year Olds | 2 (100.0%) | 0 (0.0%) |
| 5 to 9 Year Old | 172 (71.1%) | 70 (28.9%) |
| 10 to 14 Year Olds | 93 (67.4%) | 45 (32.6%) |
| 15 to 17 Year Olds | 111 (96.5%) | 4 (3.5%) |
| 18 to 19 Year Olds | 1 (100.0%) | 0 (0.0%) |
| 20 to 24 Year Olds | 10 (83.3%) | 2 (16.7%) |
| 25 to 34 Year Olds | 30 (100.0%) | 0 (0.0%) |
| 35 Years and over | 39 (88.6%) | 5 (11.4%) |
| Total | 458 (78.4%) | 126 (21.6%) |
Educational Attainment by Field of Study in Charlestown
Education (66 | 11.8%), engineering (64 | 11.5%), computers & mathematics (55 | 9.9%), business (55 | 9.9%), and social sciences (52 | 9.3%) are the most common fields of study among 557 individuals in Charlestown who have obtained a bachelor's degree or higher.
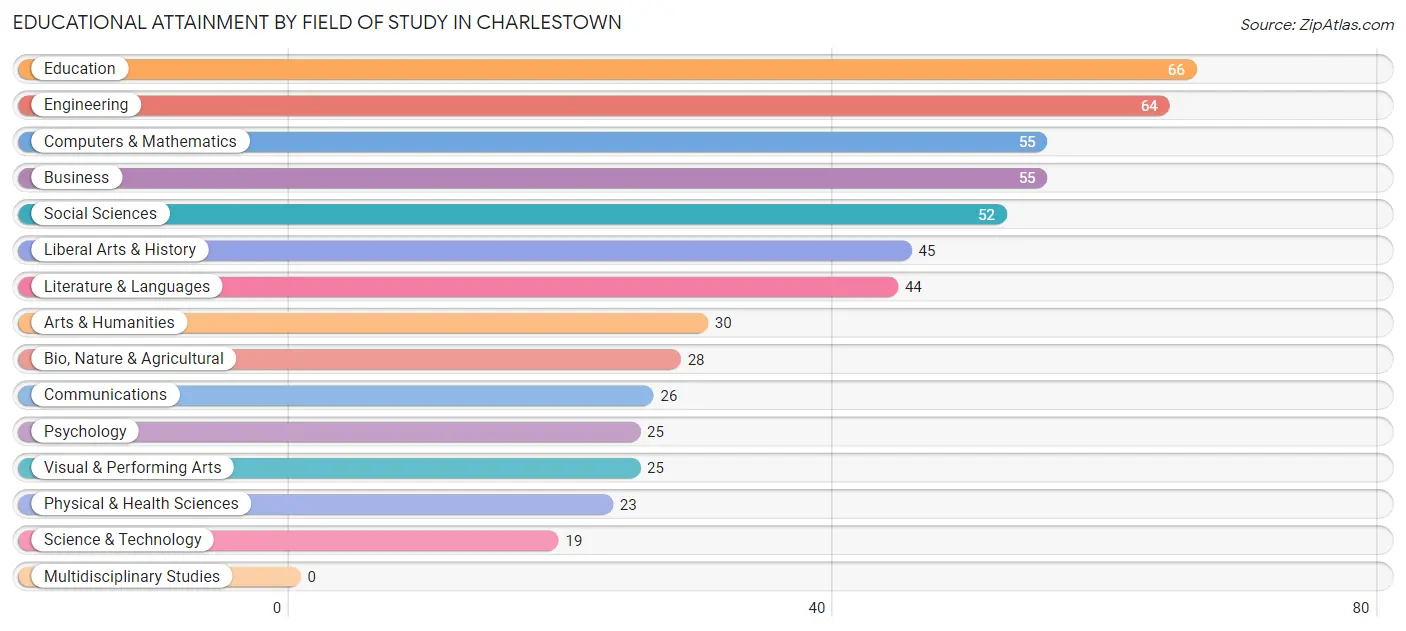
| Field of Study | # Graduates | % Graduates |
| Computers & Mathematics | 55 | 9.9% |
| Bio, Nature & Agricultural | 28 | 5.0% |
| Physical & Health Sciences | 23 | 4.1% |
| Psychology | 25 | 4.5% |
| Social Sciences | 52 | 9.3% |
| Engineering | 64 | 11.5% |
| Multidisciplinary Studies | 0 | 0.0% |
| Science & Technology | 19 | 3.4% |
| Business | 55 | 9.9% |
| Education | 66 | 11.8% |
| Literature & Languages | 44 | 7.9% |
| Liberal Arts & History | 45 | 8.1% |
| Visual & Performing Arts | 25 | 4.5% |
| Communications | 26 | 4.7% |
| Arts & Humanities | 30 | 5.4% |
| Total | 557 | 100.0% |
Transportation & Commute in Charlestown
Vehicle Availability by Sex in Charlestown
The most prevalent vehicle ownership categories in Charlestown are males with 2 vehicles (227, accounting for 47.5%) and females with 2 vehicles (149, making up 57.8%).
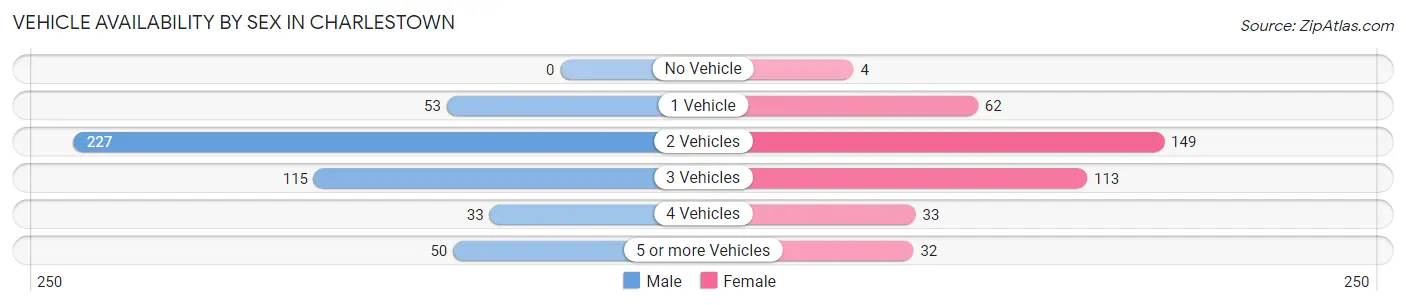
| Vehicles Available | Male | Female |
| No Vehicle | 0 (0.0%) | 4 (1.0%) |
| 1 Vehicle | 53 (11.1%) | 62 (15.8%) |
| 2 Vehicles | 227 (47.5%) | 149 (37.9%) |
| 3 Vehicles | 115 (24.1%) | 113 (28.7%) |
| 4 Vehicles | 33 (6.9%) | 33 (8.4%) |
| 5 or more Vehicles | 50 (10.5%) | 32 (8.1%) |
| Total | 478 (100.0%) | 393 (100.0%) |
Commute Time in Charlestown
The most frequently occuring commute durations in Charlestown are 15 to 19 minutes (118 commuters, 15.3%), 30 to 34 minutes (102 commuters, 13.3%), and 45 to 59 minutes (87 commuters, 11.3%).
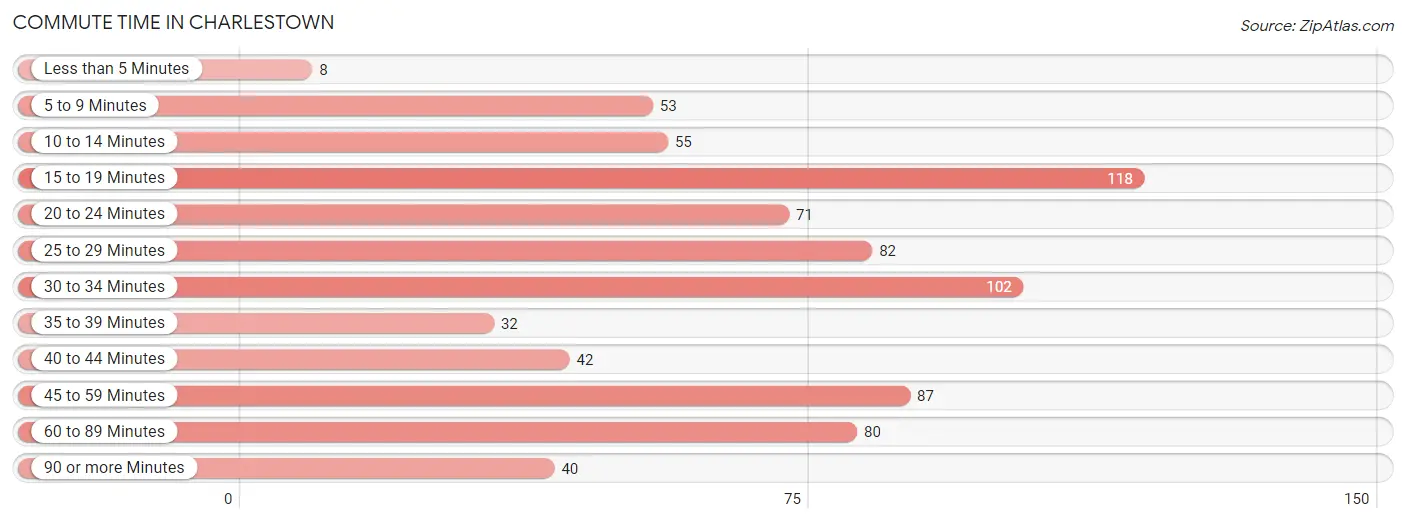
| Commute Time | # Commuters | % Commuters |
| Less than 5 Minutes | 8 | 1.0% |
| 5 to 9 Minutes | 53 | 6.9% |
| 10 to 14 Minutes | 55 | 7.1% |
| 15 to 19 Minutes | 118 | 15.3% |
| 20 to 24 Minutes | 71 | 9.2% |
| 25 to 29 Minutes | 82 | 10.6% |
| 30 to 34 Minutes | 102 | 13.3% |
| 35 to 39 Minutes | 32 | 4.2% |
| 40 to 44 Minutes | 42 | 5.4% |
| 45 to 59 Minutes | 87 | 11.3% |
| 60 to 89 Minutes | 80 | 10.4% |
| 90 or more Minutes | 40 | 5.2% |
Commute Time by Sex in Charlestown
The most common commute times in Charlestown are 15 to 19 minutes (81 commuters, 18.1%) for males and 30 to 34 minutes (45 commuters, 13.9%) for females.
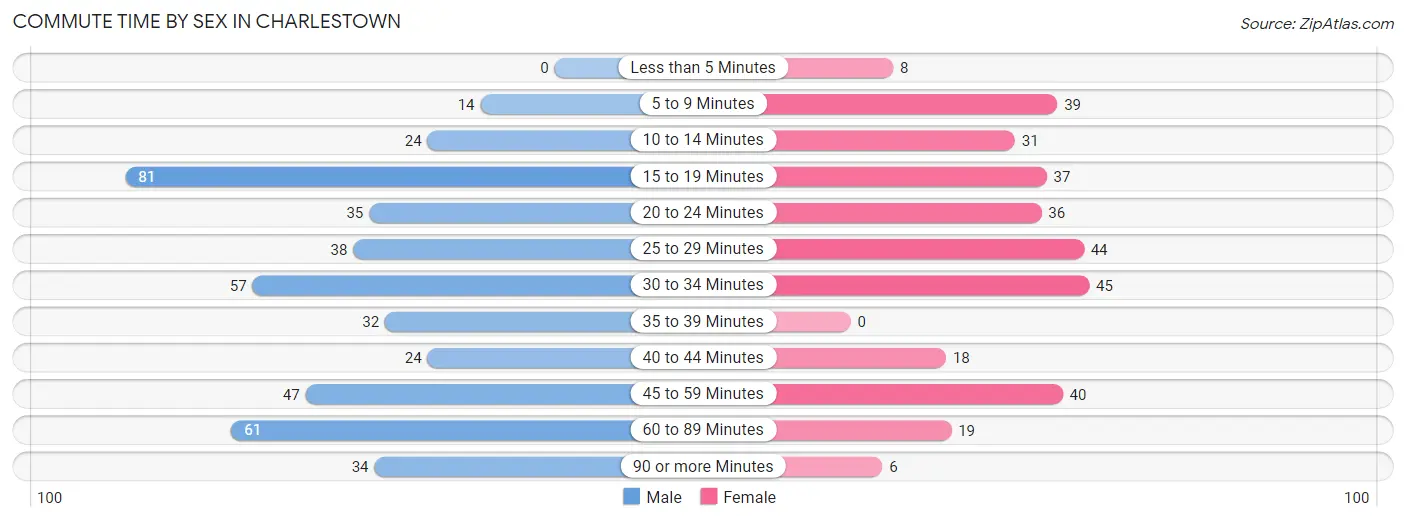
| Commute Time | Male | Female |
| Less than 5 Minutes | 0 (0.0%) | 8 (2.5%) |
| 5 to 9 Minutes | 14 (3.1%) | 39 (12.1%) |
| 10 to 14 Minutes | 24 (5.4%) | 31 (9.6%) |
| 15 to 19 Minutes | 81 (18.1%) | 37 (11.5%) |
| 20 to 24 Minutes | 35 (7.8%) | 36 (11.2%) |
| 25 to 29 Minutes | 38 (8.5%) | 44 (13.6%) |
| 30 to 34 Minutes | 57 (12.8%) | 45 (13.9%) |
| 35 to 39 Minutes | 32 (7.2%) | 0 (0.0%) |
| 40 to 44 Minutes | 24 (5.4%) | 18 (5.6%) |
| 45 to 59 Minutes | 47 (10.5%) | 40 (12.4%) |
| 60 to 89 Minutes | 61 (13.7%) | 19 (5.9%) |
| 90 or more Minutes | 34 (7.6%) | 6 (1.9%) |
Time of Departure to Work by Sex in Charlestown
The most frequent times of departure to work in Charlestown are 7:00 AM to 7:29 AM (111, 24.8%) for males and 7:00 AM to 7:29 AM (100, 31.0%) for females.
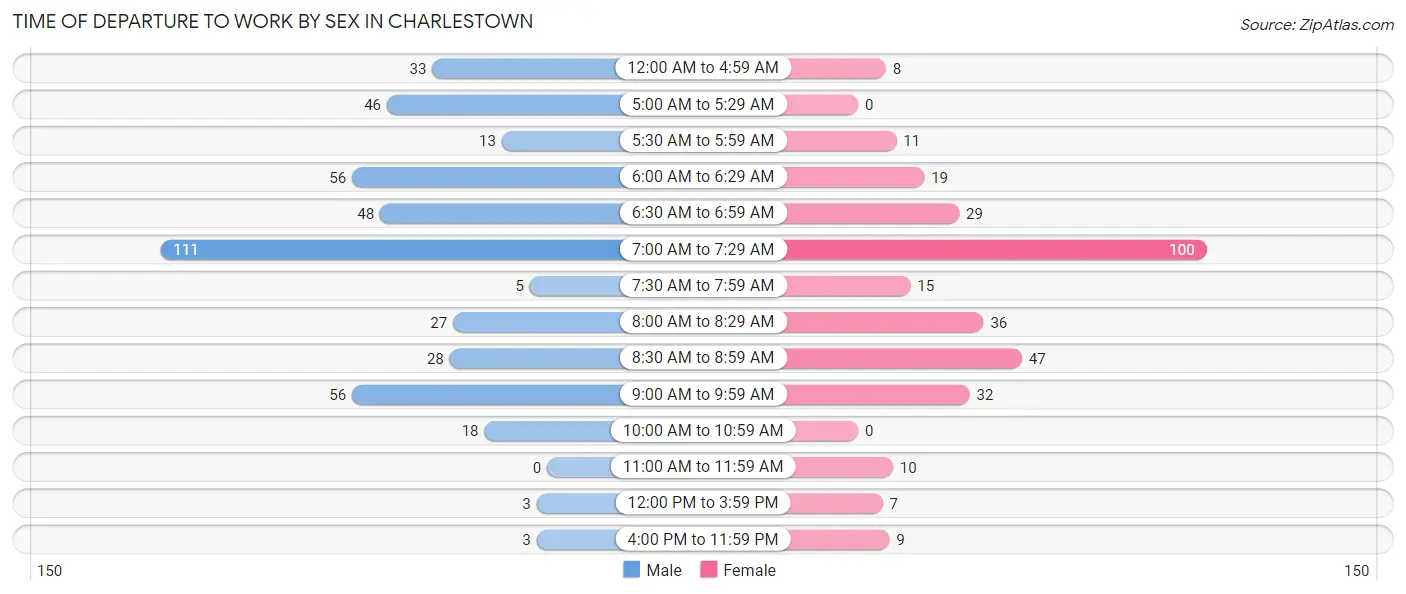
| Time of Departure | Male | Female |
| 12:00 AM to 4:59 AM | 33 (7.4%) | 8 (2.5%) |
| 5:00 AM to 5:29 AM | 46 (10.3%) | 0 (0.0%) |
| 5:30 AM to 5:59 AM | 13 (2.9%) | 11 (3.4%) |
| 6:00 AM to 6:29 AM | 56 (12.5%) | 19 (5.9%) |
| 6:30 AM to 6:59 AM | 48 (10.7%) | 29 (9.0%) |
| 7:00 AM to 7:29 AM | 111 (24.8%) | 100 (31.0%) |
| 7:30 AM to 7:59 AM | 5 (1.1%) | 15 (4.6%) |
| 8:00 AM to 8:29 AM | 27 (6.0%) | 36 (11.2%) |
| 8:30 AM to 8:59 AM | 28 (6.3%) | 47 (14.5%) |
| 9:00 AM to 9:59 AM | 56 (12.5%) | 32 (9.9%) |
| 10:00 AM to 10:59 AM | 18 (4.0%) | 0 (0.0%) |
| 11:00 AM to 11:59 AM | 0 (0.0%) | 10 (3.1%) |
| 12:00 PM to 3:59 PM | 3 (0.7%) | 7 (2.2%) |
| 4:00 PM to 11:59 PM | 3 (0.7%) | 9 (2.8%) |
| Total | 447 (100.0%) | 323 (100.0%) |
Housing Occupancy in Charlestown
Occupancy by Ownership in Charlestown
Of the total 737 dwellings in Charlestown, owner-occupied units account for 583 (79.1%), while renter-occupied units make up 154 (20.9%).
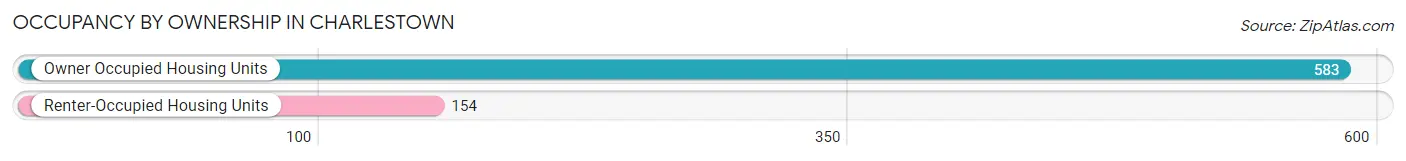
| Occupancy | # Housing Units | % Housing Units |
| Owner Occupied Housing Units | 583 | 79.1% |
| Renter-Occupied Housing Units | 154 | 20.9% |
| Total Occupied Housing Units | 737 | 100.0% |
Occupancy by Household Size in Charlestown
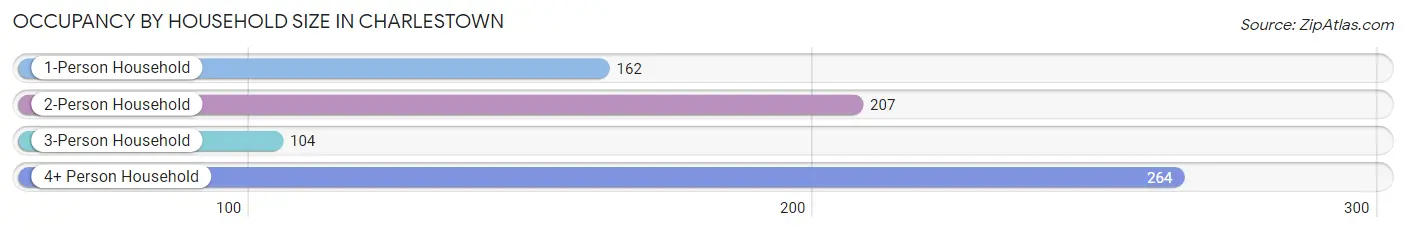
| Household Size | # Housing Units | % Housing Units |
| 1-Person Household | 162 | 22.0% |
| 2-Person Household | 207 | 28.1% |
| 3-Person Household | 104 | 14.1% |
| 4+ Person Household | 264 | 35.8% |
| Total Housing Units | 737 | 100.0% |
Occupancy by Ownership by Household Size in Charlestown
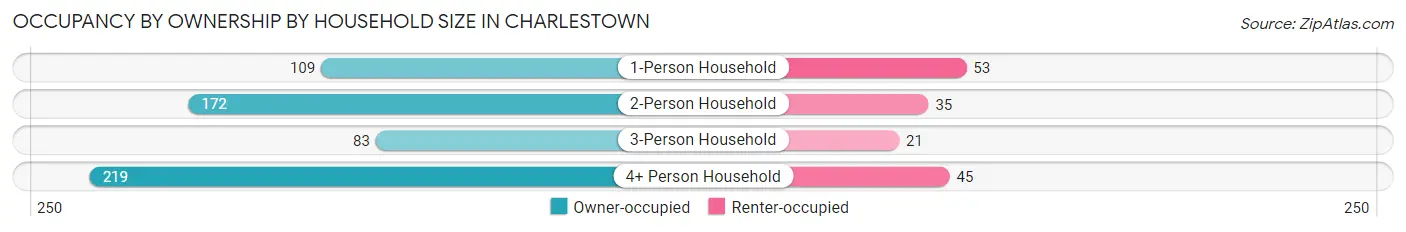
| Household Size | Owner-occupied | Renter-occupied |
| 1-Person Household | 109 (67.3%) | 53 (32.7%) |
| 2-Person Household | 172 (83.1%) | 35 (16.9%) |
| 3-Person Household | 83 (79.8%) | 21 (20.2%) |
| 4+ Person Household | 219 (83.0%) | 45 (17.1%) |
| Total Housing Units | 583 (79.1%) | 154 (20.9%) |
Occupancy by Educational Attainment in Charlestown

| Household Size | Owner-occupied | Renter-occupied |
| Less than High School | 41 (78.8%) | 11 (21.1%) |
| High School Diploma | 87 (61.3%) | 55 (38.7%) |
| College/Associate Degree | 208 (81.2%) | 48 (18.8%) |
| Bachelor's Degree or higher | 247 (86.1%) | 40 (13.9%) |
Occupancy by Age of Householder in Charlestown
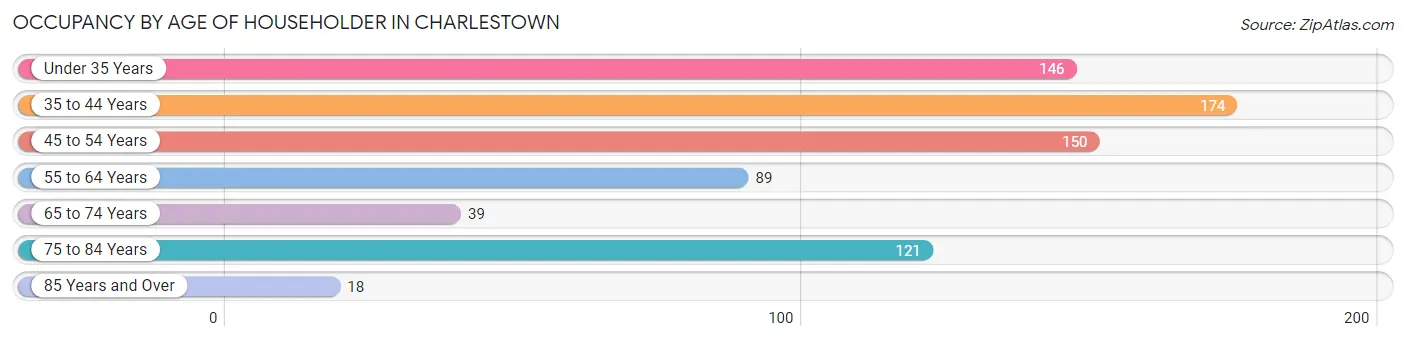
| Age Bracket | # Households | % Households |
| Under 35 Years | 146 | 19.8% |
| 35 to 44 Years | 174 | 23.6% |
| 45 to 54 Years | 150 | 20.3% |
| 55 to 64 Years | 89 | 12.1% |
| 65 to 74 Years | 39 | 5.3% |
| 75 to 84 Years | 121 | 16.4% |
| 85 Years and Over | 18 | 2.4% |
| Total | 737 | 100.0% |
Housing Finances in Charlestown
Median Income by Occupancy in Charlestown
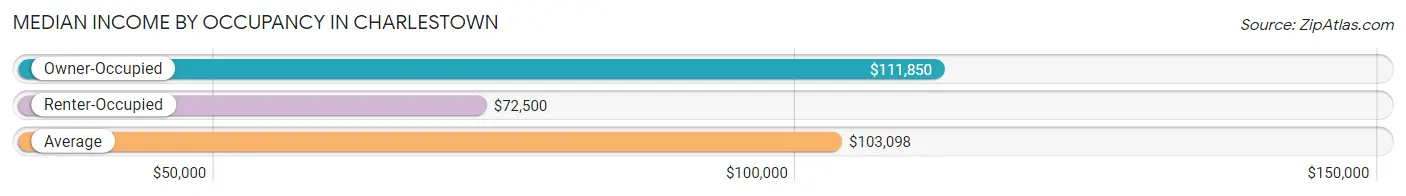
| Occupancy Type | # Households | Median Income |
| Owner-Occupied | 583 (79.1%) | $111,850 |
| Renter-Occupied | 154 (20.9%) | $72,500 |
| Average | 737 (100.0%) | $103,098 |
Occupancy by Householder Income Bracket in Charlestown
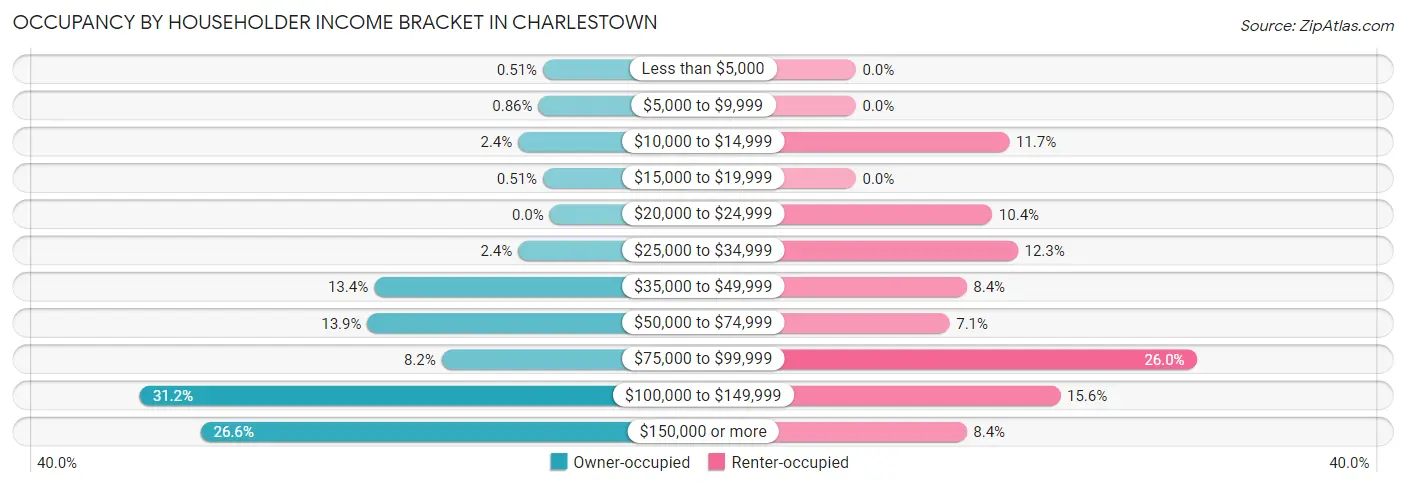
| Income Bracket | Owner-occupied | Renter-occupied |
| Less than $5,000 | 3 (0.5%) | 0 (0.0%) |
| $5,000 to $9,999 | 5 (0.9%) | 0 (0.0%) |
| $10,000 to $14,999 | 14 (2.4%) | 18 (11.7%) |
| $15,000 to $19,999 | 3 (0.5%) | 0 (0.0%) |
| $20,000 to $24,999 | 0 (0.0%) | 16 (10.4%) |
| $25,000 to $34,999 | 14 (2.4%) | 19 (12.3%) |
| $35,000 to $49,999 | 78 (13.4%) | 13 (8.4%) |
| $50,000 to $74,999 | 81 (13.9%) | 11 (7.1%) |
| $75,000 to $99,999 | 48 (8.2%) | 40 (26.0%) |
| $100,000 to $149,999 | 182 (31.2%) | 24 (15.6%) |
| $150,000 or more | 155 (26.6%) | 13 (8.4%) |
| Total | 583 (100.0%) | 154 (100.0%) |
Monthly Housing Cost Tiers in Charlestown
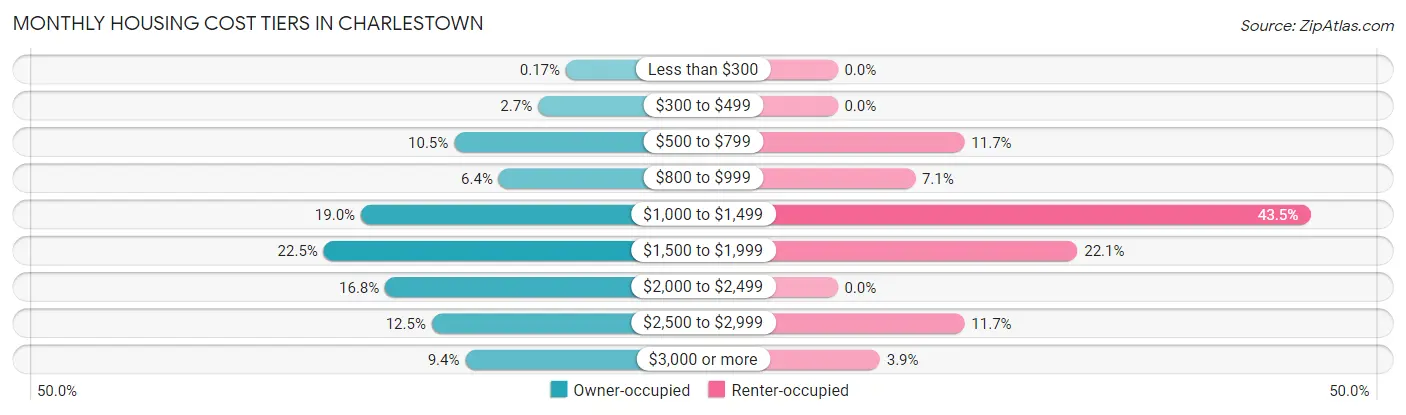
| Monthly Cost | Owner-occupied | Renter-occupied |
| Less than $300 | 1 (0.2%) | 0 (0.0%) |
| $300 to $499 | 16 (2.7%) | 0 (0.0%) |
| $500 to $799 | 61 (10.5%) | 18 (11.7%) |
| $800 to $999 | 37 (6.4%) | 11 (7.1%) |
| $1,000 to $1,499 | 111 (19.0%) | 67 (43.5%) |
| $1,500 to $1,999 | 131 (22.5%) | 34 (22.1%) |
| $2,000 to $2,499 | 98 (16.8%) | 0 (0.0%) |
| $2,500 to $2,999 | 73 (12.5%) | 18 (11.7%) |
| $3,000 or more | 55 (9.4%) | 6 (3.9%) |
| Total | 583 (100.0%) | 154 (100.0%) |
Physical Housing Characteristics in Charlestown
Housing Structures in Charlestown
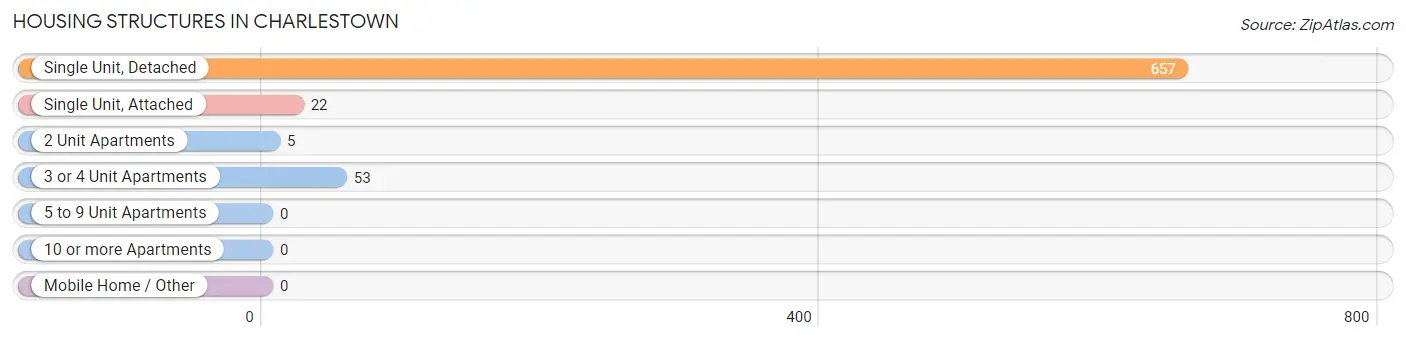
| Structure Type | # Housing Units | % Housing Units |
| Single Unit, Detached | 657 | 89.1% |
| Single Unit, Attached | 22 | 3.0% |
| 2 Unit Apartments | 5 | 0.7% |
| 3 or 4 Unit Apartments | 53 | 7.2% |
| 5 to 9 Unit Apartments | 0 | 0.0% |
| 10 or more Apartments | 0 | 0.0% |
| Mobile Home / Other | 0 | 0.0% |
| Total | 737 | 100.0% |
Housing Structures by Occupancy in Charlestown
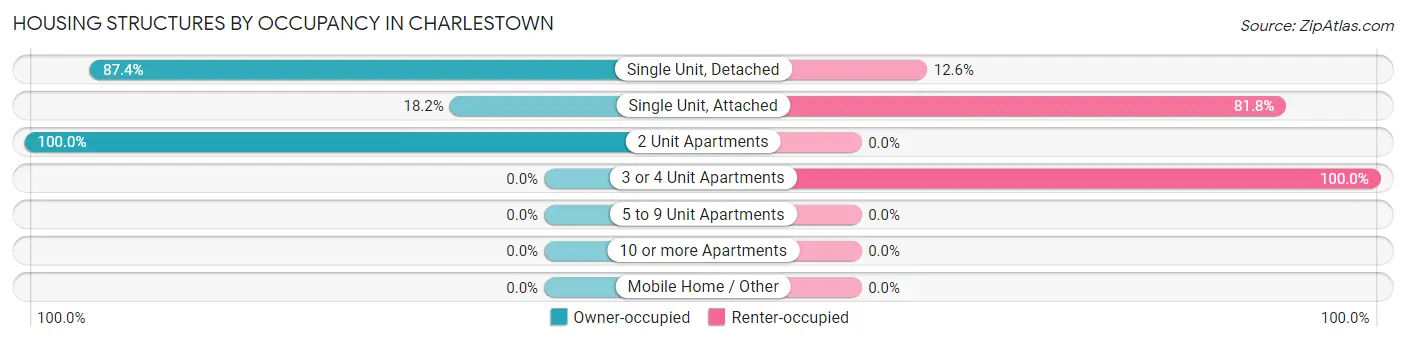
| Structure Type | Owner-occupied | Renter-occupied |
| Single Unit, Detached | 574 (87.4%) | 83 (12.6%) |
| Single Unit, Attached | 4 (18.2%) | 18 (81.8%) |
| 2 Unit Apartments | 5 (100.0%) | 0 (0.0%) |
| 3 or 4 Unit Apartments | 0 (0.0%) | 53 (100.0%) |
| 5 to 9 Unit Apartments | 0 (0.0%) | 0 (0.0%) |
| 10 or more Apartments | 0 (0.0%) | 0 (0.0%) |
| Mobile Home / Other | 0 (0.0%) | 0 (0.0%) |
| Total | 583 (79.1%) | 154 (20.9%) |
Housing Structures by Number of Rooms in Charlestown
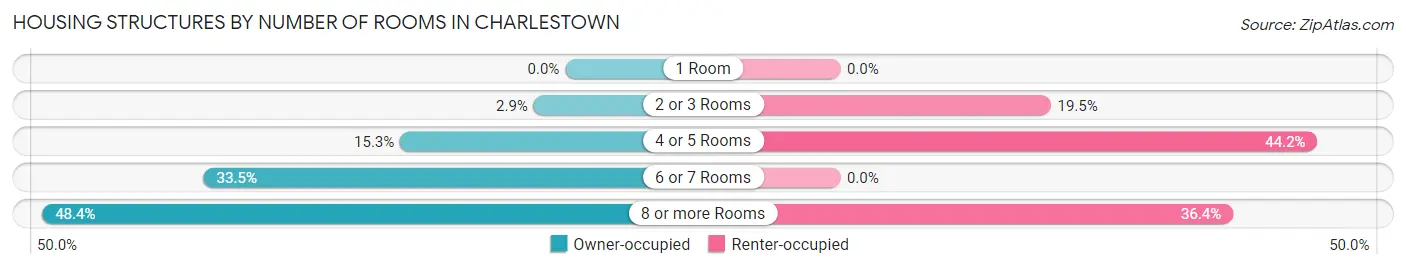
| Number of Rooms | Owner-occupied | Renter-occupied |
| 1 Room | 0 (0.0%) | 0 (0.0%) |
| 2 or 3 Rooms | 17 (2.9%) | 30 (19.5%) |
| 4 or 5 Rooms | 89 (15.3%) | 68 (44.2%) |
| 6 or 7 Rooms | 195 (33.5%) | 0 (0.0%) |
| 8 or more Rooms | 282 (48.4%) | 56 (36.4%) |
| Total | 583 (100.0%) | 154 (100.0%) |
Housing Structure by Heating Type in Charlestown
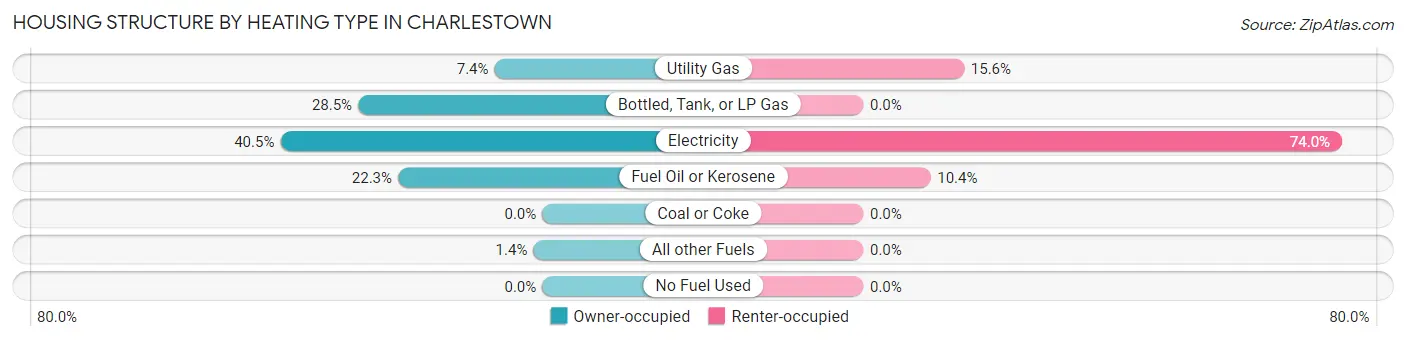
| Heating Type | Owner-occupied | Renter-occupied |
| Utility Gas | 43 (7.4%) | 24 (15.6%) |
| Bottled, Tank, or LP Gas | 166 (28.5%) | 0 (0.0%) |
| Electricity | 236 (40.5%) | 114 (74.0%) |
| Fuel Oil or Kerosene | 130 (22.3%) | 16 (10.4%) |
| Coal or Coke | 0 (0.0%) | 0 (0.0%) |
| All other Fuels | 8 (1.4%) | 0 (0.0%) |
| No Fuel Used | 0 (0.0%) | 0 (0.0%) |
| Total | 583 (100.0%) | 154 (100.0%) |
Household Vehicle Usage in Charlestown
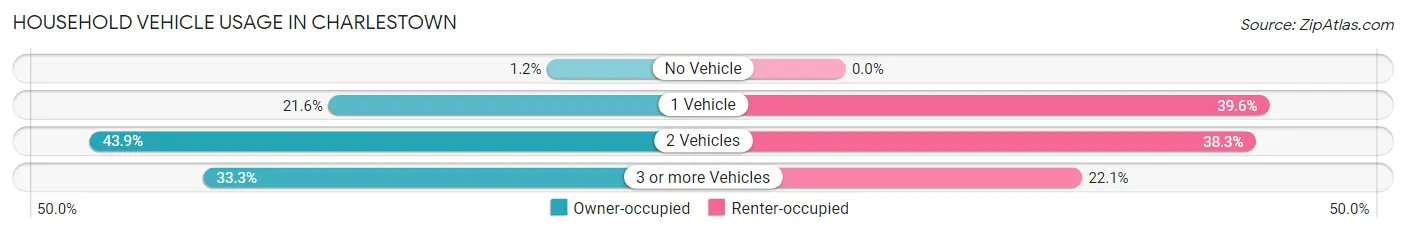
| Vehicles per Household | Owner-occupied | Renter-occupied |
| No Vehicle | 7 (1.2%) | 0 (0.0%) |
| 1 Vehicle | 126 (21.6%) | 61 (39.6%) |
| 2 Vehicles | 256 (43.9%) | 59 (38.3%) |
| 3 or more Vehicles | 194 (33.3%) | 34 (22.1%) |
| Total | 583 (100.0%) | 154 (100.0%) |
Real Estate & Mortgages in Charlestown
Real Estate and Mortgage Overview in Charlestown
| Characteristic | Without Mortgage | With Mortgage |
| Housing Units | 162 | 421 |
| Median Property Value | $331,300 | $363,000 |
| Median Household Income | $71,389 | $123 |
| Monthly Housing Costs | $818 | $55 |
| Real Estate Taxes | $3,657 | $4 |
Property Value by Mortgage Status in Charlestown
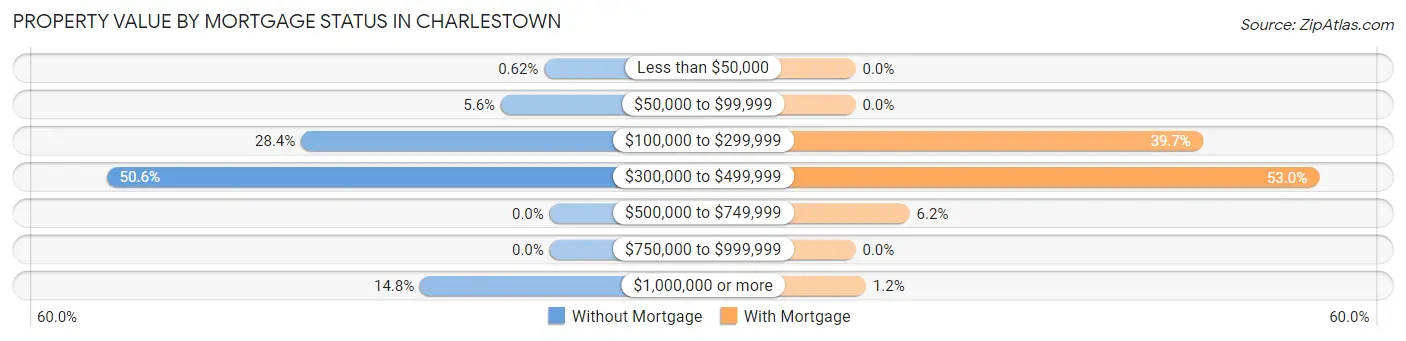
| Property Value | Without Mortgage | With Mortgage |
| Less than $50,000 | 1 (0.6%) | 0 (0.0%) |
| $50,000 to $99,999 | 9 (5.6%) | 0 (0.0%) |
| $100,000 to $299,999 | 46 (28.4%) | 167 (39.7%) |
| $300,000 to $499,999 | 82 (50.6%) | 223 (53.0%) |
| $500,000 to $749,999 | 0 (0.0%) | 26 (6.2%) |
| $750,000 to $999,999 | 0 (0.0%) | 0 (0.0%) |
| $1,000,000 or more | 24 (14.8%) | 5 (1.2%) |
| Total | 162 (100.0%) | 421 (100.0%) |
Household Income by Mortgage Status in Charlestown
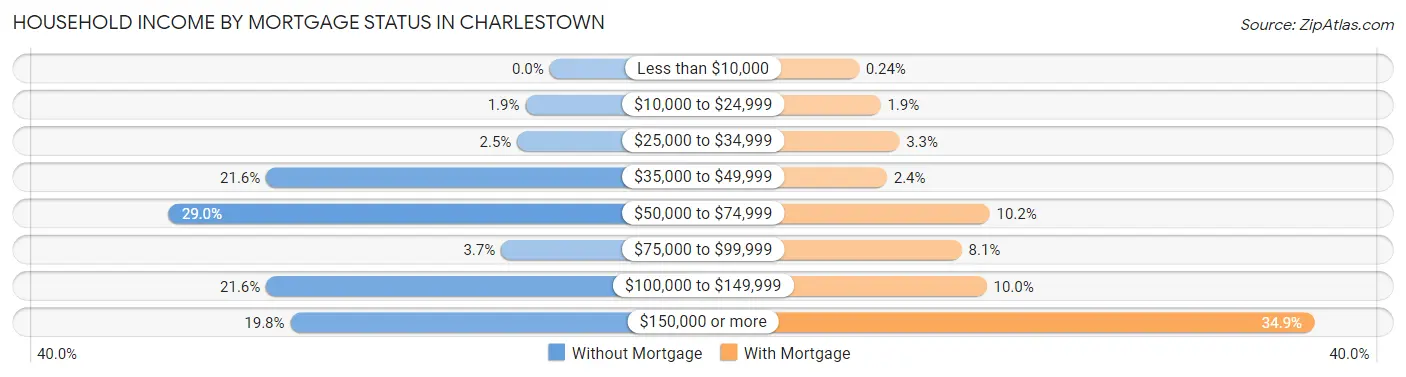
| Household Income | Without Mortgage | With Mortgage |
| Less than $10,000 | 0 (0.0%) | 1 (0.2%) |
| $10,000 to $24,999 | 3 (1.8%) | 8 (1.9%) |
| $25,000 to $34,999 | 4 (2.5%) | 14 (3.3%) |
| $35,000 to $49,999 | 35 (21.6%) | 10 (2.4%) |
| $50,000 to $74,999 | 47 (29.0%) | 43 (10.2%) |
| $75,000 to $99,999 | 6 (3.7%) | 34 (8.1%) |
| $100,000 to $149,999 | 35 (21.6%) | 42 (10.0%) |
| $150,000 or more | 32 (19.8%) | 147 (34.9%) |
| Total | 162 (100.0%) | 421 (100.0%) |
Property Value to Household Income Ratio in Charlestown
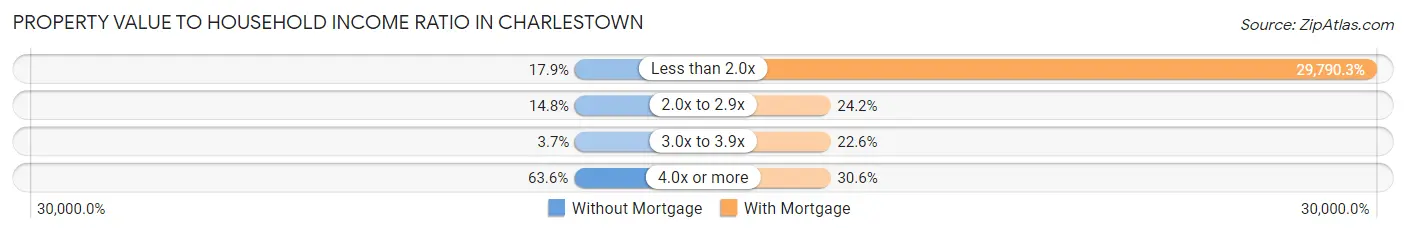
| Value-to-Income Ratio | Without Mortgage | With Mortgage |
| Less than 2.0x | 29 (17.9%) | 125,417 (29,790.3%) |
| 2.0x to 2.9x | 24 (14.8%) | 102 (24.2%) |
| 3.0x to 3.9x | 6 (3.7%) | 95 (22.6%) |
| 4.0x or more | 103 (63.6%) | 129 (30.6%) |
| Total | 162 (100.0%) | 421 (100.0%) |
Real Estate Taxes by Mortgage Status in Charlestown
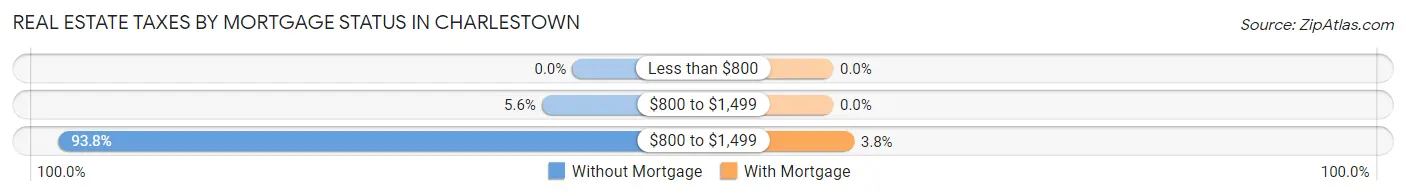
| Property Taxes | Without Mortgage | With Mortgage |
| Less than $800 | 0 (0.0%) | 0 (0.0%) |
| $800 to $1,499 | 9 (5.6%) | 0 (0.0%) |
| $800 to $1,499 | 152 (93.8%) | 16 (3.8%) |
| Total | 162 (100.0%) | 421 (100.0%) |
Health & Disability in Charlestown
Health Insurance Coverage by Age in Charlestown
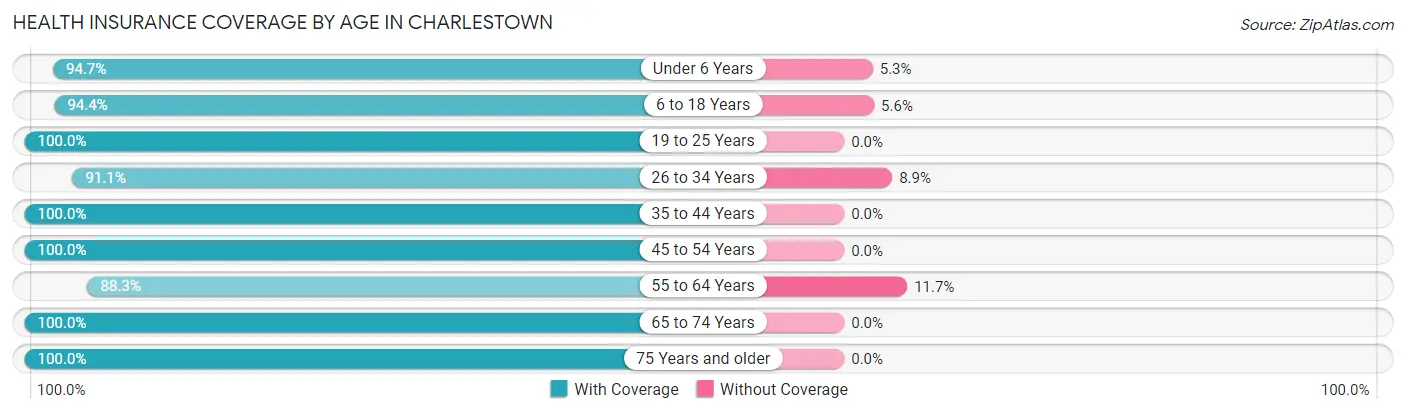
| Age Bracket | With Coverage | Without Coverage |
| Under 6 Years | 232 (94.7%) | 13 (5.3%) |
| 6 to 18 Years | 424 (94.4%) | 25 (5.6%) |
| 19 to 25 Years | 45 (100.0%) | 0 (0.0%) |
| 26 to 34 Years | 224 (91.1%) | 22 (8.9%) |
| 35 to 44 Years | 354 (100.0%) | 0 (0.0%) |
| 45 to 54 Years | 219 (100.0%) | 0 (0.0%) |
| 55 to 64 Years | 143 (88.3%) | 19 (11.7%) |
| 65 to 74 Years | 141 (100.0%) | 0 (0.0%) |
| 75 Years and older | 172 (100.0%) | 0 (0.0%) |
| Total | 1,954 (96.1%) | 79 (3.9%) |
Health Insurance Coverage by Citizenship Status in Charlestown
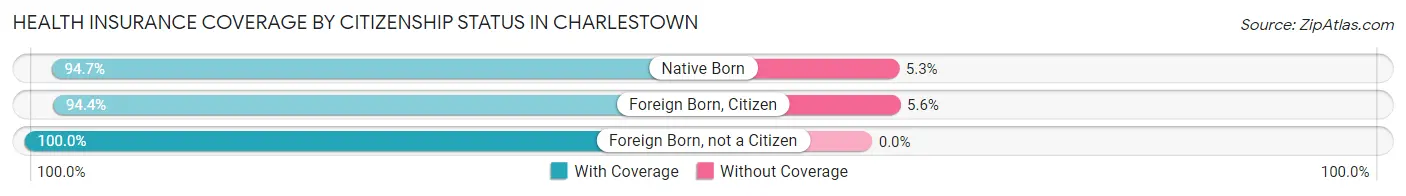
| Citizenship Status | With Coverage | Without Coverage |
| Native Born | 232 (94.7%) | 13 (5.3%) |
| Foreign Born, Citizen | 424 (94.4%) | 25 (5.6%) |
| Foreign Born, not a Citizen | 45 (100.0%) | 0 (0.0%) |
Health Insurance Coverage by Household Income in Charlestown
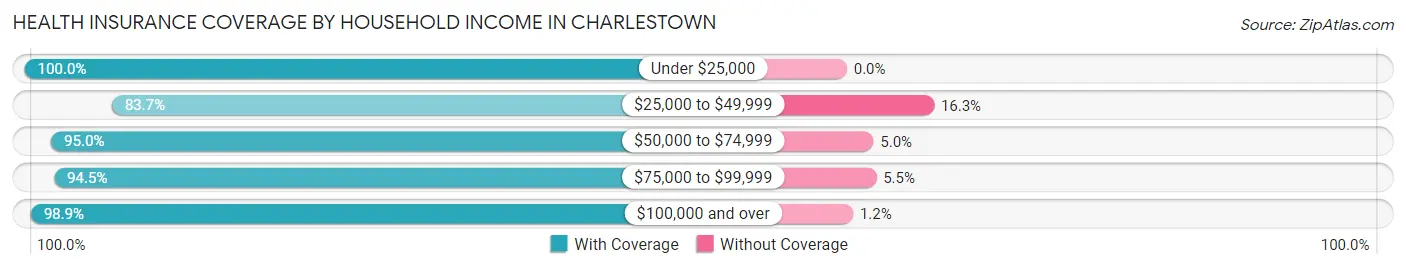
| Household Income | With Coverage | Without Coverage |
| Under $25,000 | 99 (100.0%) | 0 (0.0%) |
| $25,000 to $49,999 | 210 (83.7%) | 41 (16.3%) |
| $50,000 to $74,999 | 210 (95.0%) | 11 (5.0%) |
| $75,000 to $99,999 | 223 (94.5%) | 13 (5.5%) |
| $100,000 and over | 1,204 (98.9%) | 14 (1.1%) |
Public vs Private Health Insurance Coverage by Age in Charlestown
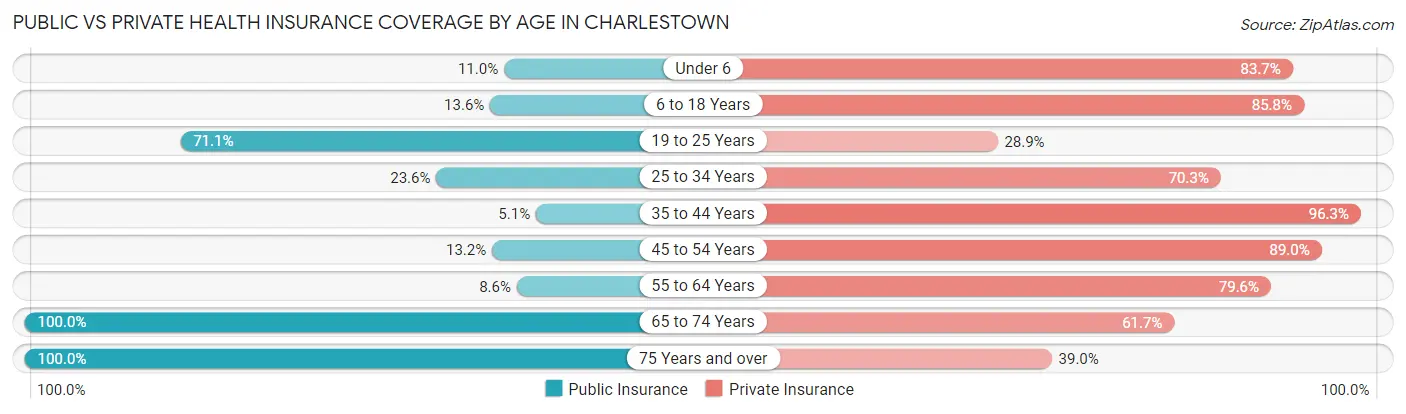
| Age Bracket | Public Insurance | Private Insurance |
| Under 6 | 27 (11.0%) | 205 (83.7%) |
| 6 to 18 Years | 61 (13.6%) | 385 (85.8%) |
| 19 to 25 Years | 32 (71.1%) | 13 (28.9%) |
| 25 to 34 Years | 58 (23.6%) | 173 (70.3%) |
| 35 to 44 Years | 18 (5.1%) | 341 (96.3%) |
| 45 to 54 Years | 29 (13.2%) | 195 (89.0%) |
| 55 to 64 Years | 14 (8.6%) | 129 (79.6%) |
| 65 to 74 Years | 141 (100.0%) | 87 (61.7%) |
| 75 Years and over | 172 (100.0%) | 67 (39.0%) |
| Total | 552 (27.2%) | 1,595 (78.5%) |
Disability Status by Sex by Age in Charlestown
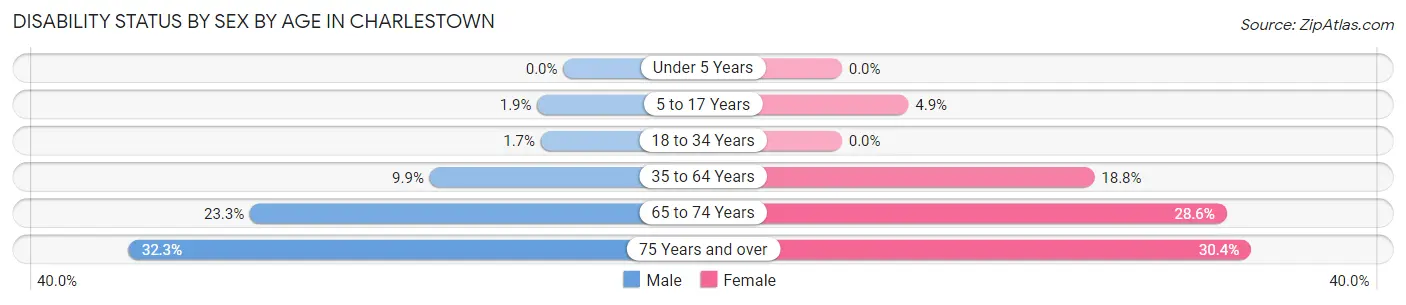
| Age Bracket | Male | Female |
| Under 5 Years | 0 (0.0%) | 0 (0.0%) |
| 5 to 17 Years | 5 (1.9%) | 13 (4.9%) |
| 18 to 34 Years | 2 (1.7%) | 0 (0.0%) |
| 35 to 64 Years | 38 (9.9%) | 66 (18.8%) |
| 65 to 74 Years | 10 (23.3%) | 28 (28.6%) |
| 75 Years and over | 30 (32.3%) | 24 (30.4%) |
Disability Class by Sex by Age in Charlestown
Disability Class: Hearing Difficulty
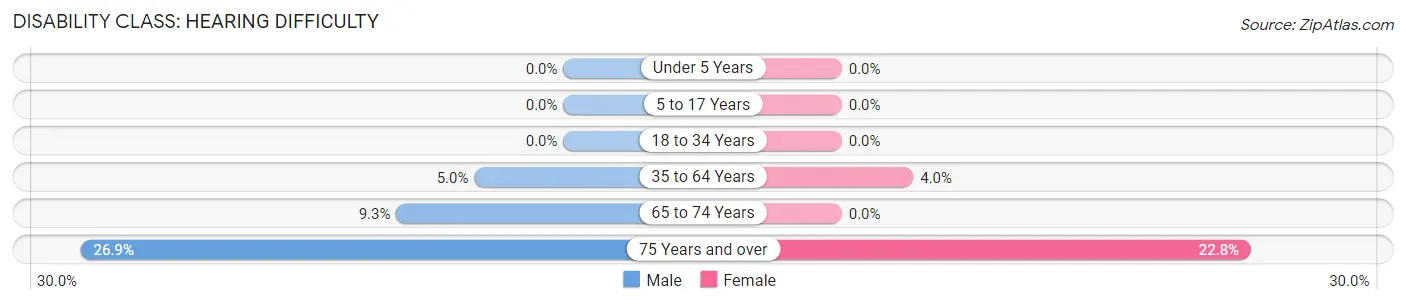
| Age Bracket | Male | Female |
| Under 5 Years | 0 (0.0%) | 0 (0.0%) |
| 5 to 17 Years | 0 (0.0%) | 0 (0.0%) |
| 18 to 34 Years | 0 (0.0%) | 0 (0.0%) |
| 35 to 64 Years | 19 (5.0%) | 14 (4.0%) |
| 65 to 74 Years | 4 (9.3%) | 0 (0.0%) |
| 75 Years and over | 25 (26.9%) | 18 (22.8%) |
Disability Class: Vision Difficulty
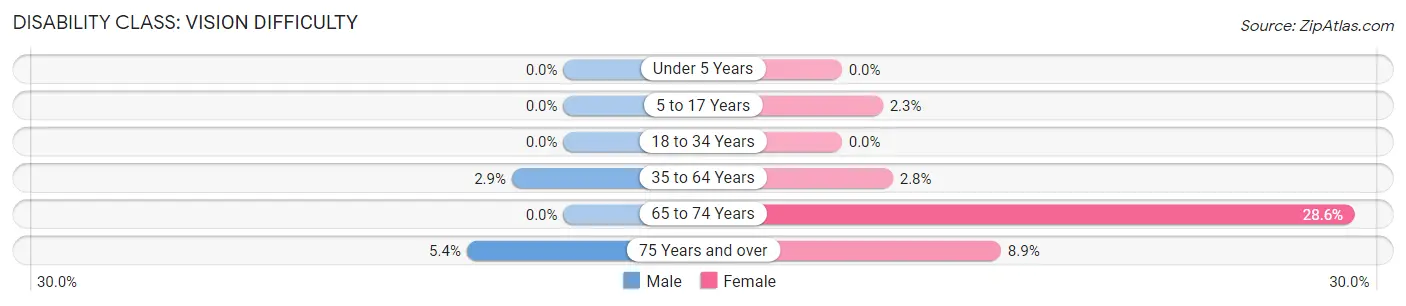
| Age Bracket | Male | Female |
| Under 5 Years | 0 (0.0%) | 0 (0.0%) |
| 5 to 17 Years | 0 (0.0%) | 6 (2.3%) |
| 18 to 34 Years | 0 (0.0%) | 0 (0.0%) |
| 35 to 64 Years | 11 (2.9%) | 10 (2.8%) |
| 65 to 74 Years | 0 (0.0%) | 28 (28.6%) |
| 75 Years and over | 5 (5.4%) | 7 (8.9%) |
Disability Class: Cognitive Difficulty
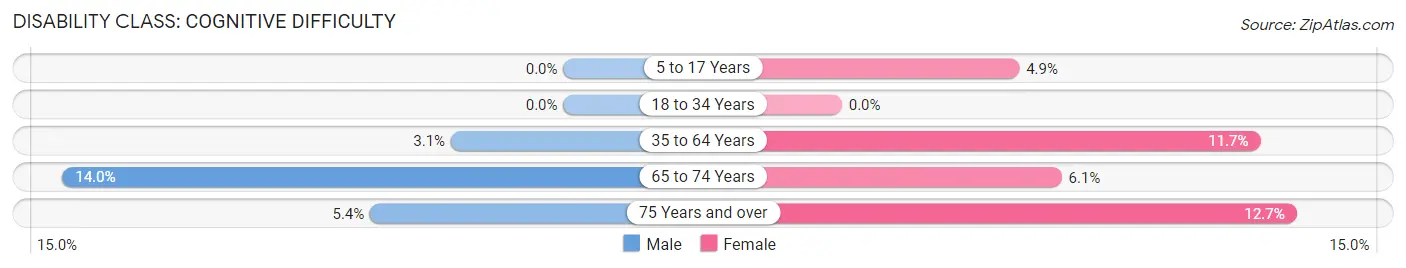
| Age Bracket | Male | Female |
| 5 to 17 Years | 0 (0.0%) | 13 (4.9%) |
| 18 to 34 Years | 0 (0.0%) | 0 (0.0%) |
| 35 to 64 Years | 12 (3.1%) | 41 (11.7%) |
| 65 to 74 Years | 6 (14.0%) | 6 (6.1%) |
| 75 Years and over | 5 (5.4%) | 10 (12.7%) |
Disability Class: Ambulatory Difficulty
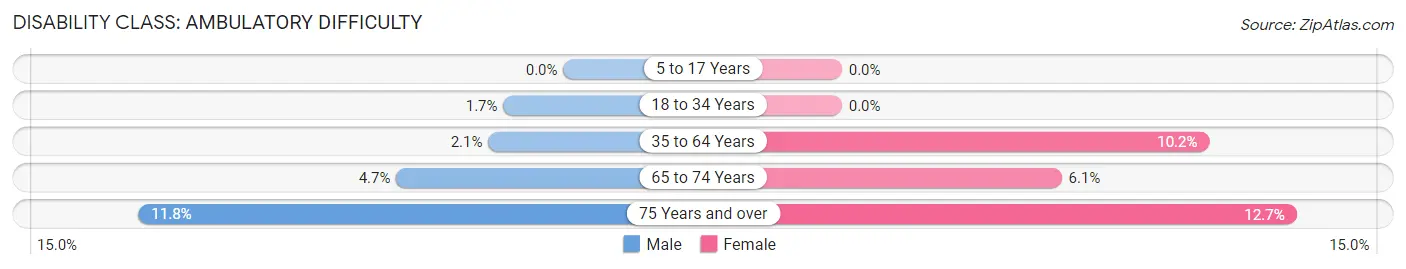
| Age Bracket | Male | Female |
| 5 to 17 Years | 0 (0.0%) | 0 (0.0%) |
| 18 to 34 Years | 2 (1.7%) | 0 (0.0%) |
| 35 to 64 Years | 8 (2.1%) | 36 (10.2%) |
| 65 to 74 Years | 2 (4.6%) | 6 (6.1%) |
| 75 Years and over | 11 (11.8%) | 10 (12.7%) |
Disability Class: Self-Care Difficulty
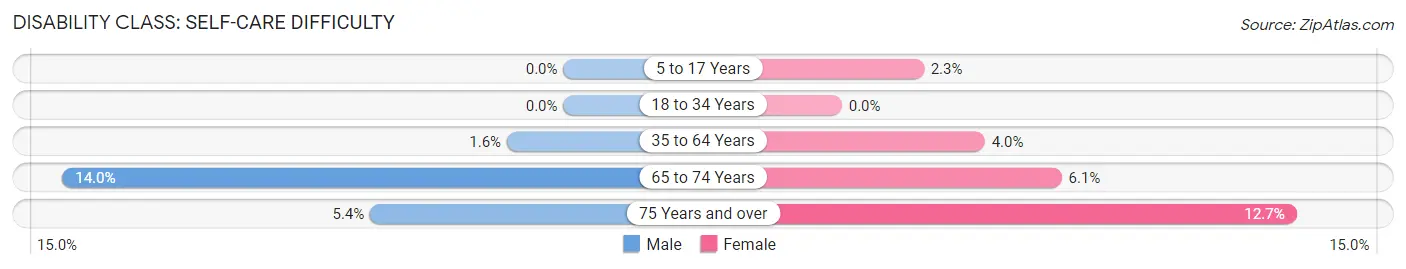
| Age Bracket | Male | Female |
| 5 to 17 Years | 0 (0.0%) | 6 (2.3%) |
| 18 to 34 Years | 0 (0.0%) | 0 (0.0%) |
| 35 to 64 Years | 6 (1.6%) | 14 (4.0%) |
| 65 to 74 Years | 6 (14.0%) | 6 (6.1%) |
| 75 Years and over | 5 (5.4%) | 10 (12.7%) |
Technology Access in Charlestown
Computing Device Access in Charlestown
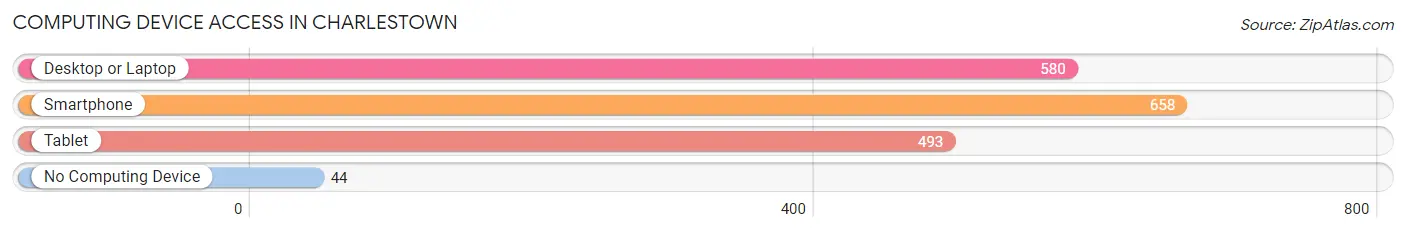
| Device Type | # Households | % Households |
| Desktop or Laptop | 580 | 78.7% |
| Smartphone | 658 | 89.3% |
| Tablet | 493 | 66.9% |
| No Computing Device | 44 | 6.0% |
| Total | 737 | 100.0% |
Internet Access in Charlestown
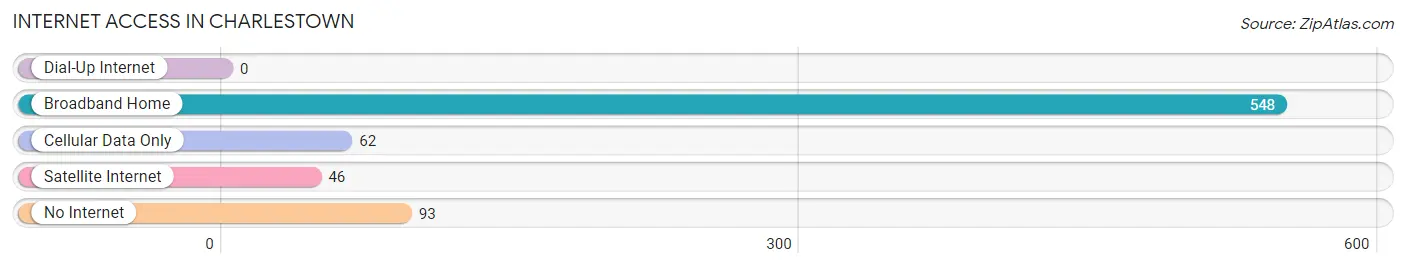
| Internet Type | # Households | % Households |
| Dial-Up Internet | 0 | 0.0% |
| Broadband Home | 548 | 74.4% |
| Cellular Data Only | 62 | 8.4% |
| Satellite Internet | 46 | 6.2% |
| No Internet | 93 | 12.6% |
| Total | 737 | 100.0% |
Charlestown Summary
Charlestown, Maryland is a small town located in Cecil County, Maryland. It is situated on the banks of the Susquehanna River, about 25 miles northeast of Baltimore. The town was founded in 1742 and is one of the oldest towns in Maryland. It is home to a population of about 1,500 people and is a popular tourist destination due to its historic charm and proximity to the Chesapeake Bay.
History
Charlestown was founded in 1742 by Charles Carroll, a wealthy landowner and politician. He named the town after himself and it quickly became a thriving port town. The town was a major trading center for tobacco, grain, and other goods. It was also a popular destination for travelers and immigrants.
In 1776, the town was the site of a major battle between the British and American forces during the Revolutionary War. The British were defeated and the town was spared from destruction.
In the 19th century, the town experienced a period of growth and prosperity. It became a popular destination for tourists and was home to several large businesses. The town was also home to a number of prominent citizens, including the famous abolitionist Frederick Douglass.
Geography
Charlestown is located in Cecil County, Maryland. It is situated on the banks of the Susquehanna River, about 25 miles northeast of Baltimore. The town is surrounded by rolling hills and farmland. The climate is humid and subtropical, with hot summers and mild winters.
Economy
Charlestown’s economy is largely based on tourism and agriculture. The town is home to several small businesses, including restaurants, shops, and galleries. It is also home to a number of historic sites, including the Charlestown State Park and the Charlestown Race Track.
The town is also home to a number of manufacturing companies, including a paper mill and a furniture factory. The town is also home to a number of government offices, including the Cecil County Courthouse.
Demographics
As of the 2010 census, the population of Charlestown was 1,500. The racial makeup of the town was 94.2% White, 2.7% African American, 0.7% Native American, 0.3% Asian, and 2.1% from other races. The median household income was $45,000 and the median age was 40.
Conclusion
Charlestown, Maryland is a small town with a rich history and a vibrant economy. It is home to a diverse population and is a popular tourist destination due to its historic charm and proximity to the Chesapeake Bay. The town is home to a number of businesses, government offices, and historic sites, making it an ideal place to live and work.
Common Questions
What is Per Capita Income in Charlestown?
Per Capita income in Charlestown is $37,733.
What is the Median Family Income in Charlestown?
Median Family Income in Charlestown is $130,294.
What is the Median Household income in Charlestown?
Median Household Income in Charlestown is $103,098.
What is Income or Wage Gap in Charlestown?
Income or Wage Gap in Charlestown is 20.3%.
Women in Charlestown earn 79.7 cents for every dollar earned by a man.
What is Inequality or Gini Index in Charlestown?
Inequality or Gini Index in Charlestown is 0.33.
What is the Total Population of Charlestown?
Total Population of Charlestown is 2,050.
What is the Total Male Population of Charlestown?
Total Male Population of Charlestown is 1,003.
What is the Total Female Population of Charlestown?
Total Female Population of Charlestown is 1,047.
What is the Ratio of Males per 100 Females in Charlestown?
There are 95.80 Males per 100 Females in Charlestown.
What is the Ratio of Females per 100 Males in Charlestown?
There are 104.39 Females per 100 Males in Charlestown.
What is the Median Population Age in Charlestown?
Median Population Age in Charlestown is 35.3 Years.
What is the Average Family Size in Charlestown
Average Family Size in Charlestown is 3.2 People.
What is the Average Household Size in Charlestown
Average Household Size in Charlestown is 2.8 People.
How Large is the Labor Force in Charlestown?
There are 900 People in the Labor Forcein in Charlestown.
What is the Percentage of People in the Labor Force in Charlestown?
62.6% of People are in the Labor Force in Charlestown.
What is the Unemployment Rate in Charlestown?
Unemployment Rate in Charlestown is 3.2%.