Rawlings, MD Map & Demographics
Rawlings Map
Rawlings Overview
$22,980
PER CAPITA INCOME
$84,211
AVG FAMILY INCOME
$32,679
AVG HOUSEHOLD INCOME
0.48
INEQUALITY / GINI INDEX
438
TOTAL POPULATION
212
MALE POPULATION
226
FEMALE POPULATION
93.81
MALES / 100 FEMALES
106.60
FEMALES / 100 MALES
33.7
MEDIAN AGE
3.6
AVG FAMILY SIZE
2.3
AVG HOUSEHOLD SIZE
161
LABOR FORCE [ PEOPLE ]
49.1%
PERCENT IN LABOR FORCE
Rawlings Zip Codes
Rawlings Area Codes
Income in Rawlings
Income Overview in Rawlings
Per Capita Income in Rawlings is $22,980, while median incomes of families and households are $84,211 and $32,679 respectively.
| Characteristic | Number | Measure |
| Per Capita Income | 438 | $22,980 |
| Median Family Income | 96 | $84,211 |
| Mean Family Income | 96 | $86,916 |
| Median Household Income | 187 | $32,679 |
| Mean Household Income | 187 | $53,406 |
| Income Deficit | 96 | $0 |
| Wage / Income Gap (%) | 438 | 0.00% |
| Wage / Income Gap ($) | 438 | 100.00¢ per $1 |
| Gini / Inequality Index | 438 | 0.48 |
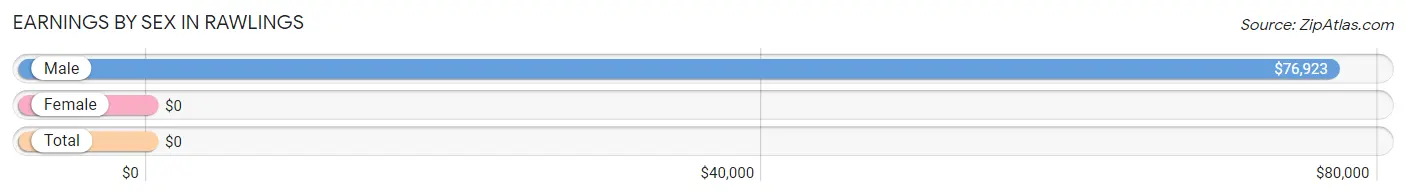
Earnings by Sex in Rawlings
| Sex | Number | Average Earnings |
| Male | 92 (57.1%) | $76,923 |
| Female | 69 (42.9%) | $0 |
| Total | 161 (100.0%) | $0 |
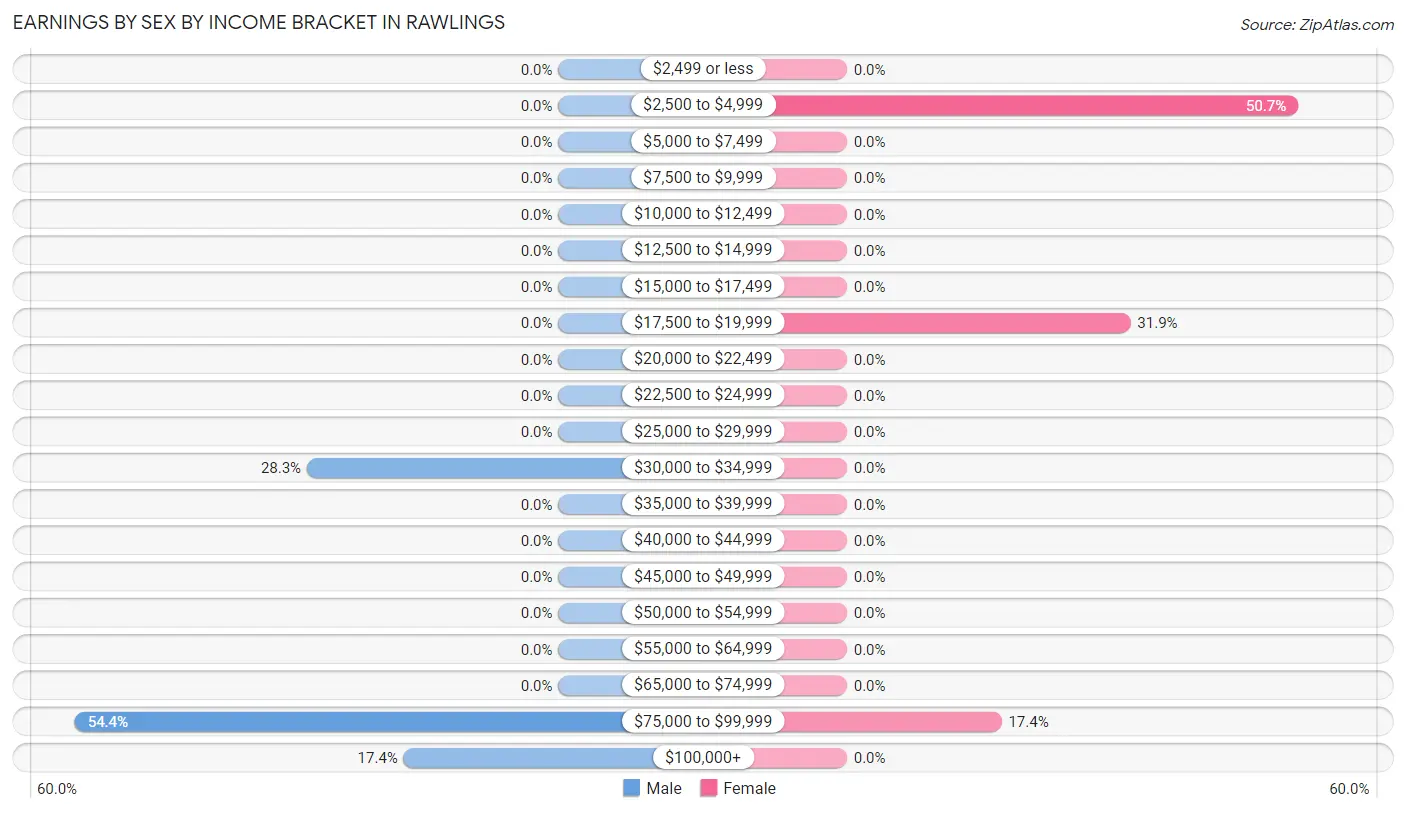
Earnings by Sex by Income Bracket in Rawlings
The most common earnings brackets in Rawlings are $75,000 to $99,999 for men (50 | 54.3%) and $2,500 to $4,999 for women (35 | 50.7%).
| Income | Male | Female |
| $2,499 or less | 0 (0.0%) | 0 (0.0%) |
| $2,500 to $4,999 | 0 (0.0%) | 35 (50.7%) |
| $5,000 to $7,499 | 0 (0.0%) | 0 (0.0%) |
| $7,500 to $9,999 | 0 (0.0%) | 0 (0.0%) |
| $10,000 to $12,499 | 0 (0.0%) | 0 (0.0%) |
| $12,500 to $14,999 | 0 (0.0%) | 0 (0.0%) |
| $15,000 to $17,499 | 0 (0.0%) | 0 (0.0%) |
| $17,500 to $19,999 | 0 (0.0%) | 22 (31.9%) |
| $20,000 to $22,499 | 0 (0.0%) | 0 (0.0%) |
| $22,500 to $24,999 | 0 (0.0%) | 0 (0.0%) |
| $25,000 to $29,999 | 0 (0.0%) | 0 (0.0%) |
| $30,000 to $34,999 | 26 (28.3%) | 0 (0.0%) |
| $35,000 to $39,999 | 0 (0.0%) | 0 (0.0%) |
| $40,000 to $44,999 | 0 (0.0%) | 0 (0.0%) |
| $45,000 to $49,999 | 0 (0.0%) | 0 (0.0%) |
| $50,000 to $54,999 | 0 (0.0%) | 0 (0.0%) |
| $55,000 to $64,999 | 0 (0.0%) | 0 (0.0%) |
| $65,000 to $74,999 | 0 (0.0%) | 0 (0.0%) |
| $75,000 to $99,999 | 50 (54.3%) | 12 (17.4%) |
| $100,000+ | 16 (17.4%) | 0 (0.0%) |
| Total | 92 (100.0%) | 69 (100.0%) |
Earnings by Sex by Educational Attainment in Rawlings
| Educational Attainment | Male Income | Female Income |
| Less than High School | - | - |
| High School Diploma | - | - |
| College or Associate's Degree | - | - |
| Bachelor's Degree | - | - |
| Graduate Degree | - | - |
| Total | $76,923 | $0 |
Family Income in Rawlings
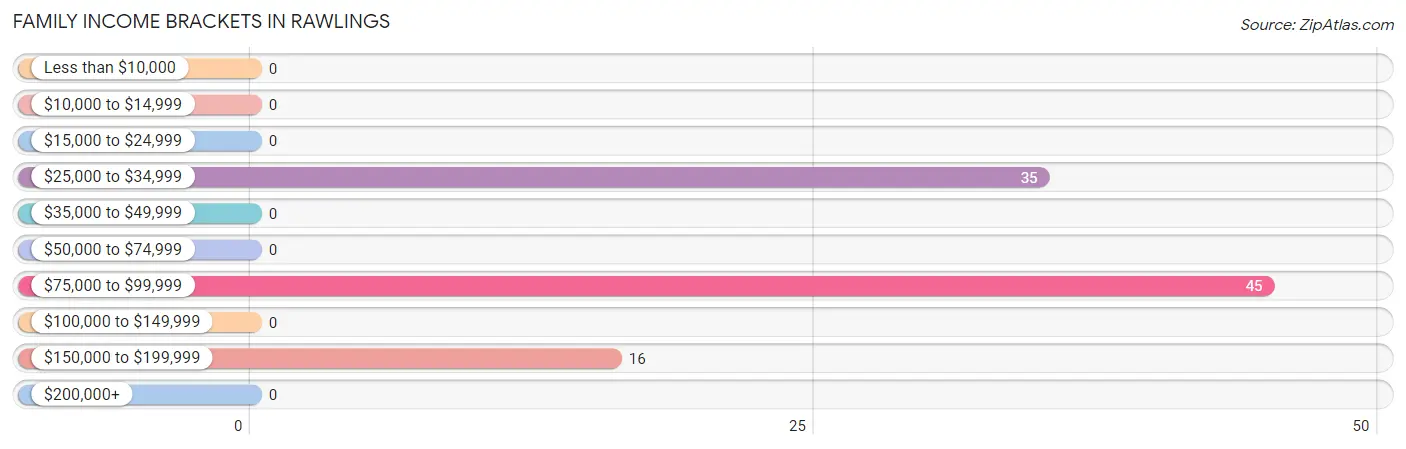
Family Income Brackets in Rawlings
According to the Rawlings family income data, there are 45 families falling into the $75,000 to $99,999 income range, which is the most common income bracket and makes up 46.9% of all families.
| Income Bracket | # Families | % Families |
| Less than $10,000 | 0 | 0.0% |
| $10,000 to $14,999 | 0 | 0.0% |
| $15,000 to $24,999 | 0 | 0.0% |
| $25,000 to $34,999 | 35 | 36.5% |
| $35,000 to $49,999 | 0 | 0.0% |
| $50,000 to $74,999 | 0 | 0.0% |
| $75,000 to $99,999 | 45 | 46.9% |
| $100,000 to $149,999 | 0 | 0.0% |
| $150,000 to $199,999 | 16 | 16.7% |
| $200,000+ | 0 | 0.0% |
Family Income by Famaliy Size in Rawlings
| Income Bracket | # Families | Median Income |
| 2-Person Families | 12 (12.5%) | $0 |
| 3-Person Families | 39 (40.6%) | $0 |
| 4-Person Families | 19 (19.8%) | $0 |
| 5-Person Families | 26 (27.1%) | $0 |
| 6-Person Families | 0 (0.0%) | $0 |
| 7+ Person Families | 0 (0.0%) | $0 |
| Total | 96 (100.0%) | $84,211 |
Family Income by Number of Earners in Rawlings
| Number of Earners | # Families | Median Income |
| No Earners | 12 (12.5%) | $0 |
| 1 Earner | 23 (24.0%) | $0 |
| 2 Earners | 45 (46.9%) | $0 |
| 3+ Earners | 16 (16.7%) | $0 |
| Total | 96 (100.0%) | $84,211 |
Household Income in Rawlings
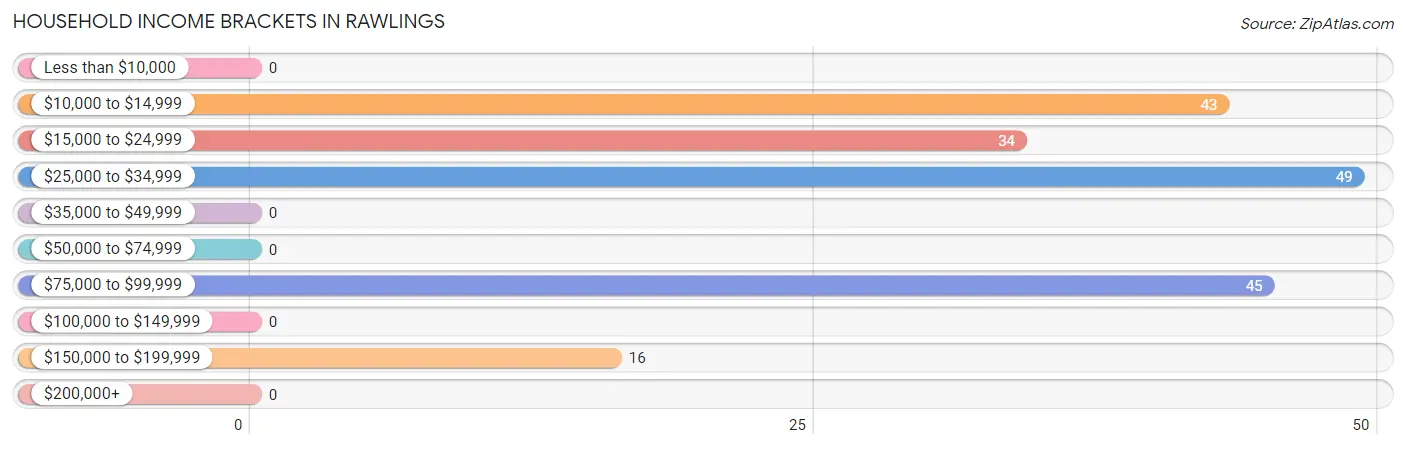
Household Income Brackets in Rawlings
With 49 households falling in the category, the $25,000 to $34,999 income range is the most frequent in Rawlings, accounting for 26.2% of all households.
| Income Bracket | # Households | % Households |
| Less than $10,000 | 0 | 0.0% |
| $10,000 to $14,999 | 43 | 23.0% |
| $15,000 to $24,999 | 34 | 18.2% |
| $25,000 to $34,999 | 49 | 26.2% |
| $35,000 to $49,999 | 0 | 0.0% |
| $50,000 to $74,999 | 0 | 0.0% |
| $75,000 to $99,999 | 45 | 24.1% |
| $100,000 to $149,999 | 0 | 0.0% |
| $150,000 to $199,999 | 16 | 8.6% |
| $200,000+ | 0 | 0.0% |
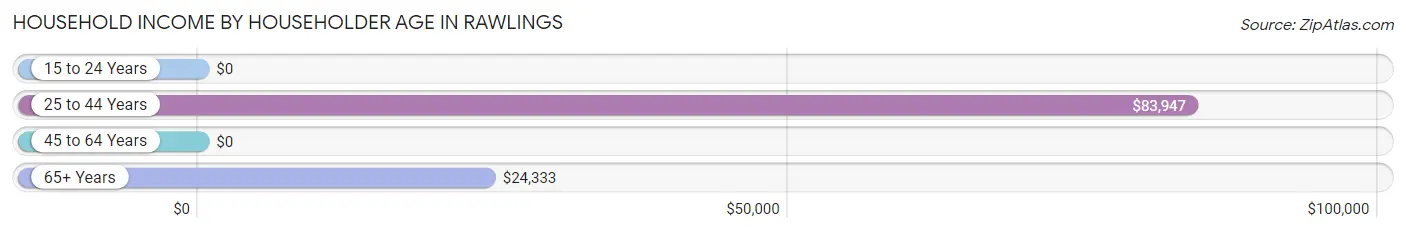
Household Income by Householder Age in Rawlings
The median household income in Rawlings is $32,679, with the highest median household income of $83,947 found in the 25 to 44 years age bracket for the primary householder. A total of 68 households (36.4%) fall into this category.
| Income Bracket | # Households | Median Income |
| 15 to 24 Years | 0 (0.0%) | $0 |
| 25 to 44 Years | 68 (36.4%) | $83,947 |
| 45 to 64 Years | 59 (31.6%) | $0 |
| 65+ Years | 60 (32.1%) | $24,333 |
| Total | 187 (100.0%) | $32,679 |
Poverty in Rawlings
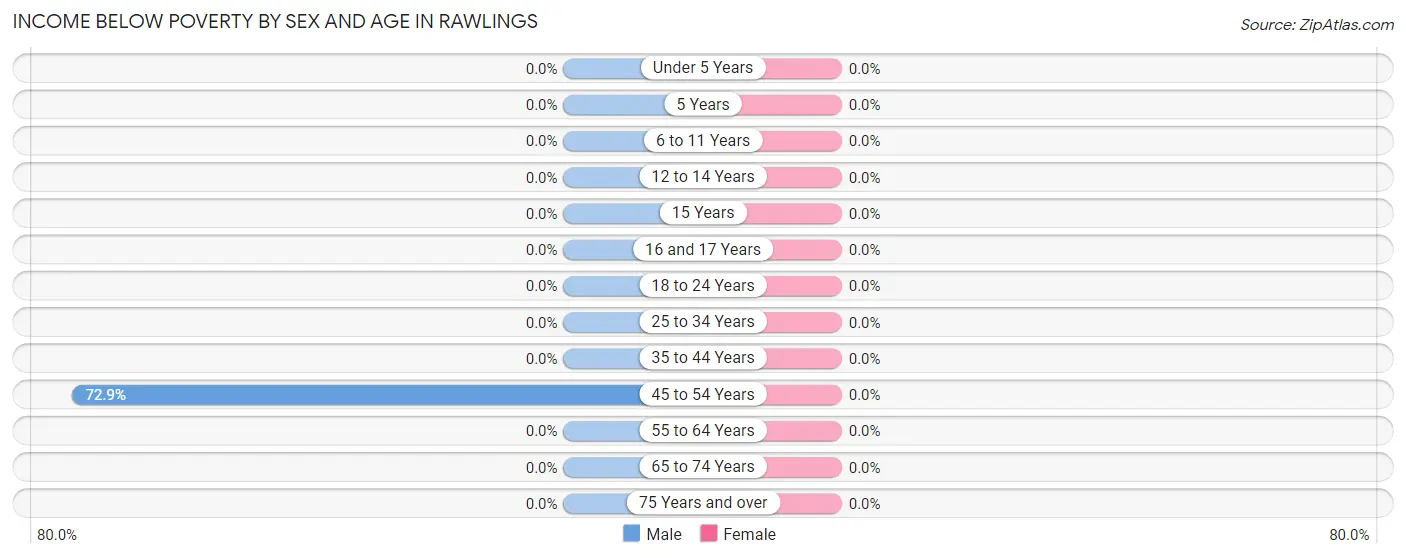
Income Below Poverty by Sex and Age in Rawlings
| Age Bracket | Male | Female |
| Under 5 Years | 0 (0.0%) | 0 (0.0%) |
| 5 Years | 0 (0.0%) | 0 (0.0%) |
| 6 to 11 Years | 0 (0.0%) | 0 (0.0%) |
| 12 to 14 Years | 0 (0.0%) | 0 (0.0%) |
| 15 Years | 0 (0.0%) | 0 (0.0%) |
| 16 and 17 Years | 0 (0.0%) | 0 (0.0%) |
| 18 to 24 Years | 0 (0.0%) | 0 (0.0%) |
| 25 to 34 Years | 0 (0.0%) | 0 (0.0%) |
| 35 to 44 Years | 0 (0.0%) | 0 (0.0%) |
| 45 to 54 Years | 43 (72.9%) | 0 (0.0%) |
| 55 to 64 Years | 0 (0.0%) | 0 (0.0%) |
| 65 to 74 Years | 0 (0.0%) | 0 (0.0%) |
| 75 Years and over | 0 (0.0%) | 0 (0.0%) |
| Total | 43 (20.3%) | 0 (0.0%) |
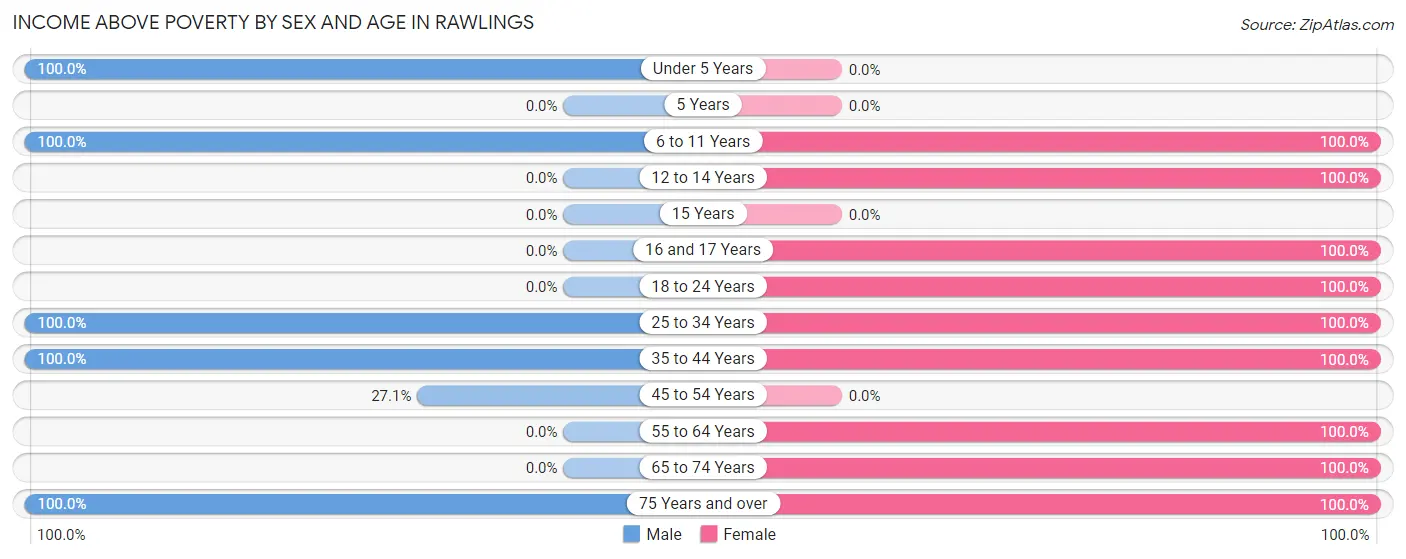
Income Above Poverty by Sex and Age in Rawlings
According to the poverty statistics in Rawlings, males aged under 5 years and females aged 6 to 11 years are the age groups that are most secure financially, with 100.0% of males and 100.0% of females in these age groups living above the poverty line.
| Age Bracket | Male | Female |
| Under 5 Years | 18 (100.0%) | 0 (0.0%) |
| 5 Years | 0 (0.0%) | 0 (0.0%) |
| 6 to 11 Years | 28 (100.0%) | 21 (100.0%) |
| 12 to 14 Years | 0 (0.0%) | 43 (100.0%) |
| 15 Years | 0 (0.0%) | 0 (0.0%) |
| 16 and 17 Years | 0 (0.0%) | 29 (100.0%) |
| 18 to 24 Years | 0 (0.0%) | 16 (100.0%) |
| 25 to 34 Years | 26 (100.0%) | 45 (100.0%) |
| 35 to 44 Years | 50 (100.0%) | 19 (100.0%) |
| 45 to 54 Years | 16 (27.1%) | 0 (0.0%) |
| 55 to 64 Years | 0 (0.0%) | 12 (100.0%) |
| 65 to 74 Years | 0 (0.0%) | 15 (100.0%) |
| 75 Years and over | 31 (100.0%) | 26 (100.0%) |
| Total | 169 (79.7%) | 226 (100.0%) |
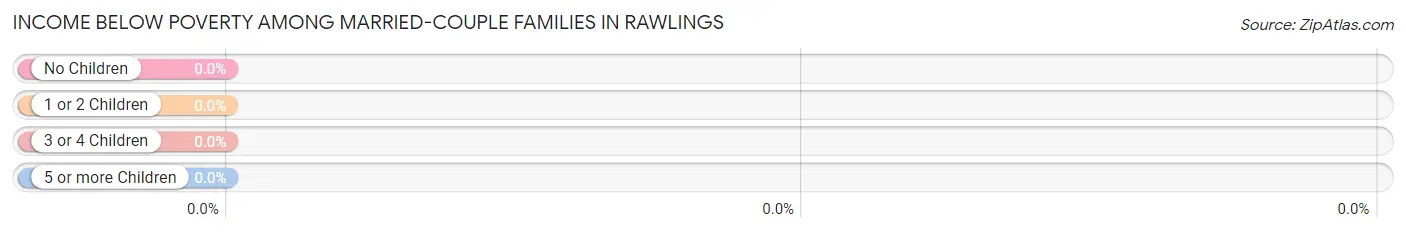
Income Below Poverty Among Married-Couple Families in Rawlings
| Children | Above Poverty | Below Poverty |
| No Children | 28 (100.0%) | 0 (0.0%) |
| 1 or 2 Children | 42 (100.0%) | 0 (0.0%) |
| 3 or 4 Children | 26 (100.0%) | 0 (0.0%) |
| 5 or more Children | 0 (0.0%) | 0 (0.0%) |
| Total | 96 (100.0%) | 0 (0.0%) |
Income Below Poverty Among Single-Parent Households in Rawlings
| Children | Single Father | Single Mother |
| No Children | 0 (0.0%) | 0 (0.0%) |
| 1 or 2 Children | 0 (0.0%) | 0 (0.0%) |
| 3 or 4 Children | 0 (0.0%) | 0 (0.0%) |
| 5 or more Children | 0 (0.0%) | 0 (0.0%) |
| Total | 0 (0.0%) | 0 (0.0%) |
Income Below Poverty Among Married-Couple vs Single-Parent Households in Rawlings
| Children | Married-Couple Families | Single-Parent Households |
| No Children | 0 (0.0%) | 0 (0.0%) |
| 1 or 2 Children | 0 (0.0%) | 0 (0.0%) |
| 3 or 4 Children | 0 (0.0%) | 0 (0.0%) |
| 5 or more Children | 0 (0.0%) | 0 (0.0%) |
| Total | 0 (0.0%) | 0 (0.0%) |
Race in Rawlings
The most populous races in Rawlings are , and White / Caucasian (438 | 100.0%).
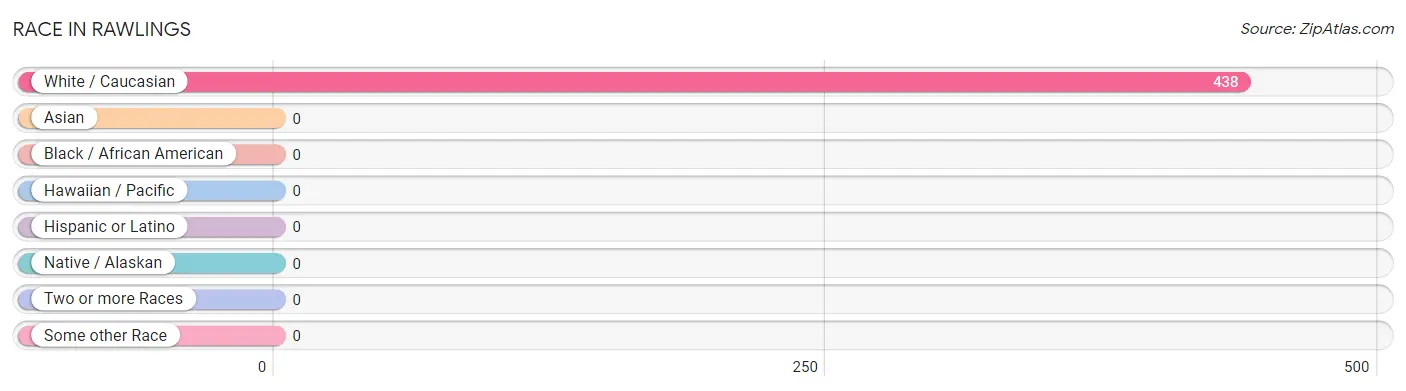
| Race | # Population | % Population |
| Asian | 0 | 0.0% |
| Black / African American | 0 | 0.0% |
| Hawaiian / Pacific | 0 | 0.0% |
| Hispanic or Latino | 0 | 0.0% |
| Native / Alaskan | 0 | 0.0% |
| White / Caucasian | 438 | 100.0% |
| Two or more Races | 0 | 0.0% |
| Some other Race | 0 | 0.0% |
| Total | 438 | 100.0% |
Ancestry in Rawlings
The most populous ancestries reported in Rawlings are American (157 | 35.8%), German (86 | 19.6%), and Scottish (16 | 3.6%), together accounting for 59.1% of all Rawlings residents.
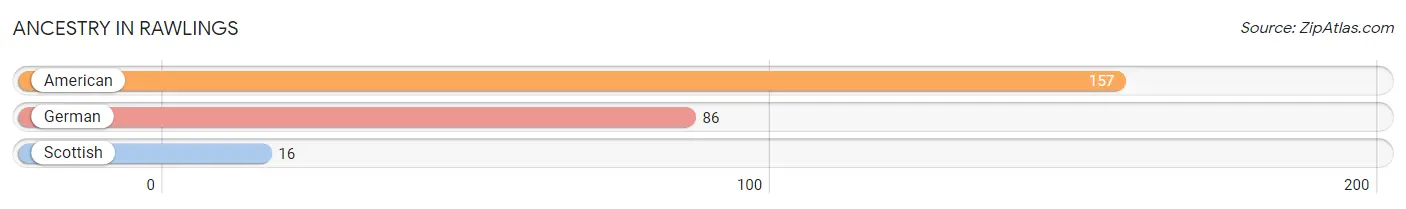
| Ancestry | # Population | % Population |
| American | 157 | 35.8% |
| German | 86 | 19.6% |
| Scottish | 16 | 3.6% | View All 3 Rows |
Immigrants in Rawlings

| Immigration Origin | # Population | % Population | View All 0 Rows |
Sex and Age in Rawlings
Sex and Age in Rawlings
The most populous age groups in Rawlings are 40 to 44 Years (50 | 23.6%) for men and 30 to 34 Years (45 | 19.9%) for women.
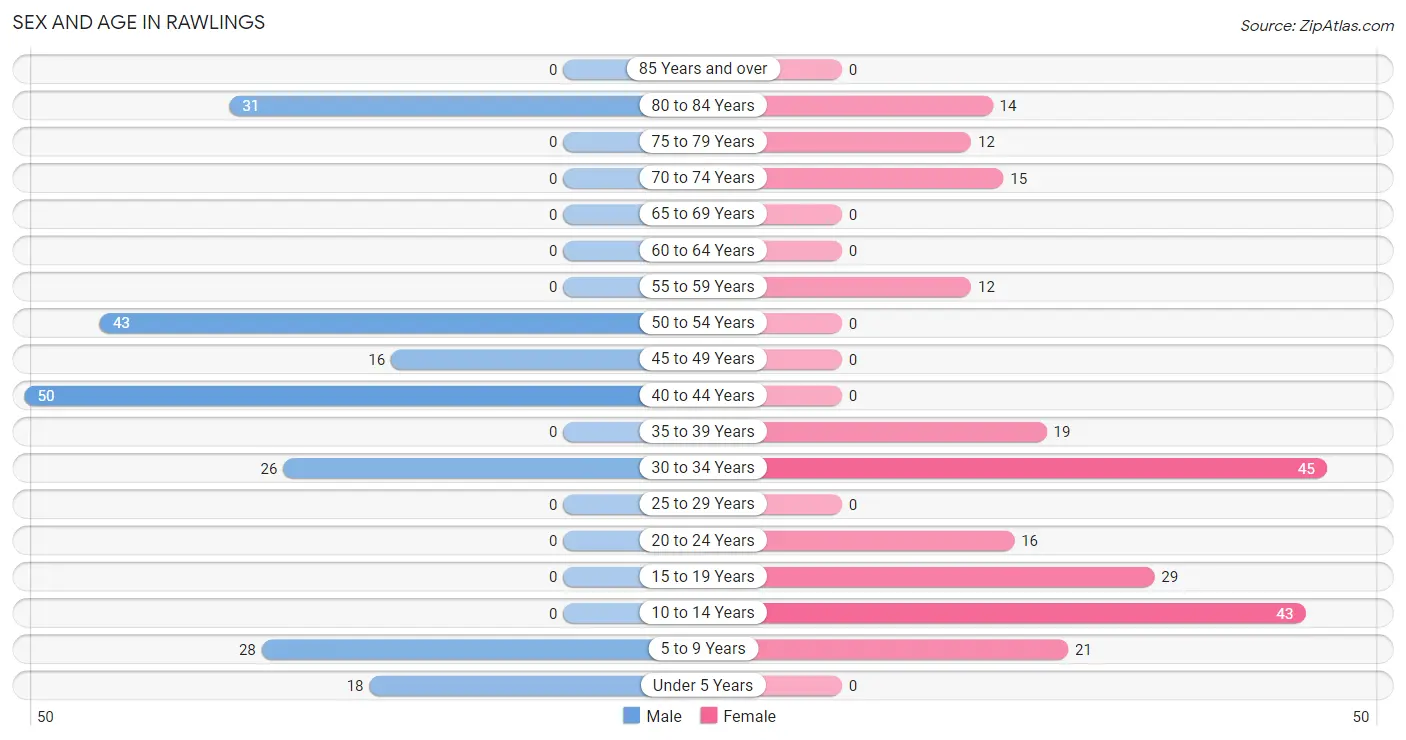
| Age Bracket | Male | Female |
| Under 5 Years | 18 (8.5%) | 0 (0.0%) |
| 5 to 9 Years | 28 (13.2%) | 21 (9.3%) |
| 10 to 14 Years | 0 (0.0%) | 43 (19.0%) |
| 15 to 19 Years | 0 (0.0%) | 29 (12.8%) |
| 20 to 24 Years | 0 (0.0%) | 16 (7.1%) |
| 25 to 29 Years | 0 (0.0%) | 0 (0.0%) |
| 30 to 34 Years | 26 (12.3%) | 45 (19.9%) |
| 35 to 39 Years | 0 (0.0%) | 19 (8.4%) |
| 40 to 44 Years | 50 (23.6%) | 0 (0.0%) |
| 45 to 49 Years | 16 (7.5%) | 0 (0.0%) |
| 50 to 54 Years | 43 (20.3%) | 0 (0.0%) |
| 55 to 59 Years | 0 (0.0%) | 12 (5.3%) |
| 60 to 64 Years | 0 (0.0%) | 0 (0.0%) |
| 65 to 69 Years | 0 (0.0%) | 0 (0.0%) |
| 70 to 74 Years | 0 (0.0%) | 15 (6.6%) |
| 75 to 79 Years | 0 (0.0%) | 12 (5.3%) |
| 80 to 84 Years | 31 (14.6%) | 14 (6.2%) |
| 85 Years and over | 0 (0.0%) | 0 (0.0%) |
| Total | 212 (100.0%) | 226 (100.0%) |
Families and Households in Rawlings
Median Family Size in Rawlings
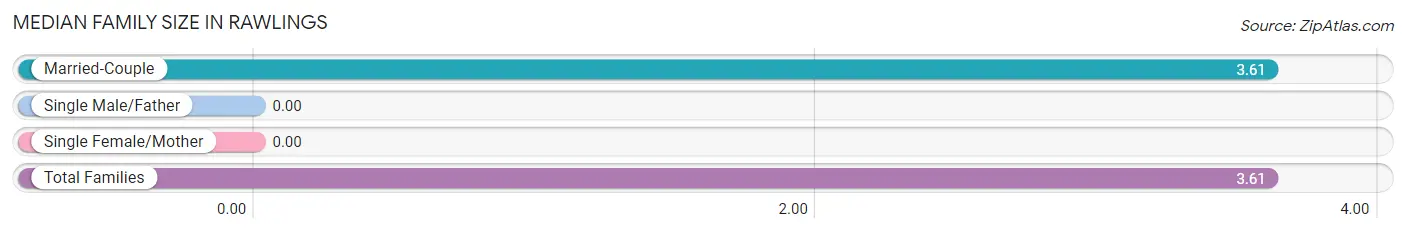
| Family Type | # Families | Family Size |
| Married-Couple | 96 (100.0%) | 3.61 |
| Single Male/Father | 0 (0.0%) | - |
| Single Female/Mother | 0 (0.0%) | - |
| Total Families | 96 (100.0%) | 3.61 |
Median Household Size in Rawlings
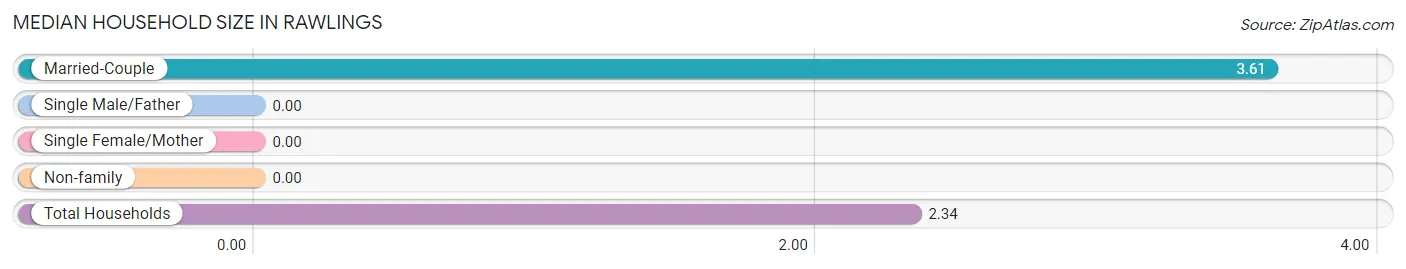
| Household Type | # Households | Household Size |
| Married-Couple | 96 (51.3%) | 3.61 |
| Single Male/Father | 0 (0.0%) | - |
| Single Female/Mother | 0 (0.0%) | - |
| Non-family | 91 (48.7%) | - |
| Total Households | 187 (100.0%) | 2.34 |
Household Size by Marriage Status in Rawlings
Out of a total of 187 households in Rawlings, 96 (51.3%) are family households, while 91 (48.7%) are nonfamily households. The most numerous type of family households are 3-person households, comprising 39, and the most common type of nonfamily households are 1-person households, comprising 91.
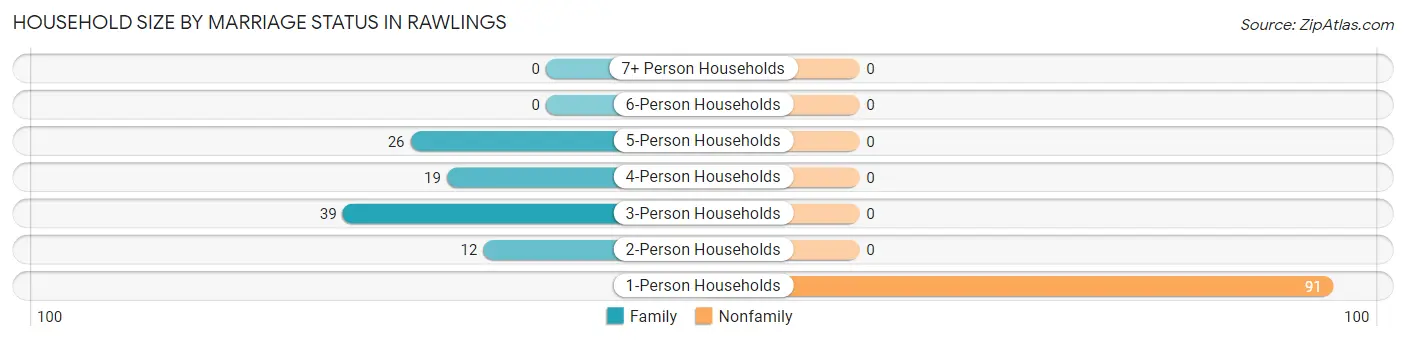
| Household Size | Family Households | Nonfamily Households |
| 1-Person Households | - | 91 (48.7%) |
| 2-Person Households | 12 (6.4%) | 0 (0.0%) |
| 3-Person Households | 39 (20.9%) | 0 (0.0%) |
| 4-Person Households | 19 (10.2%) | 0 (0.0%) |
| 5-Person Households | 26 (13.9%) | 0 (0.0%) |
| 6-Person Households | 0 (0.0%) | 0 (0.0%) |
| 7+ Person Households | 0 (0.0%) | 0 (0.0%) |
| Total | 96 (51.3%) | 91 (48.7%) |
Female Fertility in Rawlings
Fertility by Age in Rawlings
| Age Bracket | Women with Births | Births / 1,000 Women |
| 15 to 19 years | 0 (0.0%) | 0.0 |
| 20 to 34 years | 0 (0.0%) | 0.0 |
| 35 to 50 years | 0 (0.0%) | 0.0 |
| Total | 0 (0.0%) | 0.0 |
Fertility by Age by Marriage Status in Rawlings
| Age Bracket | Married | Unmarried |
| 15 to 19 years | 0 (0.0%) | 0 (0.0%) |
| 20 to 34 years | 0 (0.0%) | 0 (0.0%) |
| 35 to 50 years | 0 (0.0%) | 0 (0.0%) |
| Total | 0 (0.0%) | 0 (0.0%) |
Fertility by Education in Rawlings
| Educational Attainment | Women with Births | Births / 1,000 Women |
| Less than High School | 0 (0.0%) | 0.0 |
| High School Diploma | 0 (0.0%) | 0.0 |
| College or Associate's Degree | 0 (0.0%) | 0.0 |
| Bachelor's Degree | 0 (0.0%) | 0.0 |
| Graduate Degree | 0 (0.0%) | 0.0 |
| Total | 0 (0.0%) | 0.0 |
Fertility by Education by Marriage Status in Rawlings
| Educational Attainment | Married | Unmarried |
| Less than High School | 0 (0.0%) | 0 (0.0%) |
| High School Diploma | 0 (0.0%) | 0 (0.0%) |
| College or Associate's Degree | 0 (0.0%) | 0 (0.0%) |
| Bachelor's Degree | 0 (0.0%) | 0 (0.0%) |
| Graduate Degree | 0 (0.0%) | 0 (0.0%) |
| Total | 0 (0.0%) | 0 (0.0%) |
Employment Characteristics in Rawlings
Employment by Class of Employer in Rawlings
Among the 161 employed individuals in Rawlings, private company employees (139 | 86.3%), and not-for-profit organizations (22 | 13.7%) make up the most common classes of employment.
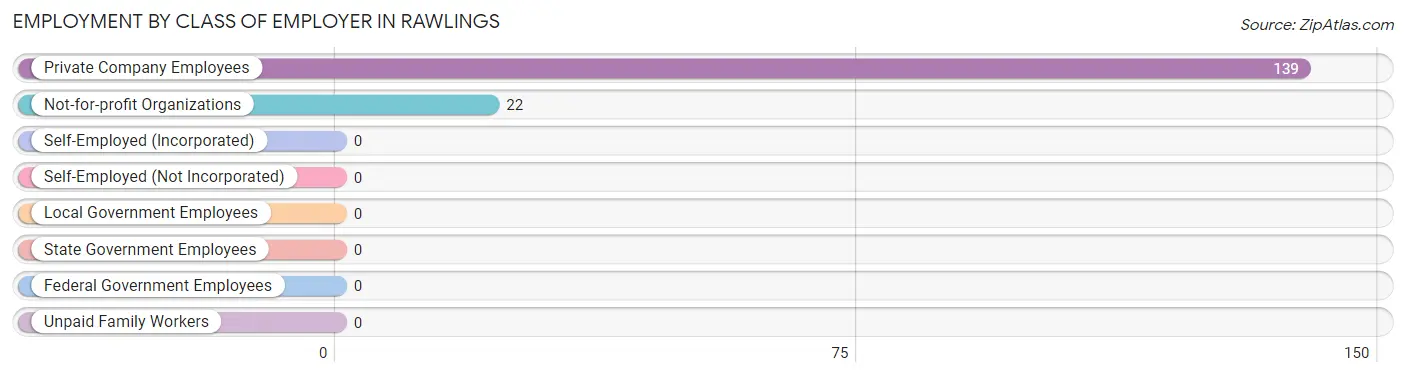
| Employer Class | # Employees | % Employees |
| Private Company Employees | 139 | 86.3% |
| Self-Employed (Incorporated) | 0 | 0.0% |
| Self-Employed (Not Incorporated) | 0 | 0.0% |
| Not-for-profit Organizations | 22 | 13.7% |
| Local Government Employees | 0 | 0.0% |
| State Government Employees | 0 | 0.0% |
| Federal Government Employees | 0 | 0.0% |
| Unpaid Family Workers | 0 | 0.0% |
| Total | 161 | 100.0% |
Employment Status by Age in Rawlings
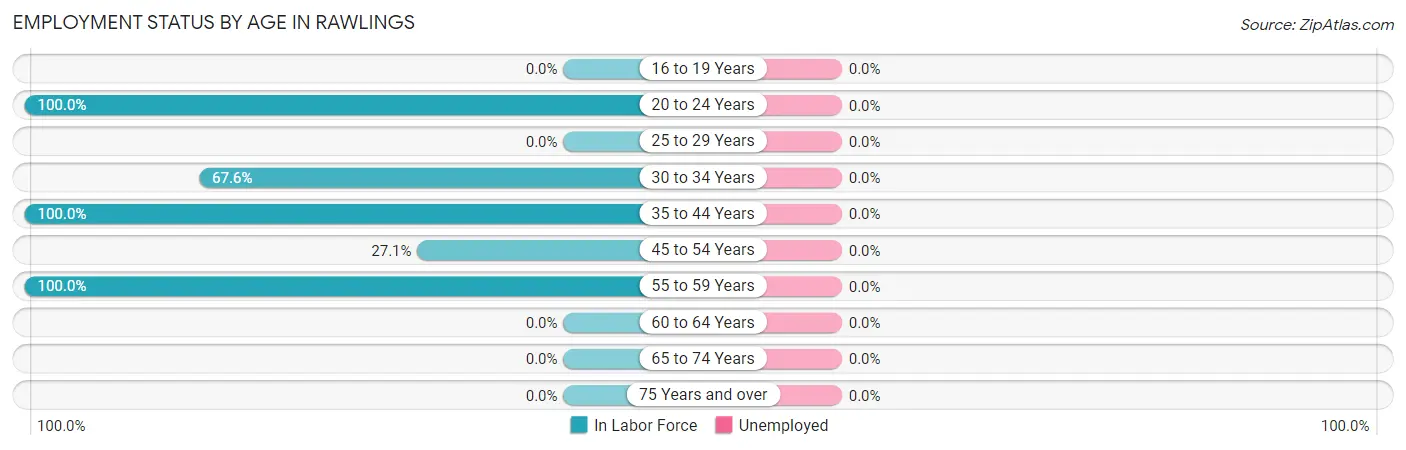
| Age Bracket | In Labor Force | Unemployed |
| 16 to 19 Years | 0 (0.0%) | 0 (0.0%) |
| 20 to 24 Years | 16 (100.0%) | 0 (0.0%) |
| 25 to 29 Years | 0 (0.0%) | 0 (0.0%) |
| 30 to 34 Years | 48 (67.6%) | 0 (0.0%) |
| 35 to 44 Years | 69 (100.0%) | 0 (0.0%) |
| 45 to 54 Years | 16 (27.1%) | 0 (0.0%) |
| 55 to 59 Years | 12 (100.0%) | 0 (0.0%) |
| 60 to 64 Years | 0 (0.0%) | 0 (0.0%) |
| 65 to 74 Years | 0 (0.0%) | 0 (0.0%) |
| 75 Years and over | 0 (0.0%) | 0 (0.0%) |
| Total | 161 (49.1%) | 0 (0.0%) |
Employment Status by Educational Attainment in Rawlings
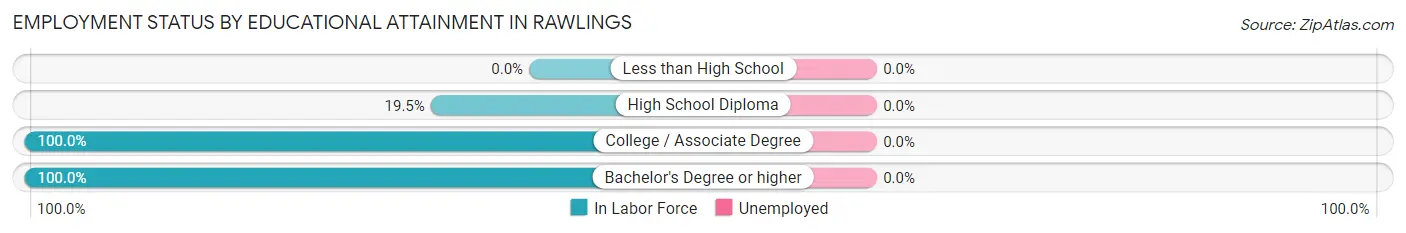
| Educational Attainment | In Labor Force | Unemployed |
| Less than High School | 0 (0.0%) | 0 (0.0%) |
| High School Diploma | 16 (19.5%) | 0 (0.0%) |
| College / Associate Degree | 103 (100.0%) | 0 (0.0%) |
| Bachelor's Degree or higher | 26 (100.0%) | 0 (0.0%) |
| Total | 145 (68.7%) | 0 (0.0%) |
Employment Occupations by Sex in Rawlings
Management, Business, Science and Arts Occupations
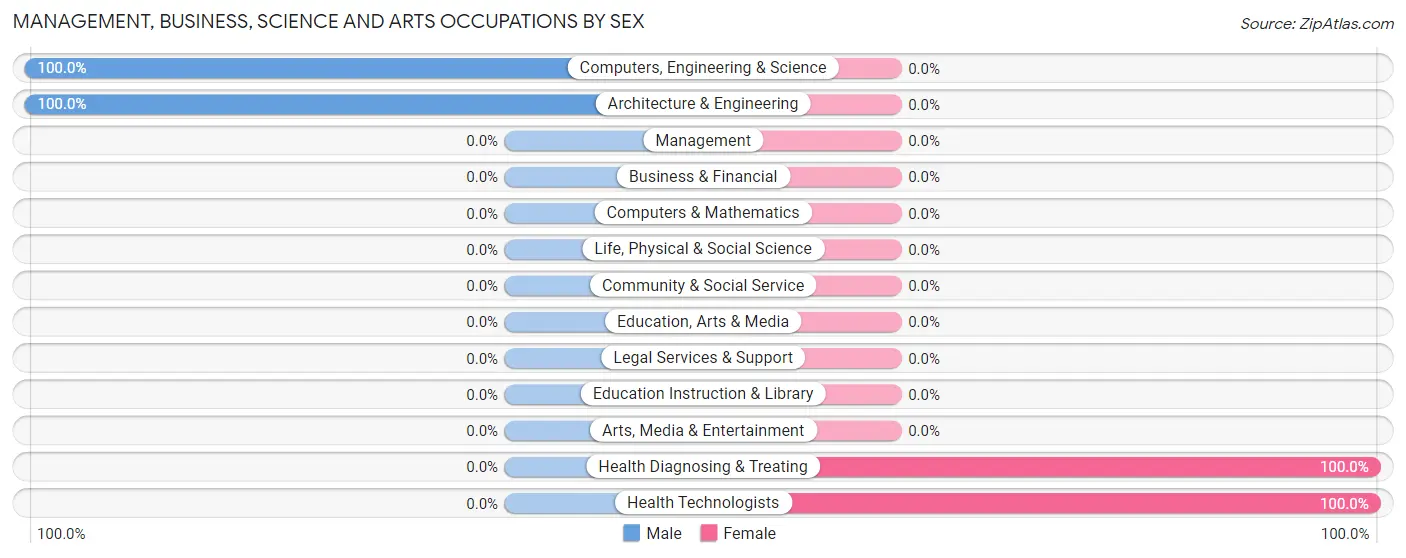
The most common Management, Business, Science and Arts occupations in Rawlings are Computers, Engineering & Science (16 | 9.9%), Architecture & Engineering (16 | 9.9%), Health Diagnosing & Treating (12 | 7.4%), and Health Technologists (12 | 7.4%).
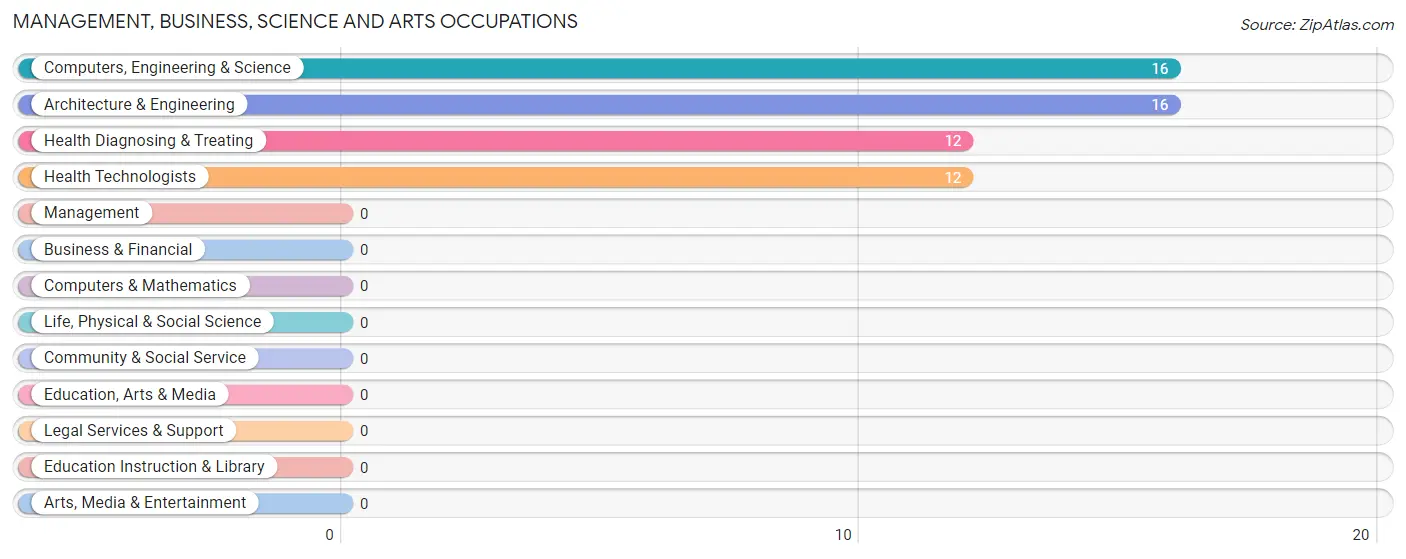
Management, Business, Science and Arts Occupations by Sex
Within the Management, Business, Science and Arts occupations in Rawlings, the most male-oriented occupations are Computers, Engineering & Science (100.0%), and Architecture & Engineering (100.0%), while the most female-oriented occupations are Health Diagnosing & Treating (100.0%), and Health Technologists (100.0%).
| Occupation | Male | Female |
| Management | 0 (0.0%) | 0 (0.0%) |
| Business & Financial | 0 (0.0%) | 0 (0.0%) |
| Computers, Engineering & Science | 16 (100.0%) | 0 (0.0%) |
| Computers & Mathematics | 0 (0.0%) | 0 (0.0%) |
| Architecture & Engineering | 16 (100.0%) | 0 (0.0%) |
| Life, Physical & Social Science | 0 (0.0%) | 0 (0.0%) |
| Community & Social Service | 0 (0.0%) | 0 (0.0%) |
| Education, Arts & Media | 0 (0.0%) | 0 (0.0%) |
| Legal Services & Support | 0 (0.0%) | 0 (0.0%) |
| Education Instruction & Library | 0 (0.0%) | 0 (0.0%) |
| Arts, Media & Entertainment | 0 (0.0%) | 0 (0.0%) |
| Health Diagnosing & Treating | 0 (0.0%) | 12 (100.0%) |
| Health Technologists | 0 (0.0%) | 12 (100.0%) |
| Total (Category) | 16 (57.1%) | 12 (42.9%) |
| Total (Overall) | 92 (57.1%) | 69 (42.9%) |
Services Occupations
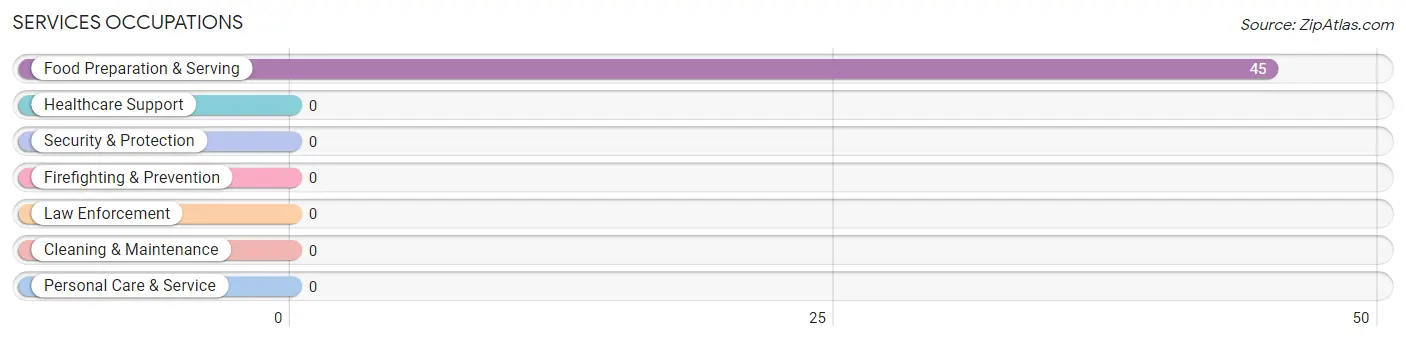
The most common Services occupations in Rawlings are , and Food Preparation & Serving (45 | 28.0%).
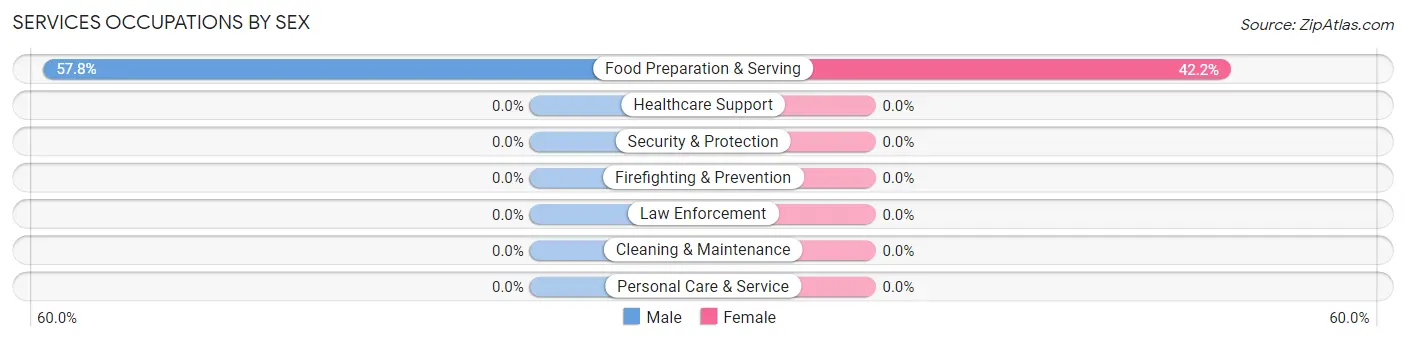
Services Occupations by Sex
| Occupation | Male | Female |
| Healthcare Support | 0 (0.0%) | 0 (0.0%) |
| Security & Protection | 0 (0.0%) | 0 (0.0%) |
| Firefighting & Prevention | 0 (0.0%) | 0 (0.0%) |
| Law Enforcement | 0 (0.0%) | 0 (0.0%) |
| Food Preparation & Serving | 26 (57.8%) | 19 (42.2%) |
| Cleaning & Maintenance | 0 (0.0%) | 0 (0.0%) |
| Personal Care & Service | 0 (0.0%) | 0 (0.0%) |
| Total (Category) | 26 (57.8%) | 19 (42.2%) |
| Total (Overall) | 92 (57.1%) | 69 (42.9%) |
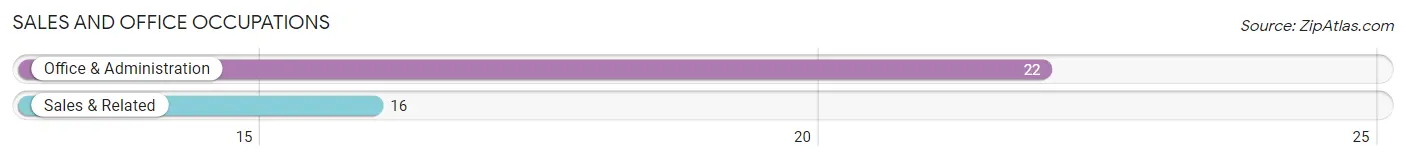
Sales and Office Occupations
The most common Sales and Office occupations in Rawlings are Office & Administration (22 | 13.7%), and Sales & Related (16 | 9.9%).
Sales and Office Occupations by Sex
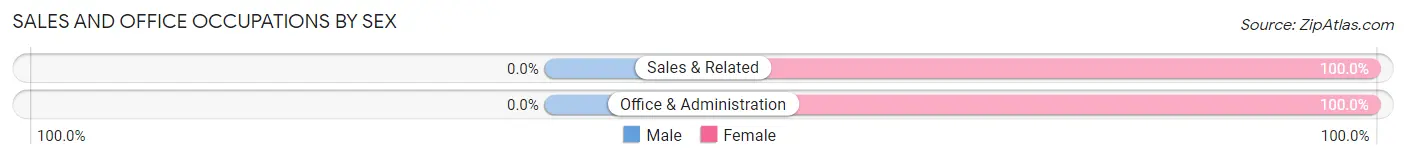
| Occupation | Male | Female |
| Sales & Related | 0 (0.0%) | 16 (100.0%) |
| Office & Administration | 0 (0.0%) | 22 (100.0%) |
| Total (Category) | 0 (0.0%) | 38 (100.0%) |
| Total (Overall) | 92 (57.1%) | 69 (42.9%) |
Natural Resources, Construction and Maintenance Occupations
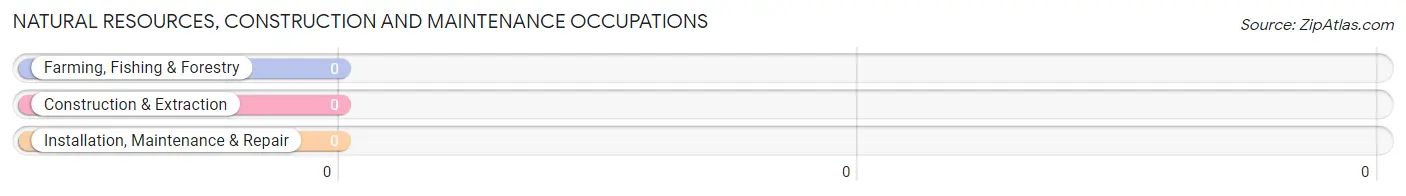
Natural Resources, Construction and Maintenance Occupations by Sex
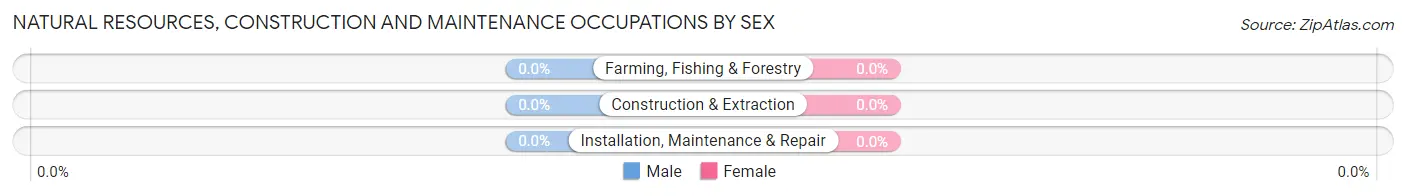
| Occupation | Male | Female |
| Farming, Fishing & Forestry | 0 (0.0%) | 0 (0.0%) |
| Construction & Extraction | 0 (0.0%) | 0 (0.0%) |
| Installation, Maintenance & Repair | 0 (0.0%) | 0 (0.0%) |
| Total (Category) | 0 (0.0%) | 0 (0.0%) |
| Total (Overall) | 92 (57.1%) | 69 (42.9%) |
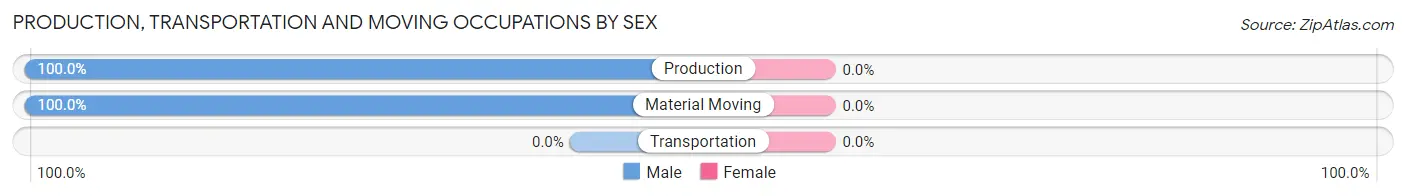
Production, Transportation and Moving Occupations
The most common Production, Transportation and Moving occupations in Rawlings are Production (26 | 16.2%), and Material Moving (24 | 14.9%).
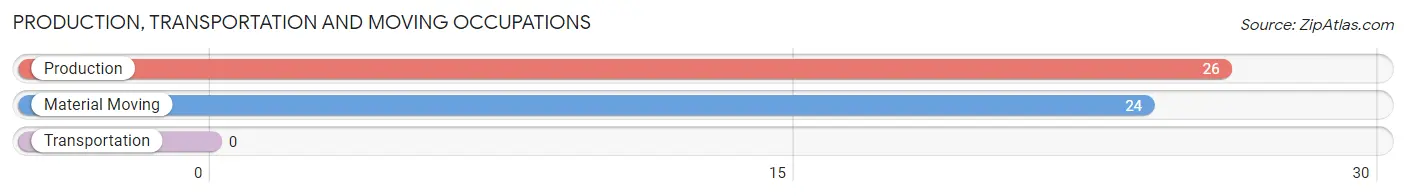
Production, Transportation and Moving Occupations by Sex
| Occupation | Male | Female |
| Production | 26 (100.0%) | 0 (0.0%) |
| Transportation | 0 (0.0%) | 0 (0.0%) |
| Material Moving | 24 (100.0%) | 0 (0.0%) |
| Total (Category) | 50 (100.0%) | 0 (0.0%) |
| Total (Overall) | 92 (57.1%) | 69 (42.9%) |
Employment Industries by Sex in Rawlings
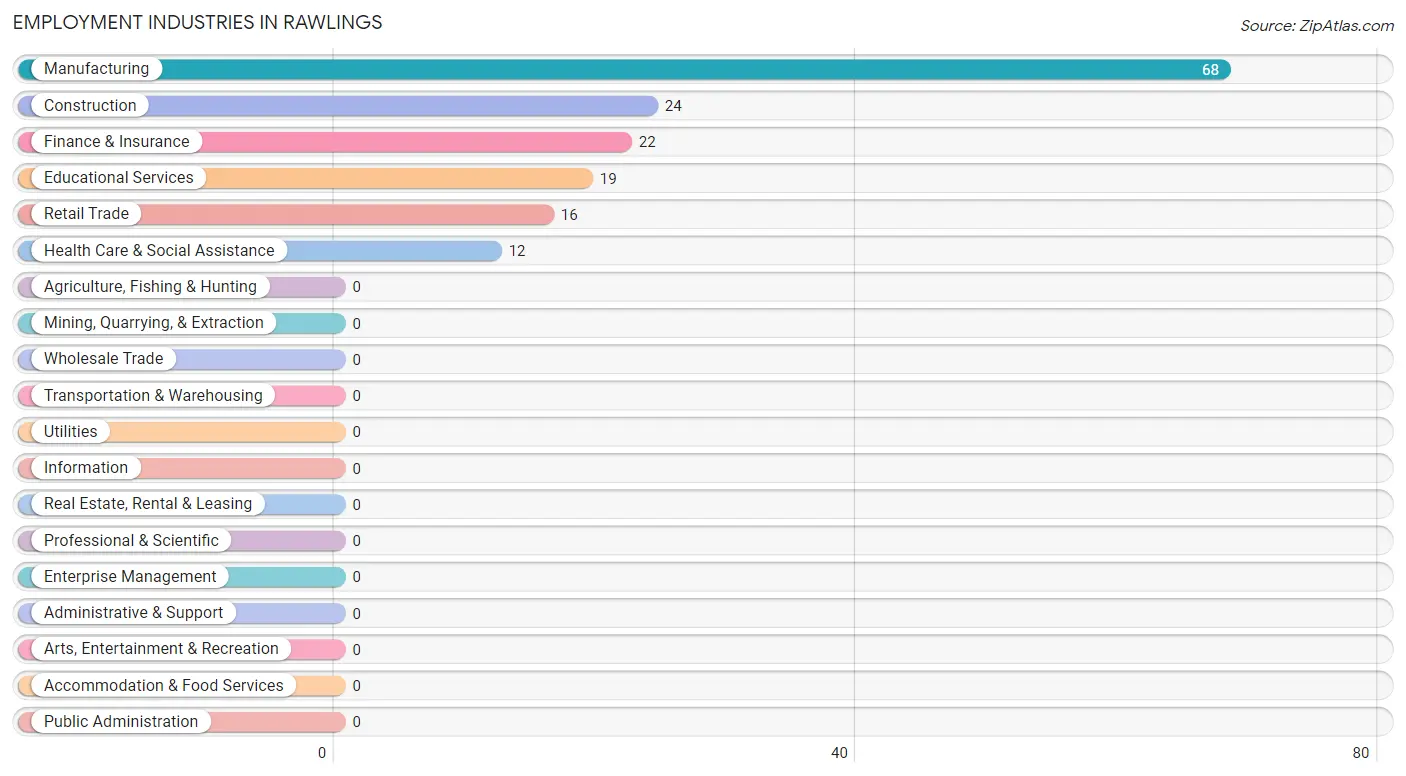
Employment Industries in Rawlings
The major employment industries in Rawlings include Manufacturing (68 | 42.2%), Construction (24 | 14.9%), Finance & Insurance (22 | 13.7%), Educational Services (19 | 11.8%), and Retail Trade (16 | 9.9%).
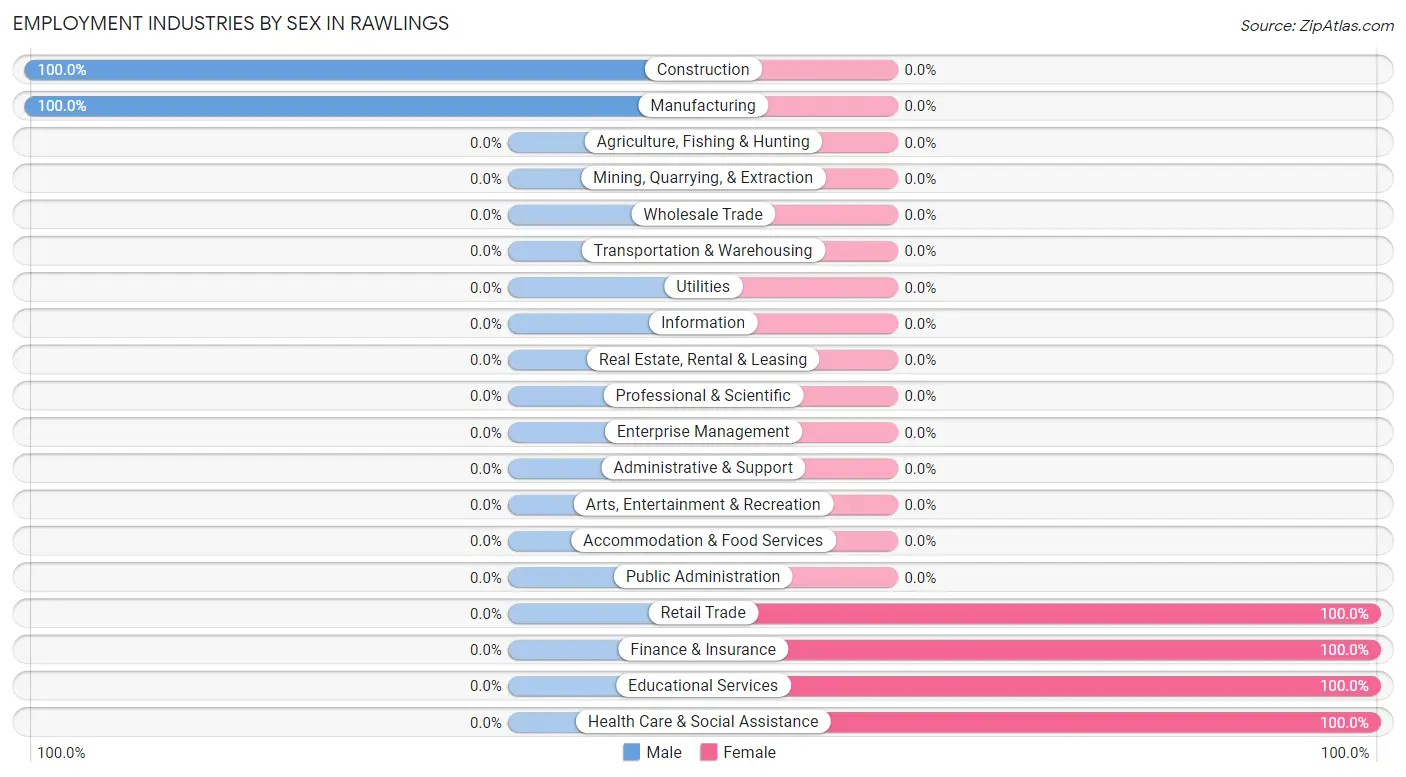
Employment Industries by Sex in Rawlings
The Rawlings industries that see more men than women are Construction (100.0%), and Manufacturing (100.0%), whereas the industries that tend to have a higher number of women are Retail Trade (100.0%), Finance & Insurance (100.0%), and Educational Services (100.0%).
| Industry | Male | Female |
| Agriculture, Fishing & Hunting | 0 (0.0%) | 0 (0.0%) |
| Mining, Quarrying, & Extraction | 0 (0.0%) | 0 (0.0%) |
| Construction | 24 (100.0%) | 0 (0.0%) |
| Manufacturing | 68 (100.0%) | 0 (0.0%) |
| Wholesale Trade | 0 (0.0%) | 0 (0.0%) |
| Retail Trade | 0 (0.0%) | 16 (100.0%) |
| Transportation & Warehousing | 0 (0.0%) | 0 (0.0%) |
| Utilities | 0 (0.0%) | 0 (0.0%) |
| Information | 0 (0.0%) | 0 (0.0%) |
| Finance & Insurance | 0 (0.0%) | 22 (100.0%) |
| Real Estate, Rental & Leasing | 0 (0.0%) | 0 (0.0%) |
| Professional & Scientific | 0 (0.0%) | 0 (0.0%) |
| Enterprise Management | 0 (0.0%) | 0 (0.0%) |
| Administrative & Support | 0 (0.0%) | 0 (0.0%) |
| Educational Services | 0 (0.0%) | 19 (100.0%) |
| Health Care & Social Assistance | 0 (0.0%) | 12 (100.0%) |
| Arts, Entertainment & Recreation | 0 (0.0%) | 0 (0.0%) |
| Accommodation & Food Services | 0 (0.0%) | 0 (0.0%) |
| Public Administration | 0 (0.0%) | 0 (0.0%) |
| Total | 92 (57.1%) | 69 (42.9%) |
Education in Rawlings
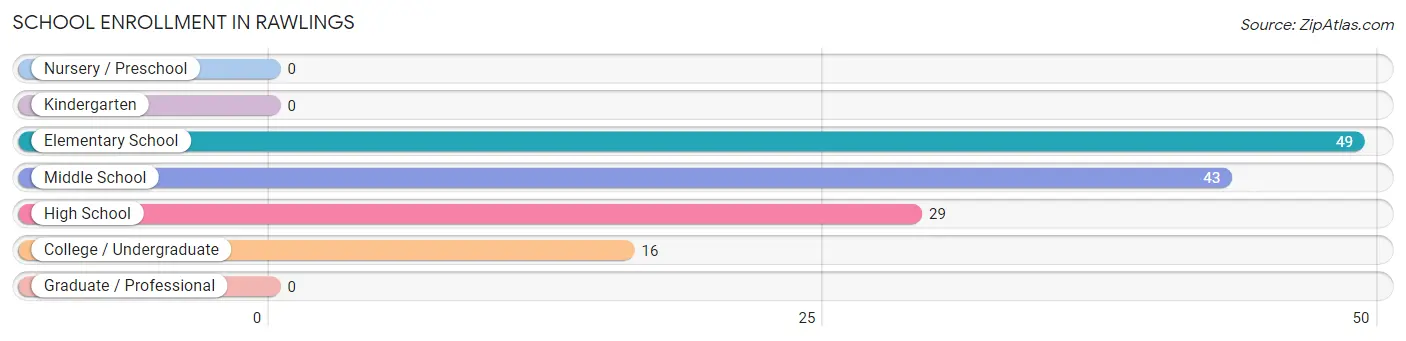
School Enrollment in Rawlings
The most common levels of schooling among the 137 students in Rawlings are elementary school (49 | 35.8%), middle school (43 | 31.4%), and high school (29 | 21.2%).
| School Level | # Students | % Students |
| Nursery / Preschool | 0 | 0.0% |
| Kindergarten | 0 | 0.0% |
| Elementary School | 49 | 35.8% |
| Middle School | 43 | 31.4% |
| High School | 29 | 21.2% |
| College / Undergraduate | 16 | 11.7% |
| Graduate / Professional | 0 | 0.0% |
| Total | 137 | 100.0% |
School Enrollment by Age by Funding Source in Rawlings
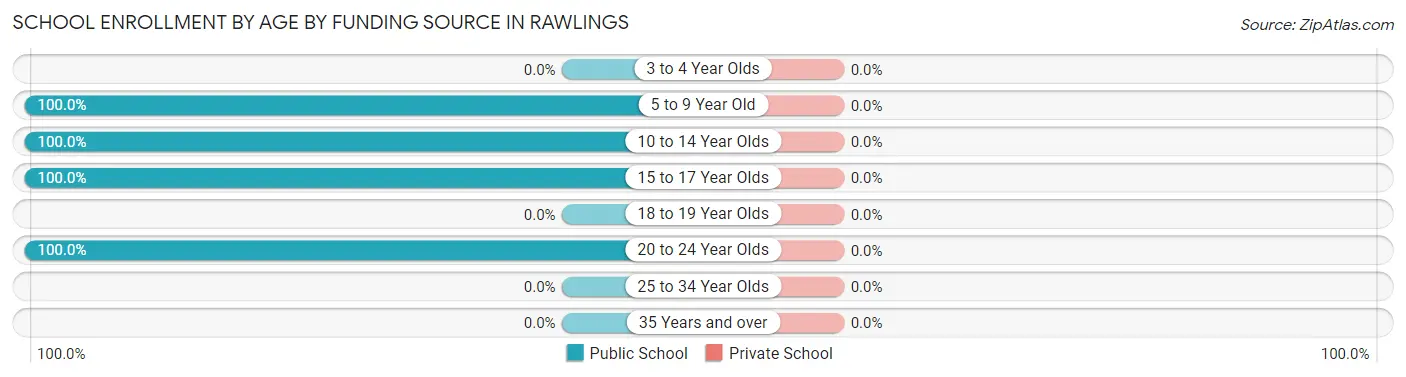
| Age Bracket | Public School | Private School |
| 3 to 4 Year Olds | 0 (0.0%) | 0 (0.0%) |
| 5 to 9 Year Old | 49 (100.0%) | 0 (0.0%) |
| 10 to 14 Year Olds | 43 (100.0%) | 0 (0.0%) |
| 15 to 17 Year Olds | 29 (100.0%) | 0 (0.0%) |
| 18 to 19 Year Olds | 0 (0.0%) | 0 (0.0%) |
| 20 to 24 Year Olds | 16 (100.0%) | 0 (0.0%) |
| 25 to 34 Year Olds | 0 (0.0%) | 0 (0.0%) |
| 35 Years and over | 0 (0.0%) | 0 (0.0%) |
| Total | 137 (100.0%) | 0 (0.0%) |
Educational Attainment by Field of Study in Rawlings
Social sciences (26 | 50.0%), and business (26 | 50.0%) are the most common fields of study among 52 individuals in Rawlings who have obtained a bachelor's degree or higher.
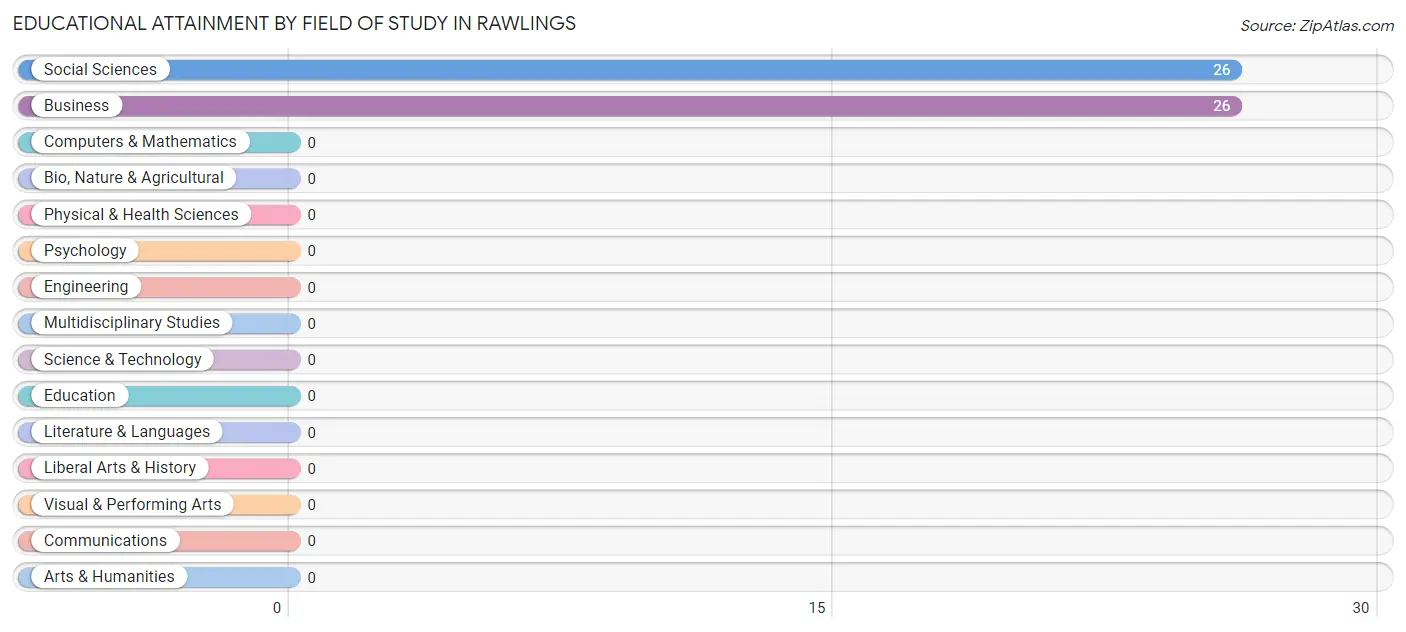
| Field of Study | # Graduates | % Graduates |
| Computers & Mathematics | 0 | 0.0% |
| Bio, Nature & Agricultural | 0 | 0.0% |
| Physical & Health Sciences | 0 | 0.0% |
| Psychology | 0 | 0.0% |
| Social Sciences | 26 | 50.0% |
| Engineering | 0 | 0.0% |
| Multidisciplinary Studies | 0 | 0.0% |
| Science & Technology | 0 | 0.0% |
| Business | 26 | 50.0% |
| Education | 0 | 0.0% |
| Literature & Languages | 0 | 0.0% |
| Liberal Arts & History | 0 | 0.0% |
| Visual & Performing Arts | 0 | 0.0% |
| Communications | 0 | 0.0% |
| Arts & Humanities | 0 | 0.0% |
| Total | 52 | 100.0% |
Transportation & Commute in Rawlings
Vehicle Availability by Sex in Rawlings
The most prevalent vehicle ownership categories in Rawlings are males with 2 vehicles (50, accounting for 54.3%) and females with 2 vehicles (19, making up 72.5%).
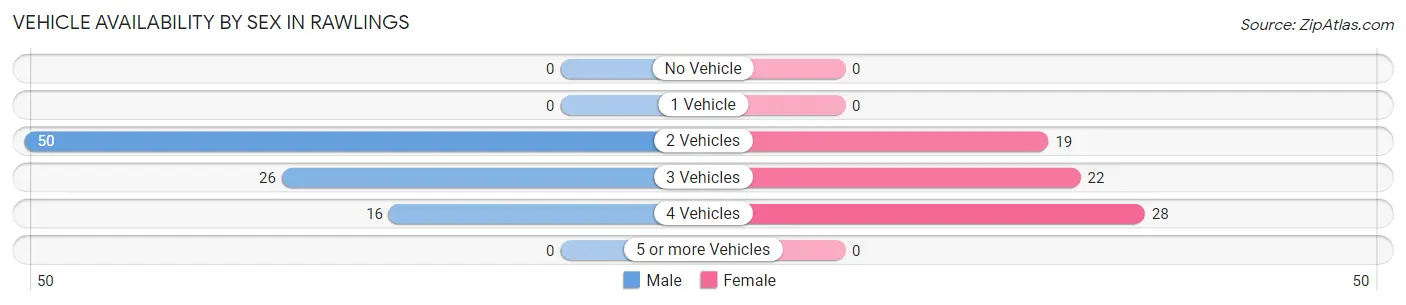
| Vehicles Available | Male | Female |
| No Vehicle | 0 (0.0%) | 0 (0.0%) |
| 1 Vehicle | 0 (0.0%) | 0 (0.0%) |
| 2 Vehicles | 50 (54.3%) | 19 (27.5%) |
| 3 Vehicles | 26 (28.3%) | 22 (31.9%) |
| 4 Vehicles | 16 (17.4%) | 28 (40.6%) |
| 5 or more Vehicles | 0 (0.0%) | 0 (0.0%) |
| Total | 92 (100.0%) | 69 (100.0%) |
Commute Time in Rawlings
The most frequently occuring commute durations in Rawlings are 20 to 24 minutes (64 commuters, 39.8%), 60 to 89 minutes (40 commuters, 24.8%), and 15 to 19 minutes (26 commuters, 16.2%).
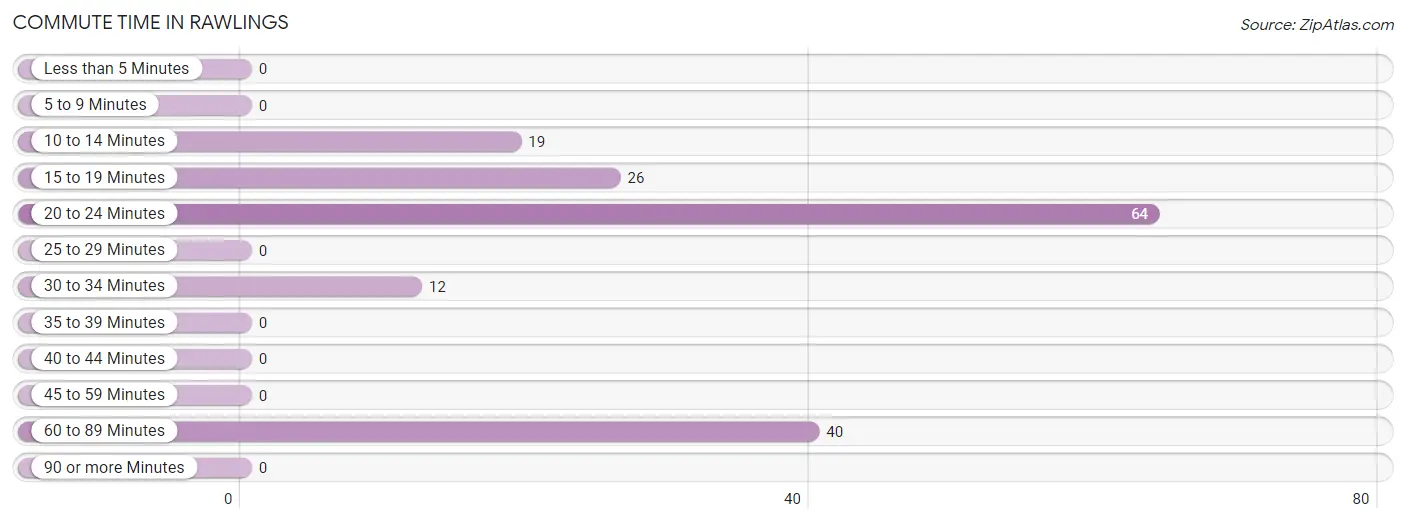
| Commute Time | # Commuters | % Commuters |
| Less than 5 Minutes | 0 | 0.0% |
| 5 to 9 Minutes | 0 | 0.0% |
| 10 to 14 Minutes | 19 | 11.8% |
| 15 to 19 Minutes | 26 | 16.2% |
| 20 to 24 Minutes | 64 | 39.8% |
| 25 to 29 Minutes | 0 | 0.0% |
| 30 to 34 Minutes | 12 | 7.4% |
| 35 to 39 Minutes | 0 | 0.0% |
| 40 to 44 Minutes | 0 | 0.0% |
| 45 to 59 Minutes | 0 | 0.0% |
| 60 to 89 Minutes | 40 | 24.8% |
| 90 or more Minutes | 0 | 0.0% |
Commute Time by Sex in Rawlings
The most common commute times in Rawlings are 60 to 89 minutes (40 commuters, 43.5%) for males and 20 to 24 minutes (38 commuters, 55.1%) for females.
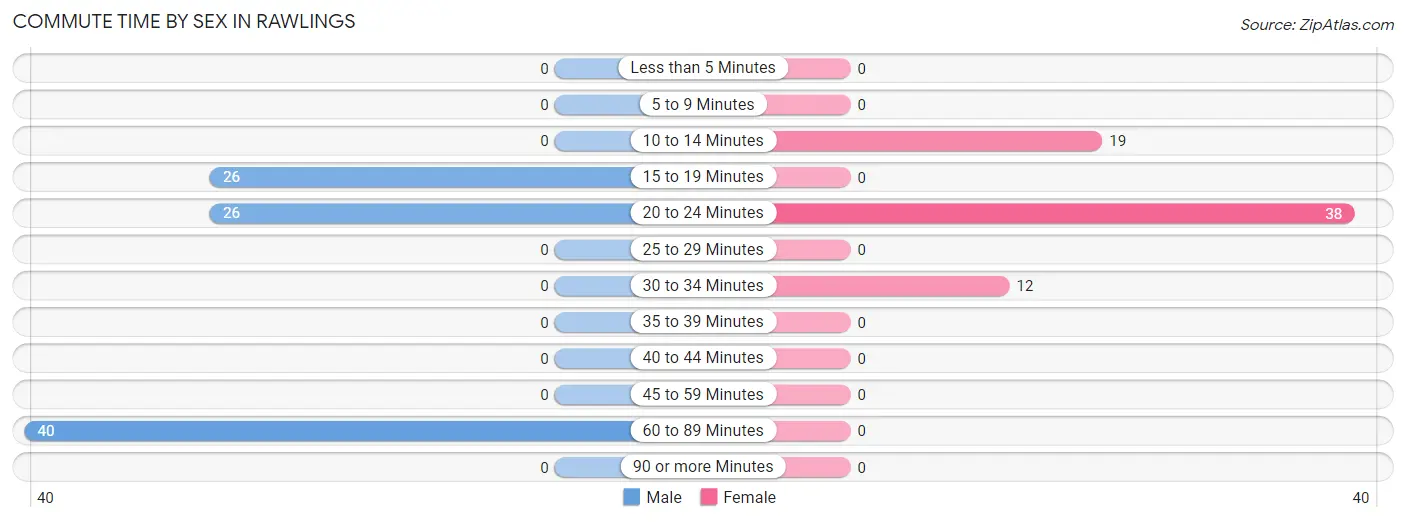
| Commute Time | Male | Female |
| Less than 5 Minutes | 0 (0.0%) | 0 (0.0%) |
| 5 to 9 Minutes | 0 (0.0%) | 0 (0.0%) |
| 10 to 14 Minutes | 0 (0.0%) | 19 (27.5%) |
| 15 to 19 Minutes | 26 (28.3%) | 0 (0.0%) |
| 20 to 24 Minutes | 26 (28.3%) | 38 (55.1%) |
| 25 to 29 Minutes | 0 (0.0%) | 0 (0.0%) |
| 30 to 34 Minutes | 0 (0.0%) | 12 (17.4%) |
| 35 to 39 Minutes | 0 (0.0%) | 0 (0.0%) |
| 40 to 44 Minutes | 0 (0.0%) | 0 (0.0%) |
| 45 to 59 Minutes | 0 (0.0%) | 0 (0.0%) |
| 60 to 89 Minutes | 40 (43.5%) | 0 (0.0%) |
| 90 or more Minutes | 0 (0.0%) | 0 (0.0%) |
Time of Departure to Work by Sex in Rawlings
The most frequent times of departure to work in Rawlings are 5:00 AM to 5:29 AM (40, 43.5%) for males and 7:30 AM to 7:59 AM (31, 44.9%) for females.
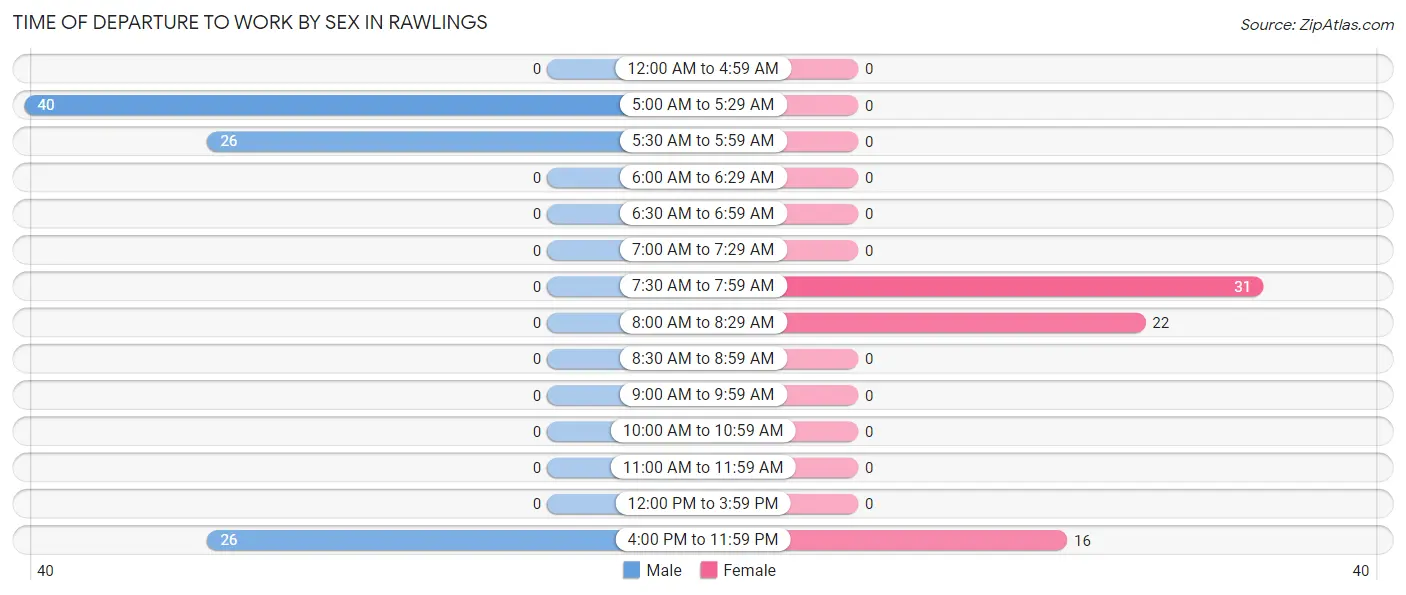
| Time of Departure | Male | Female |
| 12:00 AM to 4:59 AM | 0 (0.0%) | 0 (0.0%) |
| 5:00 AM to 5:29 AM | 40 (43.5%) | 0 (0.0%) |
| 5:30 AM to 5:59 AM | 26 (28.3%) | 0 (0.0%) |
| 6:00 AM to 6:29 AM | 0 (0.0%) | 0 (0.0%) |
| 6:30 AM to 6:59 AM | 0 (0.0%) | 0 (0.0%) |
| 7:00 AM to 7:29 AM | 0 (0.0%) | 0 (0.0%) |
| 7:30 AM to 7:59 AM | 0 (0.0%) | 31 (44.9%) |
| 8:00 AM to 8:29 AM | 0 (0.0%) | 22 (31.9%) |
| 8:30 AM to 8:59 AM | 0 (0.0%) | 0 (0.0%) |
| 9:00 AM to 9:59 AM | 0 (0.0%) | 0 (0.0%) |
| 10:00 AM to 10:59 AM | 0 (0.0%) | 0 (0.0%) |
| 11:00 AM to 11:59 AM | 0 (0.0%) | 0 (0.0%) |
| 12:00 PM to 3:59 PM | 0 (0.0%) | 0 (0.0%) |
| 4:00 PM to 11:59 PM | 26 (28.3%) | 16 (23.2%) |
| Total | 92 (100.0%) | 69 (100.0%) |
Housing Occupancy in Rawlings
Occupancy by Ownership in Rawlings
Of the total 187 dwellings in Rawlings, owner-occupied units account for 187 (100.0%), while renter-occupied units make up 0 (0.0%).
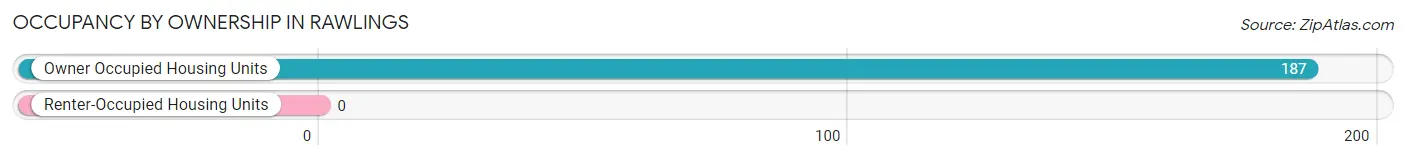
| Occupancy | # Housing Units | % Housing Units |
| Owner Occupied Housing Units | 187 | 100.0% |
| Renter-Occupied Housing Units | 0 | 0.0% |
| Total Occupied Housing Units | 187 | 100.0% |
Occupancy by Household Size in Rawlings
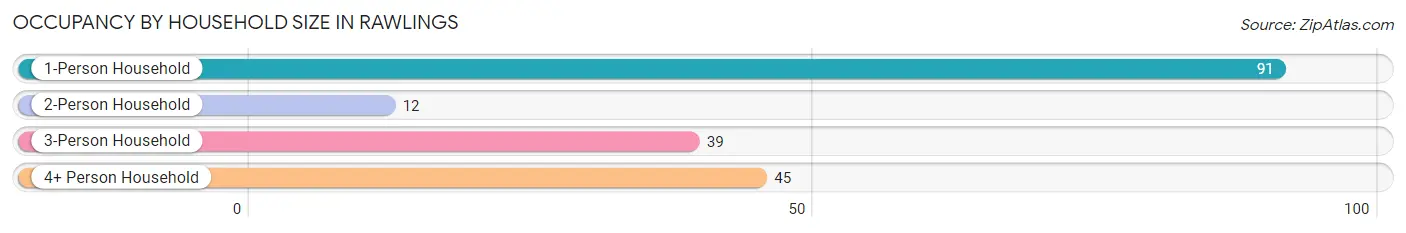
| Household Size | # Housing Units | % Housing Units |
| 1-Person Household | 91 | 48.7% |
| 2-Person Household | 12 | 6.4% |
| 3-Person Household | 39 | 20.9% |
| 4+ Person Household | 45 | 24.1% |
| Total Housing Units | 187 | 100.0% |
Occupancy by Ownership by Household Size in Rawlings
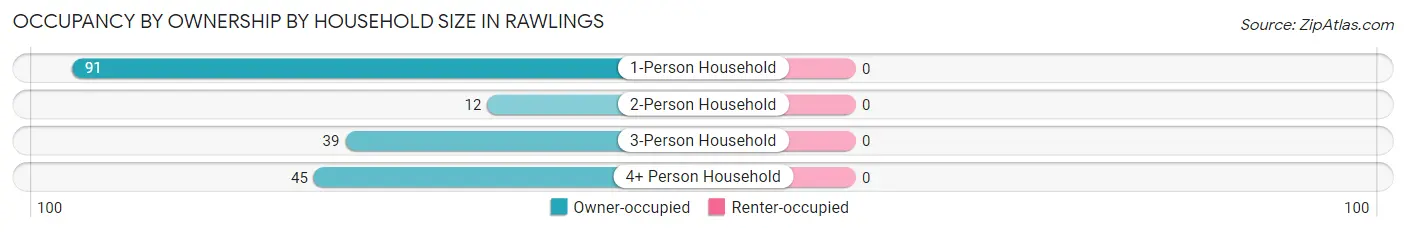
| Household Size | Owner-occupied | Renter-occupied |
| 1-Person Household | 91 (100.0%) | 0 (0.0%) |
| 2-Person Household | 12 (100.0%) | 0 (0.0%) |
| 3-Person Household | 39 (100.0%) | 0 (0.0%) |
| 4+ Person Household | 45 (100.0%) | 0 (0.0%) |
| Total Housing Units | 187 (100.0%) | 0 (0.0%) |
Occupancy by Educational Attainment in Rawlings
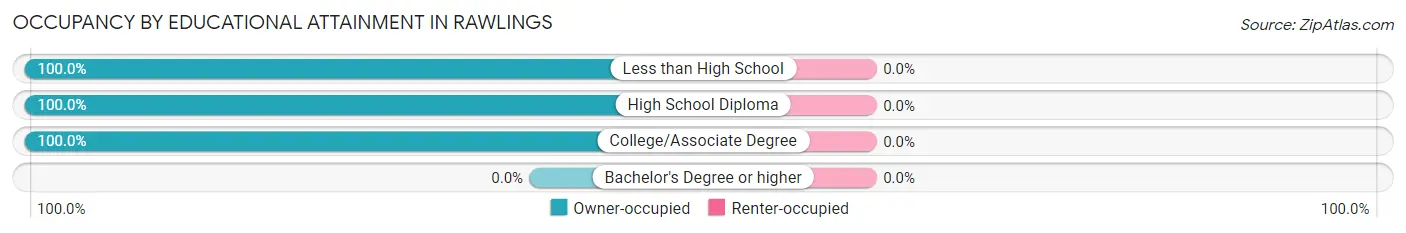
| Household Size | Owner-occupied | Renter-occupied |
| Less than High School | 19 (100.0%) | 0 (0.0%) |
| High School Diploma | 123 (100.0%) | 0 (0.0%) |
| College/Associate Degree | 45 (100.0%) | 0 (0.0%) |
| Bachelor's Degree or higher | 0 (0.0%) | 0 (0.0%) |
Occupancy by Age of Householder in Rawlings
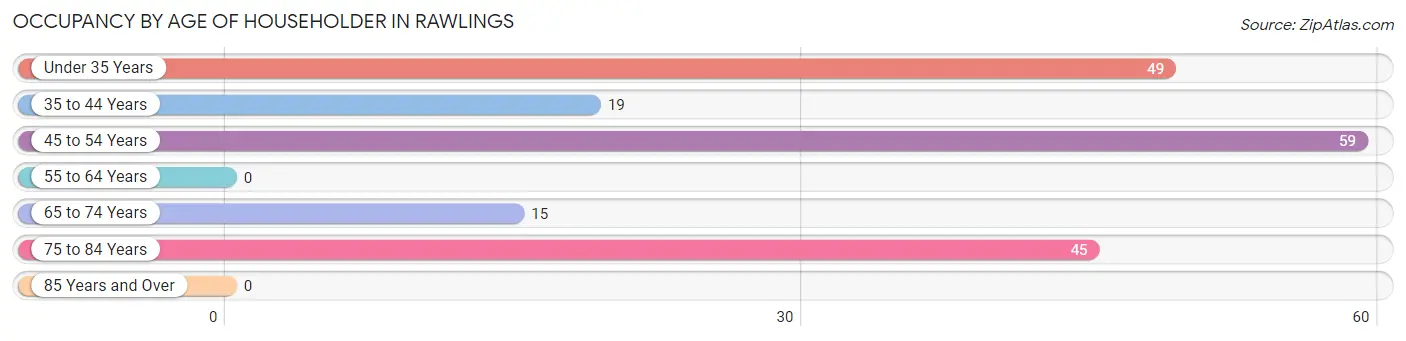
| Age Bracket | # Households | % Households |
| Under 35 Years | 49 | 26.2% |
| 35 to 44 Years | 19 | 10.2% |
| 45 to 54 Years | 59 | 31.6% |
| 55 to 64 Years | 0 | 0.0% |
| 65 to 74 Years | 15 | 8.0% |
| 75 to 84 Years | 45 | 24.1% |
| 85 Years and Over | 0 | 0.0% |
| Total | 187 | 100.0% |
Housing Finances in Rawlings
Median Income by Occupancy in Rawlings
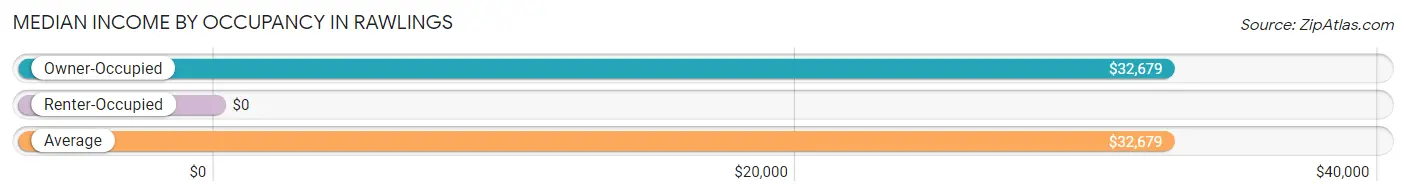
| Occupancy Type | # Households | Median Income |
| Owner-Occupied | 187 (100.0%) | $32,679 |
| Renter-Occupied | 0 (0.0%) | $0 |
| Average | 187 (100.0%) | $32,679 |
Occupancy by Householder Income Bracket in Rawlings
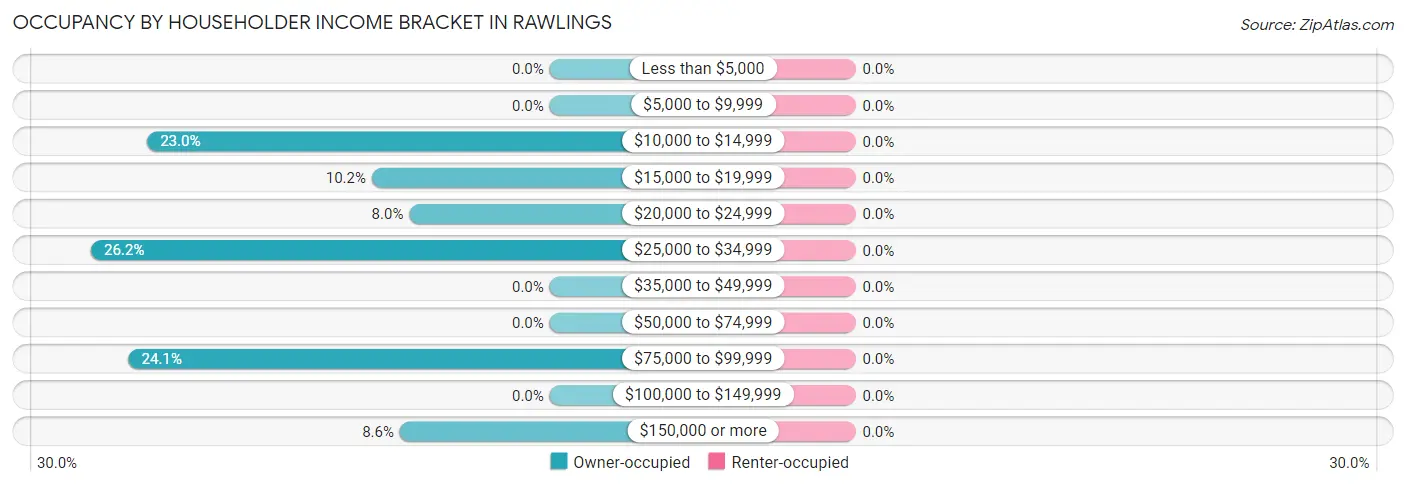
| Income Bracket | Owner-occupied | Renter-occupied |
| Less than $5,000 | 0 (0.0%) | 0 (0.0%) |
| $5,000 to $9,999 | 0 (0.0%) | 0 (0.0%) |
| $10,000 to $14,999 | 43 (23.0%) | 0 (0.0%) |
| $15,000 to $19,999 | 19 (10.2%) | 0 (0.0%) |
| $20,000 to $24,999 | 15 (8.0%) | 0 (0.0%) |
| $25,000 to $34,999 | 49 (26.2%) | 0 (0.0%) |
| $35,000 to $49,999 | 0 (0.0%) | 0 (0.0%) |
| $50,000 to $74,999 | 0 (0.0%) | 0 (0.0%) |
| $75,000 to $99,999 | 45 (24.1%) | 0 (0.0%) |
| $100,000 to $149,999 | 0 (0.0%) | 0 (0.0%) |
| $150,000 or more | 16 (8.6%) | 0 (0.0%) |
| Total | 187 (100.0%) | 0 (0.0%) |
Monthly Housing Cost Tiers in Rawlings
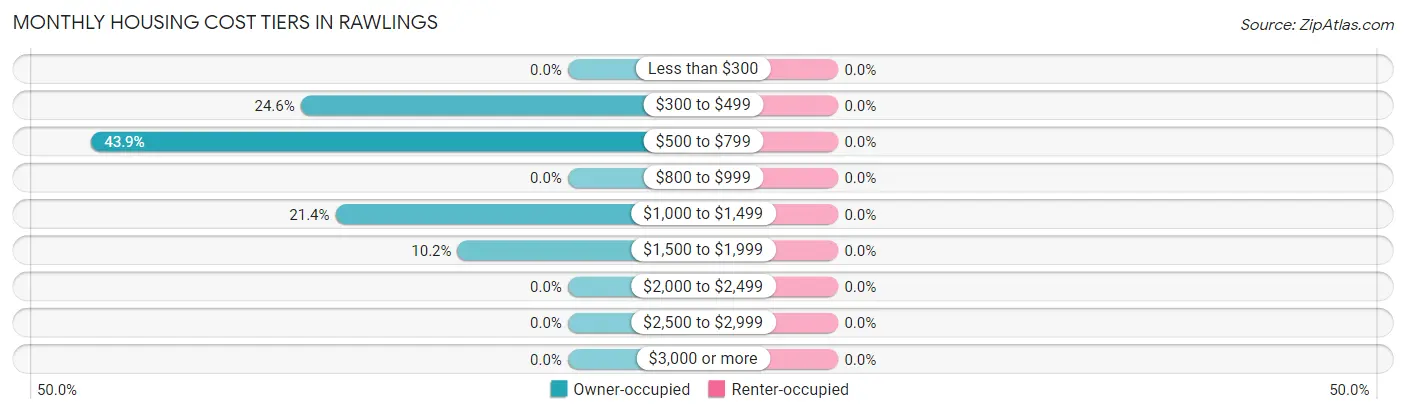
| Monthly Cost | Owner-occupied | Renter-occupied |
| Less than $300 | 0 (0.0%) | 0 (0.0%) |
| $300 to $499 | 46 (24.6%) | 0 (0.0%) |
| $500 to $799 | 82 (43.9%) | 0 (0.0%) |
| $800 to $999 | 0 (0.0%) | 0 (0.0%) |
| $1,000 to $1,499 | 40 (21.4%) | 0 (0.0%) |
| $1,500 to $1,999 | 19 (10.2%) | 0 (0.0%) |
| $2,000 to $2,499 | 0 (0.0%) | 0 (0.0%) |
| $2,500 to $2,999 | 0 (0.0%) | 0 (0.0%) |
| $3,000 or more | 0 (0.0%) | 0 (0.0%) |
| Total | 187 (100.0%) | 0 (0.0%) |
Physical Housing Characteristics in Rawlings
Housing Structures in Rawlings
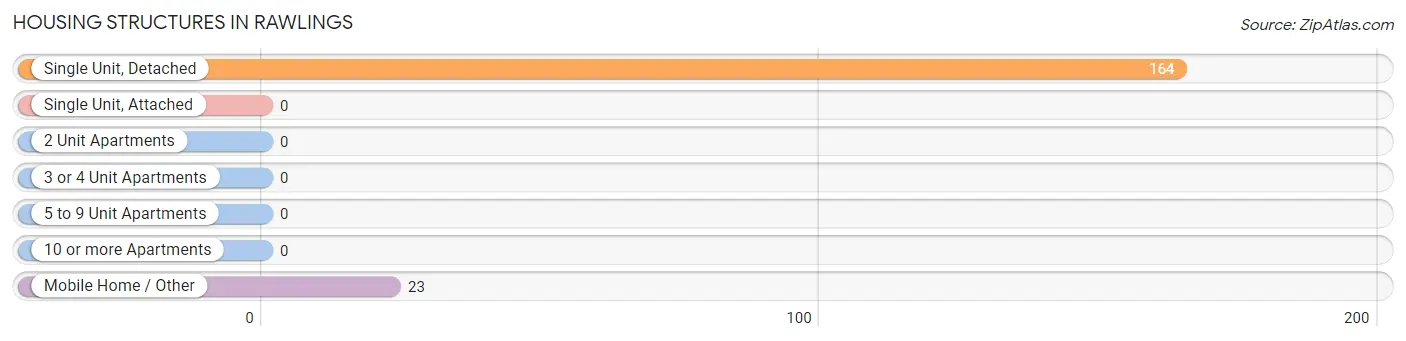
| Structure Type | # Housing Units | % Housing Units |
| Single Unit, Detached | 164 | 87.7% |
| Single Unit, Attached | 0 | 0.0% |
| 2 Unit Apartments | 0 | 0.0% |
| 3 or 4 Unit Apartments | 0 | 0.0% |
| 5 to 9 Unit Apartments | 0 | 0.0% |
| 10 or more Apartments | 0 | 0.0% |
| Mobile Home / Other | 23 | 12.3% |
| Total | 187 | 100.0% |
Housing Structures by Occupancy in Rawlings
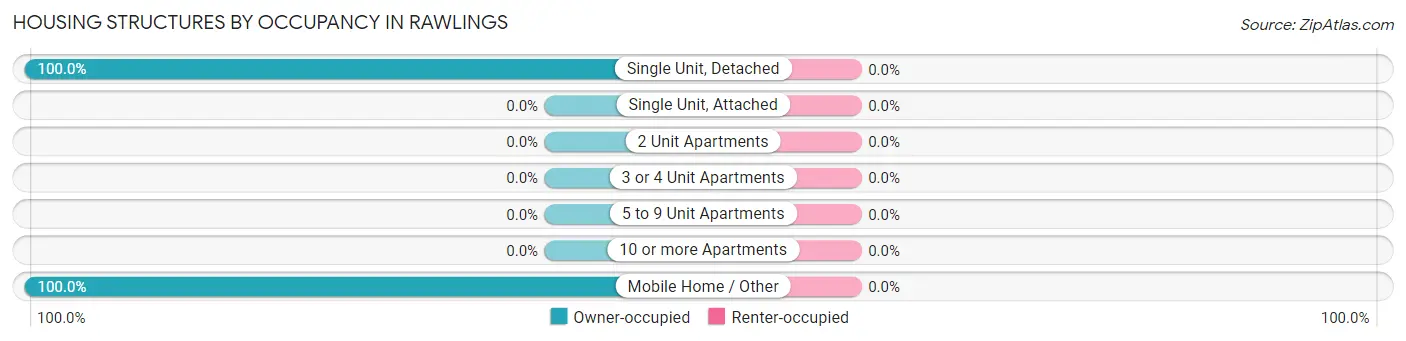
| Structure Type | Owner-occupied | Renter-occupied |
| Single Unit, Detached | 164 (100.0%) | 0 (0.0%) |
| Single Unit, Attached | 0 (0.0%) | 0 (0.0%) |
| 2 Unit Apartments | 0 (0.0%) | 0 (0.0%) |
| 3 or 4 Unit Apartments | 0 (0.0%) | 0 (0.0%) |
| 5 to 9 Unit Apartments | 0 (0.0%) | 0 (0.0%) |
| 10 or more Apartments | 0 (0.0%) | 0 (0.0%) |
| Mobile Home / Other | 23 (100.0%) | 0 (0.0%) |
| Total | 187 (100.0%) | 0 (0.0%) |
Housing Structures by Number of Rooms in Rawlings
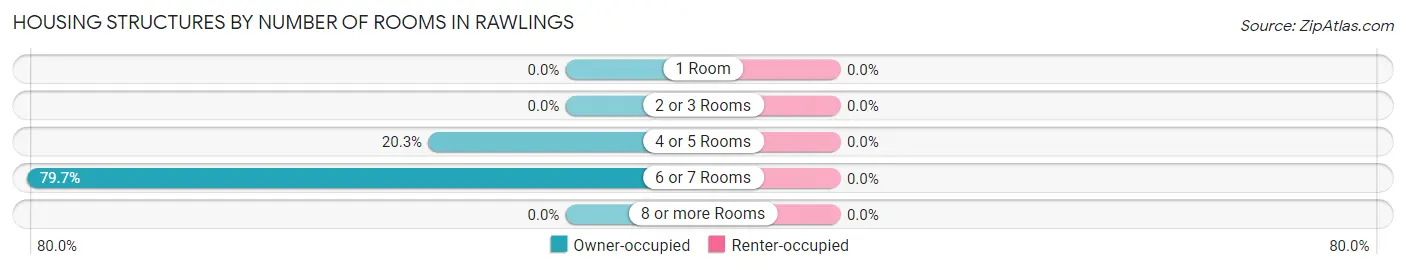
| Number of Rooms | Owner-occupied | Renter-occupied |
| 1 Room | 0 (0.0%) | 0 (0.0%) |
| 2 or 3 Rooms | 0 (0.0%) | 0 (0.0%) |
| 4 or 5 Rooms | 38 (20.3%) | 0 (0.0%) |
| 6 or 7 Rooms | 149 (79.7%) | 0 (0.0%) |
| 8 or more Rooms | 0 (0.0%) | 0 (0.0%) |
| Total | 187 (100.0%) | 0 (0.0%) |
Housing Structure by Heating Type in Rawlings
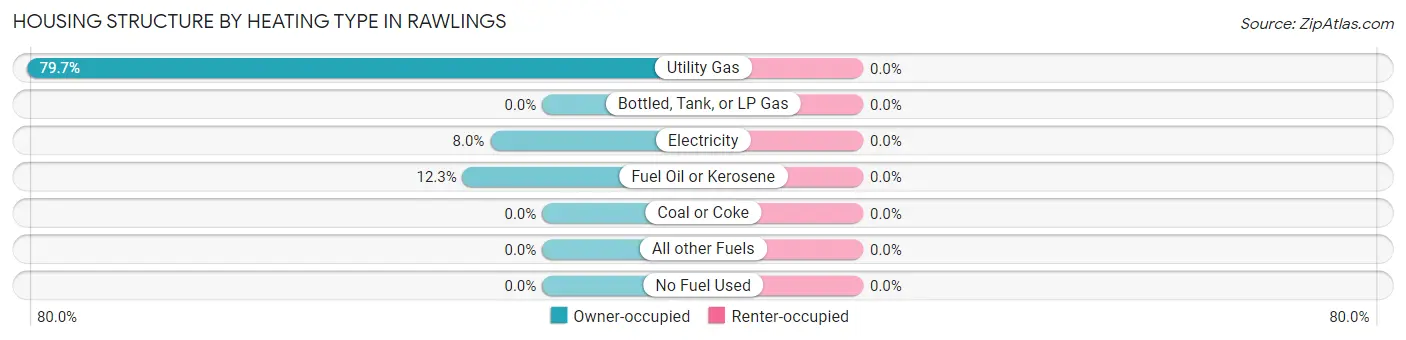
| Heating Type | Owner-occupied | Renter-occupied |
| Utility Gas | 149 (79.7%) | 0 (0.0%) |
| Bottled, Tank, or LP Gas | 0 (0.0%) | 0 (0.0%) |
| Electricity | 15 (8.0%) | 0 (0.0%) |
| Fuel Oil or Kerosene | 23 (12.3%) | 0 (0.0%) |
| Coal or Coke | 0 (0.0%) | 0 (0.0%) |
| All other Fuels | 0 (0.0%) | 0 (0.0%) |
| No Fuel Used | 0 (0.0%) | 0 (0.0%) |
| Total | 187 (100.0%) | 0 (0.0%) |
Household Vehicle Usage in Rawlings
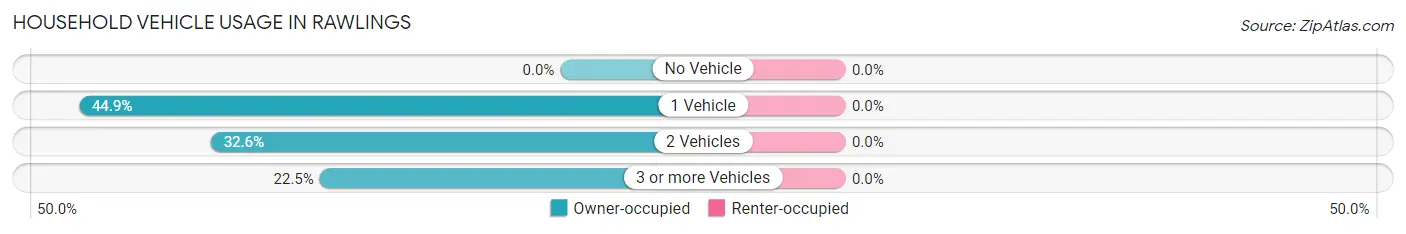
| Vehicles per Household | Owner-occupied | Renter-occupied |
| No Vehicle | 0 (0.0%) | 0 (0.0%) |
| 1 Vehicle | 84 (44.9%) | 0 (0.0%) |
| 2 Vehicles | 61 (32.6%) | 0 (0.0%) |
| 3 or more Vehicles | 42 (22.5%) | 0 (0.0%) |
| Total | 187 (100.0%) | 0 (0.0%) |
Real Estate & Mortgages in Rawlings
Real Estate and Mortgage Overview in Rawlings
| Characteristic | Without Mortgage | With Mortgage |
| Housing Units | 62 | 125 |
| Median Property Value | $136,100 | $0 |
| Median Household Income | - | - |
| Monthly Housing Costs | $444 | $0 |
| Real Estate Taxes | $1,456 | $23 |
Property Value by Mortgage Status in Rawlings
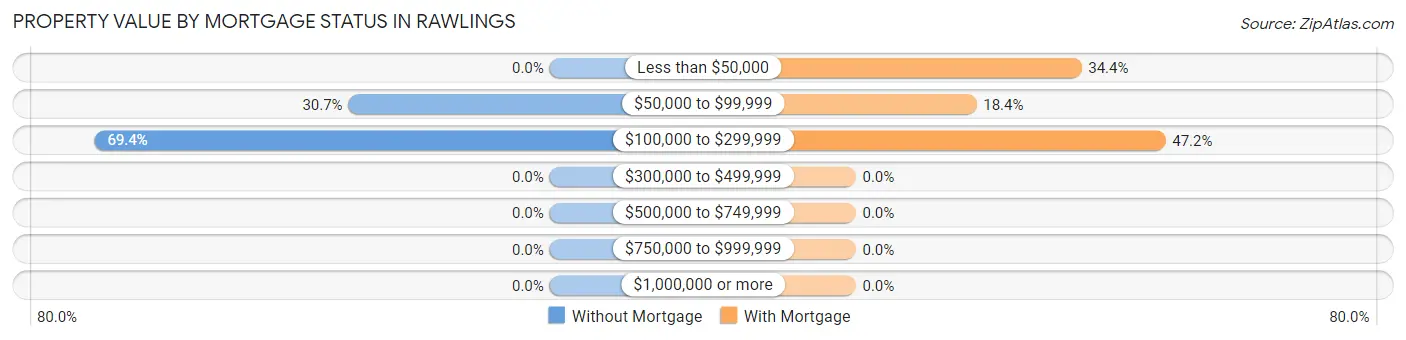
| Property Value | Without Mortgage | With Mortgage |
| Less than $50,000 | 0 (0.0%) | 43 (34.4%) |
| $50,000 to $99,999 | 19 (30.6%) | 23 (18.4%) |
| $100,000 to $299,999 | 43 (69.4%) | 59 (47.2%) |
| $300,000 to $499,999 | 0 (0.0%) | 0 (0.0%) |
| $500,000 to $749,999 | 0 (0.0%) | 0 (0.0%) |
| $750,000 to $999,999 | 0 (0.0%) | 0 (0.0%) |
| $1,000,000 or more | 0 (0.0%) | 0 (0.0%) |
| Total | 62 (100.0%) | 125 (100.0%) |
Household Income by Mortgage Status in Rawlings
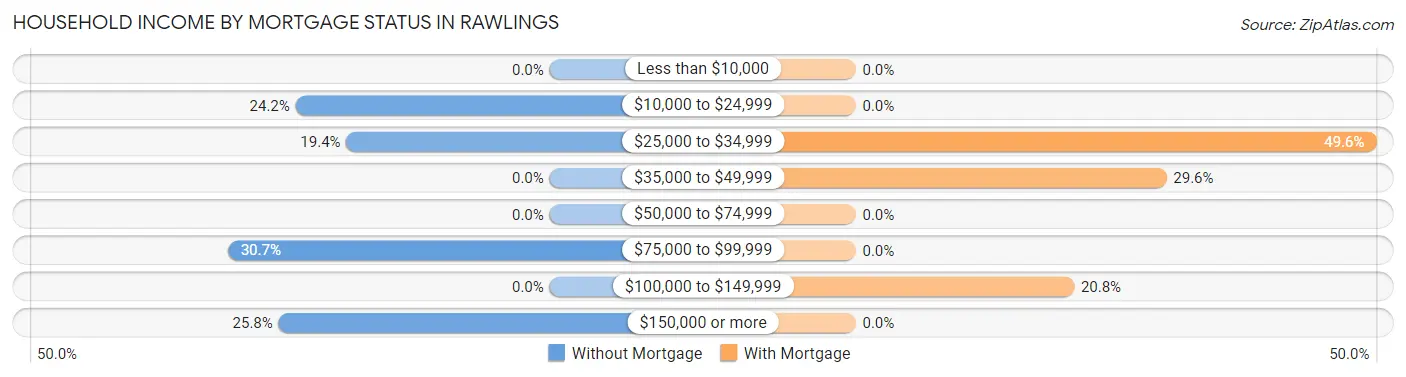
| Household Income | Without Mortgage | With Mortgage |
| Less than $10,000 | 0 (0.0%) | 0 (0.0%) |
| $10,000 to $24,999 | 15 (24.2%) | 0 (0.0%) |
| $25,000 to $34,999 | 12 (19.4%) | 62 (49.6%) |
| $35,000 to $49,999 | 0 (0.0%) | 37 (29.6%) |
| $50,000 to $74,999 | 0 (0.0%) | 0 (0.0%) |
| $75,000 to $99,999 | 19 (30.6%) | 0 (0.0%) |
| $100,000 to $149,999 | 0 (0.0%) | 26 (20.8%) |
| $150,000 or more | 16 (25.8%) | 0 (0.0%) |
| Total | 62 (100.0%) | 125 (100.0%) |
Property Value to Household Income Ratio in Rawlings
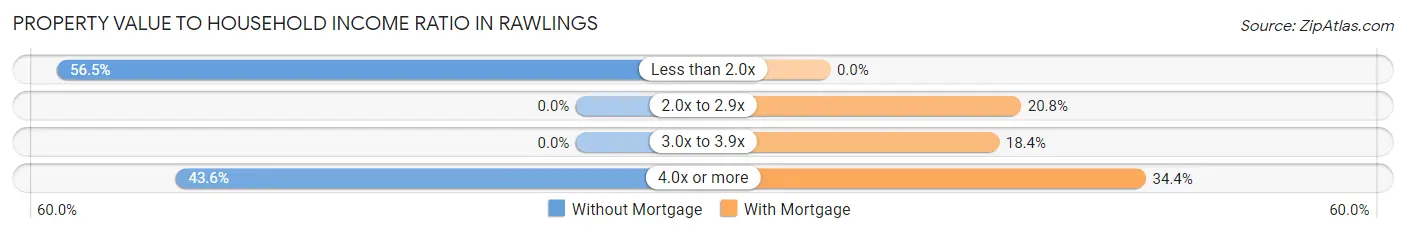
| Value-to-Income Ratio | Without Mortgage | With Mortgage |
| Less than 2.0x | 35 (56.5%) | 0 (0.0%) |
| 2.0x to 2.9x | 0 (0.0%) | 26 (20.8%) |
| 3.0x to 3.9x | 0 (0.0%) | 23 (18.4%) |
| 4.0x or more | 27 (43.5%) | 43 (34.4%) |
| Total | 62 (100.0%) | 125 (100.0%) |
Real Estate Taxes by Mortgage Status in Rawlings
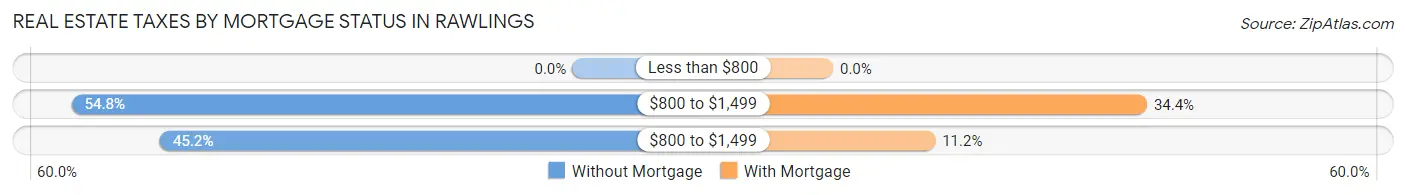
| Property Taxes | Without Mortgage | With Mortgage |
| Less than $800 | 0 (0.0%) | 0 (0.0%) |
| $800 to $1,499 | 34 (54.8%) | 43 (34.4%) |
| $800 to $1,499 | 28 (45.2%) | 14 (11.2%) |
| Total | 62 (100.0%) | 125 (100.0%) |
Health & Disability in Rawlings
Health Insurance Coverage by Age in Rawlings
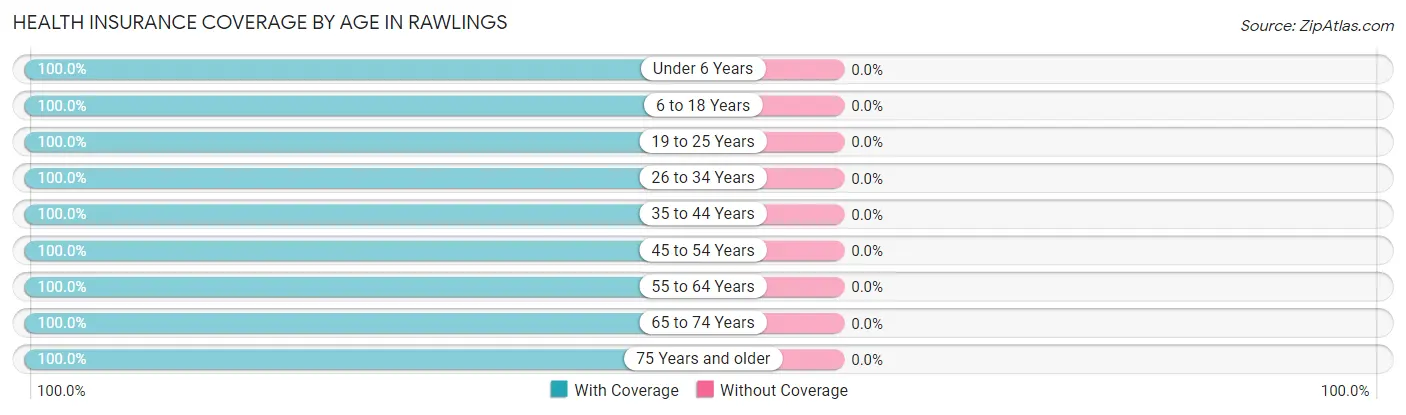
| Age Bracket | With Coverage | Without Coverage |
| Under 6 Years | 18 (100.0%) | 0 (0.0%) |
| 6 to 18 Years | 121 (100.0%) | 0 (0.0%) |
| 19 to 25 Years | 16 (100.0%) | 0 (0.0%) |
| 26 to 34 Years | 71 (100.0%) | 0 (0.0%) |
| 35 to 44 Years | 69 (100.0%) | 0 (0.0%) |
| 45 to 54 Years | 59 (100.0%) | 0 (0.0%) |
| 55 to 64 Years | 12 (100.0%) | 0 (0.0%) |
| 65 to 74 Years | 15 (100.0%) | 0 (0.0%) |
| 75 Years and older | 57 (100.0%) | 0 (0.0%) |
| Total | 438 (100.0%) | 0 (0.0%) |
Health Insurance Coverage by Citizenship Status in Rawlings
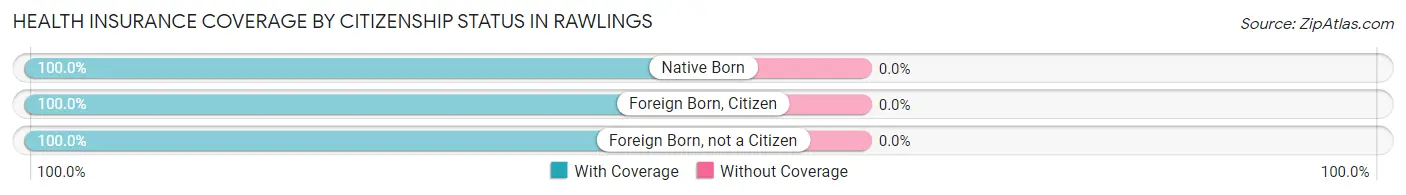
| Citizenship Status | With Coverage | Without Coverage |
| Native Born | 18 (100.0%) | 0 (0.0%) |
| Foreign Born, Citizen | 121 (100.0%) | 0 (0.0%) |
| Foreign Born, not a Citizen | 16 (100.0%) | 0 (0.0%) |
Health Insurance Coverage by Household Income in Rawlings
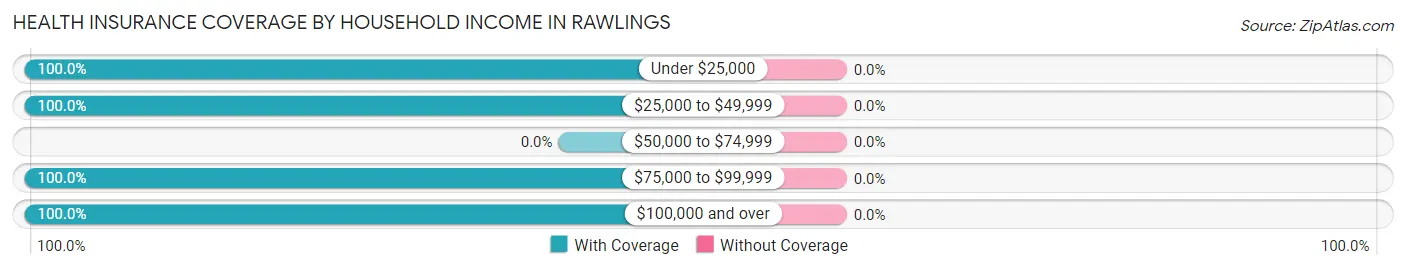
| Household Income | With Coverage | Without Coverage |
| Under $25,000 | 77 (100.0%) | 0 (0.0%) |
| $25,000 to $49,999 | 108 (100.0%) | 0 (0.0%) |
| $50,000 to $74,999 | 0 (0.0%) | 0 (0.0%) |
| $75,000 to $99,999 | 209 (100.0%) | 0 (0.0%) |
| $100,000 and over | 44 (100.0%) | 0 (0.0%) |
Public vs Private Health Insurance Coverage by Age in Rawlings
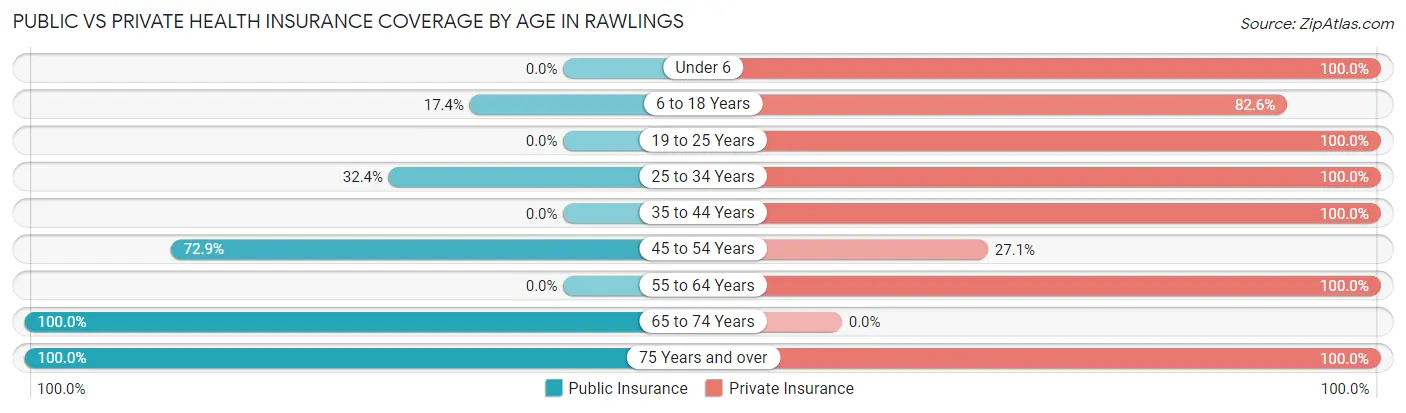
| Age Bracket | Public Insurance | Private Insurance |
| Under 6 | 0 (0.0%) | 18 (100.0%) |
| 6 to 18 Years | 21 (17.4%) | 100 (82.6%) |
| 19 to 25 Years | 0 (0.0%) | 16 (100.0%) |
| 25 to 34 Years | 23 (32.4%) | 71 (100.0%) |
| 35 to 44 Years | 0 (0.0%) | 69 (100.0%) |
| 45 to 54 Years | 43 (72.9%) | 16 (27.1%) |
| 55 to 64 Years | 0 (0.0%) | 12 (100.0%) |
| 65 to 74 Years | 15 (100.0%) | 0 (0.0%) |
| 75 Years and over | 57 (100.0%) | 57 (100.0%) |
| Total | 159 (36.3%) | 359 (82.0%) |
Disability Status by Sex by Age in Rawlings
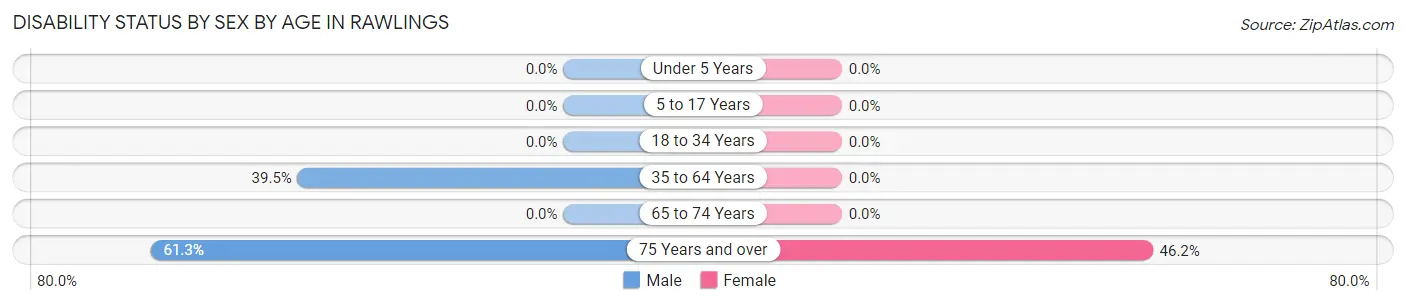
| Age Bracket | Male | Female |
| Under 5 Years | 0 (0.0%) | 0 (0.0%) |
| 5 to 17 Years | 0 (0.0%) | 0 (0.0%) |
| 18 to 34 Years | 0 (0.0%) | 0 (0.0%) |
| 35 to 64 Years | 43 (39.5%) | 0 (0.0%) |
| 65 to 74 Years | 0 (0.0%) | 0 (0.0%) |
| 75 Years and over | 19 (61.3%) | 12 (46.2%) |
Disability Class by Sex by Age in Rawlings
Disability Class: Hearing Difficulty
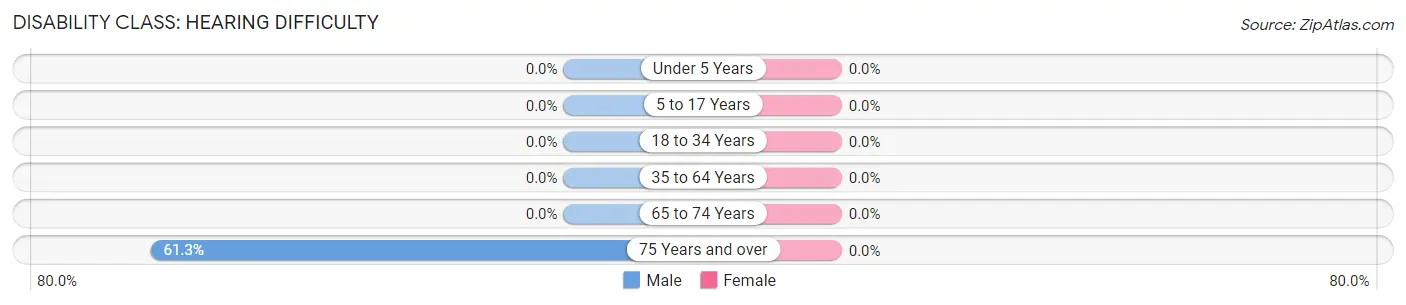
| Age Bracket | Male | Female |
| Under 5 Years | 0 (0.0%) | 0 (0.0%) |
| 5 to 17 Years | 0 (0.0%) | 0 (0.0%) |
| 18 to 34 Years | 0 (0.0%) | 0 (0.0%) |
| 35 to 64 Years | 0 (0.0%) | 0 (0.0%) |
| 65 to 74 Years | 0 (0.0%) | 0 (0.0%) |
| 75 Years and over | 19 (61.3%) | 0 (0.0%) |
Disability Class: Vision Difficulty
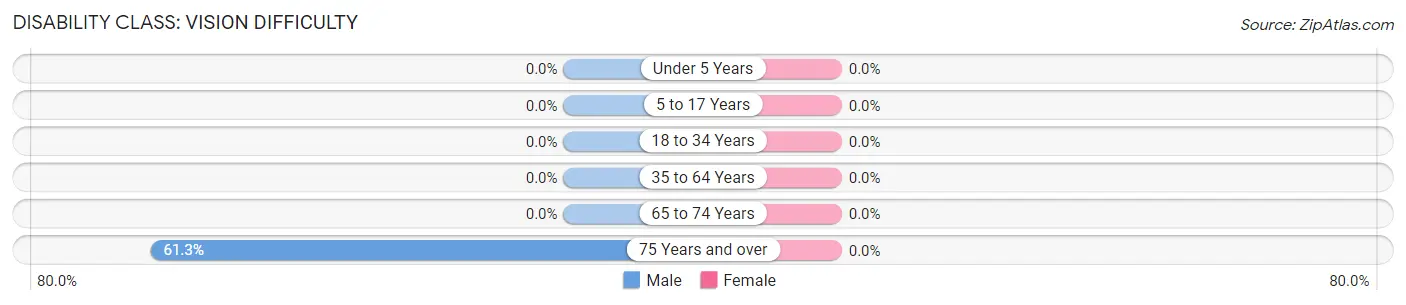
| Age Bracket | Male | Female |
| Under 5 Years | 0 (0.0%) | 0 (0.0%) |
| 5 to 17 Years | 0 (0.0%) | 0 (0.0%) |
| 18 to 34 Years | 0 (0.0%) | 0 (0.0%) |
| 35 to 64 Years | 0 (0.0%) | 0 (0.0%) |
| 65 to 74 Years | 0 (0.0%) | 0 (0.0%) |
| 75 Years and over | 19 (61.3%) | 0 (0.0%) |
Disability Class: Cognitive Difficulty
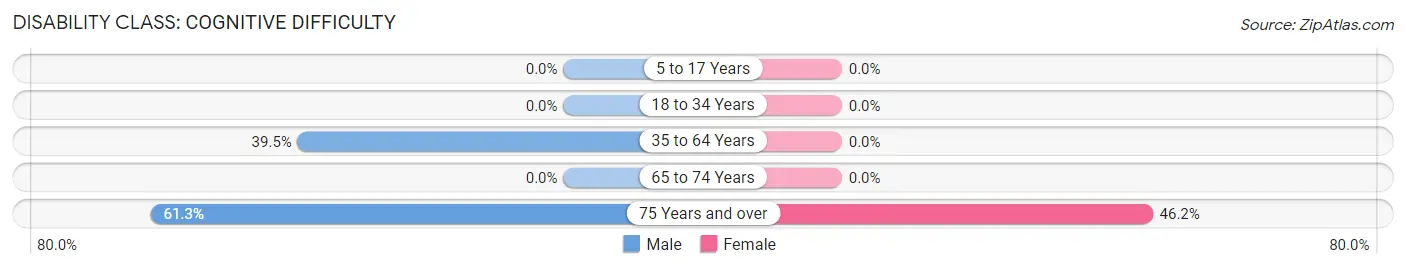
| Age Bracket | Male | Female |
| 5 to 17 Years | 0 (0.0%) | 0 (0.0%) |
| 18 to 34 Years | 0 (0.0%) | 0 (0.0%) |
| 35 to 64 Years | 43 (39.5%) | 0 (0.0%) |
| 65 to 74 Years | 0 (0.0%) | 0 (0.0%) |
| 75 Years and over | 19 (61.3%) | 12 (46.2%) |
Disability Class: Ambulatory Difficulty
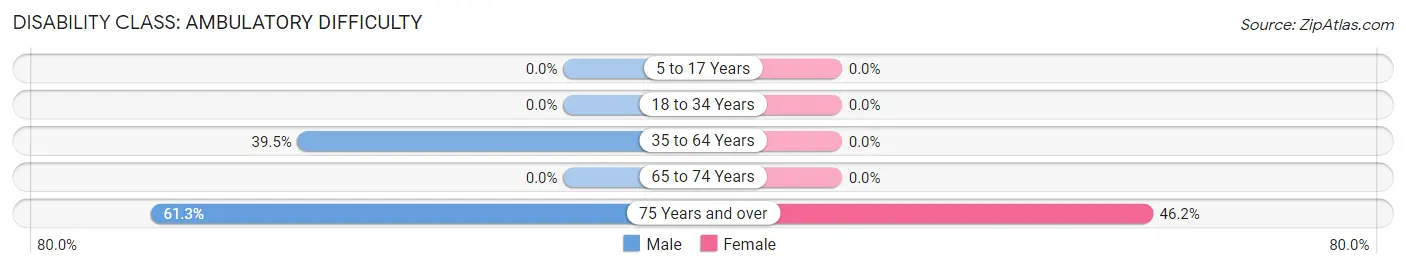
| Age Bracket | Male | Female |
| 5 to 17 Years | 0 (0.0%) | 0 (0.0%) |
| 18 to 34 Years | 0 (0.0%) | 0 (0.0%) |
| 35 to 64 Years | 43 (39.5%) | 0 (0.0%) |
| 65 to 74 Years | 0 (0.0%) | 0 (0.0%) |
| 75 Years and over | 19 (61.3%) | 12 (46.2%) |
Disability Class: Self-Care Difficulty
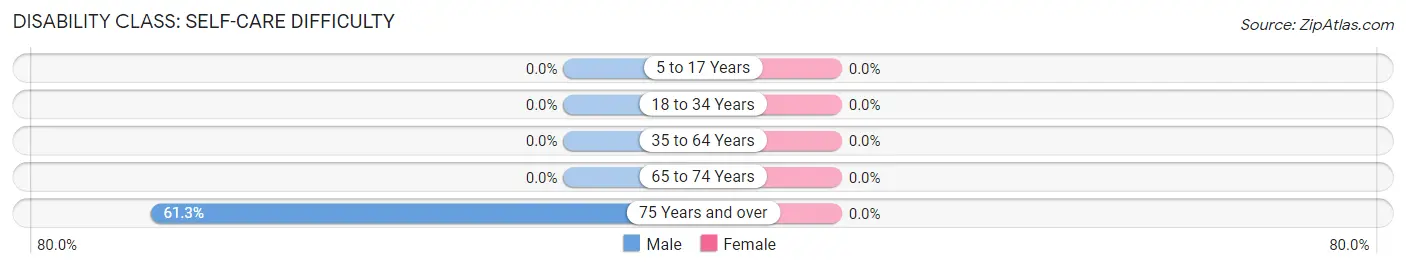
| Age Bracket | Male | Female |
| 5 to 17 Years | 0 (0.0%) | 0 (0.0%) |
| 18 to 34 Years | 0 (0.0%) | 0 (0.0%) |
| 35 to 64 Years | 0 (0.0%) | 0 (0.0%) |
| 65 to 74 Years | 0 (0.0%) | 0 (0.0%) |
| 75 Years and over | 19 (61.3%) | 0 (0.0%) |
Technology Access in Rawlings
Computing Device Access in Rawlings
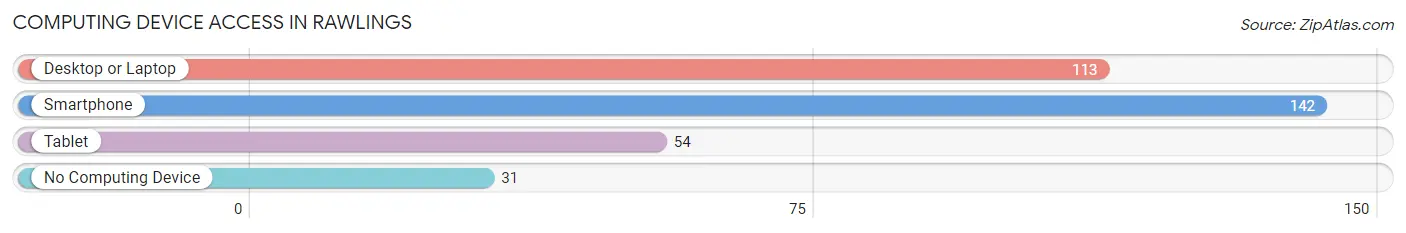
| Device Type | # Households | % Households |
| Desktop or Laptop | 113 | 60.4% |
| Smartphone | 142 | 75.9% |
| Tablet | 54 | 28.9% |
| No Computing Device | 31 | 16.6% |
| Total | 187 | 100.0% |
Internet Access in Rawlings
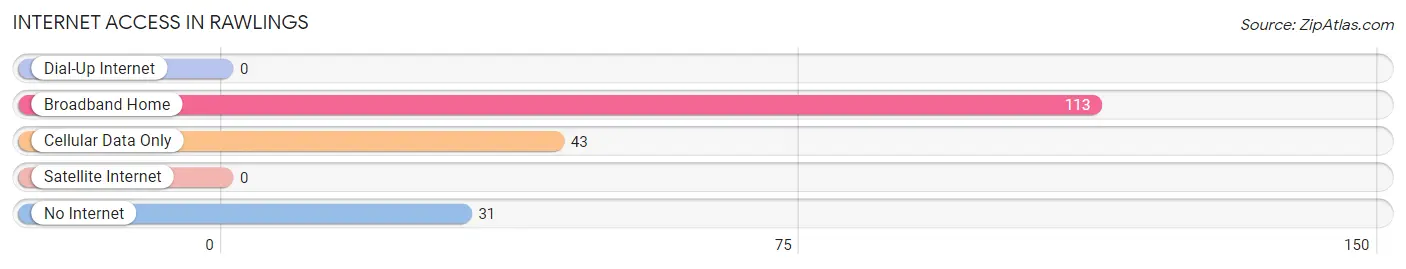
| Internet Type | # Households | % Households |
| Dial-Up Internet | 0 | 0.0% |
| Broadband Home | 113 | 60.4% |
| Cellular Data Only | 43 | 23.0% |
| Satellite Internet | 0 | 0.0% |
| No Internet | 31 | 16.6% |
| Total | 187 | 100.0% |
Rawlings Summary
History
Rawlings, Maryland is a small town located in Allegany County, Maryland. It was founded in 1872 by William Rawlings, a local farmer. The town was originally known as Rawlingsville, but the name was changed to Rawlings in 1887.
The town was a small farming community until the early 1900s when the Baltimore and Ohio Railroad (B&O) built a line through the area. This allowed for the development of the town and the growth of the local economy. The railroad brought in new businesses and industries, such as a sawmill, a brickyard, and a coal mine.
The town continued to grow throughout the 20th century, and by the 1950s, it had become a thriving community with a population of over 1,000 people. The town was home to several businesses, including a grocery store, a hardware store, a bank, and a movie theater.
In the late 1960s, the town began to decline as the railroad industry began to decline. The town’s population decreased and many businesses closed. In the 1980s, the town began to experience a resurgence as new businesses opened and the population began to increase.
Today, Rawlings is a small town with a population of around 1,500 people. It is a quiet, rural community with a strong sense of community and a rich history.
Geography
Rawlings is located in Allegany County, Maryland. It is situated in the Appalachian Mountains, near the Potomac River. The town is surrounded by rolling hills and forests, and is located about 30 miles from Cumberland, Maryland.
The town is located at an elevation of 1,400 feet above sea level. The climate is temperate, with hot summers and cold winters. The average annual temperature is around 50 degrees Fahrenheit.
Economy
The economy of Rawlings is largely based on agriculture and tourism. The town is home to several farms, which produce a variety of crops, including corn, soybeans, and hay. The town also has several small businesses, including a grocery store, a hardware store, and a bank.
The town is also a popular tourist destination. It is home to several historic sites, including the Rawlings Historic District, which is listed on the National Register of Historic Places. The town also has several parks and recreational areas, including the Rawlings Lake Park.
Demographics
As of the 2010 census, the population of Rawlings was 1,521. The racial makeup of the town was 95.3% White, 1.2% African American, 0.3% Native American, 0.3% Asian, 0.1% Pacific Islander, and 2.8% from other races. The median household income was $37,917, and the median family income was $45,938.
The town is home to several churches, including the First Baptist Church of Rawlings, the Rawlings United Methodist Church, and the Rawlings Presbyterian Church. The town also has a public library, a post office, and a fire department.
Conclusion
Rawlings, Maryland is a small town located in Allegany County, Maryland. It was founded in 1872 and has a population of around 1,500 people. The town is largely based on agriculture and tourism, and is home to several historic sites and recreational areas. The town has a strong sense of community and a rich history.
Common Questions
What is Per Capita Income in Rawlings?
Per Capita income in Rawlings is $22,980.
What is the Median Family Income in Rawlings?
Median Family Income in Rawlings is $84,211.
What is the Median Household income in Rawlings?
Median Household Income in Rawlings is $32,679.
What is Inequality or Gini Index in Rawlings?
Inequality or Gini Index in Rawlings is 0.48.
What is the Total Population of Rawlings?
Total Population of Rawlings is 438.
What is the Total Male Population of Rawlings?
Total Male Population of Rawlings is 212.
What is the Total Female Population of Rawlings?
Total Female Population of Rawlings is 226.
What is the Ratio of Males per 100 Females in Rawlings?
There are 93.81 Males per 100 Females in Rawlings.
What is the Ratio of Females per 100 Males in Rawlings?
There are 106.60 Females per 100 Males in Rawlings.
What is the Median Population Age in Rawlings?
Median Population Age in Rawlings is 33.7 Years.
What is the Average Family Size in Rawlings
Average Family Size in Rawlings is 3.6 People.
What is the Average Household Size in Rawlings
Average Household Size in Rawlings is 2.3 People.
How Large is the Labor Force in Rawlings?
There are 161 People in the Labor Forcein in Rawlings.
What is the Percentage of People in the Labor Force in Rawlings?
49.1% of People are in the Labor Force in Rawlings.