Corriganville, MD Map & Demographics
Corriganville Map
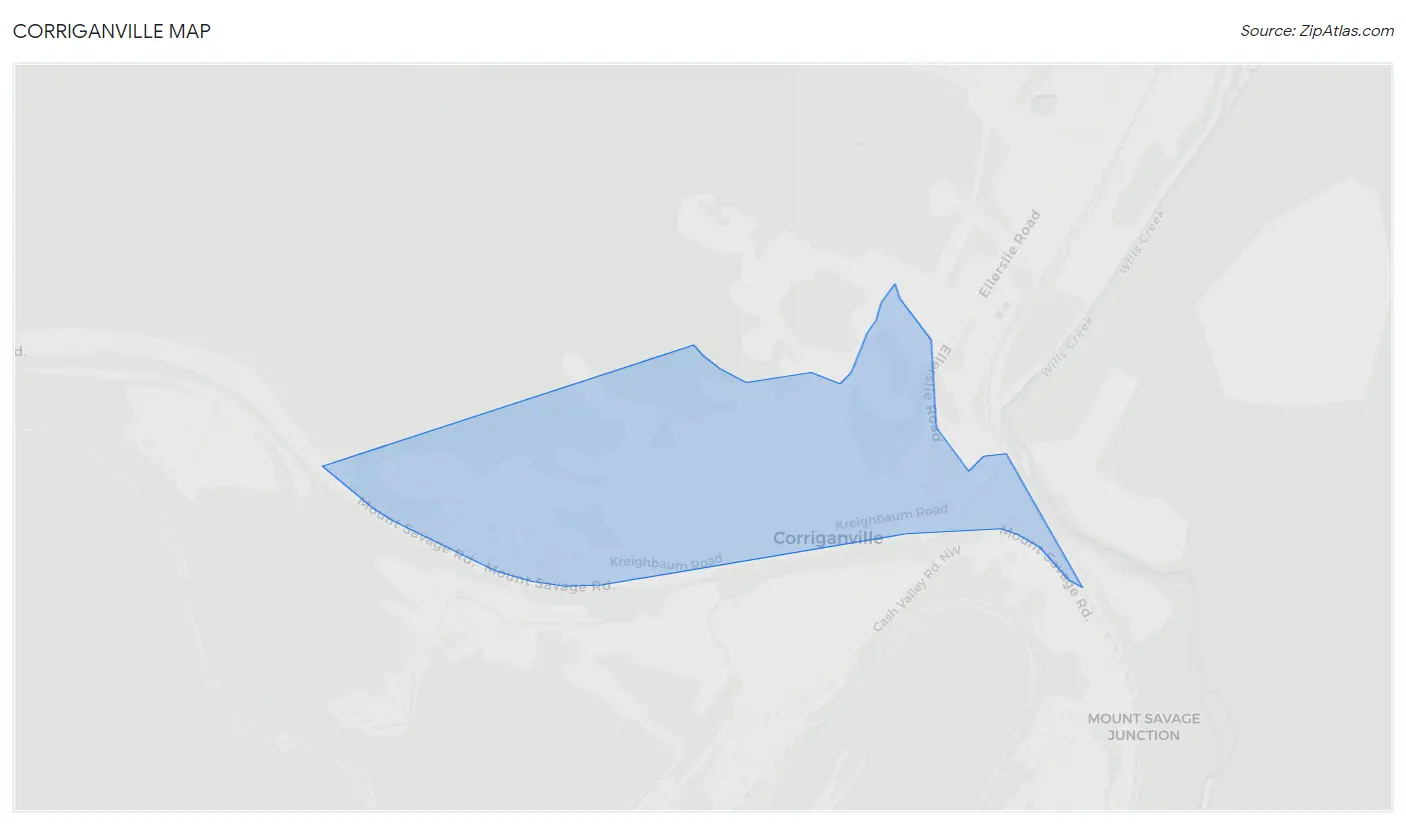
Corriganville Overview
$22,559
PER CAPITA INCOME
$60,110
AVG FAMILY INCOME
$43,235
AVG HOUSEHOLD INCOME
1.2%
WAGE / INCOME GAP [ % ]
98.8¢/ $1
WAGE / INCOME GAP [ $ ]
0.36
INEQUALITY / GINI INDEX
717
TOTAL POPULATION
278
MALE POPULATION
439
FEMALE POPULATION
63.33
MALES / 100 FEMALES
157.91
FEMALES / 100 MALES
36.8
MEDIAN AGE
2.9
AVG FAMILY SIZE
2.8
AVG HOUSEHOLD SIZE
264
LABOR FORCE [ PEOPLE ]
49.7%
PERCENT IN LABOR FORCE
Corriganville Zip Codes
Corriganville Area Codes
Income in Corriganville
Income Overview in Corriganville
Per Capita Income in Corriganville is $22,559, while median incomes of families and households are $60,110 and $43,235 respectively.
| Characteristic | Number | Measure |
| Per Capita Income | 717 | $22,559 |
| Median Family Income | 203 | $60,110 |
| Mean Family Income | 203 | $66,090 |
| Median Household Income | 258 | $43,235 |
| Mean Household Income | 258 | $62,529 |
| Income Deficit | 203 | $0 |
| Wage / Income Gap (%) | 717 | 1.21% |
| Wage / Income Gap ($) | 717 | 98.79¢ per $1 |
| Gini / Inequality Index | 717 | 0.36 |
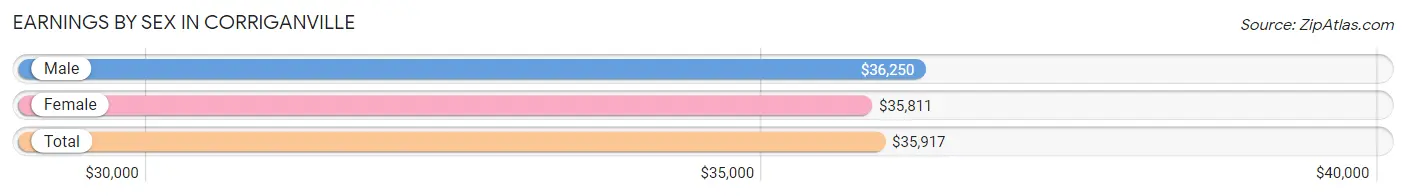
Earnings by Sex in Corriganville
Average Earnings in Corriganville are $35,917, $36,250 for men and $35,811 for women, a difference of 1.2%.
| Sex | Number | Average Earnings |
| Male | 140 (49.8%) | $36,250 |
| Female | 141 (50.2%) | $35,811 |
| Total | 281 (100.0%) | $35,917 |
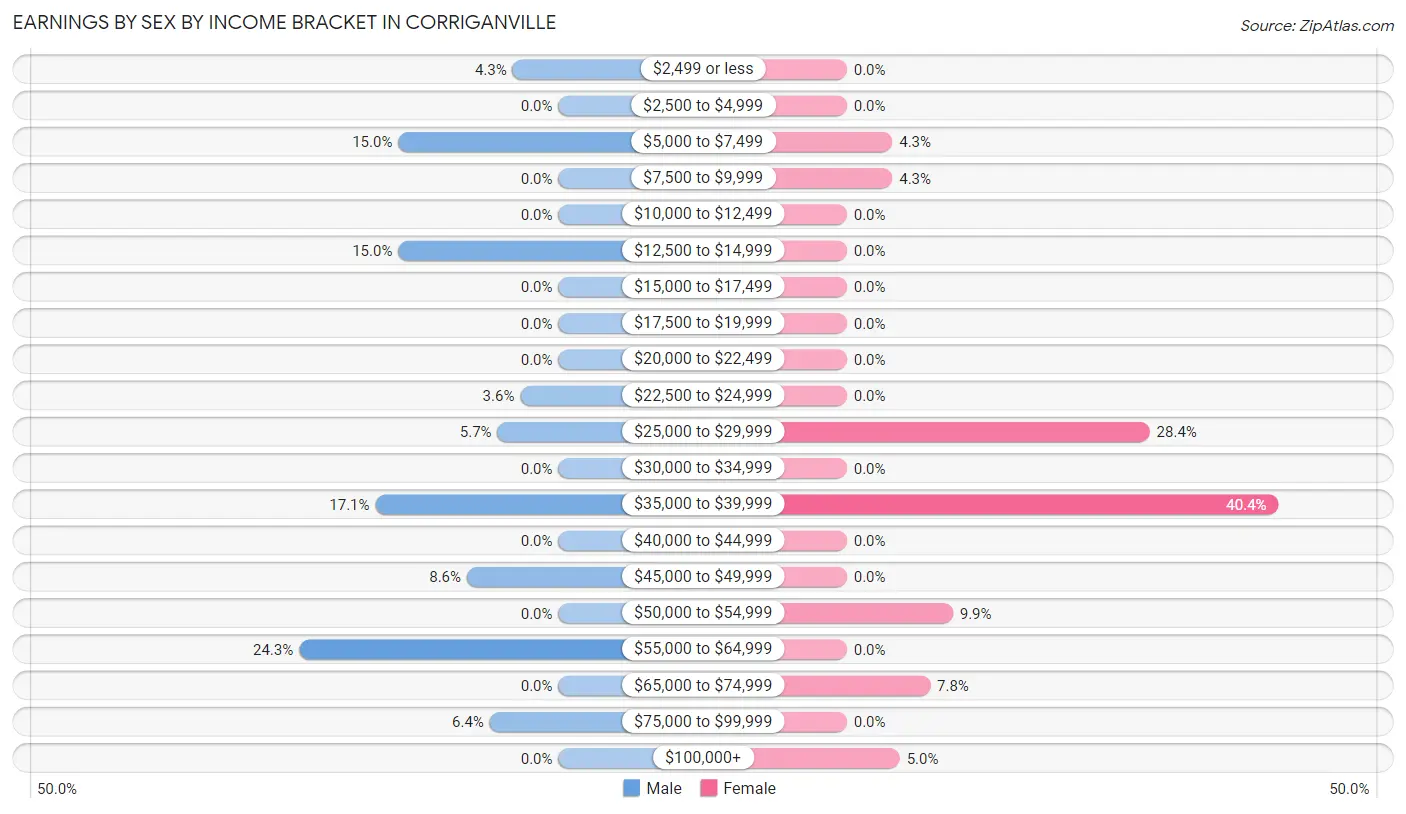
Earnings by Sex by Income Bracket in Corriganville
The most common earnings brackets in Corriganville are $55,000 to $64,999 for men (34 | 24.3%) and $35,000 to $39,999 for women (57 | 40.4%).
| Income | Male | Female |
| $2,499 or less | 6 (4.3%) | 0 (0.0%) |
| $2,500 to $4,999 | 0 (0.0%) | 0 (0.0%) |
| $5,000 to $7,499 | 21 (15.0%) | 6 (4.3%) |
| $7,500 to $9,999 | 0 (0.0%) | 6 (4.3%) |
| $10,000 to $12,499 | 0 (0.0%) | 0 (0.0%) |
| $12,500 to $14,999 | 21 (15.0%) | 0 (0.0%) |
| $15,000 to $17,499 | 0 (0.0%) | 0 (0.0%) |
| $17,500 to $19,999 | 0 (0.0%) | 0 (0.0%) |
| $20,000 to $22,499 | 0 (0.0%) | 0 (0.0%) |
| $22,500 to $24,999 | 5 (3.6%) | 0 (0.0%) |
| $25,000 to $29,999 | 8 (5.7%) | 40 (28.4%) |
| $30,000 to $34,999 | 0 (0.0%) | 0 (0.0%) |
| $35,000 to $39,999 | 24 (17.1%) | 57 (40.4%) |
| $40,000 to $44,999 | 0 (0.0%) | 0 (0.0%) |
| $45,000 to $49,999 | 12 (8.6%) | 0 (0.0%) |
| $50,000 to $54,999 | 0 (0.0%) | 14 (9.9%) |
| $55,000 to $64,999 | 34 (24.3%) | 0 (0.0%) |
| $65,000 to $74,999 | 0 (0.0%) | 11 (7.8%) |
| $75,000 to $99,999 | 9 (6.4%) | 0 (0.0%) |
| $100,000+ | 0 (0.0%) | 7 (5.0%) |
| Total | 140 (100.0%) | 141 (100.0%) |
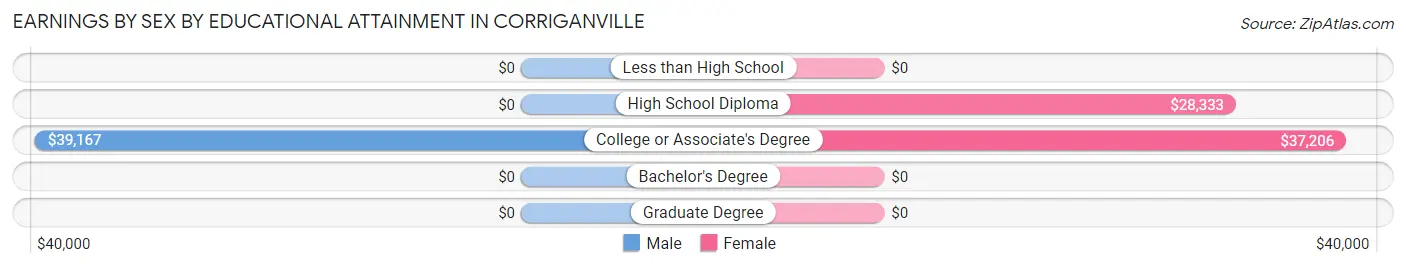
Earnings by Sex by Educational Attainment in Corriganville
Average earnings in Corriganville are $36,250 for men and $29,896 for women, a difference of 17.5%. Men with an educational attainment of college or associate's degree enjoy the highest average annual earnings of $39,167, while those with college or associate's degree education earn the least with $39,167. Women with an educational attainment of college or associate's degree earn the most with the average annual earnings of $37,206, while those with high school diploma education have the smallest earnings of $28,333.
| Educational Attainment | Male Income | Female Income |
| Less than High School | - | - |
| High School Diploma | - | - |
| College or Associate's Degree | $39,167 | $37,206 |
| Bachelor's Degree | - | - |
| Graduate Degree | - | - |
| Total | $36,250 | $29,896 |
Family Income in Corriganville
Family Income Brackets in Corriganville
According to the Corriganville family income data, there are 59 families falling into the $35,000 to $49,999 income range, which is the most common income bracket and makes up 29.1% of all families.
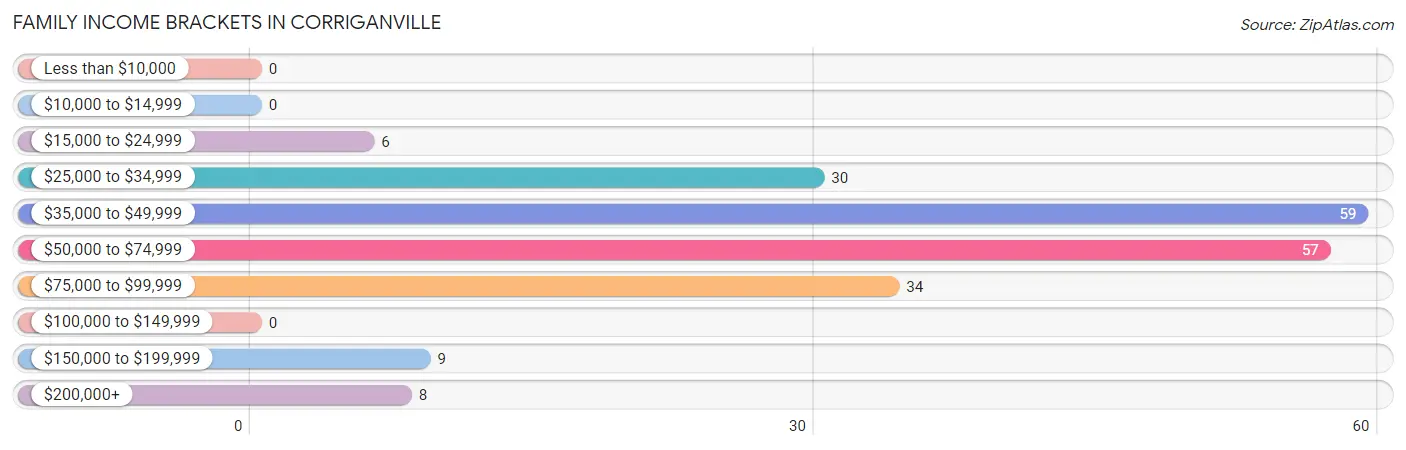
| Income Bracket | # Families | % Families |
| Less than $10,000 | 0 | 0.0% |
| $10,000 to $14,999 | 0 | 0.0% |
| $15,000 to $24,999 | 6 | 3.0% |
| $25,000 to $34,999 | 30 | 14.8% |
| $35,000 to $49,999 | 59 | 29.1% |
| $50,000 to $74,999 | 57 | 28.1% |
| $75,000 to $99,999 | 34 | 16.7% |
| $100,000 to $149,999 | 0 | 0.0% |
| $150,000 to $199,999 | 9 | 4.4% |
| $200,000+ | 8 | 3.9% |
Family Income by Famaliy Size in Corriganville
2-person families (121 | 59.6%) account for the highest median family income in Corriganville with $60,551 per family, while 2-person families (121 | 59.6%) have the highest median income of $30,276 per family member.
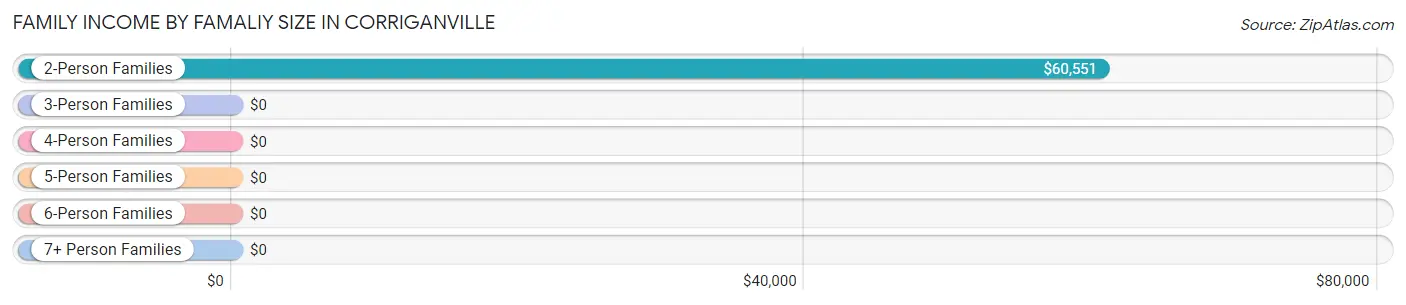
| Income Bracket | # Families | Median Income |
| 2-Person Families | 121 (59.6%) | $60,551 |
| 3-Person Families | 30 (14.8%) | $0 |
| 4-Person Families | 18 (8.9%) | $0 |
| 5-Person Families | 12 (5.9%) | $0 |
| 6-Person Families | 22 (10.8%) | $0 |
| 7+ Person Families | 0 (0.0%) | $0 |
| Total | 203 (100.0%) | $60,110 |
Family Income by Number of Earners in Corriganville
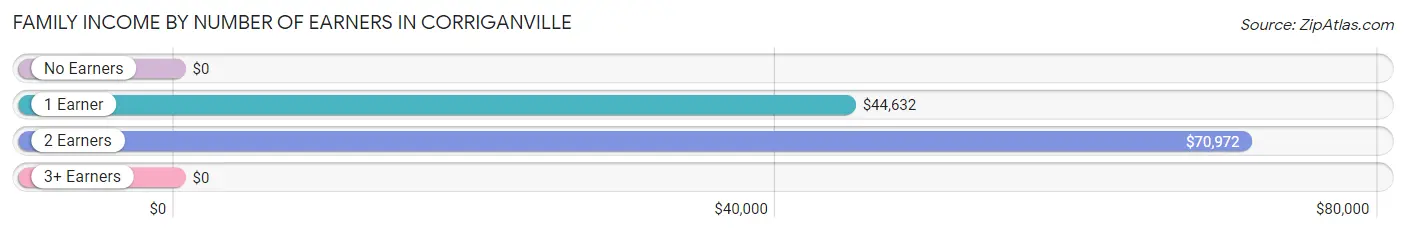
| Number of Earners | # Families | Median Income |
| No Earners | 38 (18.7%) | $0 |
| 1 Earner | 97 (47.8%) | $44,632 |
| 2 Earners | 68 (33.5%) | $70,972 |
| 3+ Earners | 0 (0.0%) | $0 |
| Total | 203 (100.0%) | $60,110 |
Household Income in Corriganville
Household Income Brackets in Corriganville
With 68 households falling in the category, the $75,000 to $99,999 income range is the most frequent in Corriganville, accounting for 26.4% of all households.
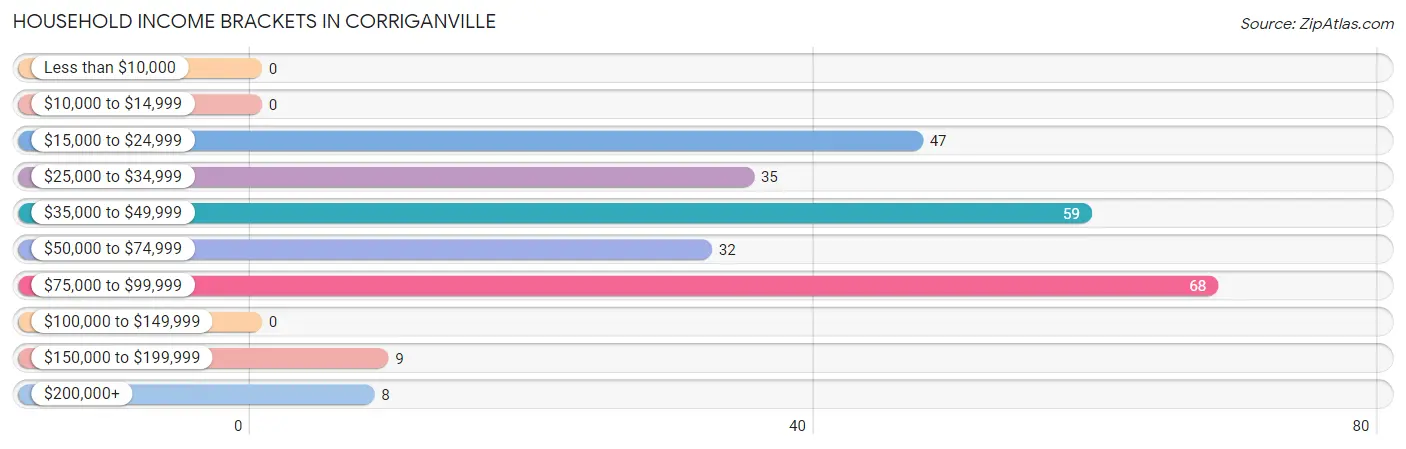
| Income Bracket | # Households | % Households |
| Less than $10,000 | 0 | 0.0% |
| $10,000 to $14,999 | 0 | 0.0% |
| $15,000 to $24,999 | 47 | 18.2% |
| $25,000 to $34,999 | 35 | 13.6% |
| $35,000 to $49,999 | 59 | 22.9% |
| $50,000 to $74,999 | 32 | 12.4% |
| $75,000 to $99,999 | 68 | 26.4% |
| $100,000 to $149,999 | 0 | 0.0% |
| $150,000 to $199,999 | 9 | 3.5% |
| $200,000+ | 8 | 3.1% |
Household Income by Householder Age in Corriganville
The median household income in Corriganville is $43,235, with the highest median household income of $95,074 found in the 25 to 44 years age bracket for the primary householder. A total of 84 households (32.6%) fall into this category.
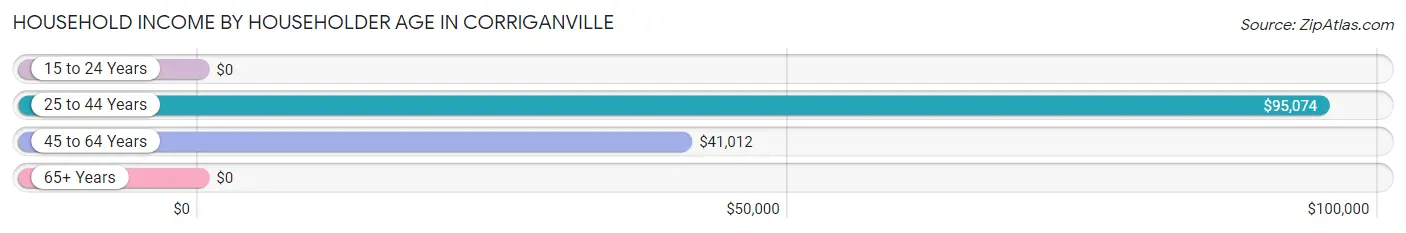
| Income Bracket | # Households | Median Income |
| 15 to 24 Years | 0 (0.0%) | $0 |
| 25 to 44 Years | 84 (32.6%) | $95,074 |
| 45 to 64 Years | 83 (32.2%) | $41,012 |
| 65+ Years | 91 (35.3%) | $0 |
| Total | 258 (100.0%) | $43,235 |
Poverty in Corriganville
Income Below Poverty by Sex and Age in Corriganville
With 25.5% poverty level for males and 27.6% for females among the residents of Corriganville, 18 to 24 year old males and 12 to 14 year old females are the most vulnerable to poverty, with 12 males (100.0%) and 5 females (100.0%) in their respective age groups living below the poverty level.
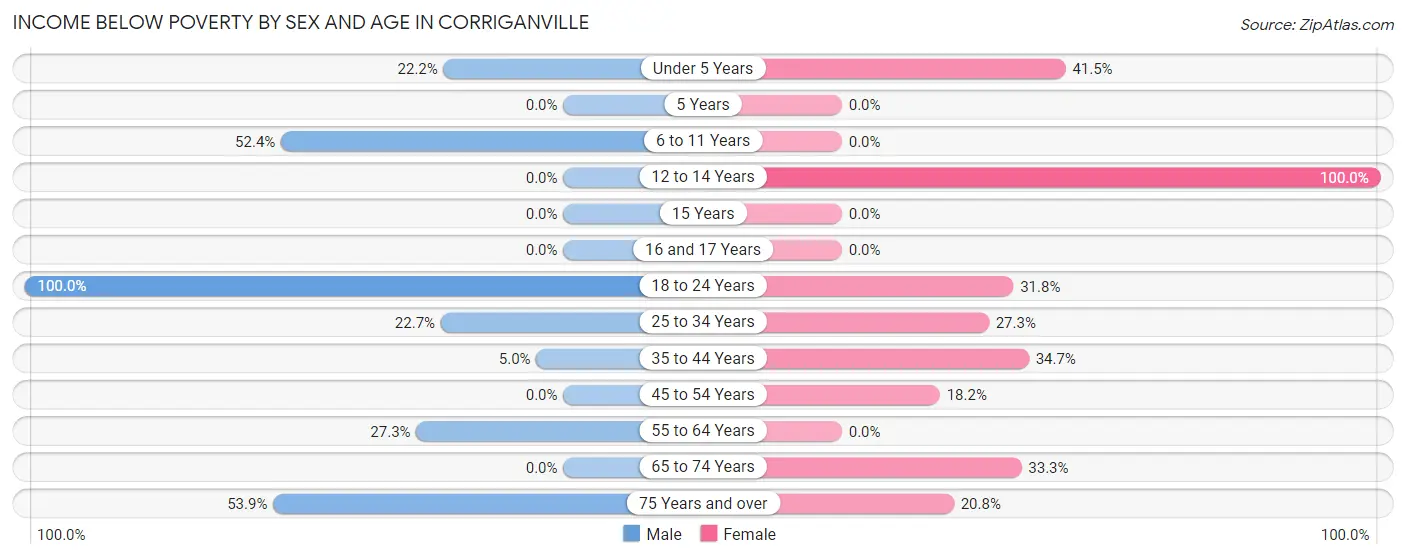
| Age Bracket | Male | Female |
| Under 5 Years | 4 (22.2%) | 44 (41.5%) |
| 5 Years | 0 (0.0%) | 0 (0.0%) |
| 6 to 11 Years | 22 (52.4%) | 0 (0.0%) |
| 12 to 14 Years | 0 (0.0%) | 5 (100.0%) |
| 15 Years | 0 (0.0%) | 0 (0.0%) |
| 16 and 17 Years | 0 (0.0%) | 0 (0.0%) |
| 18 to 24 Years | 12 (100.0%) | 21 (31.8%) |
| 25 to 34 Years | 10 (22.7%) | 6 (27.3%) |
| 35 to 44 Years | 3 (5.0%) | 17 (34.7%) |
| 45 to 54 Years | 0 (0.0%) | 6 (18.2%) |
| 55 to 64 Years | 6 (27.3%) | 0 (0.0%) |
| 65 to 74 Years | 0 (0.0%) | 6 (33.3%) |
| 75 Years and over | 14 (53.8%) | 16 (20.8%) |
| Total | 71 (25.5%) | 121 (27.6%) |
Income Above Poverty by Sex and Age in Corriganville
According to the poverty statistics in Corriganville, males aged 45 to 54 years and females aged 5 years are the age groups that are most secure financially, with 100.0% of males and 100.0% of females in these age groups living above the poverty line.
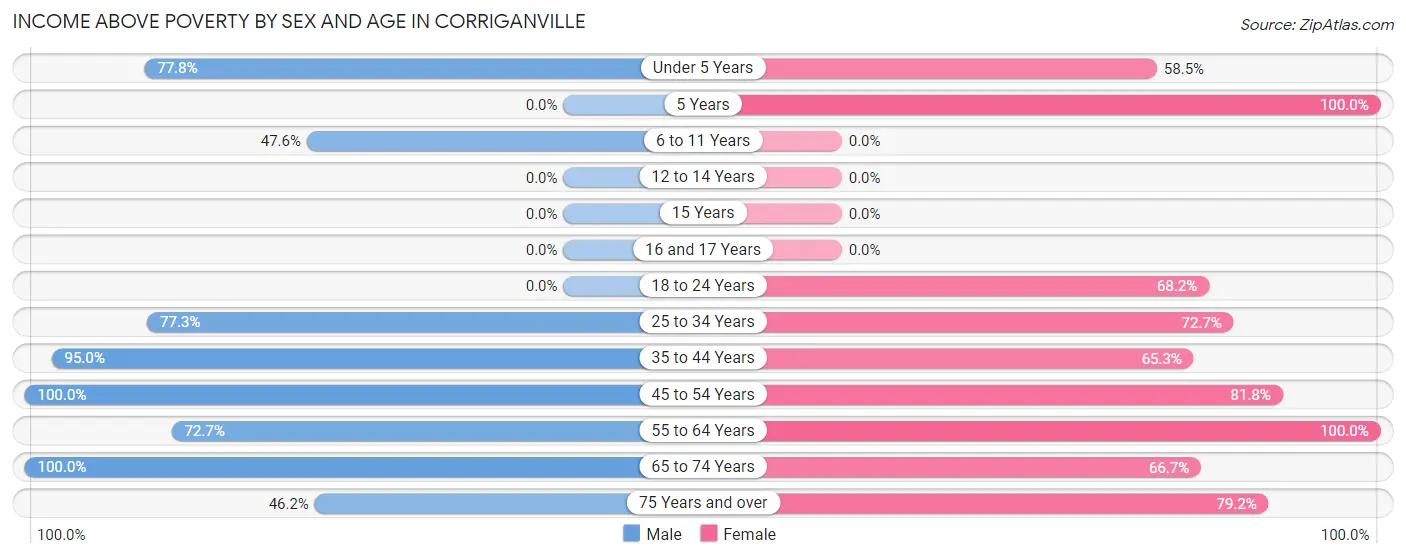
| Age Bracket | Male | Female |
| Under 5 Years | 14 (77.8%) | 62 (58.5%) |
| 5 Years | 0 (0.0%) | 15 (100.0%) |
| 6 to 11 Years | 20 (47.6%) | 0 (0.0%) |
| 12 to 14 Years | 0 (0.0%) | 0 (0.0%) |
| 15 Years | 0 (0.0%) | 0 (0.0%) |
| 16 and 17 Years | 0 (0.0%) | 0 (0.0%) |
| 18 to 24 Years | 0 (0.0%) | 45 (68.2%) |
| 25 to 34 Years | 34 (77.3%) | 16 (72.7%) |
| 35 to 44 Years | 57 (95.0%) | 32 (65.3%) |
| 45 to 54 Years | 34 (100.0%) | 27 (81.8%) |
| 55 to 64 Years | 16 (72.7%) | 48 (100.0%) |
| 65 to 74 Years | 20 (100.0%) | 12 (66.7%) |
| 75 Years and over | 12 (46.2%) | 61 (79.2%) |
| Total | 207 (74.5%) | 318 (72.4%) |
Income Below Poverty Among Married-Couple Families in Corriganville
The poverty statistics for married-couple families in Corriganville show that 16.4% or 20 of the total 122 families live below the poverty line. Families with 3 or 4 children have the highest poverty rate of 100.0%, comprising of 6 families. On the other hand, families with no children have the lowest poverty rate of 0.0%, which includes 0 families.
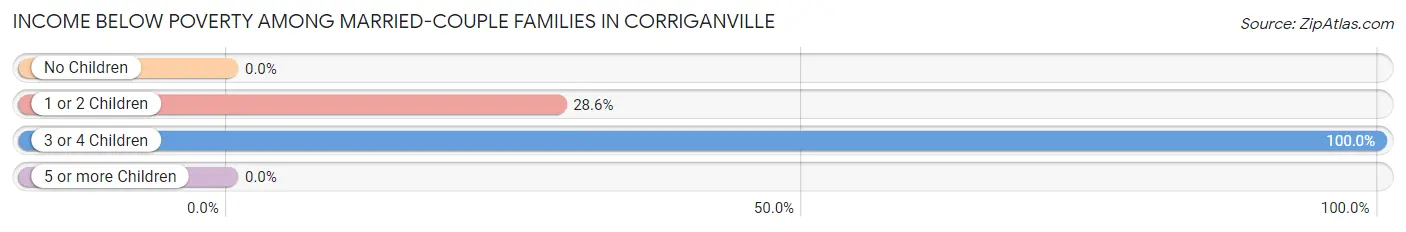
| Children | Above Poverty | Below Poverty |
| No Children | 67 (100.0%) | 0 (0.0%) |
| 1 or 2 Children | 35 (71.4%) | 14 (28.6%) |
| 3 or 4 Children | 0 (0.0%) | 6 (100.0%) |
| 5 or more Children | 0 (0.0%) | 0 (0.0%) |
| Total | 102 (83.6%) | 20 (16.4%) |
Income Below Poverty Among Single-Parent Households in Corriganville
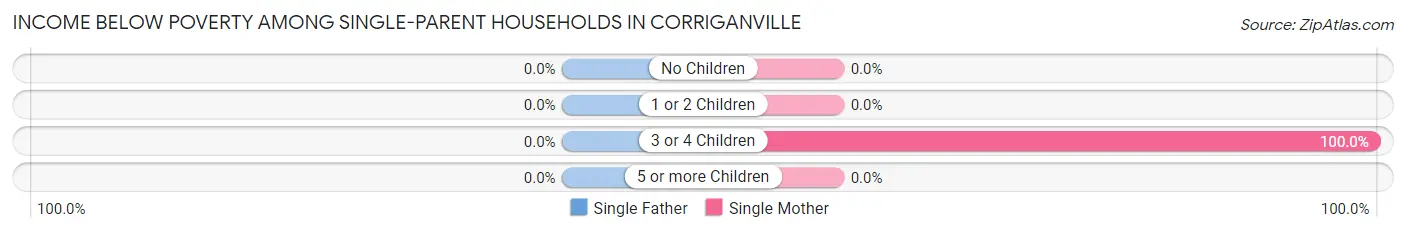
| Children | Single Father | Single Mother |
| No Children | 0 (0.0%) | 0 (0.0%) |
| 1 or 2 Children | 0 (0.0%) | 0 (0.0%) |
| 3 or 4 Children | 0 (0.0%) | 6 (100.0%) |
| 5 or more Children | 0 (0.0%) | 0 (0.0%) |
| Total | 0 (0.0%) | 6 (12.8%) |
Income Below Poverty Among Married-Couple vs Single-Parent Households in Corriganville
The poverty data for Corriganville shows that 20 of the married-couple family households (16.4%) and 6 of the single-parent households (7.4%) are living below the poverty level. Within the married-couple family households, those with 3 or 4 children have the highest poverty rate, with 6 households (100.0%) falling below the poverty line. Among the single-parent households, those with 3 or 4 children have the highest poverty rate, with 6 household (100.0%) living below poverty.
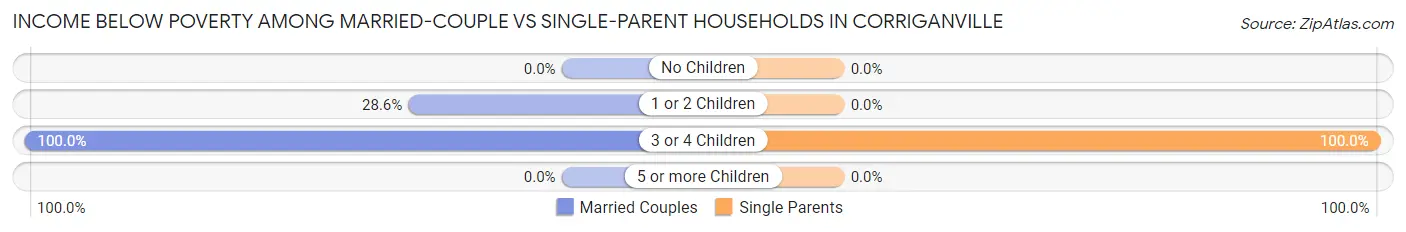
| Children | Married-Couple Families | Single-Parent Households |
| No Children | 0 (0.0%) | 0 (0.0%) |
| 1 or 2 Children | 14 (28.6%) | 0 (0.0%) |
| 3 or 4 Children | 6 (100.0%) | 6 (100.0%) |
| 5 or more Children | 0 (0.0%) | 0 (0.0%) |
| Total | 20 (16.4%) | 6 (7.4%) |
Race in Corriganville
The most populous races in Corriganville are White / Caucasian (667 | 93.0%), and Two or more Races (50 | 7.0%).
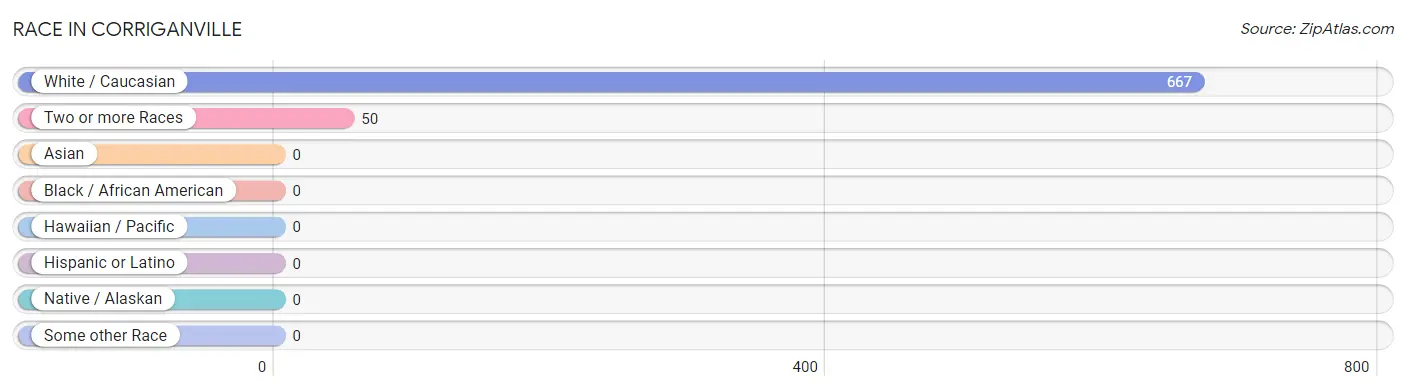
| Race | # Population | % Population |
| Asian | 0 | 0.0% |
| Black / African American | 0 | 0.0% |
| Hawaiian / Pacific | 0 | 0.0% |
| Hispanic or Latino | 0 | 0.0% |
| Native / Alaskan | 0 | 0.0% |
| White / Caucasian | 667 | 93.0% |
| Two or more Races | 50 | 7.0% |
| Some other Race | 0 | 0.0% |
| Total | 717 | 100.0% |
Ancestry in Corriganville
The most populous ancestries reported in Corriganville are German (358 | 49.9%), French (102 | 14.2%), Irish (82 | 11.4%), Dutch (45 | 6.3%), and American (42 | 5.9%), together accounting for 87.7% of all Corriganville residents.
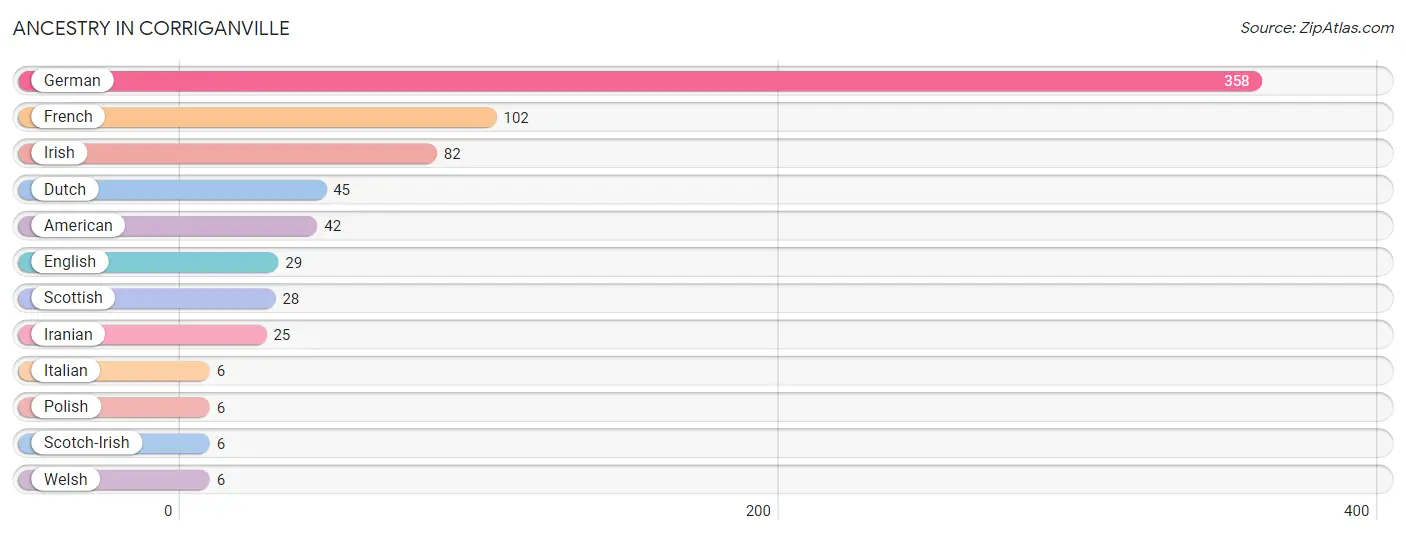
| Ancestry | # Population | % Population |
| American | 42 | 5.9% |
| Dutch | 45 | 6.3% |
| English | 29 | 4.0% |
| French | 102 | 14.2% |
| German | 358 | 49.9% |
| Iranian | 25 | 3.5% |
| Irish | 82 | 11.4% |
| Italian | 6 | 0.8% |
| Polish | 6 | 0.8% |
| Scotch-Irish | 6 | 0.8% |
| Scottish | 28 | 3.9% |
| Welsh | 6 | 0.8% | View All 12 Rows |
Immigrants in Corriganville

| Immigration Origin | # Population | % Population | View All 0 Rows |
Sex and Age in Corriganville
Sex and Age in Corriganville
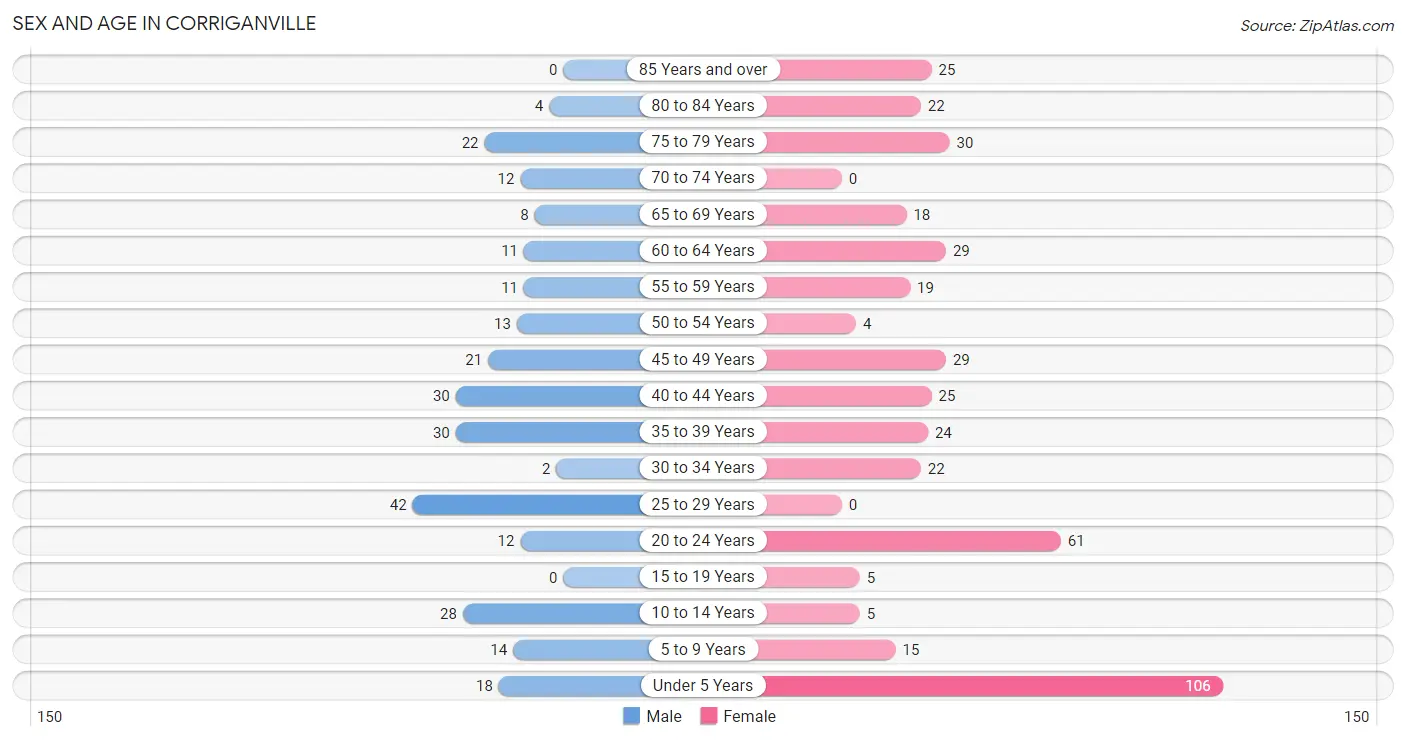
The most populous age groups in Corriganville are 25 to 29 Years (42 | 15.1%) for men and Under 5 Years (106 | 24.1%) for women.
| Age Bracket | Male | Female |
| Under 5 Years | 18 (6.5%) | 106 (24.1%) |
| 5 to 9 Years | 14 (5.0%) | 15 (3.4%) |
| 10 to 14 Years | 28 (10.1%) | 5 (1.1%) |
| 15 to 19 Years | 0 (0.0%) | 5 (1.1%) |
| 20 to 24 Years | 12 (4.3%) | 61 (13.9%) |
| 25 to 29 Years | 42 (15.1%) | 0 (0.0%) |
| 30 to 34 Years | 2 (0.7%) | 22 (5.0%) |
| 35 to 39 Years | 30 (10.8%) | 24 (5.5%) |
| 40 to 44 Years | 30 (10.8%) | 25 (5.7%) |
| 45 to 49 Years | 21 (7.5%) | 29 (6.6%) |
| 50 to 54 Years | 13 (4.7%) | 4 (0.9%) |
| 55 to 59 Years | 11 (4.0%) | 19 (4.3%) |
| 60 to 64 Years | 11 (4.0%) | 29 (6.6%) |
| 65 to 69 Years | 8 (2.9%) | 18 (4.1%) |
| 70 to 74 Years | 12 (4.3%) | 0 (0.0%) |
| 75 to 79 Years | 22 (7.9%) | 30 (6.8%) |
| 80 to 84 Years | 4 (1.4%) | 22 (5.0%) |
| 85 Years and over | 0 (0.0%) | 25 (5.7%) |
| Total | 278 (100.0%) | 439 (100.0%) |
Families and Households in Corriganville
Median Family Size in Corriganville
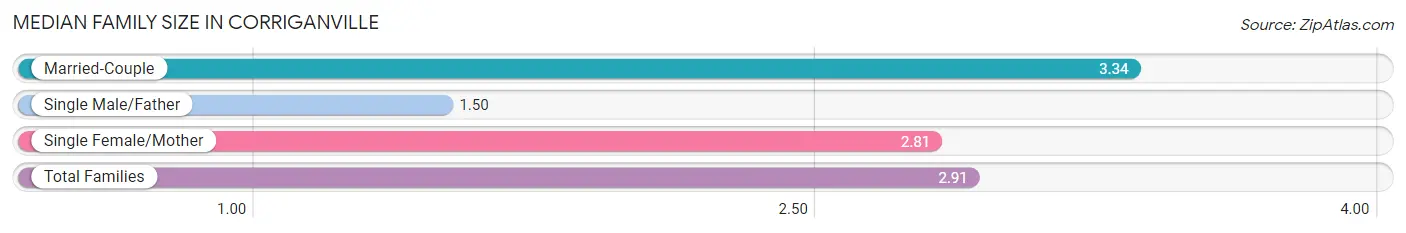
The median family size in Corriganville is 2.91 persons per family, with married-couple families (122 | 60.1%) accounting for the largest median family size of 3.34 persons per family. On the other hand, single male/father families (34 | 16.8%) represent the smallest median family size with 1.50 persons per family.
| Family Type | # Families | Family Size |
| Married-Couple | 122 (60.1%) | 3.34 |
| Single Male/Father | 34 (16.8%) | 1.50 |
| Single Female/Mother | 47 (23.2%) | 2.81 |
| Total Families | 203 (100.0%) | 2.91 |
Median Household Size in Corriganville
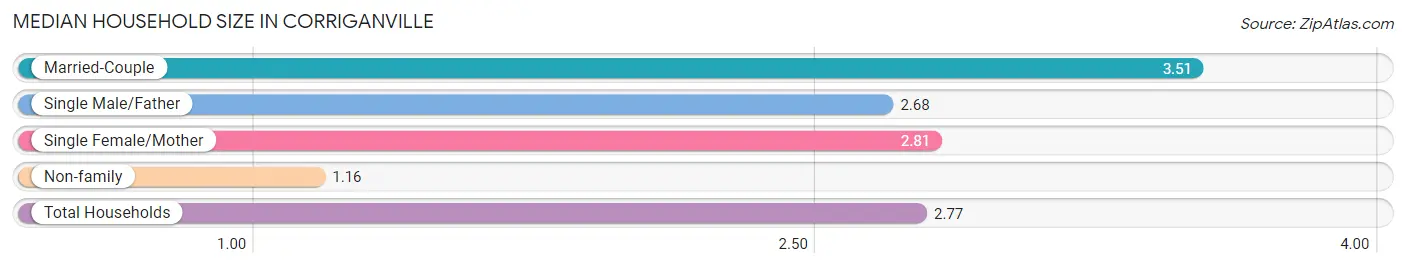
The median household size in Corriganville is 2.77 persons per household, with married-couple households (122 | 47.3%) accounting for the largest median household size of 3.51 persons per household. non-family households (55 | 21.3%) represent the smallest median household size with 1.16 persons per household.
| Household Type | # Households | Household Size |
| Married-Couple | 122 (47.3%) | 3.51 |
| Single Male/Father | 34 (13.2%) | 2.68 |
| Single Female/Mother | 47 (18.2%) | 2.81 |
| Non-family | 55 (21.3%) | 1.16 |
| Total Households | 258 (100.0%) | 2.77 |
Household Size by Marriage Status in Corriganville
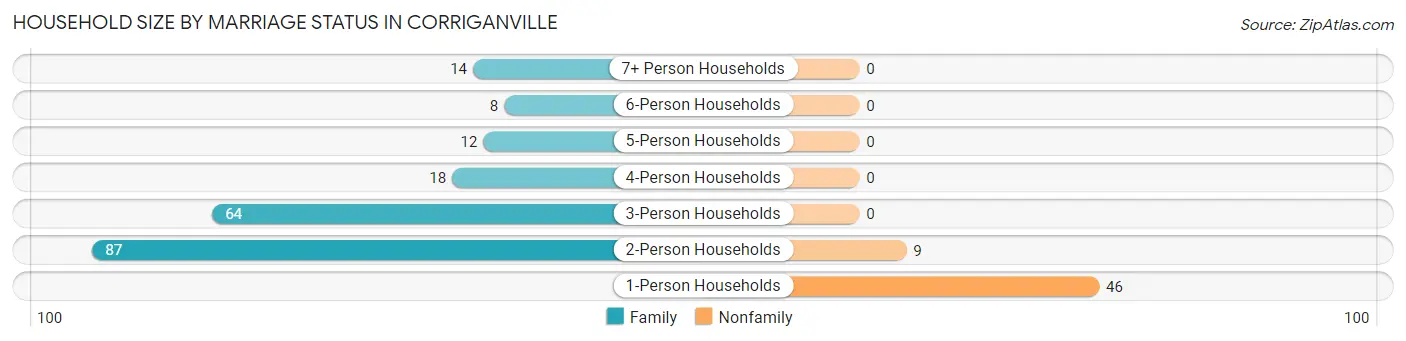
Out of a total of 258 households in Corriganville, 203 (78.7%) are family households, while 55 (21.3%) are nonfamily households. The most numerous type of family households are 2-person households, comprising 87, and the most common type of nonfamily households are 1-person households, comprising 46.
| Household Size | Family Households | Nonfamily Households |
| 1-Person Households | - | 46 (17.8%) |
| 2-Person Households | 87 (33.7%) | 9 (3.5%) |
| 3-Person Households | 64 (24.8%) | 0 (0.0%) |
| 4-Person Households | 18 (7.0%) | 0 (0.0%) |
| 5-Person Households | 12 (4.6%) | 0 (0.0%) |
| 6-Person Households | 8 (3.1%) | 0 (0.0%) |
| 7+ Person Households | 14 (5.4%) | 0 (0.0%) |
| Total | 203 (78.7%) | 55 (21.3%) |
Female Fertility in Corriganville
Fertility by Age in Corriganville
Average fertility rate in Corriganville is 367.0 births per 1,000 women. Women in the age bracket of 20 to 34 years have the highest fertility rate with 735.0 births per 1,000 women. Women in the age bracket of 20 to 34 years acount for 100.0% of all women with births.
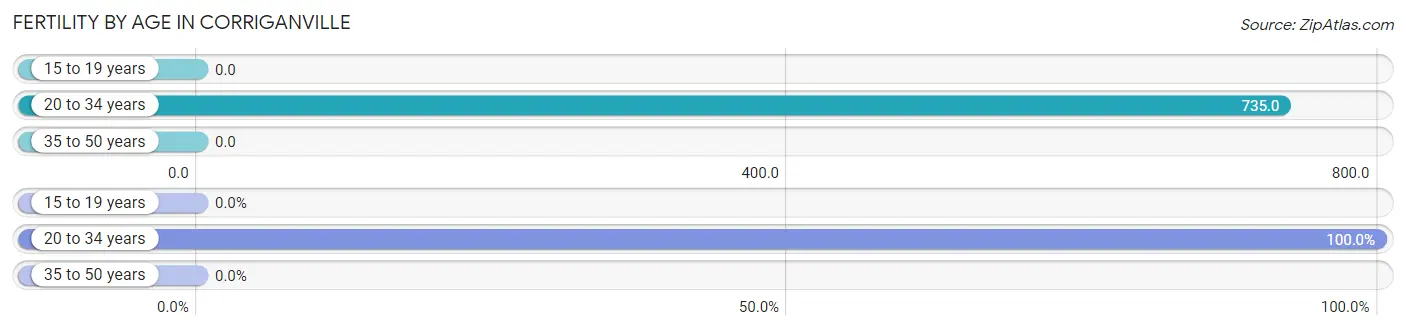
| Age Bracket | Women with Births | Births / 1,000 Women |
| 15 to 19 years | 0 (0.0%) | 0.0 |
| 20 to 34 years | 61 (100.0%) | 735.0 |
| 35 to 50 years | 0 (0.0%) | 0.0 |
| Total | 61 (100.0%) | 367.0 |
Fertility by Age by Marriage Status in Corriganville
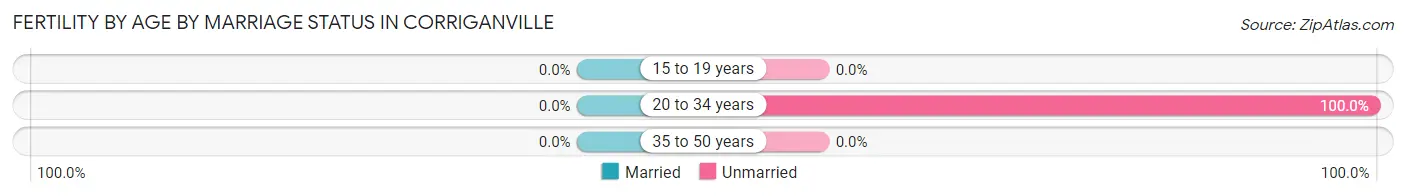
| Age Bracket | Married | Unmarried |
| 15 to 19 years | 0 (0.0%) | 0 (0.0%) |
| 20 to 34 years | 0 (0.0%) | 61 (100.0%) |
| 35 to 50 years | 0 (0.0%) | 0 (0.0%) |
| Total | 0 (0.0%) | 61 (100.0%) |
Fertility by Education in Corriganville
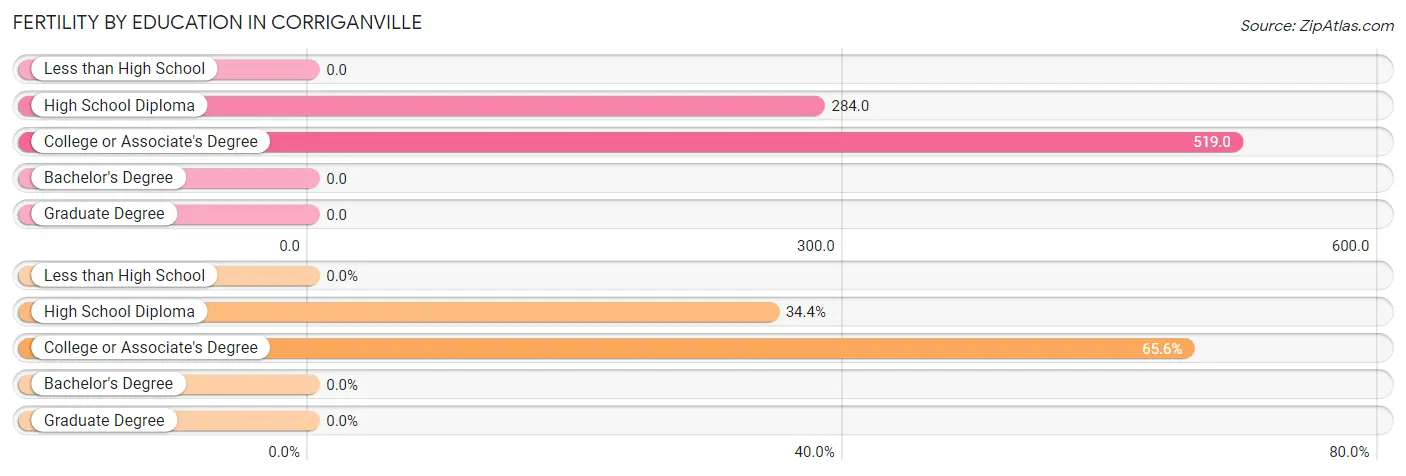
| Educational Attainment | Women with Births | Births / 1,000 Women |
| Less than High School | 0 (0.0%) | 0.0 |
| High School Diploma | 21 (34.4%) | 284.0 |
| College or Associate's Degree | 40 (65.6%) | 519.0 |
| Bachelor's Degree | 0 (0.0%) | 0.0 |
| Graduate Degree | 0 (0.0%) | 0.0 |
| Total | 61 (100.0%) | 367.0 |
Fertility by Education by Marriage Status in Corriganville
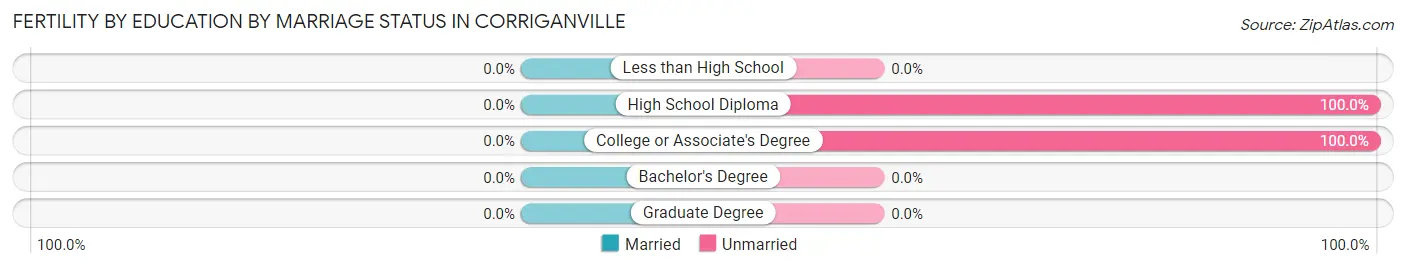
| Educational Attainment | Married | Unmarried |
| Less than High School | 0 (0.0%) | 0 (0.0%) |
| High School Diploma | 0 (0.0%) | 21 (100.0%) |
| College or Associate's Degree | 0 (0.0%) | 40 (100.0%) |
| Bachelor's Degree | 0 (0.0%) | 0 (0.0%) |
| Graduate Degree | 0 (0.0%) | 0 (0.0%) |
| Total | 0 (0.0%) | 61 (100.0%) |
Employment Characteristics in Corriganville
Employment by Class of Employer in Corriganville
Among the 259 employed individuals in Corriganville, private company employees (231 | 89.2%), self-employed (not incorporated) (21 | 8.1%), and state government employees (7 | 2.7%) make up the most common classes of employment.
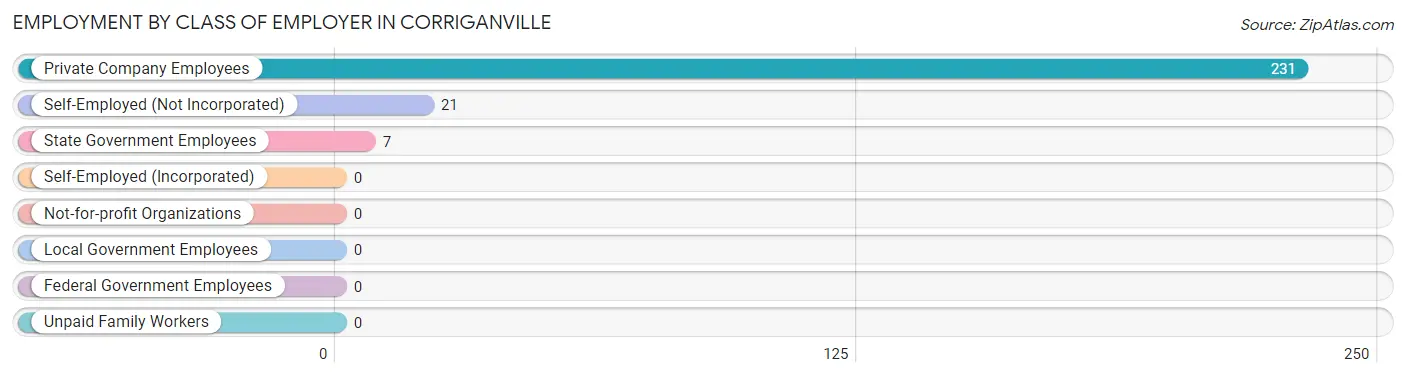
| Employer Class | # Employees | % Employees |
| Private Company Employees | 231 | 89.2% |
| Self-Employed (Incorporated) | 0 | 0.0% |
| Self-Employed (Not Incorporated) | 21 | 8.1% |
| Not-for-profit Organizations | 0 | 0.0% |
| Local Government Employees | 0 | 0.0% |
| State Government Employees | 7 | 2.7% |
| Federal Government Employees | 0 | 0.0% |
| Unpaid Family Workers | 0 | 0.0% |
| Total | 259 | 100.0% |
Employment Status by Age in Corriganville
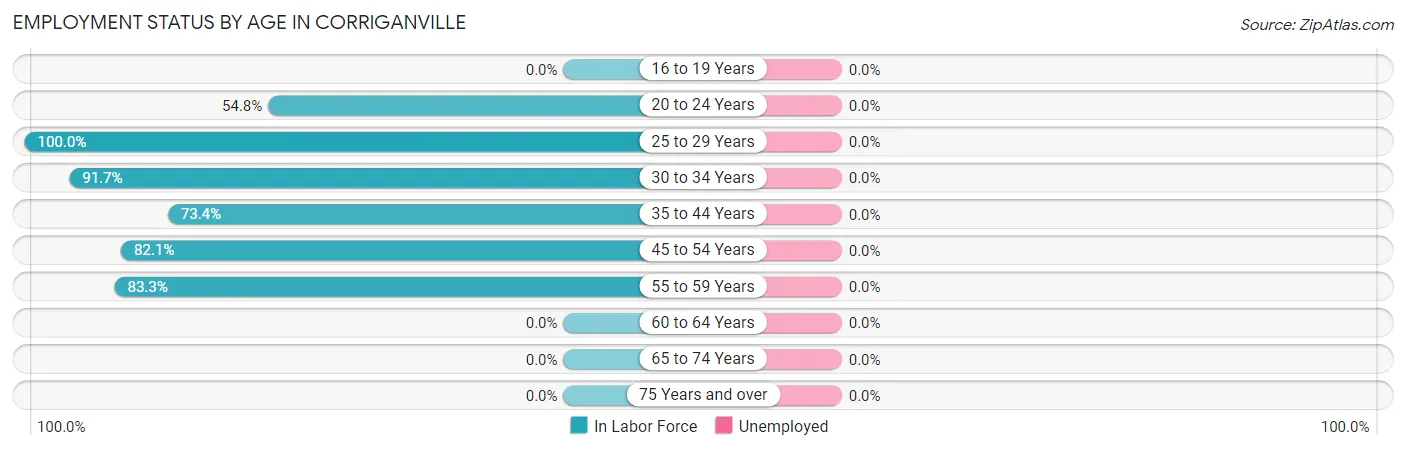
| Age Bracket | In Labor Force | Unemployed |
| 16 to 19 Years | 0 (0.0%) | 0 (0.0%) |
| 20 to 24 Years | 40 (54.8%) | 0 (0.0%) |
| 25 to 29 Years | 42 (100.0%) | 0 (0.0%) |
| 30 to 34 Years | 22 (91.7%) | 0 (0.0%) |
| 35 to 44 Years | 80 (73.4%) | 0 (0.0%) |
| 45 to 54 Years | 55 (82.1%) | 0 (0.0%) |
| 55 to 59 Years | 25 (83.3%) | 0 (0.0%) |
| 60 to 64 Years | 0 (0.0%) | 0 (0.0%) |
| 65 to 74 Years | 0 (0.0%) | 0 (0.0%) |
| 75 Years and over | 0 (0.0%) | 0 (0.0%) |
| Total | 264 (49.7%) | 0 (0.0%) |
Employment Status by Educational Attainment in Corriganville
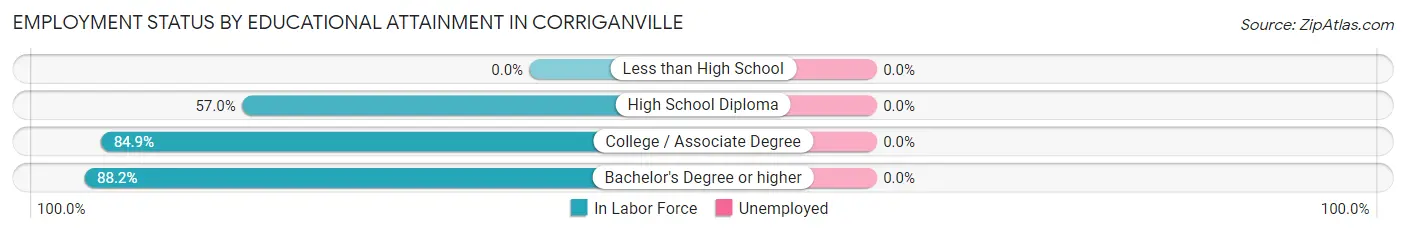
| Educational Attainment | In Labor Force | Unemployed |
| Less than High School | 0 (0.0%) | 0 (0.0%) |
| High School Diploma | 85 (57.0%) | 0 (0.0%) |
| College / Associate Degree | 124 (84.9%) | 0 (0.0%) |
| Bachelor's Degree or higher | 15 (88.2%) | 0 (0.0%) |
| Total | 224 (71.8%) | 0 (0.0%) |
Employment Occupations by Sex in Corriganville
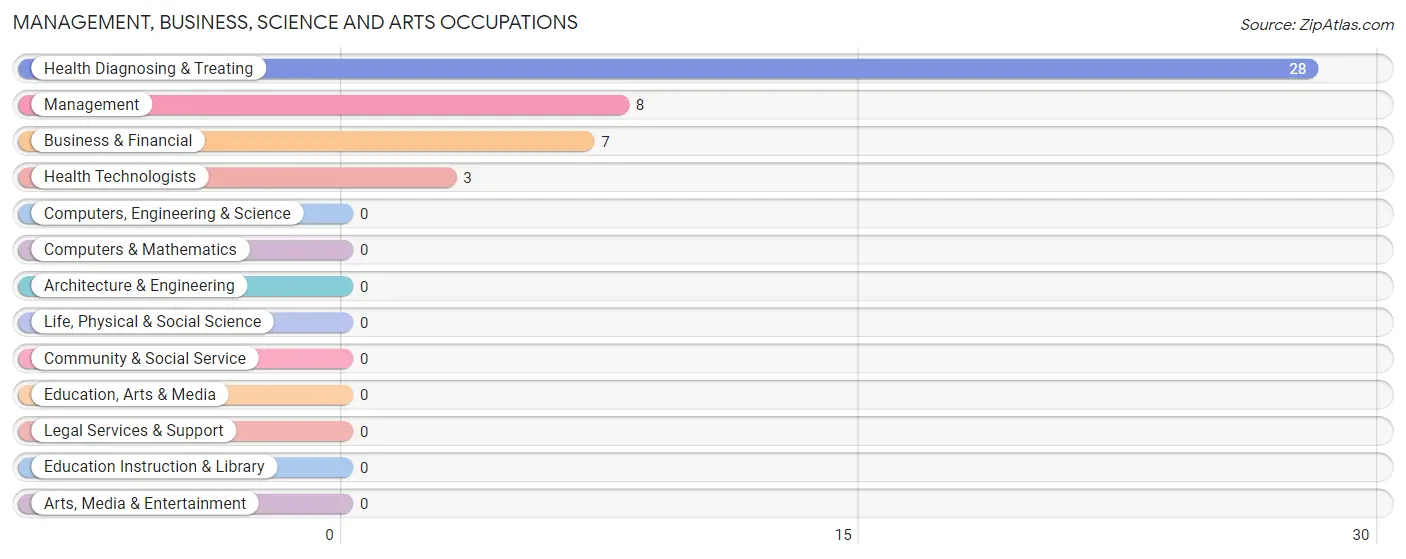
Management, Business, Science and Arts Occupations
The most common Management, Business, Science and Arts occupations in Corriganville are Health Diagnosing & Treating (28 | 10.6%), Management (8 | 3.0%), Business & Financial (7 | 2.6%), and Health Technologists (3 | 1.1%).
Management, Business, Science and Arts Occupations by Sex
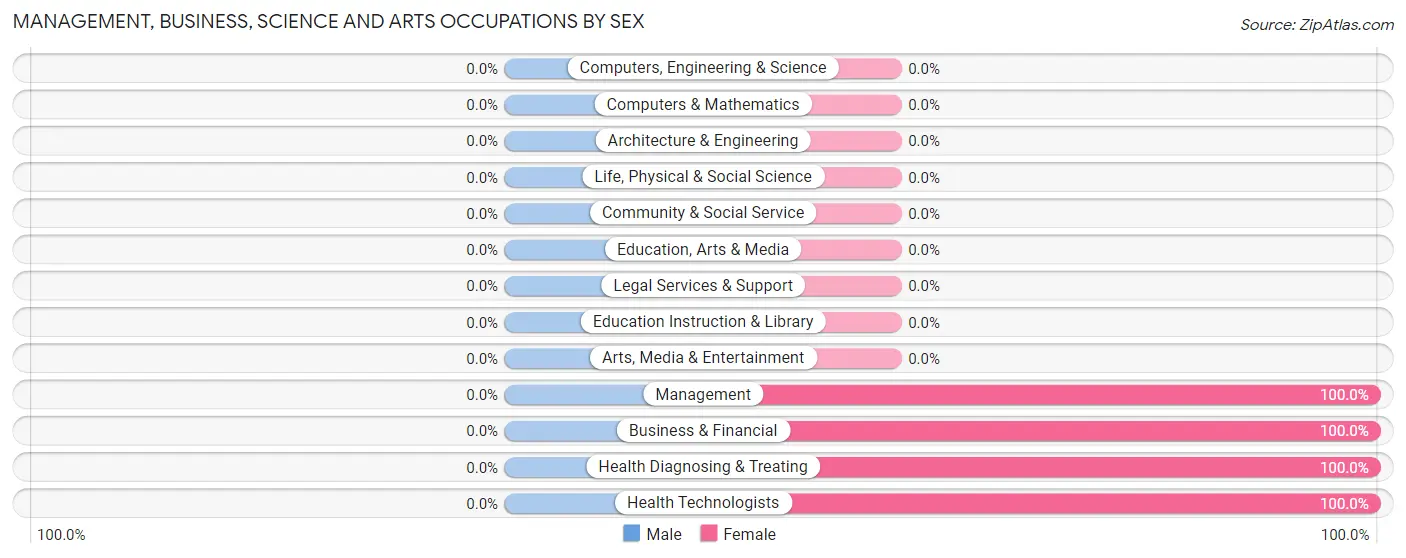
| Occupation | Male | Female |
| Management | 0 (0.0%) | 8 (100.0%) |
| Business & Financial | 0 (0.0%) | 7 (100.0%) |
| Computers, Engineering & Science | 0 (0.0%) | 0 (0.0%) |
| Computers & Mathematics | 0 (0.0%) | 0 (0.0%) |
| Architecture & Engineering | 0 (0.0%) | 0 (0.0%) |
| Life, Physical & Social Science | 0 (0.0%) | 0 (0.0%) |
| Community & Social Service | 0 (0.0%) | 0 (0.0%) |
| Education, Arts & Media | 0 (0.0%) | 0 (0.0%) |
| Legal Services & Support | 0 (0.0%) | 0 (0.0%) |
| Education Instruction & Library | 0 (0.0%) | 0 (0.0%) |
| Arts, Media & Entertainment | 0 (0.0%) | 0 (0.0%) |
| Health Diagnosing & Treating | 0 (0.0%) | 28 (100.0%) |
| Health Technologists | 0 (0.0%) | 3 (100.0%) |
| Total (Category) | 0 (0.0%) | 43 (100.0%) |
| Total (Overall) | 129 (48.9%) | 135 (51.1%) |
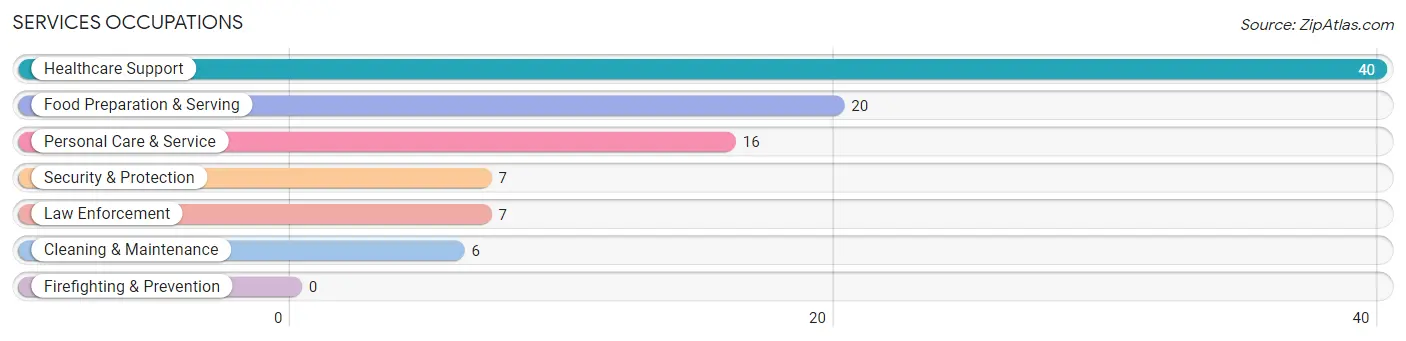
Services Occupations
The most common Services occupations in Corriganville are Healthcare Support (40 | 15.1%), Food Preparation & Serving (20 | 7.6%), Personal Care & Service (16 | 6.1%), Security & Protection (7 | 2.6%), and Law Enforcement (7 | 2.6%).
Services Occupations by Sex
Within the Services occupations in Corriganville, the most male-oriented occupations are Security & Protection (100.0%), and Law Enforcement (100.0%), while the most female-oriented occupations are Healthcare Support (100.0%), Food Preparation & Serving (100.0%), and Cleaning & Maintenance (100.0%).
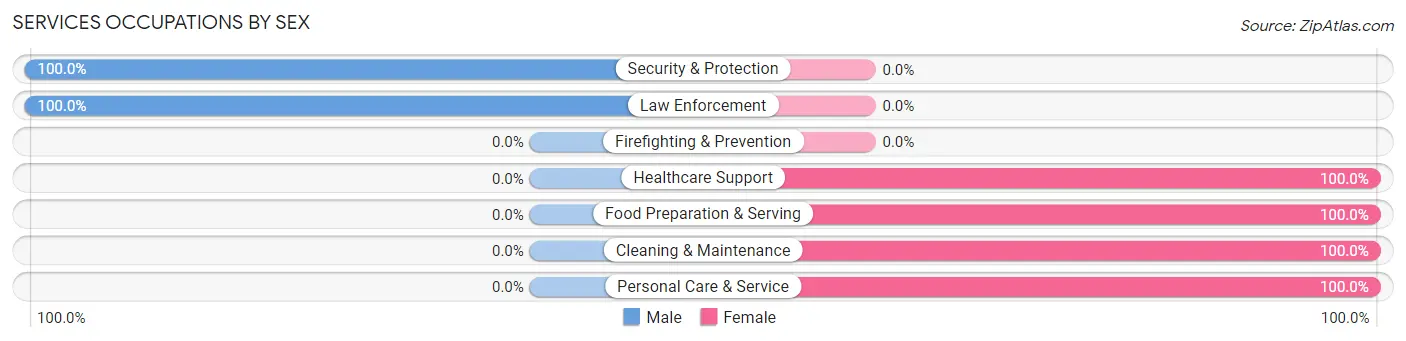
| Occupation | Male | Female |
| Healthcare Support | 0 (0.0%) | 40 (100.0%) |
| Security & Protection | 7 (100.0%) | 0 (0.0%) |
| Firefighting & Prevention | 0 (0.0%) | 0 (0.0%) |
| Law Enforcement | 7 (100.0%) | 0 (0.0%) |
| Food Preparation & Serving | 0 (0.0%) | 20 (100.0%) |
| Cleaning & Maintenance | 0 (0.0%) | 6 (100.0%) |
| Personal Care & Service | 0 (0.0%) | 16 (100.0%) |
| Total (Category) | 7 (7.9%) | 82 (92.1%) |
| Total (Overall) | 129 (48.9%) | 135 (51.1%) |
Sales and Office Occupations
The most common Sales and Office occupations in Corriganville are , and Office & Administration (10 | 3.8%).
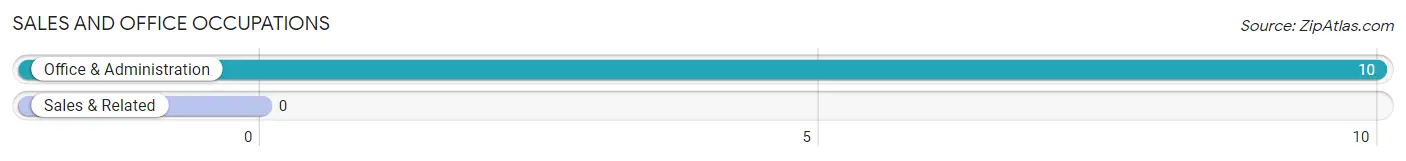
Sales and Office Occupations by Sex
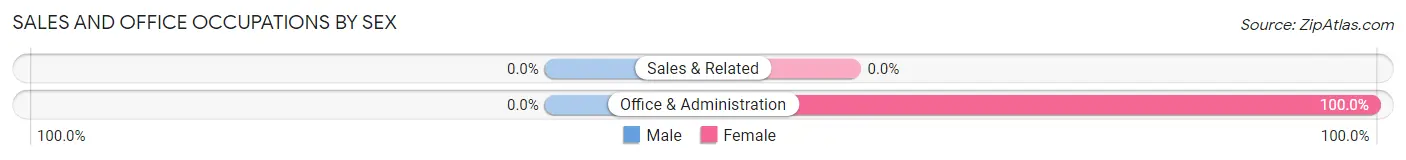
| Occupation | Male | Female |
| Sales & Related | 0 (0.0%) | 0 (0.0%) |
| Office & Administration | 0 (0.0%) | 10 (100.0%) |
| Total (Category) | 0 (0.0%) | 10 (100.0%) |
| Total (Overall) | 129 (48.9%) | 135 (51.1%) |
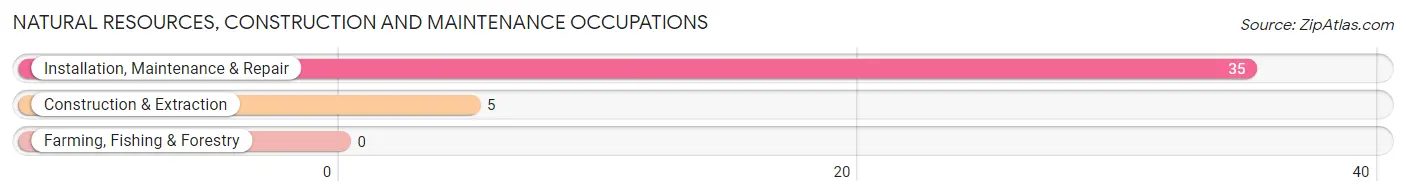
Natural Resources, Construction and Maintenance Occupations
The most common Natural Resources, Construction and Maintenance occupations in Corriganville are Installation, Maintenance & Repair (35 | 13.3%), and Construction & Extraction (5 | 1.9%).
Natural Resources, Construction and Maintenance Occupations by Sex
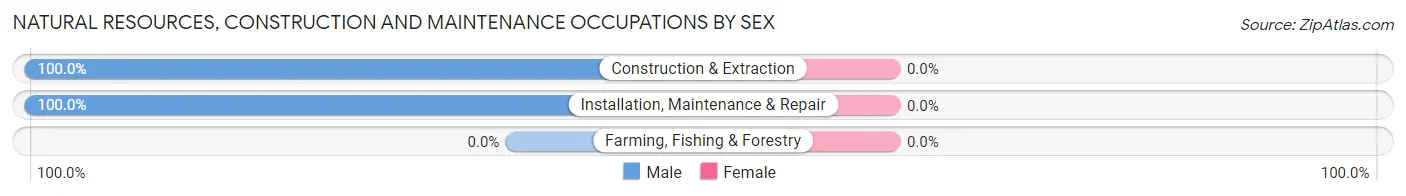
| Occupation | Male | Female |
| Farming, Fishing & Forestry | 0 (0.0%) | 0 (0.0%) |
| Construction & Extraction | 5 (100.0%) | 0 (0.0%) |
| Installation, Maintenance & Repair | 35 (100.0%) | 0 (0.0%) |
| Total (Category) | 40 (100.0%) | 0 (0.0%) |
| Total (Overall) | 129 (48.9%) | 135 (51.1%) |
Production, Transportation and Moving Occupations
The most common Production, Transportation and Moving occupations in Corriganville are Production (48 | 18.2%), and Transportation (34 | 12.9%).
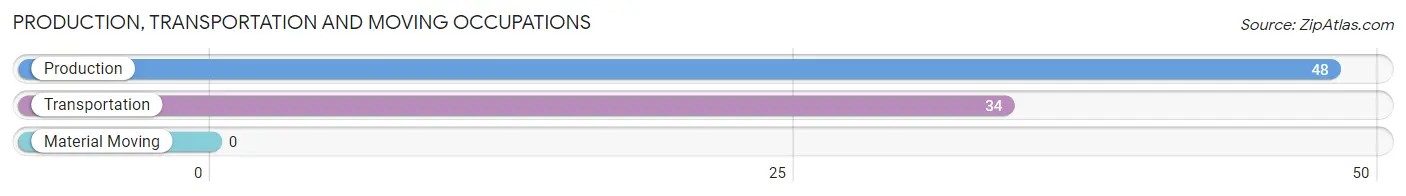
Production, Transportation and Moving Occupations by Sex
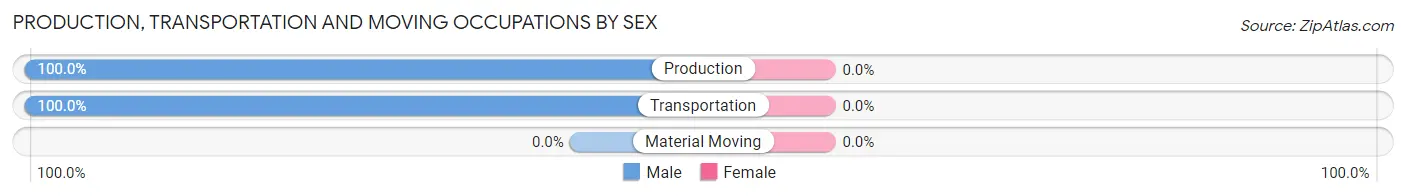
| Occupation | Male | Female |
| Production | 48 (100.0%) | 0 (0.0%) |
| Transportation | 34 (100.0%) | 0 (0.0%) |
| Material Moving | 0 (0.0%) | 0 (0.0%) |
| Total (Category) | 82 (100.0%) | 0 (0.0%) |
| Total (Overall) | 129 (48.9%) | 135 (51.1%) |
Employment Industries by Sex in Corriganville
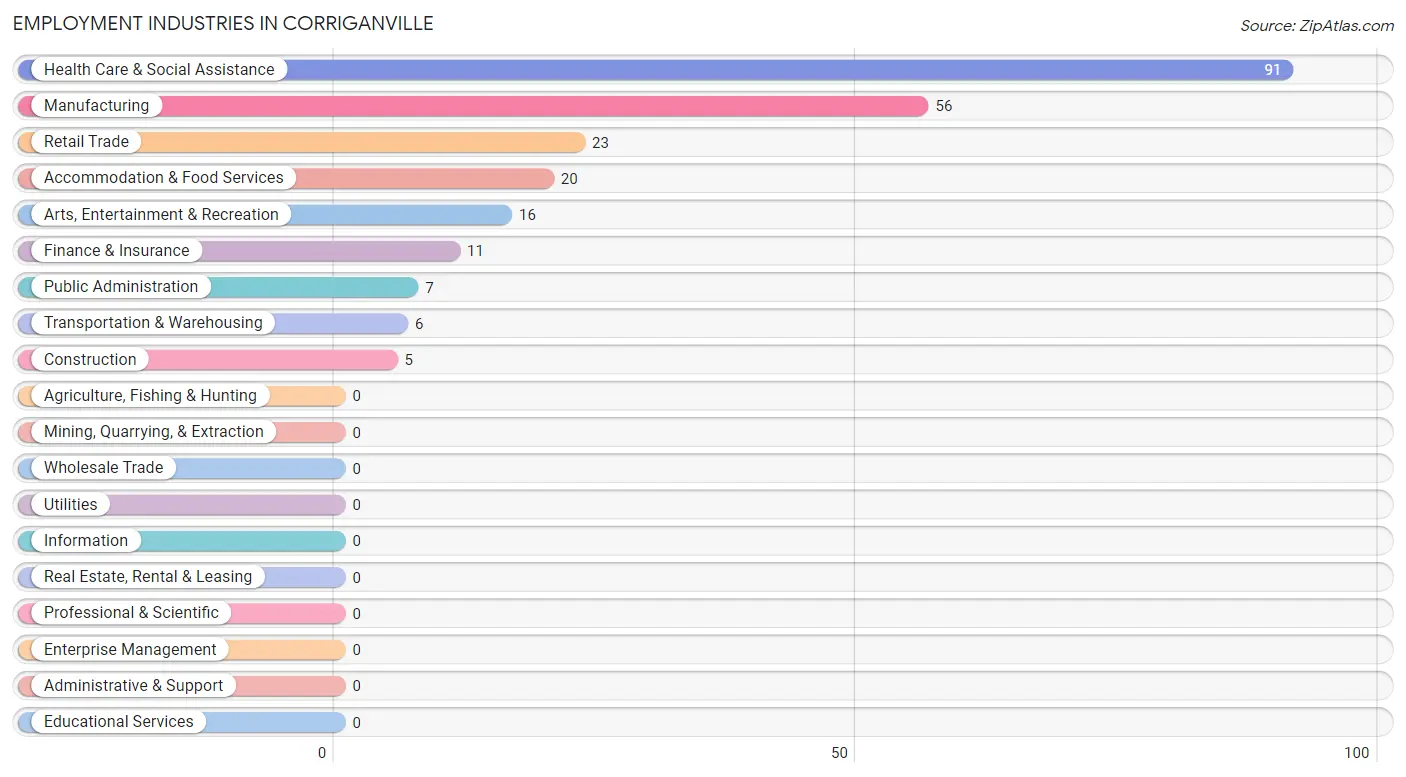
Employment Industries in Corriganville
The major employment industries in Corriganville include Health Care & Social Assistance (91 | 34.5%), Manufacturing (56 | 21.2%), Retail Trade (23 | 8.7%), Accommodation & Food Services (20 | 7.6%), and Arts, Entertainment & Recreation (16 | 6.1%).
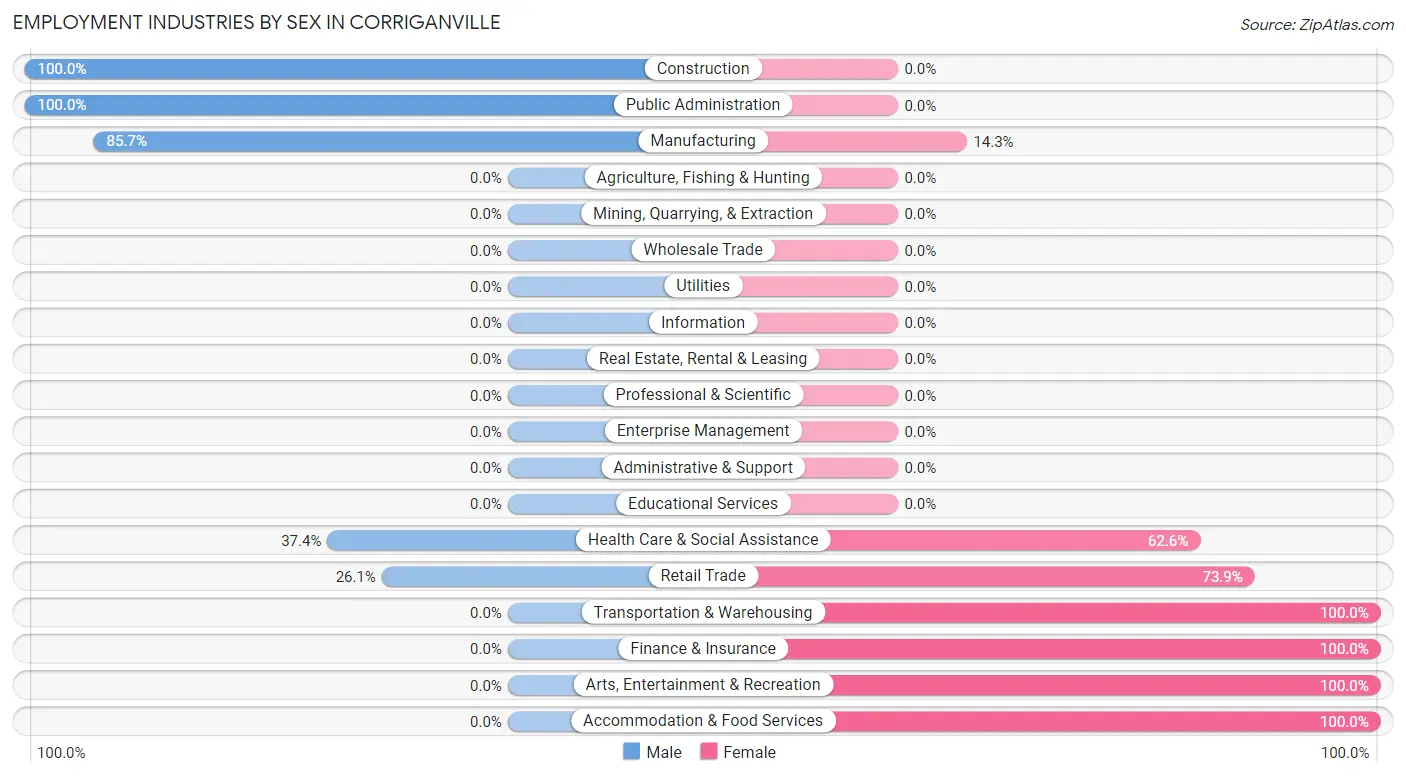
Employment Industries by Sex in Corriganville
The Corriganville industries that see more men than women are Construction (100.0%), Public Administration (100.0%), and Manufacturing (85.7%), whereas the industries that tend to have a higher number of women are Transportation & Warehousing (100.0%), Finance & Insurance (100.0%), and Arts, Entertainment & Recreation (100.0%).
| Industry | Male | Female |
| Agriculture, Fishing & Hunting | 0 (0.0%) | 0 (0.0%) |
| Mining, Quarrying, & Extraction | 0 (0.0%) | 0 (0.0%) |
| Construction | 5 (100.0%) | 0 (0.0%) |
| Manufacturing | 48 (85.7%) | 8 (14.3%) |
| Wholesale Trade | 0 (0.0%) | 0 (0.0%) |
| Retail Trade | 6 (26.1%) | 17 (73.9%) |
| Transportation & Warehousing | 0 (0.0%) | 6 (100.0%) |
| Utilities | 0 (0.0%) | 0 (0.0%) |
| Information | 0 (0.0%) | 0 (0.0%) |
| Finance & Insurance | 0 (0.0%) | 11 (100.0%) |
| Real Estate, Rental & Leasing | 0 (0.0%) | 0 (0.0%) |
| Professional & Scientific | 0 (0.0%) | 0 (0.0%) |
| Enterprise Management | 0 (0.0%) | 0 (0.0%) |
| Administrative & Support | 0 (0.0%) | 0 (0.0%) |
| Educational Services | 0 (0.0%) | 0 (0.0%) |
| Health Care & Social Assistance | 34 (37.4%) | 57 (62.6%) |
| Arts, Entertainment & Recreation | 0 (0.0%) | 16 (100.0%) |
| Accommodation & Food Services | 0 (0.0%) | 20 (100.0%) |
| Public Administration | 7 (100.0%) | 0 (0.0%) |
| Total | 129 (48.9%) | 135 (51.1%) |
Education in Corriganville
School Enrollment in Corriganville
The most common levels of schooling among the 74 students in Corriganville are elementary school (42 | 56.8%), kindergarten (15 | 20.3%), and middle school (5 | 6.8%).
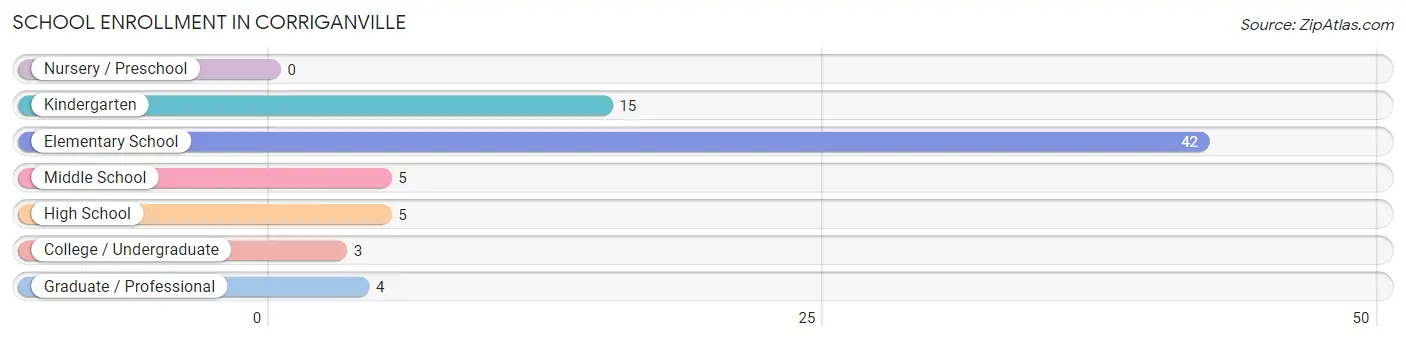
| School Level | # Students | % Students |
| Nursery / Preschool | 0 | 0.0% |
| Kindergarten | 15 | 20.3% |
| Elementary School | 42 | 56.8% |
| Middle School | 5 | 6.8% |
| High School | 5 | 6.8% |
| College / Undergraduate | 3 | 4.1% |
| Graduate / Professional | 4 | 5.4% |
| Total | 74 | 100.0% |
School Enrollment by Age by Funding Source in Corriganville
Out of a total of 74 students who are enrolled in schools in Corriganville, 5 (6.8%) attend a private institution, while the remaining 69 (93.2%) are enrolled in public schools. The age group of 18 to 19 year olds has the highest likelihood of being enrolled in private schools, with 5 (100.0% in the age bracket) enrolled. Conversely, the age group of 5 to 9 year old has the lowest likelihood of being enrolled in a private school, with 29 (100.0% in the age bracket) attending a public institution.
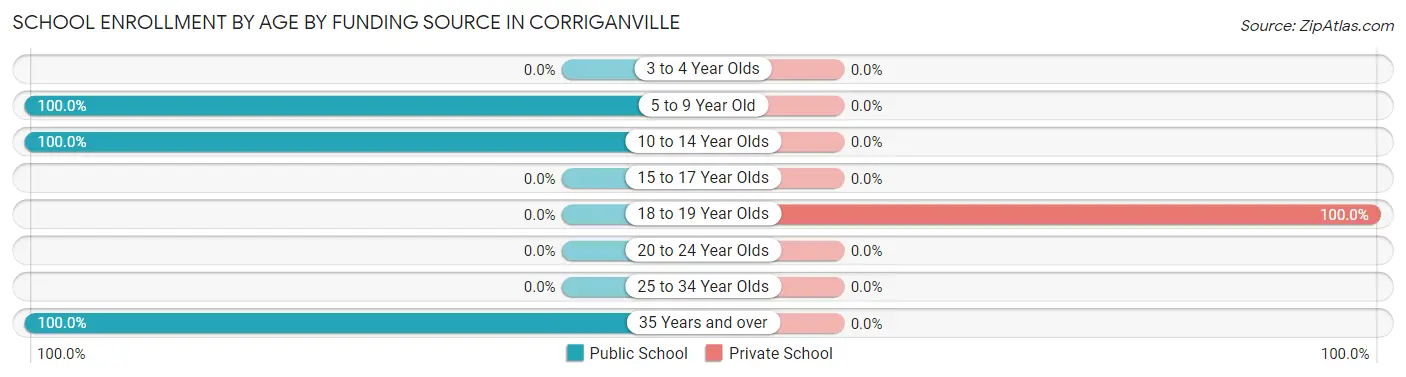
| Age Bracket | Public School | Private School |
| 3 to 4 Year Olds | 0 (0.0%) | 0 (0.0%) |
| 5 to 9 Year Old | 29 (100.0%) | 0 (0.0%) |
| 10 to 14 Year Olds | 33 (100.0%) | 0 (0.0%) |
| 15 to 17 Year Olds | 0 (0.0%) | 0 (0.0%) |
| 18 to 19 Year Olds | 0 (0.0%) | 5 (100.0%) |
| 20 to 24 Year Olds | 0 (0.0%) | 0 (0.0%) |
| 25 to 34 Year Olds | 0 (0.0%) | 0 (0.0%) |
| 35 Years and over | 7 (100.0%) | 0 (0.0%) |
| Total | 69 (93.2%) | 5 (6.8%) |
Educational Attainment by Field of Study in Corriganville
Business (14 | 29.2%), education (8 | 16.7%), visual & performing arts (8 | 16.7%), literature & languages (7 | 14.6%), and science & technology (5 | 10.4%) are the most common fields of study among 48 individuals in Corriganville who have obtained a bachelor's degree or higher.
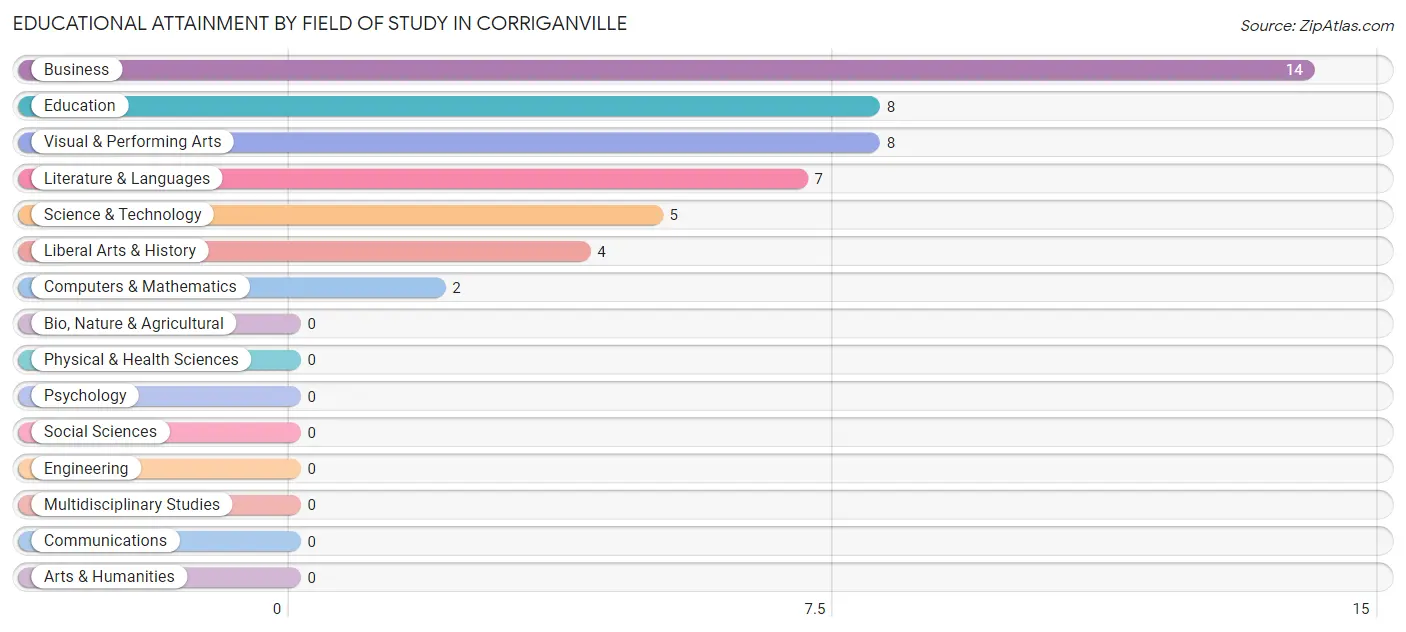
| Field of Study | # Graduates | % Graduates |
| Computers & Mathematics | 2 | 4.2% |
| Bio, Nature & Agricultural | 0 | 0.0% |
| Physical & Health Sciences | 0 | 0.0% |
| Psychology | 0 | 0.0% |
| Social Sciences | 0 | 0.0% |
| Engineering | 0 | 0.0% |
| Multidisciplinary Studies | 0 | 0.0% |
| Science & Technology | 5 | 10.4% |
| Business | 14 | 29.2% |
| Education | 8 | 16.7% |
| Literature & Languages | 7 | 14.6% |
| Liberal Arts & History | 4 | 8.3% |
| Visual & Performing Arts | 8 | 16.7% |
| Communications | 0 | 0.0% |
| Arts & Humanities | 0 | 0.0% |
| Total | 48 | 100.0% |
Transportation & Commute in Corriganville
Vehicle Availability by Sex in Corriganville
The most prevalent vehicle ownership categories in Corriganville are males with 2 vehicles (67, accounting for 54.0%) and females with 2 vehicles (74, making up 49.6%).
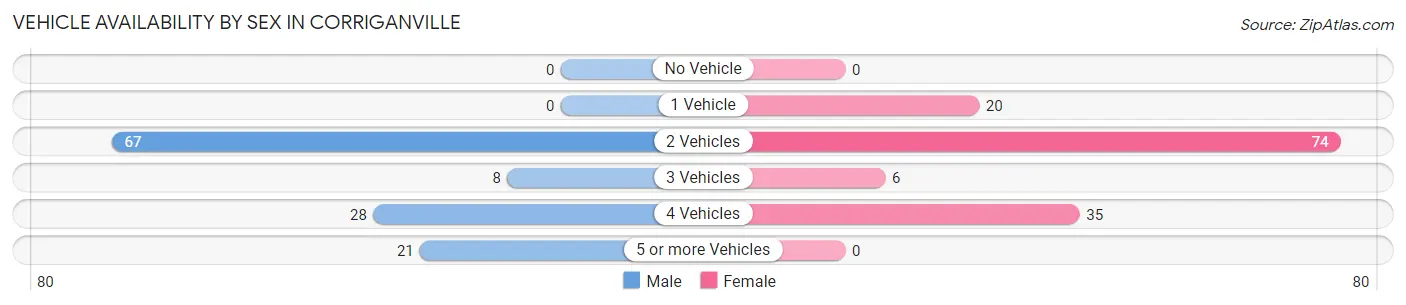
| Vehicles Available | Male | Female |
| No Vehicle | 0 (0.0%) | 0 (0.0%) |
| 1 Vehicle | 0 (0.0%) | 20 (14.8%) |
| 2 Vehicles | 67 (54.0%) | 74 (54.8%) |
| 3 Vehicles | 8 (6.5%) | 6 (4.4%) |
| 4 Vehicles | 28 (22.6%) | 35 (25.9%) |
| 5 or more Vehicles | 21 (16.9%) | 0 (0.0%) |
| Total | 124 (100.0%) | 135 (100.0%) |
Commute Time in Corriganville
The most frequently occuring commute durations in Corriganville are 20 to 24 minutes (131 commuters, 53.0%), 90 or more minutes (51 commuters, 20.6%), and 30 to 34 minutes (27 commuters, 10.9%).
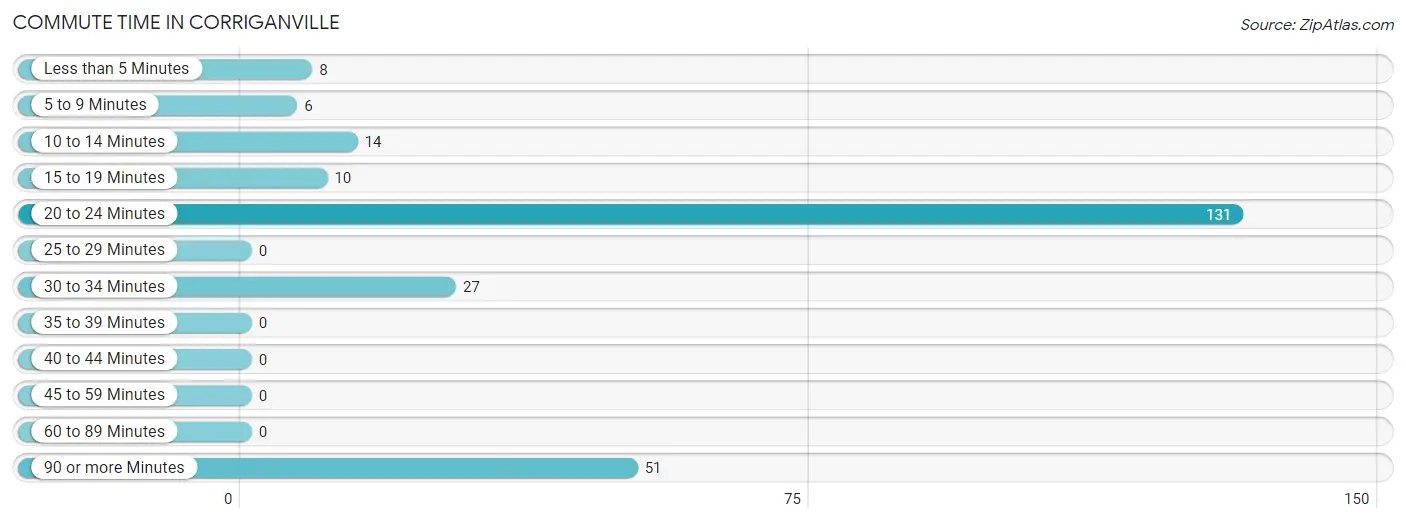
| Commute Time | # Commuters | % Commuters |
| Less than 5 Minutes | 8 | 3.2% |
| 5 to 9 Minutes | 6 | 2.4% |
| 10 to 14 Minutes | 14 | 5.7% |
| 15 to 19 Minutes | 10 | 4.1% |
| 20 to 24 Minutes | 131 | 53.0% |
| 25 to 29 Minutes | 0 | 0.0% |
| 30 to 34 Minutes | 27 | 10.9% |
| 35 to 39 Minutes | 0 | 0.0% |
| 40 to 44 Minutes | 0 | 0.0% |
| 45 to 59 Minutes | 0 | 0.0% |
| 60 to 89 Minutes | 0 | 0.0% |
| 90 or more Minutes | 51 | 20.6% |
Commute Time by Sex in Corriganville
The most common commute times in Corriganville are 20 to 24 minutes (55 commuters, 44.4%) for males and 20 to 24 minutes (76 commuters, 61.8%) for females.
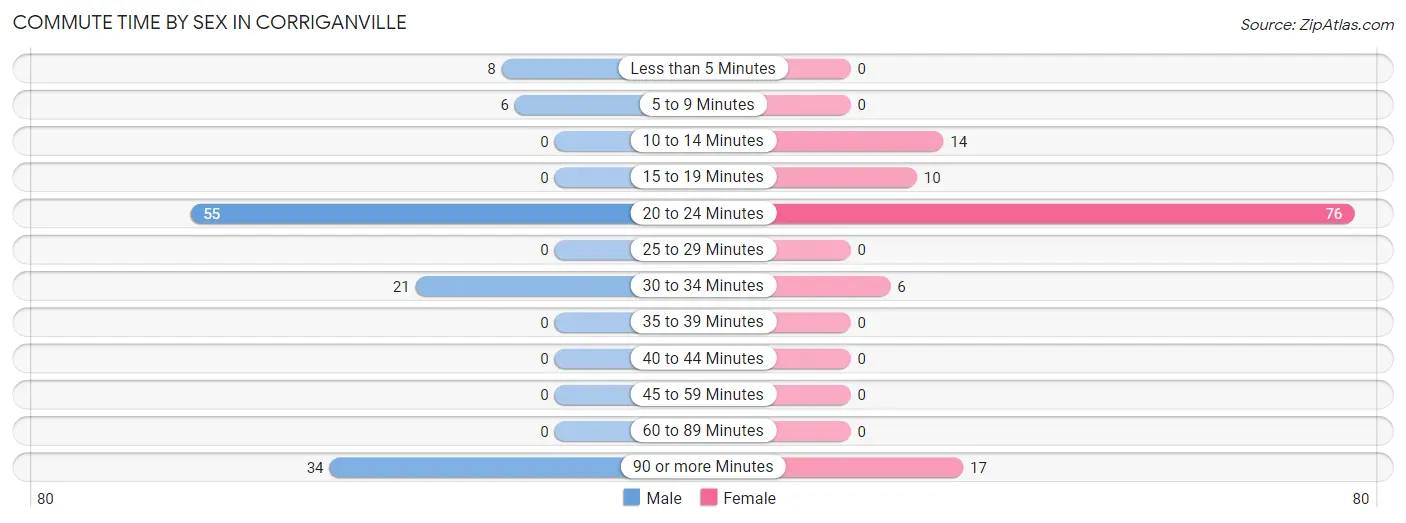
| Commute Time | Male | Female |
| Less than 5 Minutes | 8 (6.5%) | 0 (0.0%) |
| 5 to 9 Minutes | 6 (4.8%) | 0 (0.0%) |
| 10 to 14 Minutes | 0 (0.0%) | 14 (11.4%) |
| 15 to 19 Minutes | 0 (0.0%) | 10 (8.1%) |
| 20 to 24 Minutes | 55 (44.4%) | 76 (61.8%) |
| 25 to 29 Minutes | 0 (0.0%) | 0 (0.0%) |
| 30 to 34 Minutes | 21 (16.9%) | 6 (4.9%) |
| 35 to 39 Minutes | 0 (0.0%) | 0 (0.0%) |
| 40 to 44 Minutes | 0 (0.0%) | 0 (0.0%) |
| 45 to 59 Minutes | 0 (0.0%) | 0 (0.0%) |
| 60 to 89 Minutes | 0 (0.0%) | 0 (0.0%) |
| 90 or more Minutes | 34 (27.4%) | 17 (13.8%) |
Time of Departure to Work by Sex in Corriganville
The most frequent times of departure to work in Corriganville are 12:00 AM to 4:59 AM (39, 31.5%) for males and 6:30 AM to 6:59 AM (46, 37.4%) for females.
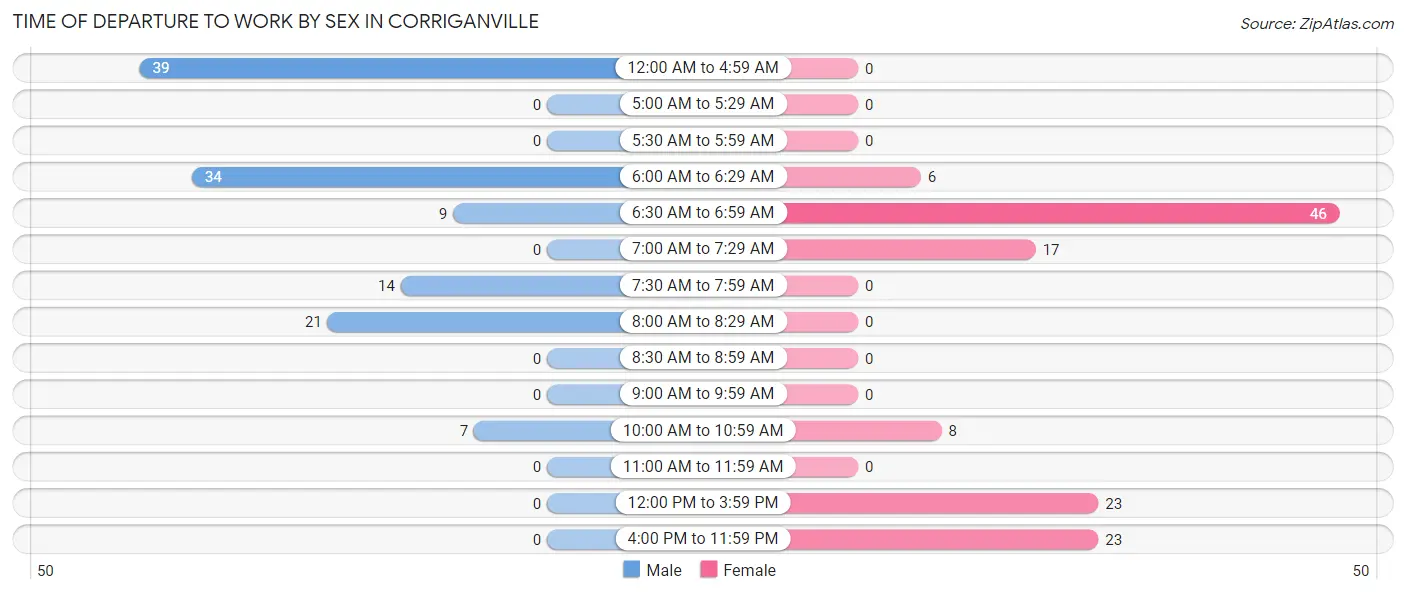
| Time of Departure | Male | Female |
| 12:00 AM to 4:59 AM | 39 (31.5%) | 0 (0.0%) |
| 5:00 AM to 5:29 AM | 0 (0.0%) | 0 (0.0%) |
| 5:30 AM to 5:59 AM | 0 (0.0%) | 0 (0.0%) |
| 6:00 AM to 6:29 AM | 34 (27.4%) | 6 (4.9%) |
| 6:30 AM to 6:59 AM | 9 (7.3%) | 46 (37.4%) |
| 7:00 AM to 7:29 AM | 0 (0.0%) | 17 (13.8%) |
| 7:30 AM to 7:59 AM | 14 (11.3%) | 0 (0.0%) |
| 8:00 AM to 8:29 AM | 21 (16.9%) | 0 (0.0%) |
| 8:30 AM to 8:59 AM | 0 (0.0%) | 0 (0.0%) |
| 9:00 AM to 9:59 AM | 0 (0.0%) | 0 (0.0%) |
| 10:00 AM to 10:59 AM | 7 (5.7%) | 8 (6.5%) |
| 11:00 AM to 11:59 AM | 0 (0.0%) | 0 (0.0%) |
| 12:00 PM to 3:59 PM | 0 (0.0%) | 23 (18.7%) |
| 4:00 PM to 11:59 PM | 0 (0.0%) | 23 (18.7%) |
| Total | 124 (100.0%) | 123 (100.0%) |
Housing Occupancy in Corriganville
Occupancy by Ownership in Corriganville
Of the total 258 dwellings in Corriganville, owner-occupied units account for 179 (69.4%), while renter-occupied units make up 79 (30.6%).
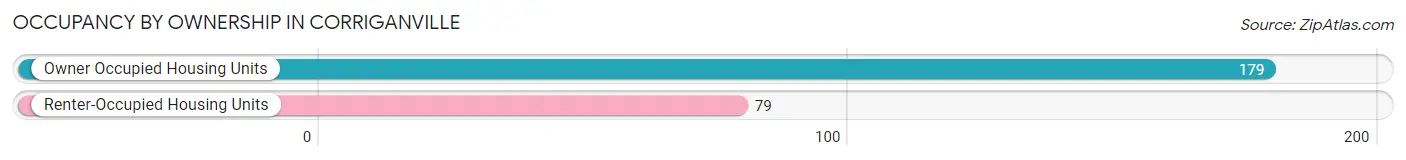
| Occupancy | # Housing Units | % Housing Units |
| Owner Occupied Housing Units | 179 | 69.4% |
| Renter-Occupied Housing Units | 79 | 30.6% |
| Total Occupied Housing Units | 258 | 100.0% |
Occupancy by Household Size in Corriganville
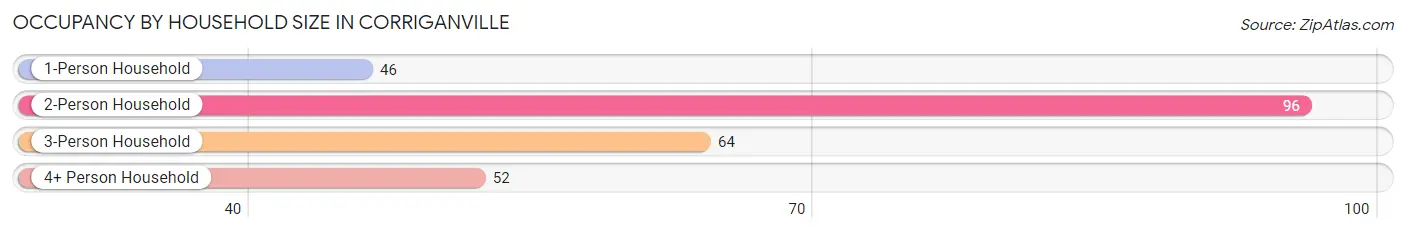
| Household Size | # Housing Units | % Housing Units |
| 1-Person Household | 46 | 17.8% |
| 2-Person Household | 96 | 37.2% |
| 3-Person Household | 64 | 24.8% |
| 4+ Person Household | 52 | 20.2% |
| Total Housing Units | 258 | 100.0% |
Occupancy by Ownership by Household Size in Corriganville
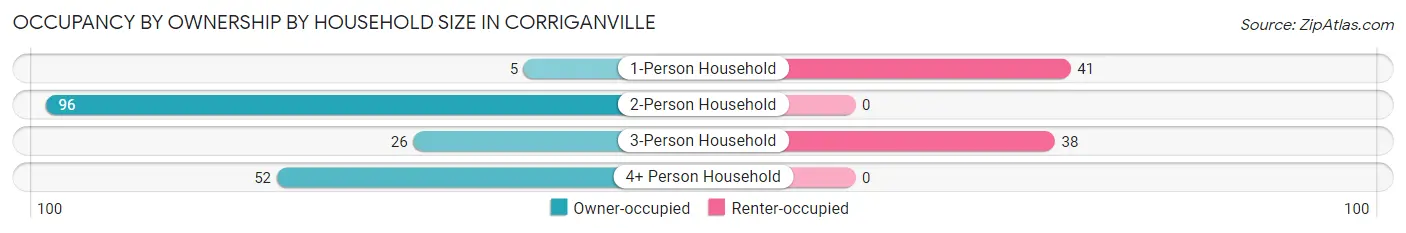
| Household Size | Owner-occupied | Renter-occupied |
| 1-Person Household | 5 (10.9%) | 41 (89.1%) |
| 2-Person Household | 96 (100.0%) | 0 (0.0%) |
| 3-Person Household | 26 (40.6%) | 38 (59.4%) |
| 4+ Person Household | 52 (100.0%) | 0 (0.0%) |
| Total Housing Units | 179 (69.4%) | 79 (30.6%) |
Occupancy by Educational Attainment in Corriganville
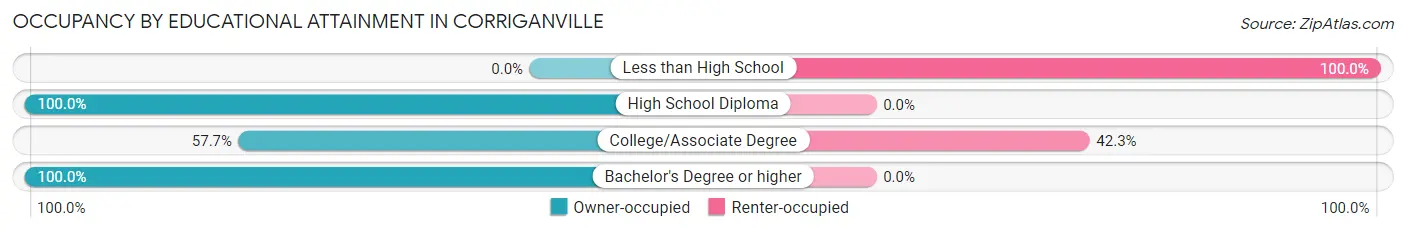
| Household Size | Owner-occupied | Renter-occupied |
| Less than High School | 0 (0.0%) | 16 (100.0%) |
| High School Diploma | 70 (100.0%) | 0 (0.0%) |
| College/Associate Degree | 86 (57.7%) | 63 (42.3%) |
| Bachelor's Degree or higher | 23 (100.0%) | 0 (0.0%) |
Occupancy by Age of Householder in Corriganville
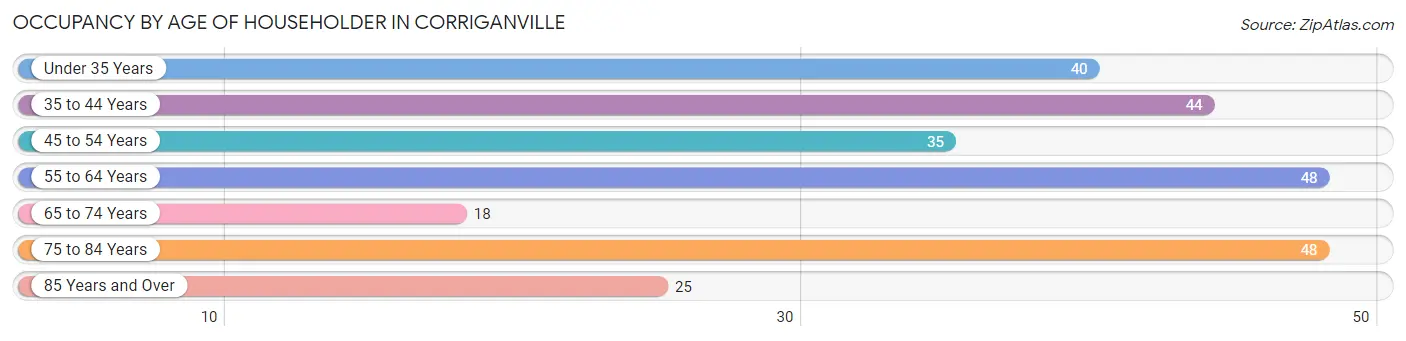
| Age Bracket | # Households | % Households |
| Under 35 Years | 40 | 15.5% |
| 35 to 44 Years | 44 | 17.1% |
| 45 to 54 Years | 35 | 13.6% |
| 55 to 64 Years | 48 | 18.6% |
| 65 to 74 Years | 18 | 7.0% |
| 75 to 84 Years | 48 | 18.6% |
| 85 Years and Over | 25 | 9.7% |
| Total | 258 | 100.0% |
Housing Finances in Corriganville
Median Income by Occupancy in Corriganville
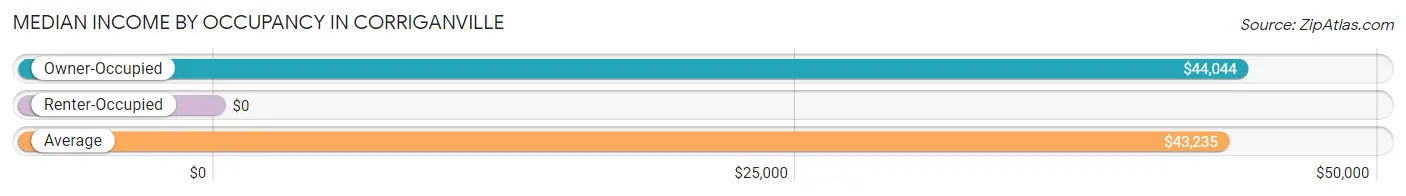
| Occupancy Type | # Households | Median Income |
| Owner-Occupied | 179 (69.4%) | $44,044 |
| Renter-Occupied | 79 (30.6%) | $0 |
| Average | 258 (100.0%) | $43,235 |
Occupancy by Householder Income Bracket in Corriganville
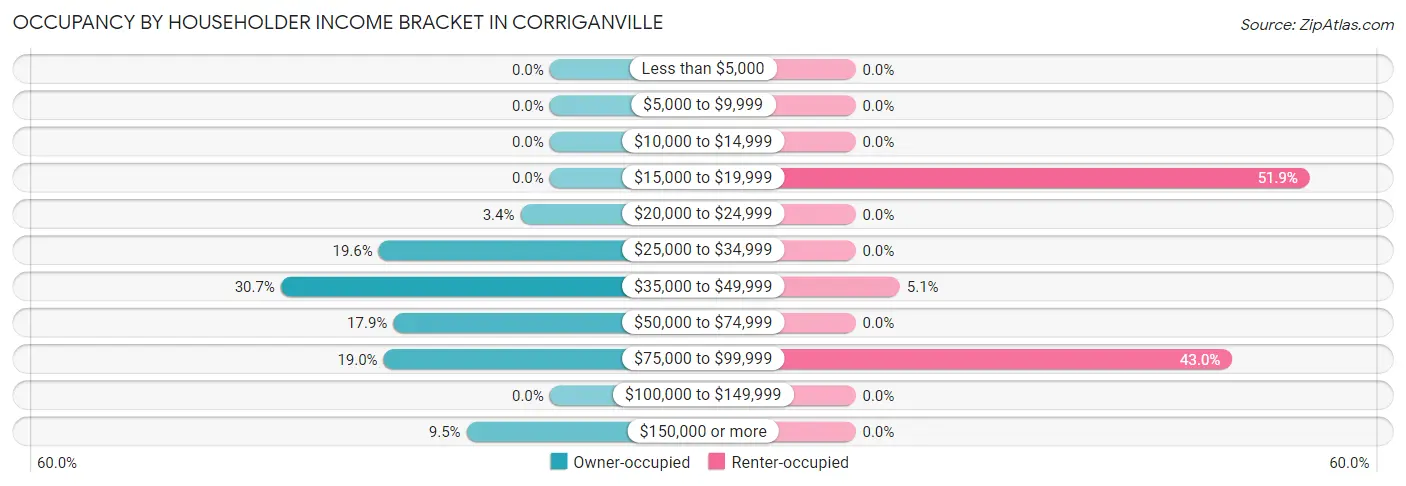
| Income Bracket | Owner-occupied | Renter-occupied |
| Less than $5,000 | 0 (0.0%) | 0 (0.0%) |
| $5,000 to $9,999 | 0 (0.0%) | 0 (0.0%) |
| $10,000 to $14,999 | 0 (0.0%) | 0 (0.0%) |
| $15,000 to $19,999 | 0 (0.0%) | 41 (51.9%) |
| $20,000 to $24,999 | 6 (3.4%) | 0 (0.0%) |
| $25,000 to $34,999 | 35 (19.6%) | 0 (0.0%) |
| $35,000 to $49,999 | 55 (30.7%) | 4 (5.1%) |
| $50,000 to $74,999 | 32 (17.9%) | 0 (0.0%) |
| $75,000 to $99,999 | 34 (19.0%) | 34 (43.0%) |
| $100,000 to $149,999 | 0 (0.0%) | 0 (0.0%) |
| $150,000 or more | 17 (9.5%) | 0 (0.0%) |
| Total | 179 (100.0%) | 79 (100.0%) |
Monthly Housing Cost Tiers in Corriganville
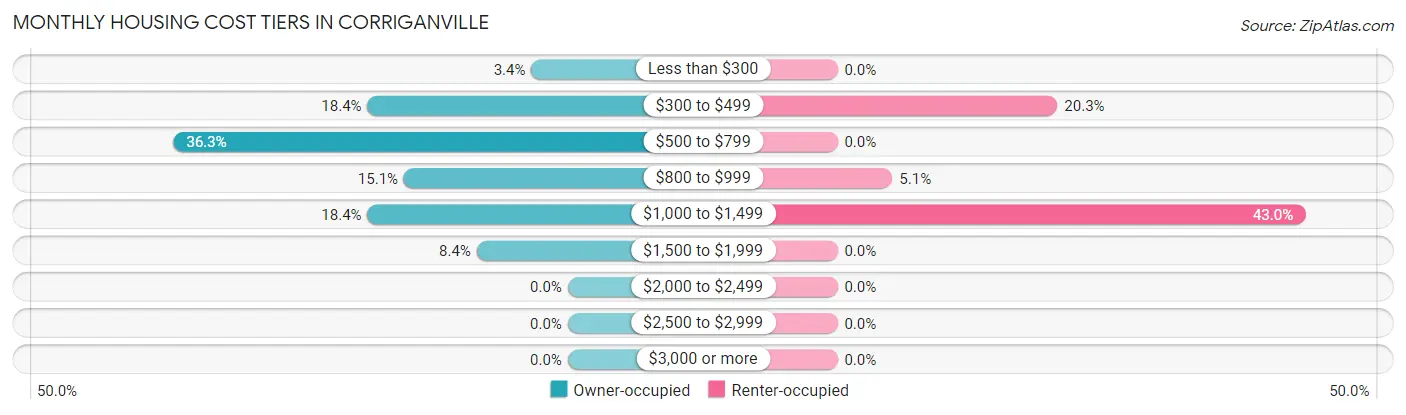
| Monthly Cost | Owner-occupied | Renter-occupied |
| Less than $300 | 6 (3.4%) | 0 (0.0%) |
| $300 to $499 | 33 (18.4%) | 16 (20.3%) |
| $500 to $799 | 65 (36.3%) | 0 (0.0%) |
| $800 to $999 | 27 (15.1%) | 4 (5.1%) |
| $1,000 to $1,499 | 33 (18.4%) | 34 (43.0%) |
| $1,500 to $1,999 | 15 (8.4%) | 0 (0.0%) |
| $2,000 to $2,499 | 0 (0.0%) | 0 (0.0%) |
| $2,500 to $2,999 | 0 (0.0%) | 0 (0.0%) |
| $3,000 or more | 0 (0.0%) | 0 (0.0%) |
| Total | 179 (100.0%) | 79 (100.0%) |
Physical Housing Characteristics in Corriganville
Housing Structures in Corriganville
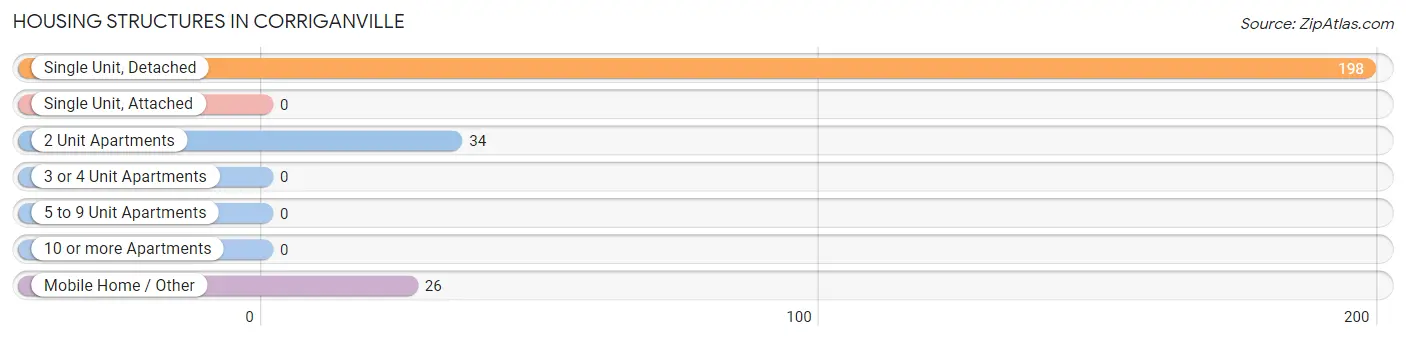
| Structure Type | # Housing Units | % Housing Units |
| Single Unit, Detached | 198 | 76.7% |
| Single Unit, Attached | 0 | 0.0% |
| 2 Unit Apartments | 34 | 13.2% |
| 3 or 4 Unit Apartments | 0 | 0.0% |
| 5 to 9 Unit Apartments | 0 | 0.0% |
| 10 or more Apartments | 0 | 0.0% |
| Mobile Home / Other | 26 | 10.1% |
| Total | 258 | 100.0% |
Housing Structures by Occupancy in Corriganville
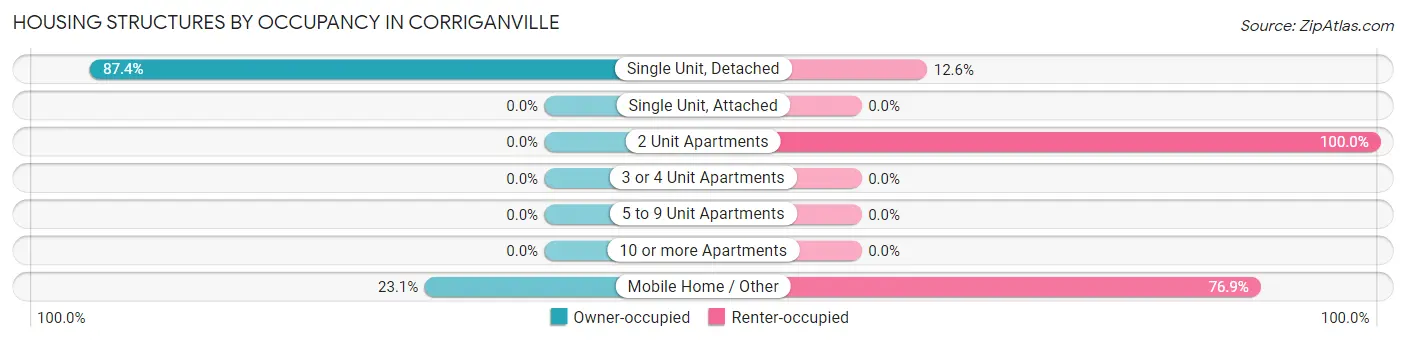
| Structure Type | Owner-occupied | Renter-occupied |
| Single Unit, Detached | 173 (87.4%) | 25 (12.6%) |
| Single Unit, Attached | 0 (0.0%) | 0 (0.0%) |
| 2 Unit Apartments | 0 (0.0%) | 34 (100.0%) |
| 3 or 4 Unit Apartments | 0 (0.0%) | 0 (0.0%) |
| 5 to 9 Unit Apartments | 0 (0.0%) | 0 (0.0%) |
| 10 or more Apartments | 0 (0.0%) | 0 (0.0%) |
| Mobile Home / Other | 6 (23.1%) | 20 (76.9%) |
| Total | 179 (69.4%) | 79 (30.6%) |
Housing Structures by Number of Rooms in Corriganville
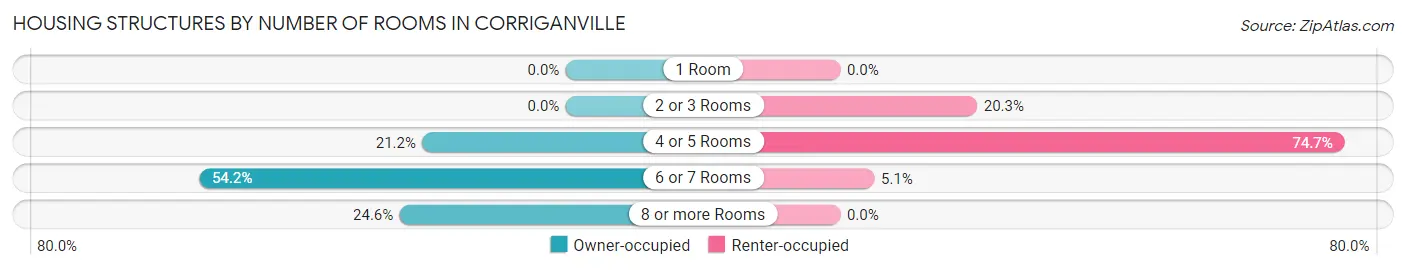
| Number of Rooms | Owner-occupied | Renter-occupied |
| 1 Room | 0 (0.0%) | 0 (0.0%) |
| 2 or 3 Rooms | 0 (0.0%) | 16 (20.3%) |
| 4 or 5 Rooms | 38 (21.2%) | 59 (74.7%) |
| 6 or 7 Rooms | 97 (54.2%) | 4 (5.1%) |
| 8 or more Rooms | 44 (24.6%) | 0 (0.0%) |
| Total | 179 (100.0%) | 79 (100.0%) |
Housing Structure by Heating Type in Corriganville
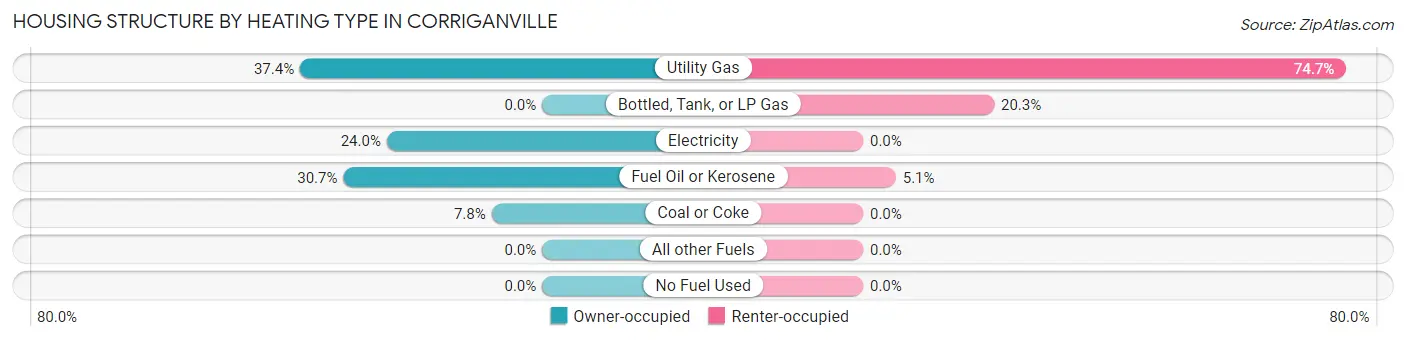
| Heating Type | Owner-occupied | Renter-occupied |
| Utility Gas | 67 (37.4%) | 59 (74.7%) |
| Bottled, Tank, or LP Gas | 0 (0.0%) | 16 (20.3%) |
| Electricity | 43 (24.0%) | 0 (0.0%) |
| Fuel Oil or Kerosene | 55 (30.7%) | 4 (5.1%) |
| Coal or Coke | 14 (7.8%) | 0 (0.0%) |
| All other Fuels | 0 (0.0%) | 0 (0.0%) |
| No Fuel Used | 0 (0.0%) | 0 (0.0%) |
| Total | 179 (100.0%) | 79 (100.0%) |
Household Vehicle Usage in Corriganville
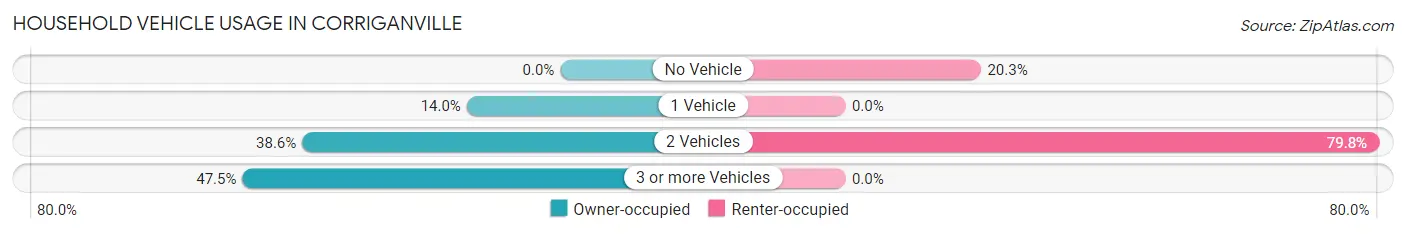
| Vehicles per Household | Owner-occupied | Renter-occupied |
| No Vehicle | 0 (0.0%) | 16 (20.3%) |
| 1 Vehicle | 25 (14.0%) | 0 (0.0%) |
| 2 Vehicles | 69 (38.6%) | 63 (79.7%) |
| 3 or more Vehicles | 85 (47.5%) | 0 (0.0%) |
| Total | 179 (100.0%) | 79 (100.0%) |
Real Estate & Mortgages in Corriganville
Real Estate and Mortgage Overview in Corriganville
| Characteristic | Without Mortgage | With Mortgage |
| Housing Units | 82 | 97 |
| Median Property Value | $127,300 | $98,500 |
| Median Household Income | $35,893 | $17 |
| Monthly Housing Costs | $513 | $0 |
| Real Estate Taxes | $1,542 | $0 |
Property Value by Mortgage Status in Corriganville
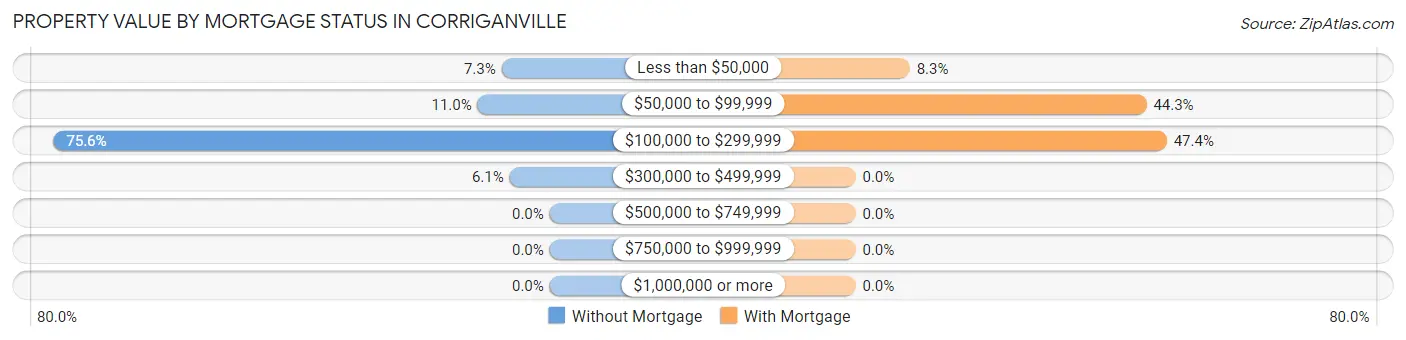
| Property Value | Without Mortgage | With Mortgage |
| Less than $50,000 | 6 (7.3%) | 8 (8.3%) |
| $50,000 to $99,999 | 9 (11.0%) | 43 (44.3%) |
| $100,000 to $299,999 | 62 (75.6%) | 46 (47.4%) |
| $300,000 to $499,999 | 5 (6.1%) | 0 (0.0%) |
| $500,000 to $749,999 | 0 (0.0%) | 0 (0.0%) |
| $750,000 to $999,999 | 0 (0.0%) | 0 (0.0%) |
| $1,000,000 or more | 0 (0.0%) | 0 (0.0%) |
| Total | 82 (100.0%) | 97 (100.0%) |
Household Income by Mortgage Status in Corriganville
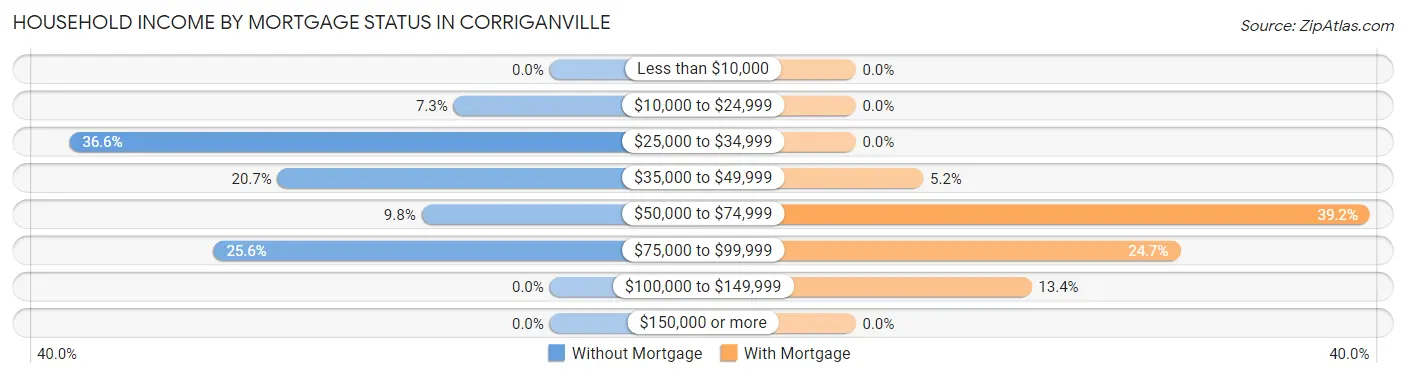
| Household Income | Without Mortgage | With Mortgage |
| Less than $10,000 | 0 (0.0%) | 0 (0.0%) |
| $10,000 to $24,999 | 6 (7.3%) | 0 (0.0%) |
| $25,000 to $34,999 | 30 (36.6%) | 0 (0.0%) |
| $35,000 to $49,999 | 17 (20.7%) | 5 (5.1%) |
| $50,000 to $74,999 | 8 (9.8%) | 38 (39.2%) |
| $75,000 to $99,999 | 21 (25.6%) | 24 (24.7%) |
| $100,000 to $149,999 | 0 (0.0%) | 13 (13.4%) |
| $150,000 or more | 0 (0.0%) | 0 (0.0%) |
| Total | 82 (100.0%) | 97 (100.0%) |
Property Value to Household Income Ratio in Corriganville
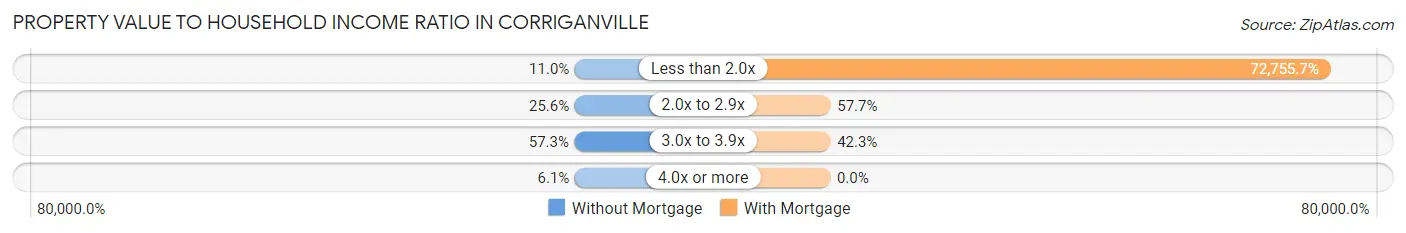
| Value-to-Income Ratio | Without Mortgage | With Mortgage |
| Less than 2.0x | 9 (11.0%) | 70,573 (72,755.7%) |
| 2.0x to 2.9x | 21 (25.6%) | 56 (57.7%) |
| 3.0x to 3.9x | 47 (57.3%) | 41 (42.3%) |
| 4.0x or more | 5 (6.1%) | 0 (0.0%) |
| Total | 82 (100.0%) | 97 (100.0%) |
Real Estate Taxes by Mortgage Status in Corriganville
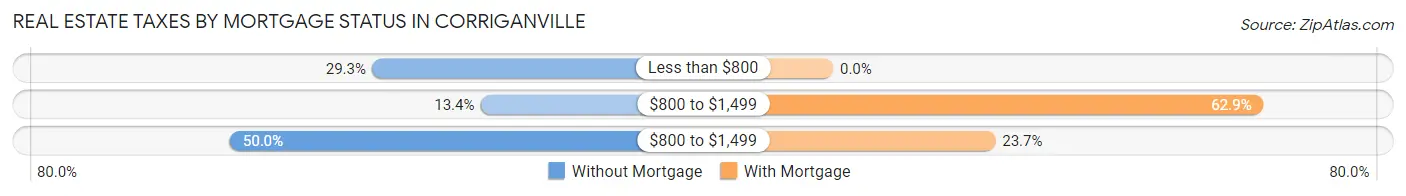
| Property Taxes | Without Mortgage | With Mortgage |
| Less than $800 | 24 (29.3%) | 0 (0.0%) |
| $800 to $1,499 | 11 (13.4%) | 61 (62.9%) |
| $800 to $1,499 | 41 (50.0%) | 23 (23.7%) |
| Total | 82 (100.0%) | 97 (100.0%) |
Health & Disability in Corriganville
Health Insurance Coverage by Age in Corriganville
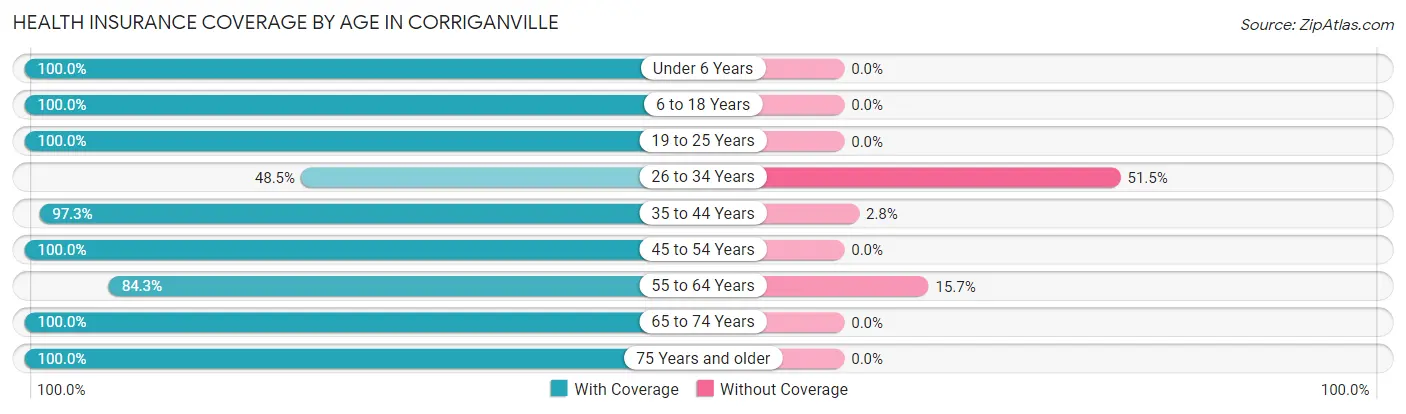
| Age Bracket | With Coverage | Without Coverage |
| Under 6 Years | 139 (100.0%) | 0 (0.0%) |
| 6 to 18 Years | 52 (100.0%) | 0 (0.0%) |
| 19 to 25 Years | 73 (100.0%) | 0 (0.0%) |
| 26 to 34 Years | 32 (48.5%) | 34 (51.5%) |
| 35 to 44 Years | 106 (97.3%) | 3 (2.8%) |
| 45 to 54 Years | 67 (100.0%) | 0 (0.0%) |
| 55 to 64 Years | 59 (84.3%) | 11 (15.7%) |
| 65 to 74 Years | 38 (100.0%) | 0 (0.0%) |
| 75 Years and older | 103 (100.0%) | 0 (0.0%) |
| Total | 669 (93.3%) | 48 (6.7%) |
Health Insurance Coverage by Citizenship Status in Corriganville
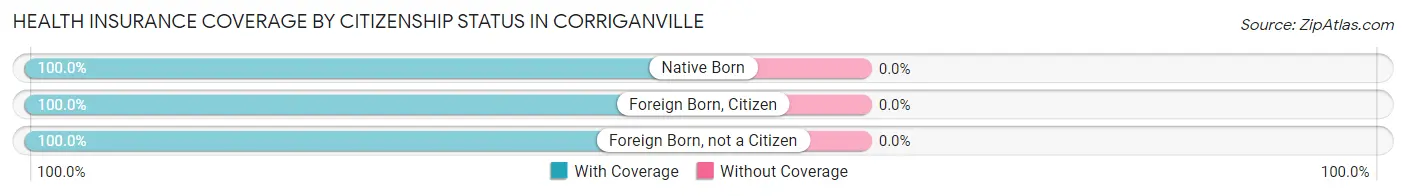
| Citizenship Status | With Coverage | Without Coverage |
| Native Born | 139 (100.0%) | 0 (0.0%) |
| Foreign Born, Citizen | 52 (100.0%) | 0 (0.0%) |
| Foreign Born, not a Citizen | 73 (100.0%) | 0 (0.0%) |
Health Insurance Coverage by Household Income in Corriganville
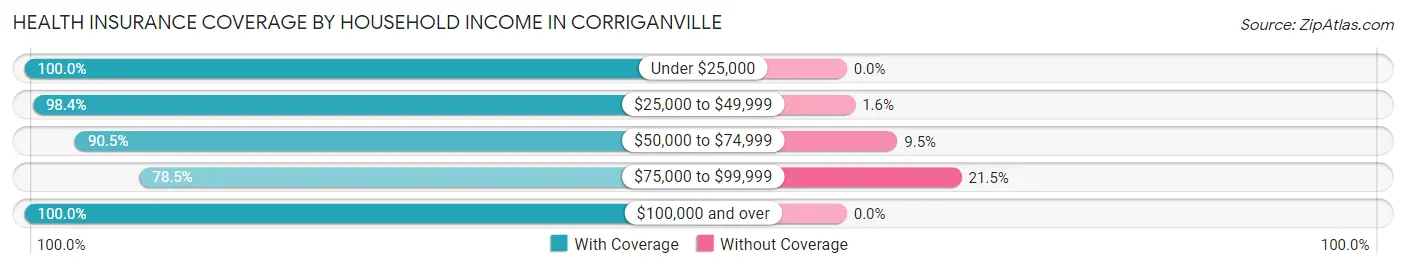
| Household Income | With Coverage | Without Coverage |
| Under $25,000 | 73 (100.0%) | 0 (0.0%) |
| $25,000 to $49,999 | 312 (98.4%) | 5 (1.6%) |
| $50,000 to $74,999 | 86 (90.5%) | 9 (9.5%) |
| $75,000 to $99,999 | 124 (78.5%) | 34 (21.5%) |
| $100,000 and over | 72 (100.0%) | 0 (0.0%) |
Public vs Private Health Insurance Coverage by Age in Corriganville
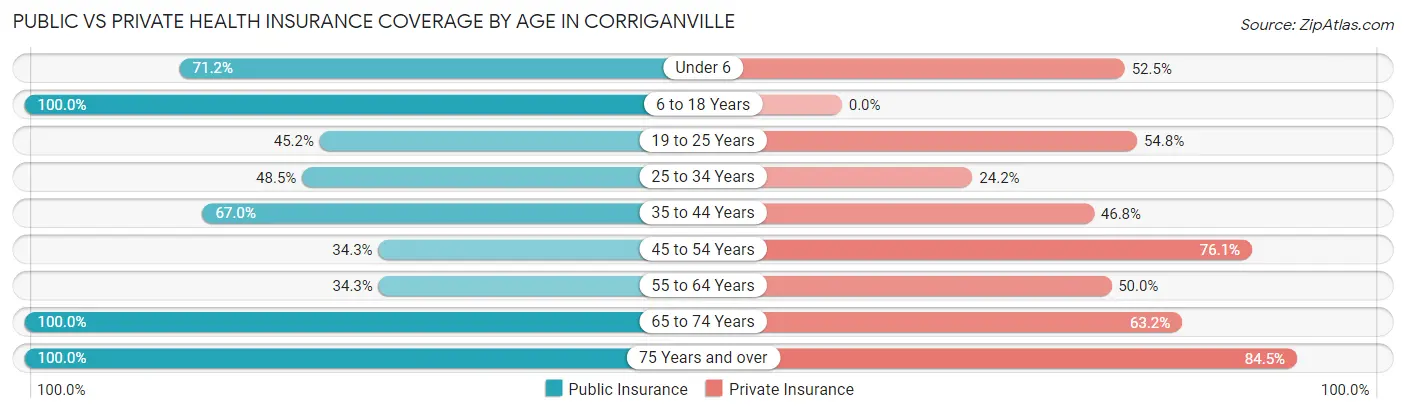
| Age Bracket | Public Insurance | Private Insurance |
| Under 6 | 99 (71.2%) | 73 (52.5%) |
| 6 to 18 Years | 52 (100.0%) | 0 (0.0%) |
| 19 to 25 Years | 33 (45.2%) | 40 (54.8%) |
| 25 to 34 Years | 32 (48.5%) | 16 (24.2%) |
| 35 to 44 Years | 73 (67.0%) | 51 (46.8%) |
| 45 to 54 Years | 23 (34.3%) | 51 (76.1%) |
| 55 to 64 Years | 24 (34.3%) | 35 (50.0%) |
| 65 to 74 Years | 38 (100.0%) | 24 (63.2%) |
| 75 Years and over | 103 (100.0%) | 87 (84.5%) |
| Total | 477 (66.5%) | 377 (52.6%) |
Disability Status by Sex by Age in Corriganville
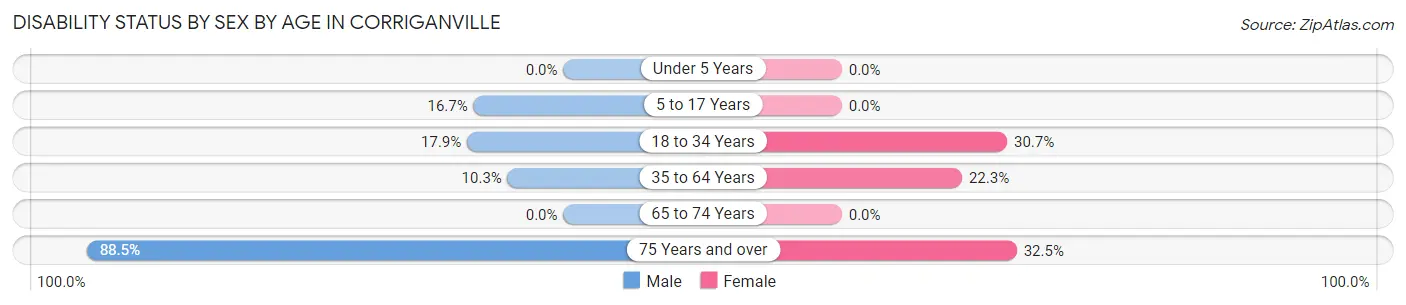
| Age Bracket | Male | Female |
| Under 5 Years | 0 (0.0%) | 0 (0.0%) |
| 5 to 17 Years | 7 (16.7%) | 0 (0.0%) |
| 18 to 34 Years | 10 (17.9%) | 27 (30.7%) |
| 35 to 64 Years | 12 (10.3%) | 29 (22.3%) |
| 65 to 74 Years | 0 (0.0%) | 0 (0.0%) |
| 75 Years and over | 23 (88.5%) | 25 (32.5%) |
Disability Class by Sex by Age in Corriganville
Disability Class: Hearing Difficulty
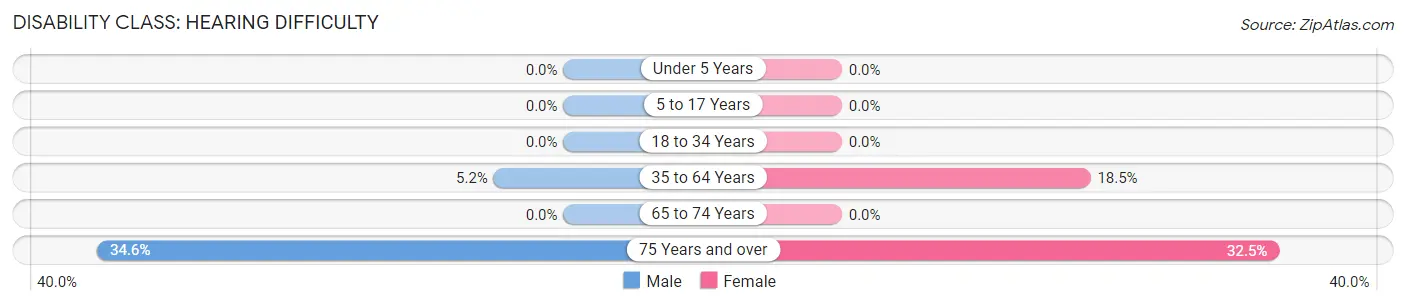
| Age Bracket | Male | Female |
| Under 5 Years | 0 (0.0%) | 0 (0.0%) |
| 5 to 17 Years | 0 (0.0%) | 0 (0.0%) |
| 18 to 34 Years | 0 (0.0%) | 0 (0.0%) |
| 35 to 64 Years | 6 (5.2%) | 24 (18.5%) |
| 65 to 74 Years | 0 (0.0%) | 0 (0.0%) |
| 75 Years and over | 9 (34.6%) | 25 (32.5%) |
Disability Class: Vision Difficulty
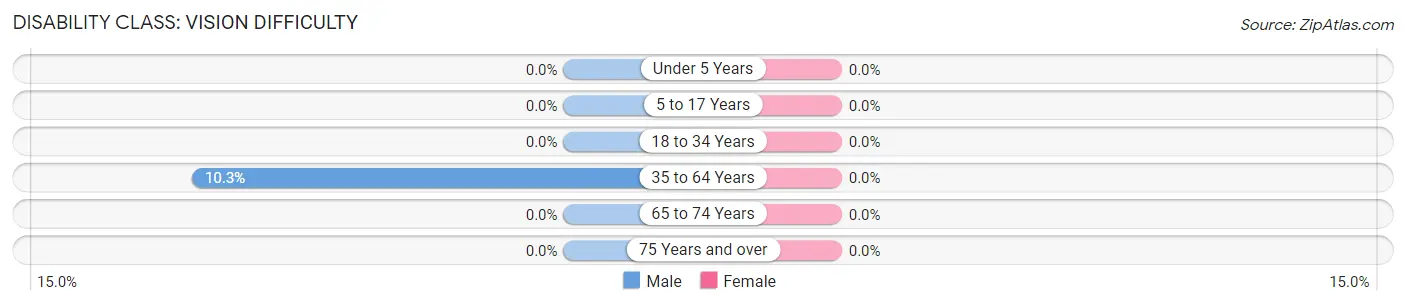
| Age Bracket | Male | Female |
| Under 5 Years | 0 (0.0%) | 0 (0.0%) |
| 5 to 17 Years | 0 (0.0%) | 0 (0.0%) |
| 18 to 34 Years | 0 (0.0%) | 0 (0.0%) |
| 35 to 64 Years | 12 (10.3%) | 0 (0.0%) |
| 65 to 74 Years | 0 (0.0%) | 0 (0.0%) |
| 75 Years and over | 0 (0.0%) | 0 (0.0%) |
Disability Class: Cognitive Difficulty
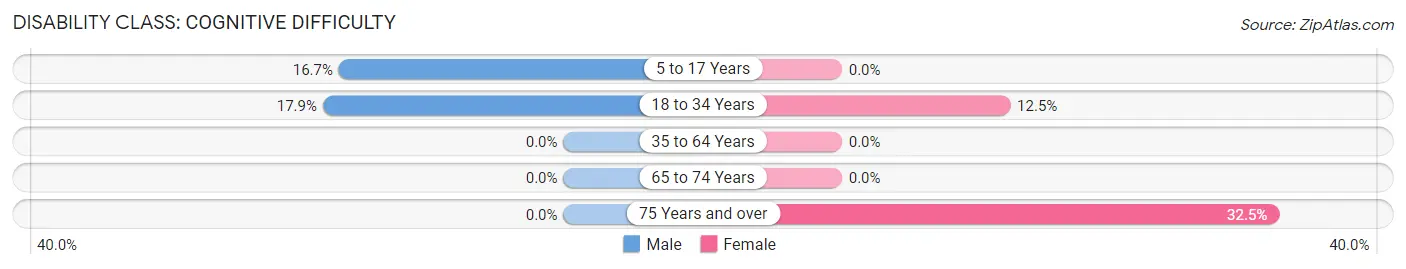
| Age Bracket | Male | Female |
| 5 to 17 Years | 7 (16.7%) | 0 (0.0%) |
| 18 to 34 Years | 10 (17.9%) | 11 (12.5%) |
| 35 to 64 Years | 0 (0.0%) | 0 (0.0%) |
| 65 to 74 Years | 0 (0.0%) | 0 (0.0%) |
| 75 Years and over | 0 (0.0%) | 25 (32.5%) |
Disability Class: Ambulatory Difficulty
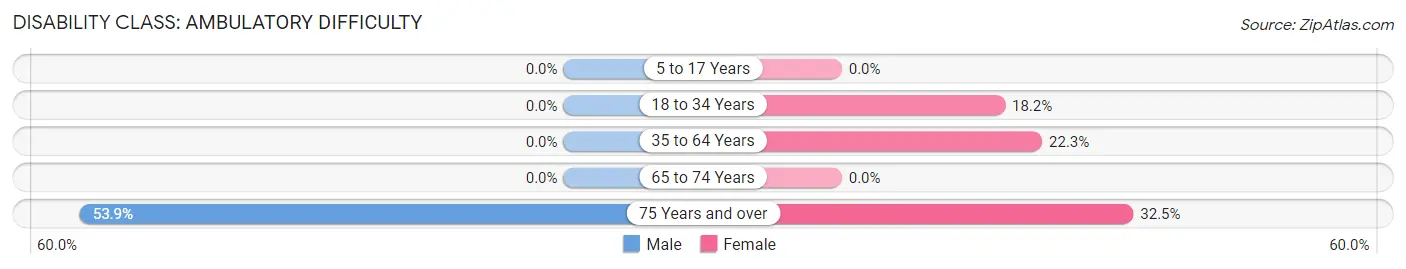
| Age Bracket | Male | Female |
| 5 to 17 Years | 0 (0.0%) | 0 (0.0%) |
| 18 to 34 Years | 0 (0.0%) | 16 (18.2%) |
| 35 to 64 Years | 0 (0.0%) | 29 (22.3%) |
| 65 to 74 Years | 0 (0.0%) | 0 (0.0%) |
| 75 Years and over | 14 (53.8%) | 25 (32.5%) |
Disability Class: Self-Care Difficulty
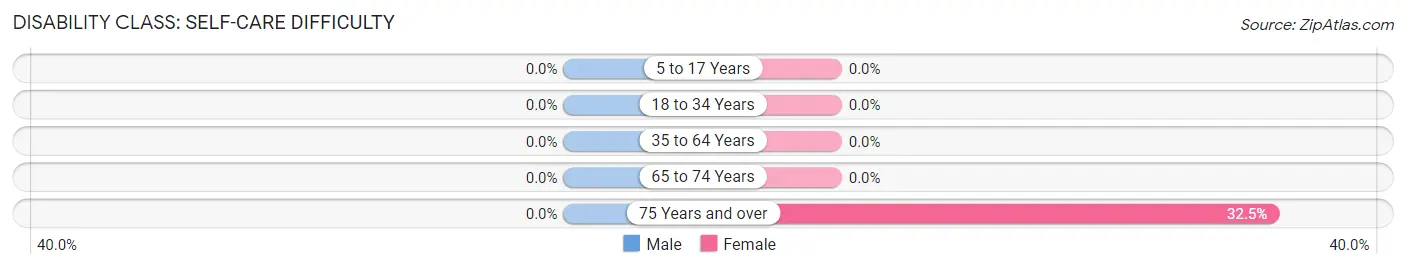
| Age Bracket | Male | Female |
| 5 to 17 Years | 0 (0.0%) | 0 (0.0%) |
| 18 to 34 Years | 0 (0.0%) | 0 (0.0%) |
| 35 to 64 Years | 0 (0.0%) | 0 (0.0%) |
| 65 to 74 Years | 0 (0.0%) | 0 (0.0%) |
| 75 Years and over | 0 (0.0%) | 25 (32.5%) |
Technology Access in Corriganville
Computing Device Access in Corriganville
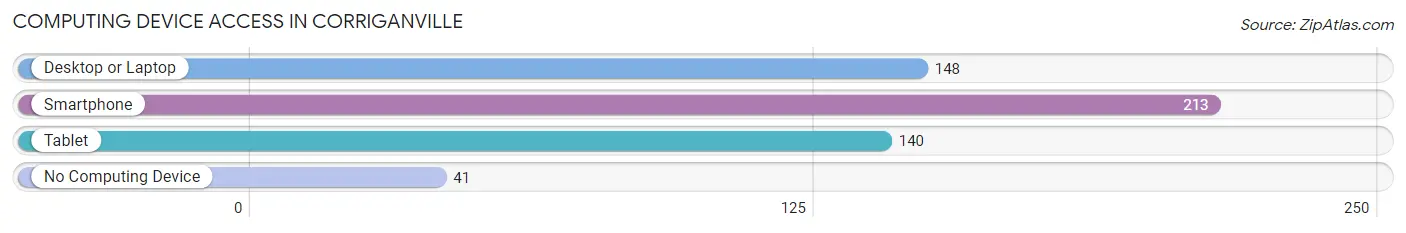
| Device Type | # Households | % Households |
| Desktop or Laptop | 148 | 57.4% |
| Smartphone | 213 | 82.6% |
| Tablet | 140 | 54.3% |
| No Computing Device | 41 | 15.9% |
| Total | 258 | 100.0% |
Internet Access in Corriganville
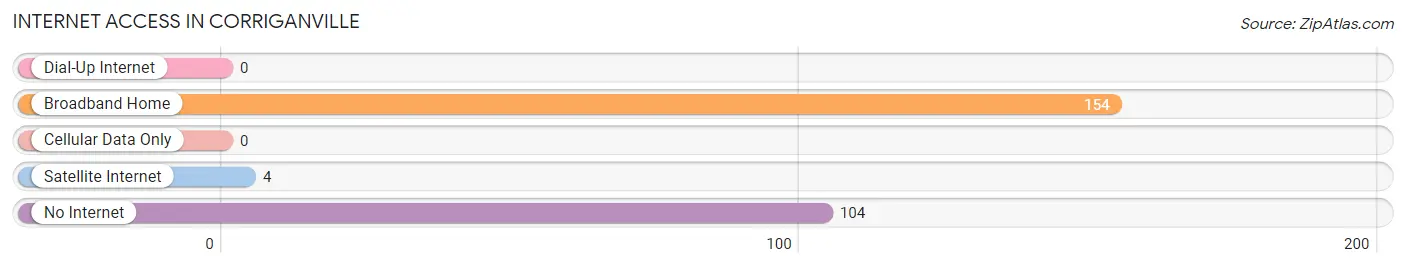
| Internet Type | # Households | % Households |
| Dial-Up Internet | 0 | 0.0% |
| Broadband Home | 154 | 59.7% |
| Cellular Data Only | 0 | 0.0% |
| Satellite Internet | 4 | 1.5% |
| No Internet | 104 | 40.3% |
| Total | 258 | 100.0% |
Corriganville Summary
Corriganville, Maryland is a small unincorporated community located in Washington County, Maryland. It is situated in the Appalachian Mountains, approximately 10 miles south of Hagerstown. The community is named after the Corrigan family, who were among the first settlers in the area.
History
The Corrigan family first settled in the area in the late 1700s. The family was of Irish descent and had come to the area from Pennsylvania. The Corrigans were farmers and raised livestock, as well as growing crops such as corn, wheat, and oats. The family also operated a sawmill and a gristmill.
In the early 1900s, the Corrigans began to develop the area into a tourist destination. They built a hotel, a dance hall, and a movie theater. The Corrigans also opened a general store and a post office. The Corrigans also built a small amusement park, which included a roller coaster, a ferris wheel, and a carousel.
The Corrigans sold the property in the 1950s and it was eventually purchased by Ray Corrigan, a Hollywood actor and stuntman. Corrigan used the property as a movie set and it was featured in several films, including The Ten Commandments and The Alamo.
Geography
Corriganville is located in Washington County, Maryland. It is situated in the Appalachian Mountains, approximately 10 miles south of Hagerstown. The area is characterized by rolling hills and valleys, with the highest point being Corrigan Mountain, which rises to an elevation of 1,890 feet. The area is also home to several creeks and streams, including the Antietam Creek and the Conococheague Creek.
Economy
The economy of Corriganville is largely based on tourism. The area is home to several attractions, including the Corriganville Movie Set, which is a popular tourist destination. The area is also home to several wineries, breweries, and distilleries, as well as several restaurants and shops.
Demographics
As of the 2010 census, the population of Corriganville was 1,890. The racial makeup of the town was 97.2% White, 0.9% African American, 0.3% Native American, 0.2% Asian, 0.1% Pacific Islander, and 0.3% from other races. The median household income was $45,000, and the median family income was $50,000. The per capita income was $20,000.
Conclusion
Corriganville, Maryland is a small unincorporated community located in Washington County, Maryland. It is situated in the Appalachian Mountains, approximately 10 miles south of Hagerstown. The area is characterized by rolling hills and valleys, with the highest point being Corrigan Mountain. The economy of Corriganville is largely based on tourism, with the Corriganville Movie Set being a popular tourist destination. As of the 2010 census, the population of Corriganville was 1,890. The racial makeup of the town was 97.2% White, 0.9% African American, 0.3% Native American, 0.2% Asian, 0.1% Pacific Islander, and 0.3% from other races. The median household income was $45,000, and the median family income was $50,000. The per capita income was $20,000.
Common Questions
What is Per Capita Income in Corriganville?
Per Capita income in Corriganville is $22,559.
What is the Median Family Income in Corriganville?
Median Family Income in Corriganville is $60,110.
What is the Median Household income in Corriganville?
Median Household Income in Corriganville is $43,235.
What is Income or Wage Gap in Corriganville?
Income or Wage Gap in Corriganville is 1.2%.
Women in Corriganville earn 98.8 cents for every dollar earned by a man.
What is Inequality or Gini Index in Corriganville?
Inequality or Gini Index in Corriganville is 0.36.
What is the Total Population of Corriganville?
Total Population of Corriganville is 717.
What is the Total Male Population of Corriganville?
Total Male Population of Corriganville is 278.
What is the Total Female Population of Corriganville?
Total Female Population of Corriganville is 439.
What is the Ratio of Males per 100 Females in Corriganville?
There are 63.33 Males per 100 Females in Corriganville.
What is the Ratio of Females per 100 Males in Corriganville?
There are 157.91 Females per 100 Males in Corriganville.
What is the Median Population Age in Corriganville?
Median Population Age in Corriganville is 36.8 Years.
What is the Average Family Size in Corriganville
Average Family Size in Corriganville is 2.9 People.
What is the Average Household Size in Corriganville
Average Household Size in Corriganville is 2.8 People.
How Large is the Labor Force in Corriganville?
There are 264 People in the Labor Forcein in Corriganville.
What is the Percentage of People in the Labor Force in Corriganville?
49.7% of People are in the Labor Force in Corriganville.