Sabillasville, MD Map & Demographics
Sabillasville Map
Sabillasville Overview
$27,613
PER CAPITA INCOME
$54,352
AVG FAMILY INCOME
$53,472
AVG HOUSEHOLD INCOME
50.3%
WAGE / INCOME GAP [ % ]
49.7¢/ $1
WAGE / INCOME GAP [ $ ]
0.37
INEQUALITY / GINI INDEX
405
TOTAL POPULATION
207
MALE POPULATION
198
FEMALE POPULATION
104.55
MALES / 100 FEMALES
95.65
FEMALES / 100 MALES
50.5
MEDIAN AGE
2.9
AVG FAMILY SIZE
2.6
AVG HOUSEHOLD SIZE
222
LABOR FORCE [ PEOPLE ]
59.2%
PERCENT IN LABOR FORCE
Sabillasville Zip Codes
Sabillasville Area Codes
Income in Sabillasville
Income Overview in Sabillasville
Per Capita Income in Sabillasville is $27,613, while median incomes of families and households are $54,352 and $53,472 respectively.
| Characteristic | Number | Measure |
| Per Capita Income | 405 | $27,613 |
| Median Family Income | 102 | $54,352 |
| Mean Family Income | 102 | $84,890 |
| Median Household Income | 141 | $53,472 |
| Mean Household Income | 141 | $78,119 |
| Income Deficit | 102 | $0 |
| Wage / Income Gap (%) | 405 | 50.30% |
| Wage / Income Gap ($) | 405 | 49.70¢ per $1 |
| Gini / Inequality Index | 405 | 0.37 |
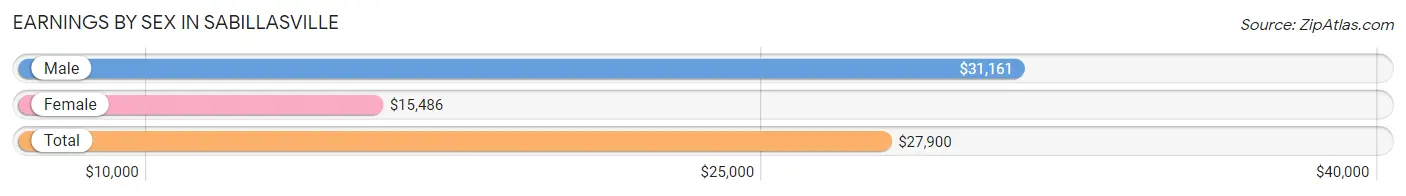
Earnings by Sex in Sabillasville
Average Earnings in Sabillasville are $27,900, $31,161 for men and $15,486 for women, a difference of 50.3%.
| Sex | Number | Average Earnings |
| Male | 123 (53.0%) | $31,161 |
| Female | 109 (47.0%) | $15,486 |
| Total | 232 (100.0%) | $27,900 |
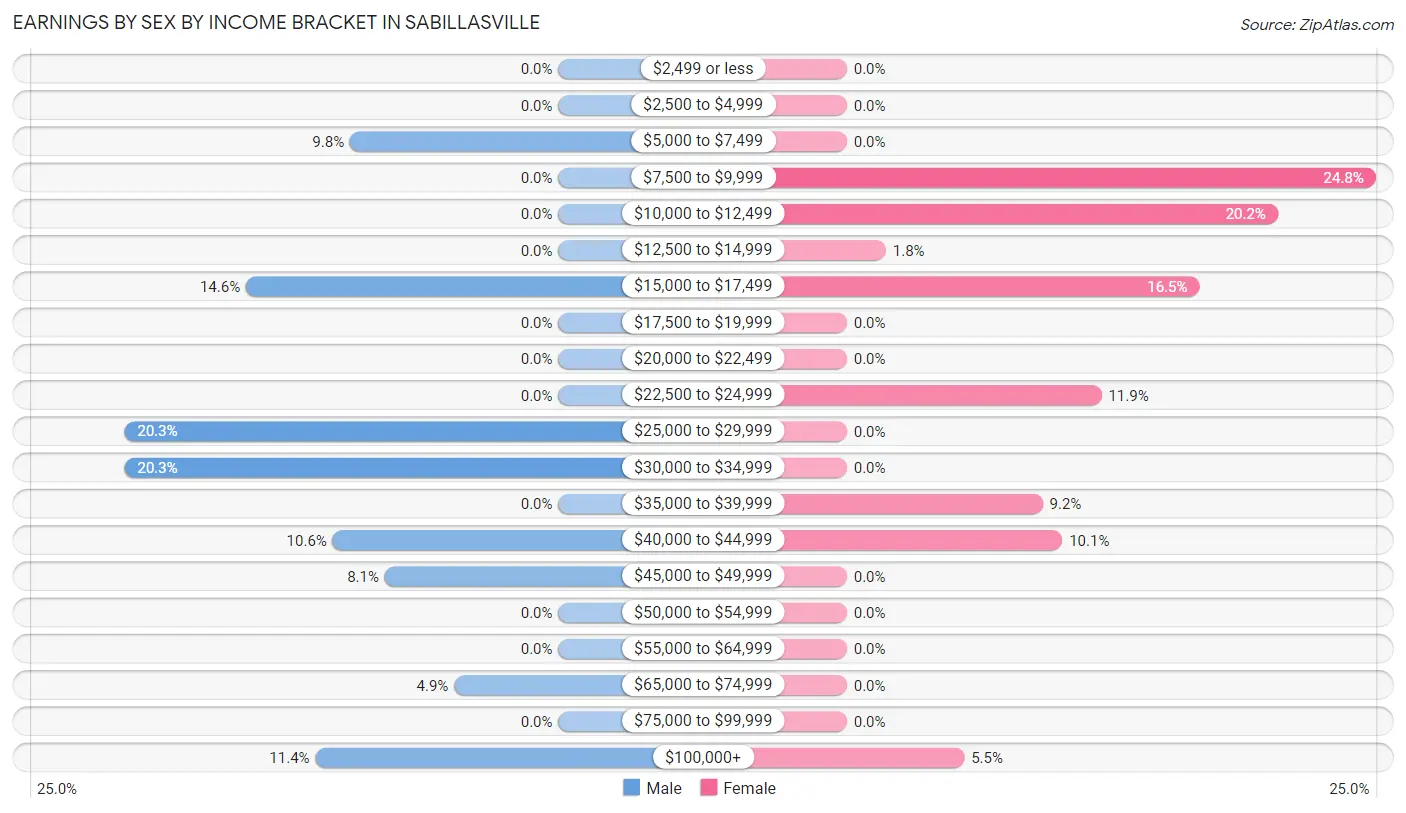
Earnings by Sex by Income Bracket in Sabillasville
The most common earnings brackets in Sabillasville are $25,000 to $29,999 for men (25 | 20.3%) and $7,500 to $9,999 for women (27 | 24.8%).
| Income | Male | Female |
| $2,499 or less | 0 (0.0%) | 0 (0.0%) |
| $2,500 to $4,999 | 0 (0.0%) | 0 (0.0%) |
| $5,000 to $7,499 | 12 (9.8%) | 0 (0.0%) |
| $7,500 to $9,999 | 0 (0.0%) | 27 (24.8%) |
| $10,000 to $12,499 | 0 (0.0%) | 22 (20.2%) |
| $12,500 to $14,999 | 0 (0.0%) | 2 (1.8%) |
| $15,000 to $17,499 | 18 (14.6%) | 18 (16.5%) |
| $17,500 to $19,999 | 0 (0.0%) | 0 (0.0%) |
| $20,000 to $22,499 | 0 (0.0%) | 0 (0.0%) |
| $22,500 to $24,999 | 0 (0.0%) | 13 (11.9%) |
| $25,000 to $29,999 | 25 (20.3%) | 0 (0.0%) |
| $30,000 to $34,999 | 25 (20.3%) | 0 (0.0%) |
| $35,000 to $39,999 | 0 (0.0%) | 10 (9.2%) |
| $40,000 to $44,999 | 13 (10.6%) | 11 (10.1%) |
| $45,000 to $49,999 | 10 (8.1%) | 0 (0.0%) |
| $50,000 to $54,999 | 0 (0.0%) | 0 (0.0%) |
| $55,000 to $64,999 | 0 (0.0%) | 0 (0.0%) |
| $65,000 to $74,999 | 6 (4.9%) | 0 (0.0%) |
| $75,000 to $99,999 | 0 (0.0%) | 0 (0.0%) |
| $100,000+ | 14 (11.4%) | 6 (5.5%) |
| Total | 123 (100.0%) | 109 (100.0%) |
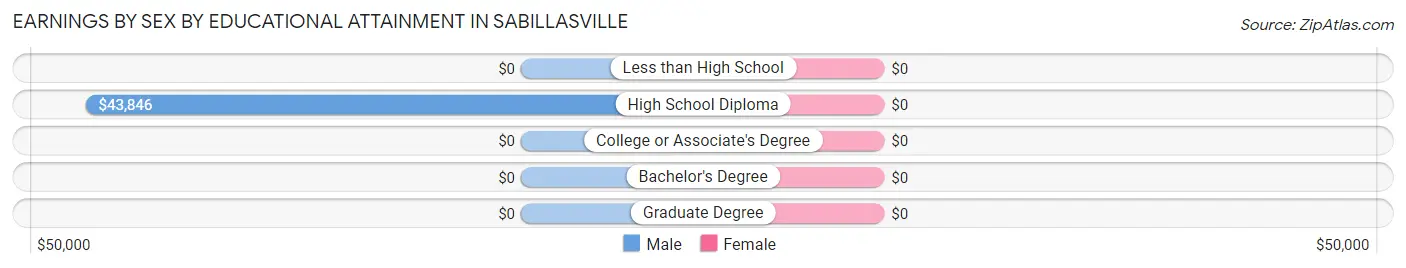
Earnings by Sex by Educational Attainment in Sabillasville
| Educational Attainment | Male Income | Female Income |
| Less than High School | - | - |
| High School Diploma | $43,846 | $0 |
| College or Associate's Degree | - | - |
| Bachelor's Degree | - | - |
| Graduate Degree | - | - |
| Total | $43,558 | $0 |
Family Income in Sabillasville
Family Income Brackets in Sabillasville
According to the Sabillasville family income data, there are 27 families falling into the $50,000 to $74,999 income range, which is the most common income bracket and makes up 26.5% of all families.
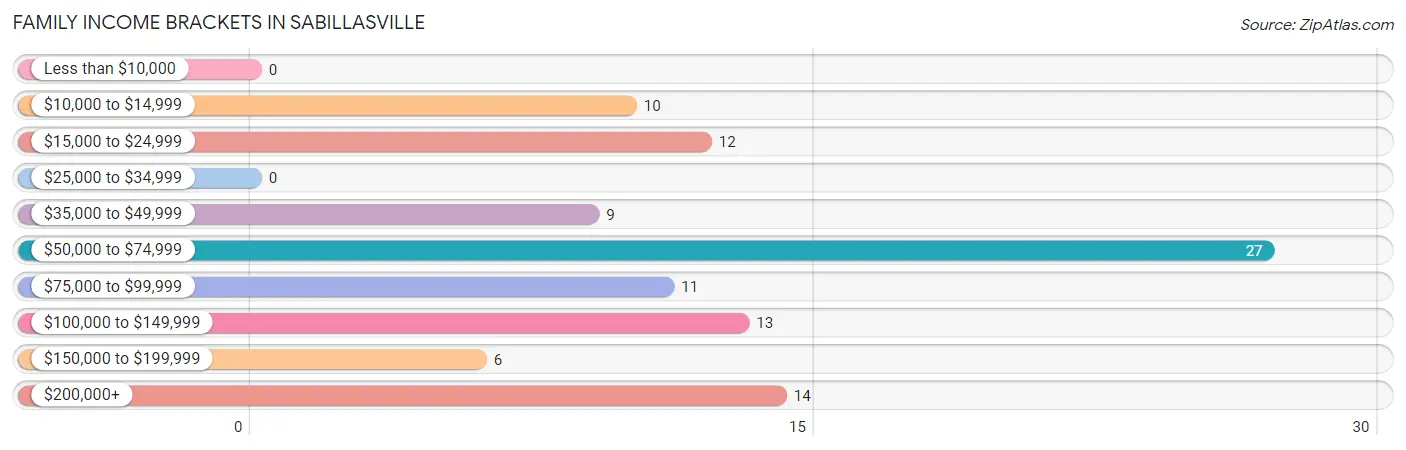
| Income Bracket | # Families | % Families |
| Less than $10,000 | 0 | 0.0% |
| $10,000 to $14,999 | 10 | 9.8% |
| $15,000 to $24,999 | 12 | 11.8% |
| $25,000 to $34,999 | 0 | 0.0% |
| $35,000 to $49,999 | 9 | 8.8% |
| $50,000 to $74,999 | 27 | 26.5% |
| $75,000 to $99,999 | 11 | 10.8% |
| $100,000 to $149,999 | 13 | 12.7% |
| $150,000 to $199,999 | 6 | 5.9% |
| $200,000+ | 14 | 13.7% |
Family Income by Famaliy Size in Sabillasville
2-person families (69 | 67.6%) account for the highest median family income in Sabillasville with $52,824 per family, while 2-person families (69 | 67.6%) have the highest median income of $26,412 per family member.
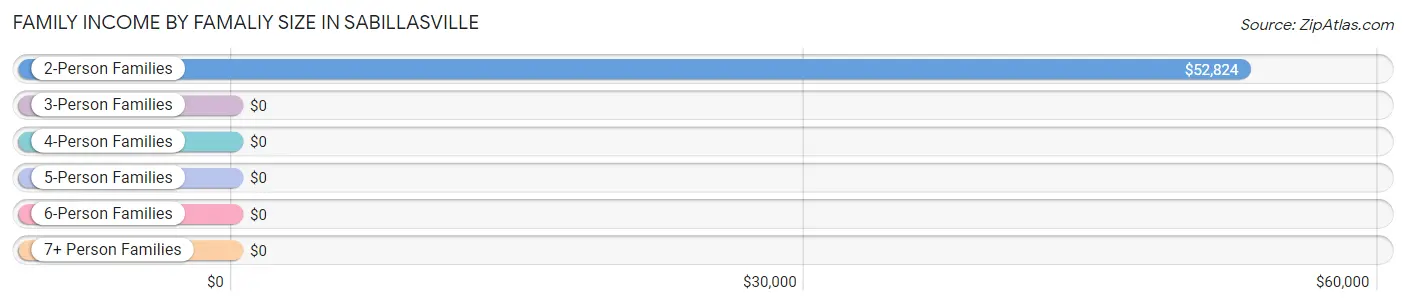
| Income Bracket | # Families | Median Income |
| 2-Person Families | 69 (67.6%) | $52,824 |
| 3-Person Families | 6 (5.9%) | $0 |
| 4-Person Families | 13 (12.8%) | $0 |
| 5-Person Families | 14 (13.7%) | $0 |
| 6-Person Families | 0 (0.0%) | $0 |
| 7+ Person Families | 0 (0.0%) | $0 |
| Total | 102 (100.0%) | $54,352 |
Family Income by Number of Earners in Sabillasville
| Number of Earners | # Families | Median Income |
| No Earners | 9 (8.8%) | $0 |
| 1 Earner | 37 (36.3%) | $0 |
| 2 Earners | 43 (42.2%) | $0 |
| 3+ Earners | 13 (12.8%) | $0 |
| Total | 102 (100.0%) | $54,352 |
Household Income in Sabillasville
Household Income Brackets in Sabillasville
With 38 households falling in the category, the $35,000 to $49,999 income range is the most frequent in Sabillasville, accounting for 27.0% of all households.
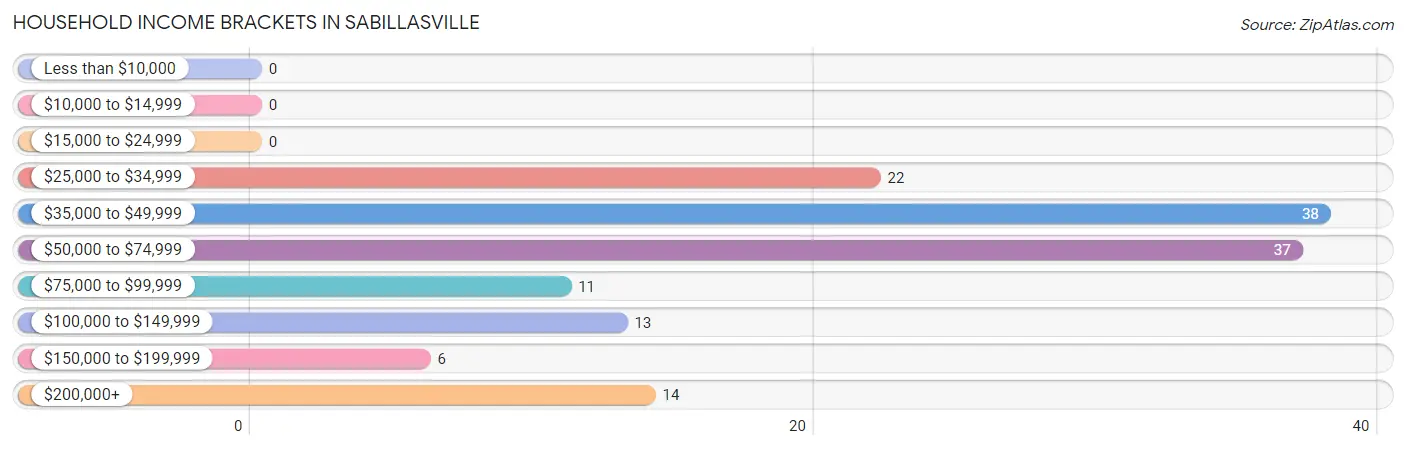
| Income Bracket | # Households | % Households |
| Less than $10,000 | 0 | 0.0% |
| $10,000 to $14,999 | 0 | 0.0% |
| $15,000 to $24,999 | 0 | 0.0% |
| $25,000 to $34,999 | 22 | 15.6% |
| $35,000 to $49,999 | 38 | 27.0% |
| $50,000 to $74,999 | 37 | 26.2% |
| $75,000 to $99,999 | 11 | 7.8% |
| $100,000 to $149,999 | 13 | 9.2% |
| $150,000 to $199,999 | 6 | 4.3% |
| $200,000+ | 14 | 9.9% |
Household Income by Householder Age in Sabillasville
The median household income in Sabillasville is $53,472, with the highest median household income of $78,409 found in the 45 to 64 years age bracket for the primary householder. A total of 68 households (48.2%) fall into this category.
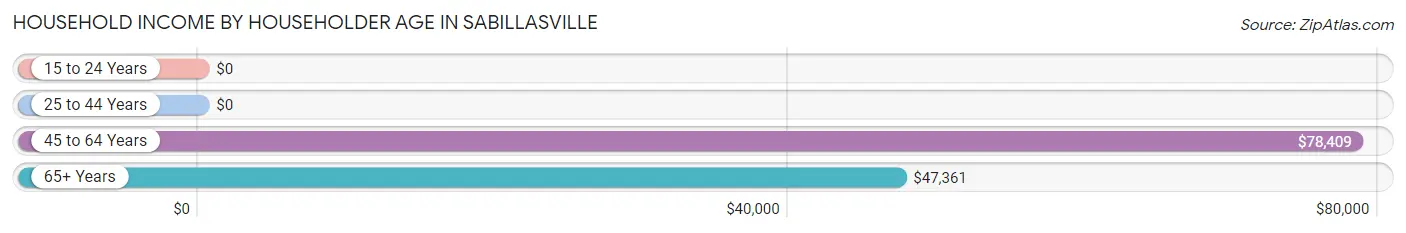
| Income Bracket | # Households | Median Income |
| 15 to 24 Years | 0 (0.0%) | $0 |
| 25 to 44 Years | 18 (12.8%) | $0 |
| 45 to 64 Years | 68 (48.2%) | $78,409 |
| 65+ Years | 55 (39.0%) | $47,361 |
| Total | 141 (100.0%) | $53,472 |
Poverty in Sabillasville
Income Below Poverty by Sex and Age in Sabillasville
With 7.5% poverty level for males and 11.1% for females among the residents of Sabillasville, 25 to 34 year old males and 12 to 14 year old females are the most vulnerable to poverty, with 13 males (100.0%) and 10 females (100.0%) in their respective age groups living below the poverty level.
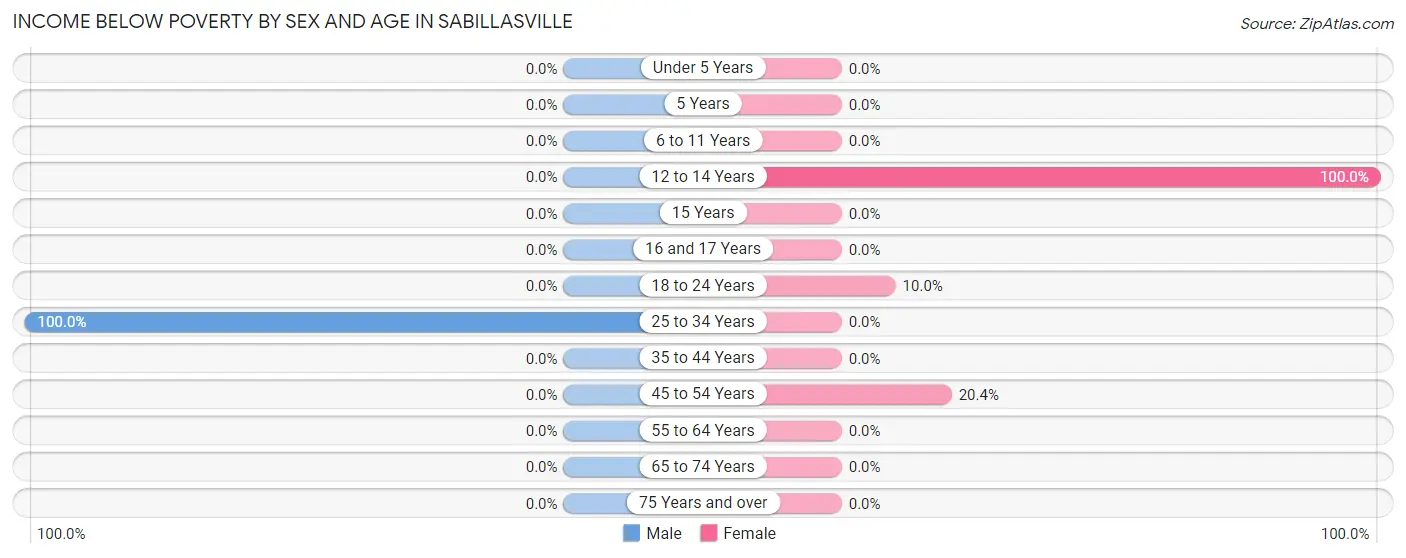
| Age Bracket | Male | Female |
| Under 5 Years | 0 (0.0%) | 0 (0.0%) |
| 5 Years | 0 (0.0%) | 0 (0.0%) |
| 6 to 11 Years | 0 (0.0%) | 0 (0.0%) |
| 12 to 14 Years | 0 (0.0%) | 10 (100.0%) |
| 15 Years | 0 (0.0%) | 0 (0.0%) |
| 16 and 17 Years | 0 (0.0%) | 0 (0.0%) |
| 18 to 24 Years | 0 (0.0%) | 2 (10.0%) |
| 25 to 34 Years | 13 (100.0%) | 0 (0.0%) |
| 35 to 44 Years | 0 (0.0%) | 0 (0.0%) |
| 45 to 54 Years | 0 (0.0%) | 10 (20.4%) |
| 55 to 64 Years | 0 (0.0%) | 0 (0.0%) |
| 65 to 74 Years | 0 (0.0%) | 0 (0.0%) |
| 75 Years and over | 0 (0.0%) | 0 (0.0%) |
| Total | 13 (7.5%) | 22 (11.1%) |
Income Above Poverty by Sex and Age in Sabillasville
According to the poverty statistics in Sabillasville, males aged 6 to 11 years and females aged 25 to 34 years are the age groups that are most secure financially, with 100.0% of males and 100.0% of females in these age groups living above the poverty line.
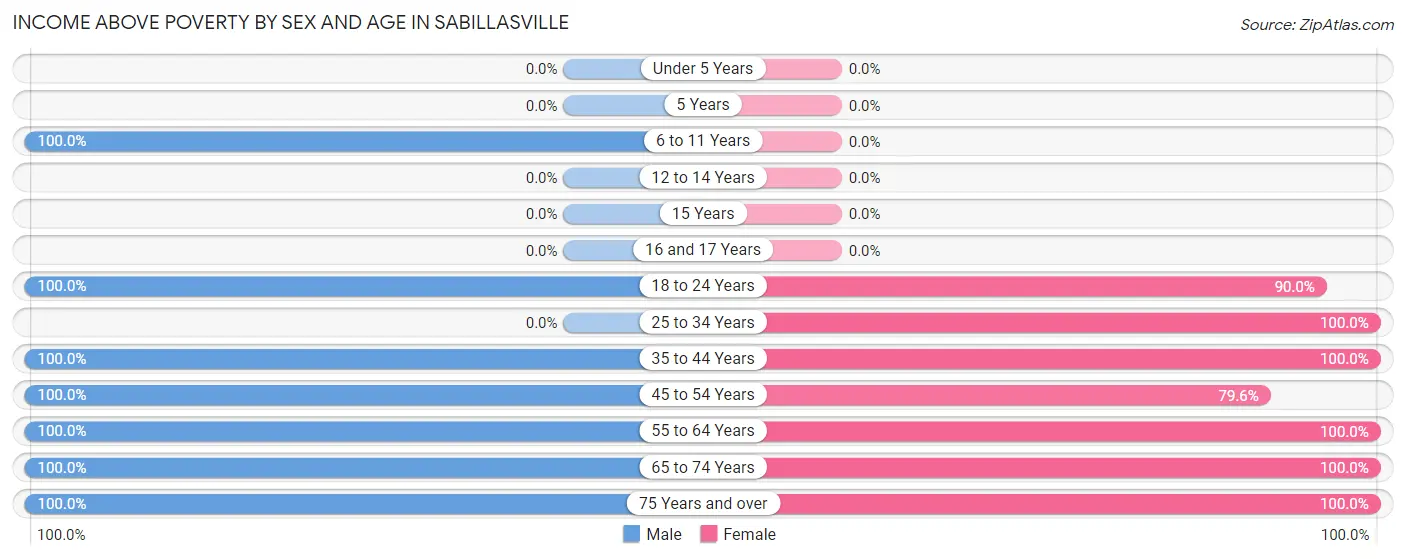
| Age Bracket | Male | Female |
| Under 5 Years | 0 (0.0%) | 0 (0.0%) |
| 5 Years | 0 (0.0%) | 0 (0.0%) |
| 6 to 11 Years | 6 (100.0%) | 0 (0.0%) |
| 12 to 14 Years | 0 (0.0%) | 0 (0.0%) |
| 15 Years | 0 (0.0%) | 0 (0.0%) |
| 16 and 17 Years | 0 (0.0%) | 0 (0.0%) |
| 18 to 24 Years | 48 (100.0%) | 18 (90.0%) |
| 25 to 34 Years | 0 (0.0%) | 12 (100.0%) |
| 35 to 44 Years | 15 (100.0%) | 6 (100.0%) |
| 45 to 54 Years | 25 (100.0%) | 39 (79.6%) |
| 55 to 64 Years | 35 (100.0%) | 13 (100.0%) |
| 65 to 74 Years | 23 (100.0%) | 51 (100.0%) |
| 75 Years and over | 9 (100.0%) | 37 (100.0%) |
| Total | 161 (92.5%) | 176 (88.9%) |
Income Below Poverty Among Married-Couple Families in Sabillasville
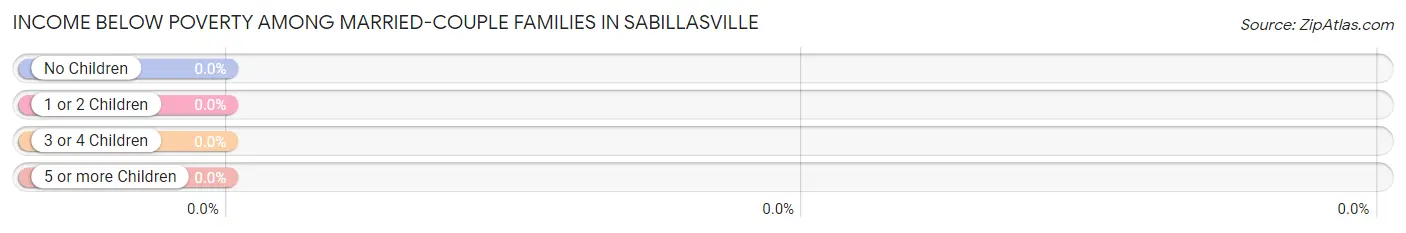
| Children | Above Poverty | Below Poverty |
| No Children | 36 (100.0%) | 0 (0.0%) |
| 1 or 2 Children | 6 (100.0%) | 0 (0.0%) |
| 3 or 4 Children | 0 (0.0%) | 0 (0.0%) |
| 5 or more Children | 0 (0.0%) | 0 (0.0%) |
| Total | 42 (100.0%) | 0 (0.0%) |
Income Below Poverty Among Single-Parent Households in Sabillasville
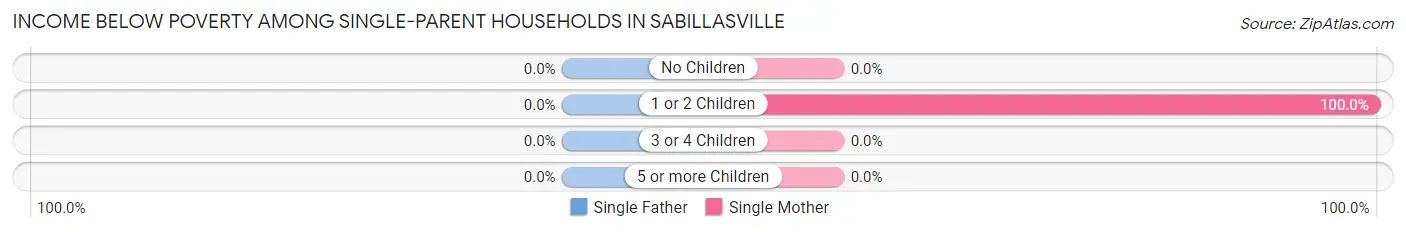
| Children | Single Father | Single Mother |
| No Children | 0 (0.0%) | 0 (0.0%) |
| 1 or 2 Children | 0 (0.0%) | 10 (100.0%) |
| 3 or 4 Children | 0 (0.0%) | 0 (0.0%) |
| 5 or more Children | 0 (0.0%) | 0 (0.0%) |
| Total | 0 (0.0%) | 10 (16.7%) |
Income Below Poverty Among Married-Couple vs Single-Parent Households in Sabillasville
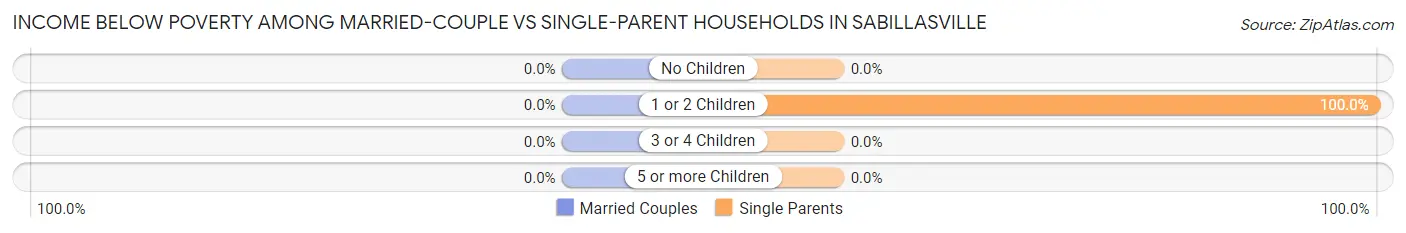
| Children | Married-Couple Families | Single-Parent Households |
| No Children | 0 (0.0%) | 0 (0.0%) |
| 1 or 2 Children | 0 (0.0%) | 10 (100.0%) |
| 3 or 4 Children | 0 (0.0%) | 0 (0.0%) |
| 5 or more Children | 0 (0.0%) | 0 (0.0%) |
| Total | 0 (0.0%) | 10 (16.7%) |
Race in Sabillasville
The most populous races in Sabillasville are White / Caucasian (375 | 92.6%), Black / African American (28 | 6.9%), and Two or more Races (2 | 0.5%).
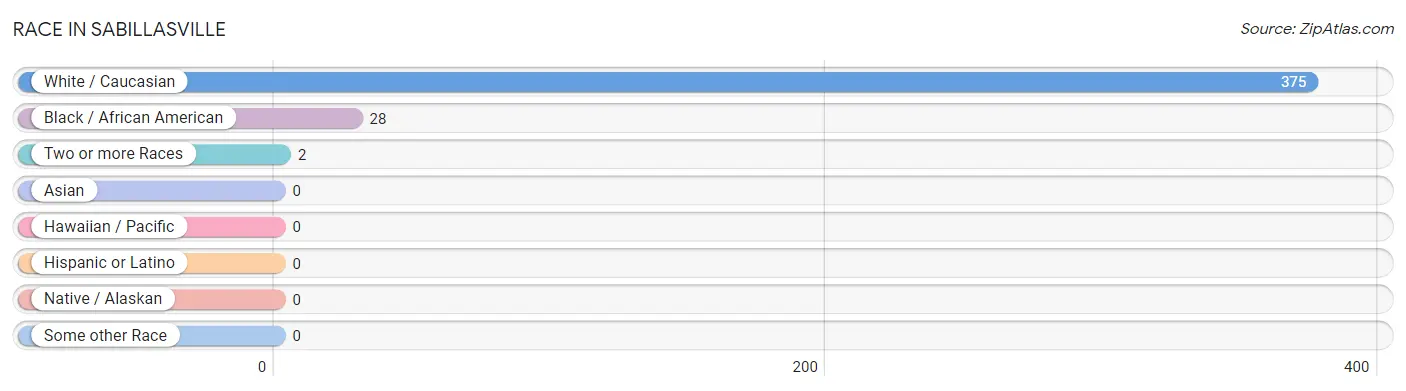
| Race | # Population | % Population |
| Asian | 0 | 0.0% |
| Black / African American | 28 | 6.9% |
| Hawaiian / Pacific | 0 | 0.0% |
| Hispanic or Latino | 0 | 0.0% |
| Native / Alaskan | 0 | 0.0% |
| White / Caucasian | 375 | 92.6% |
| Two or more Races | 2 | 0.5% |
| Some other Race | 0 | 0.0% |
| Total | 405 | 100.0% |
Ancestry in Sabillasville
The most populous ancestries reported in Sabillasville are German (207 | 51.1%), Irish (125 | 30.9%), American (36 | 8.9%), Italian (22 | 5.4%), and English (20 | 4.9%), together accounting for 101.2% of all Sabillasville residents.
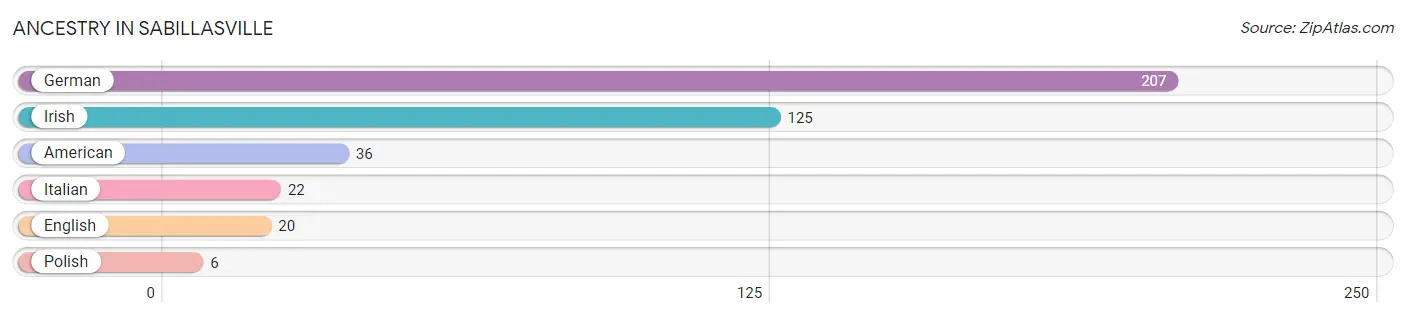
| Ancestry | # Population | % Population |
| American | 36 | 8.9% |
| English | 20 | 4.9% |
| German | 207 | 51.1% |
| Irish | 125 | 30.9% |
| Italian | 22 | 5.4% |
| Polish | 6 | 1.5% | View All 6 Rows |
Immigrants in Sabillasville

| Immigration Origin | # Population | % Population | View All 0 Rows |
Sex and Age in Sabillasville
Sex and Age in Sabillasville
The most populous age groups in Sabillasville are 20 to 24 Years (56 | 27.1%) for men and 70 to 74 Years (36 | 18.2%) for women.
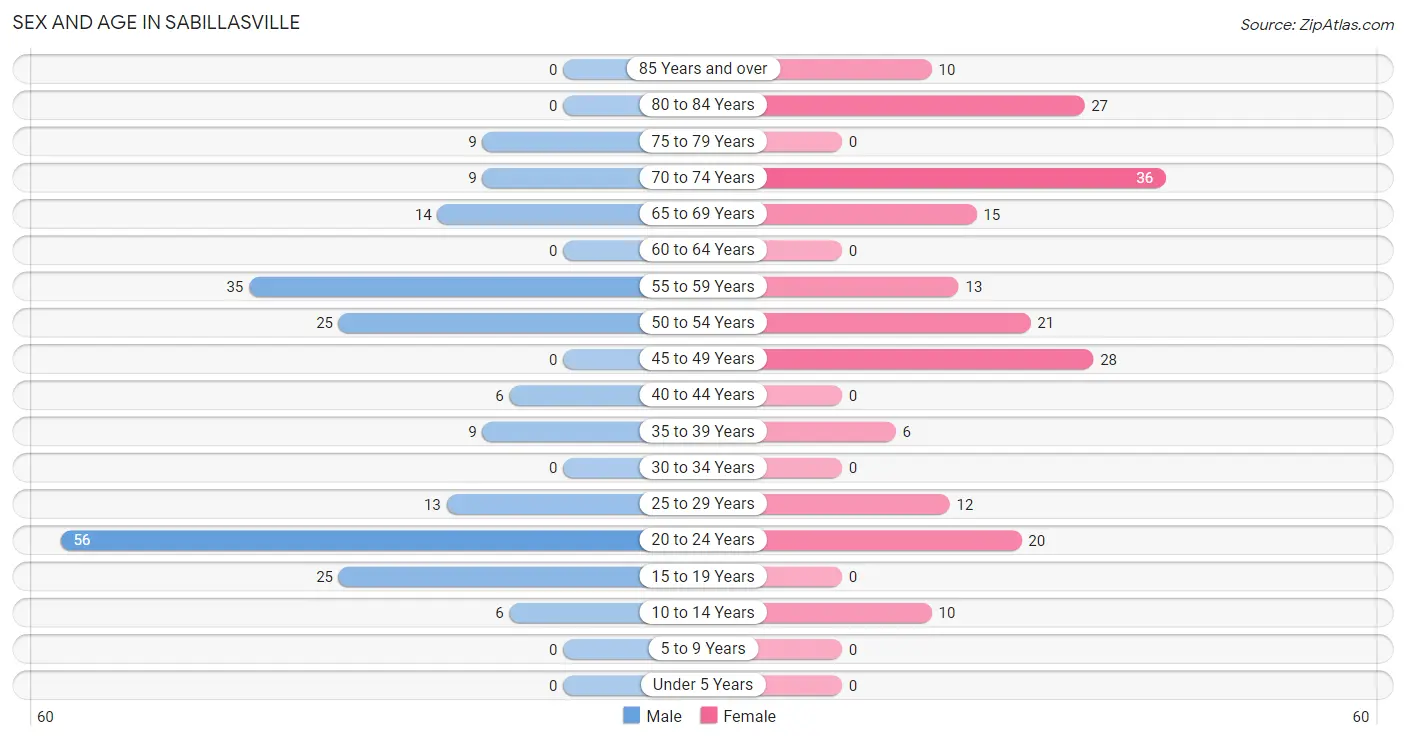
| Age Bracket | Male | Female |
| Under 5 Years | 0 (0.0%) | 0 (0.0%) |
| 5 to 9 Years | 0 (0.0%) | 0 (0.0%) |
| 10 to 14 Years | 6 (2.9%) | 10 (5.1%) |
| 15 to 19 Years | 25 (12.1%) | 0 (0.0%) |
| 20 to 24 Years | 56 (27.1%) | 20 (10.1%) |
| 25 to 29 Years | 13 (6.3%) | 12 (6.1%) |
| 30 to 34 Years | 0 (0.0%) | 0 (0.0%) |
| 35 to 39 Years | 9 (4.3%) | 6 (3.0%) |
| 40 to 44 Years | 6 (2.9%) | 0 (0.0%) |
| 45 to 49 Years | 0 (0.0%) | 28 (14.1%) |
| 50 to 54 Years | 25 (12.1%) | 21 (10.6%) |
| 55 to 59 Years | 35 (16.9%) | 13 (6.6%) |
| 60 to 64 Years | 0 (0.0%) | 0 (0.0%) |
| 65 to 69 Years | 14 (6.8%) | 15 (7.6%) |
| 70 to 74 Years | 9 (4.3%) | 36 (18.2%) |
| 75 to 79 Years | 9 (4.3%) | 0 (0.0%) |
| 80 to 84 Years | 0 (0.0%) | 27 (13.6%) |
| 85 Years and over | 0 (0.0%) | 10 (5.1%) |
| Total | 207 (100.0%) | 198 (100.0%) |
Families and Households in Sabillasville
Median Family Size in Sabillasville
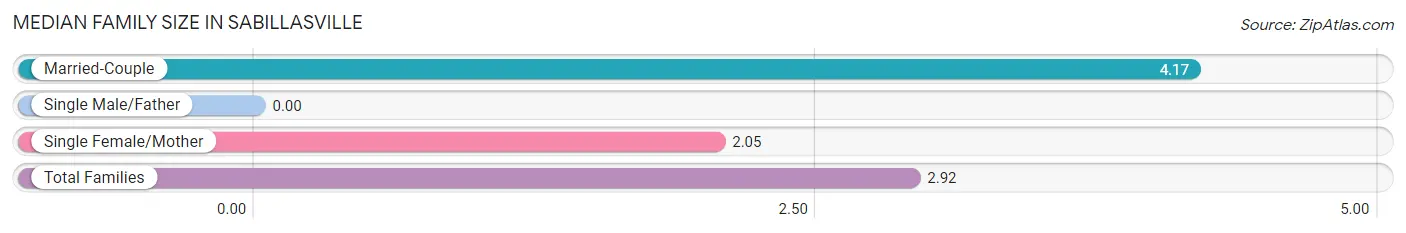
| Family Type | # Families | Family Size |
| Married-Couple | 42 (41.2%) | 4.17 |
| Single Male/Father | 0 (0.0%) | - |
| Single Female/Mother | 60 (58.8%) | 2.05 |
| Total Families | 102 (100.0%) | 2.92 |
Median Household Size in Sabillasville
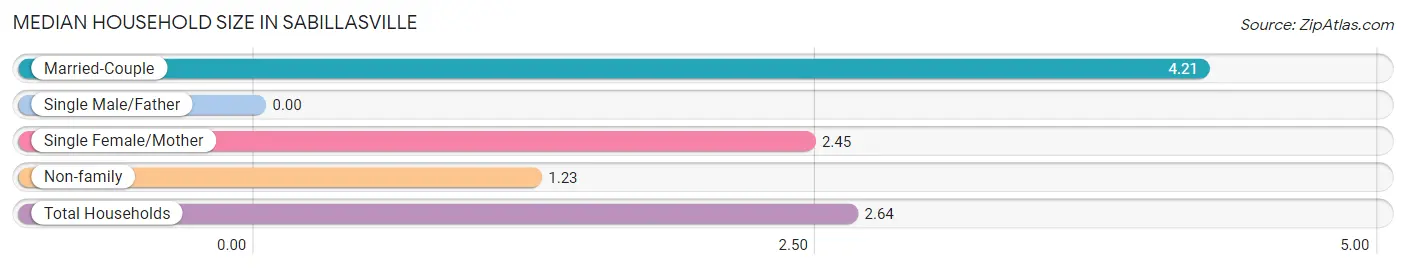
| Household Type | # Households | Household Size |
| Married-Couple | 42 (29.8%) | 4.21 |
| Single Male/Father | 0 (0.0%) | - |
| Single Female/Mother | 60 (42.5%) | 2.45 |
| Non-family | 39 (27.7%) | 1.23 |
| Total Households | 141 (100.0%) | 2.64 |
Household Size by Marriage Status in Sabillasville
Out of a total of 141 households in Sabillasville, 102 (72.3%) are family households, while 39 (27.7%) are nonfamily households. The most numerous type of family households are 2-person households, comprising 47, and the most common type of nonfamily households are 1-person households, comprising 29.
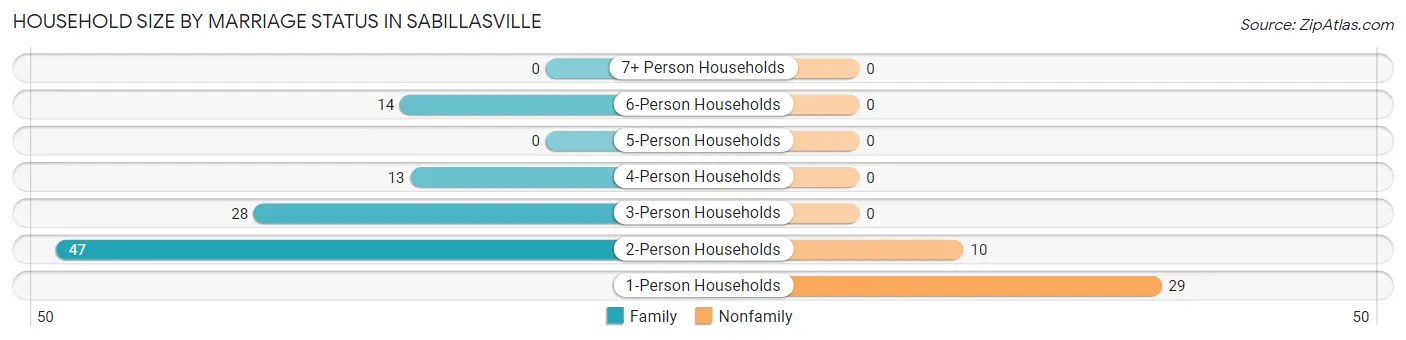
| Household Size | Family Households | Nonfamily Households |
| 1-Person Households | - | 29 (20.6%) |
| 2-Person Households | 47 (33.3%) | 10 (7.1%) |
| 3-Person Households | 28 (19.9%) | 0 (0.0%) |
| 4-Person Households | 13 (9.2%) | 0 (0.0%) |
| 5-Person Households | 0 (0.0%) | 0 (0.0%) |
| 6-Person Households | 14 (9.9%) | 0 (0.0%) |
| 7+ Person Households | 0 (0.0%) | 0 (0.0%) |
| Total | 102 (72.3%) | 39 (27.7%) |
Female Fertility in Sabillasville
Fertility by Age in Sabillasville
| Age Bracket | Women with Births | Births / 1,000 Women |
| 15 to 19 years | 0 (0.0%) | 0.0 |
| 20 to 34 years | 0 (0.0%) | 0.0 |
| 35 to 50 years | 0 (0.0%) | 0.0 |
| Total | 0 (0.0%) | 0.0 |
Fertility by Age by Marriage Status in Sabillasville
| Age Bracket | Married | Unmarried |
| 15 to 19 years | 0 (0.0%) | 0 (0.0%) |
| 20 to 34 years | 0 (0.0%) | 0 (0.0%) |
| 35 to 50 years | 0 (0.0%) | 0 (0.0%) |
| Total | 0 (0.0%) | 0 (0.0%) |
Fertility by Education in Sabillasville
| Educational Attainment | Women with Births | Births / 1,000 Women |
| Less than High School | 0 (0.0%) | 0.0 |
| High School Diploma | 0 (0.0%) | 0.0 |
| College or Associate's Degree | 0 (0.0%) | 0.0 |
| Bachelor's Degree | 0 (0.0%) | 0.0 |
| Graduate Degree | 0 (0.0%) | 0.0 |
| Total | 0 (0.0%) | 0.0 |
Fertility by Education by Marriage Status in Sabillasville
| Educational Attainment | Married | Unmarried |
| Less than High School | 0 (0.0%) | 0 (0.0%) |
| High School Diploma | 0 (0.0%) | 0 (0.0%) |
| College or Associate's Degree | 0 (0.0%) | 0 (0.0%) |
| Bachelor's Degree | 0 (0.0%) | 0 (0.0%) |
| Graduate Degree | 0 (0.0%) | 0 (0.0%) |
| Total | 0 (0.0%) | 0 (0.0%) |
Employment Characteristics in Sabillasville
Employment by Class of Employer in Sabillasville
Among the 199 employed individuals in Sabillasville, private company employees (166 | 83.4%), and not-for-profit organizations (33 | 16.6%) make up the most common classes of employment.
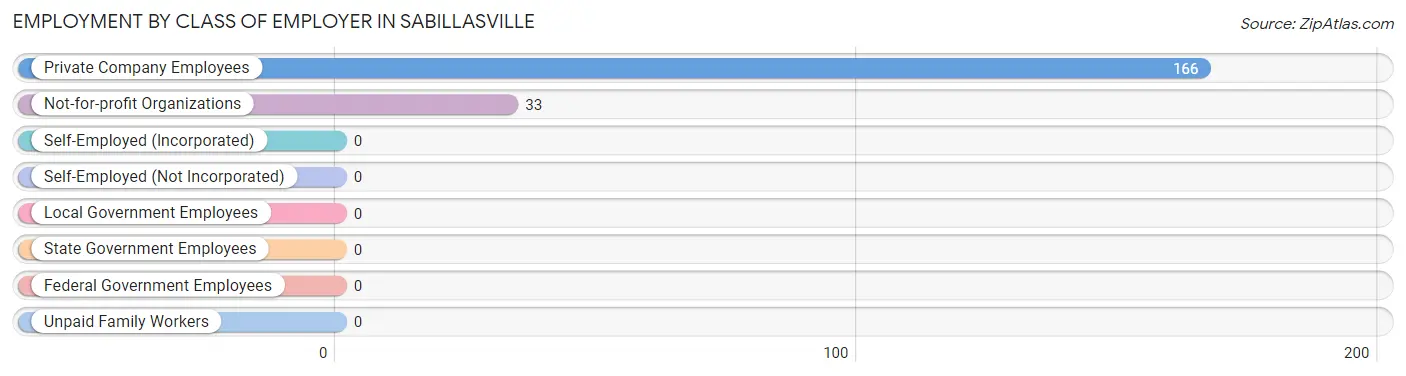
| Employer Class | # Employees | % Employees |
| Private Company Employees | 166 | 83.4% |
| Self-Employed (Incorporated) | 0 | 0.0% |
| Self-Employed (Not Incorporated) | 0 | 0.0% |
| Not-for-profit Organizations | 33 | 16.6% |
| Local Government Employees | 0 | 0.0% |
| State Government Employees | 0 | 0.0% |
| Federal Government Employees | 0 | 0.0% |
| Unpaid Family Workers | 0 | 0.0% |
| Total | 199 | 100.0% |
Employment Status by Age in Sabillasville
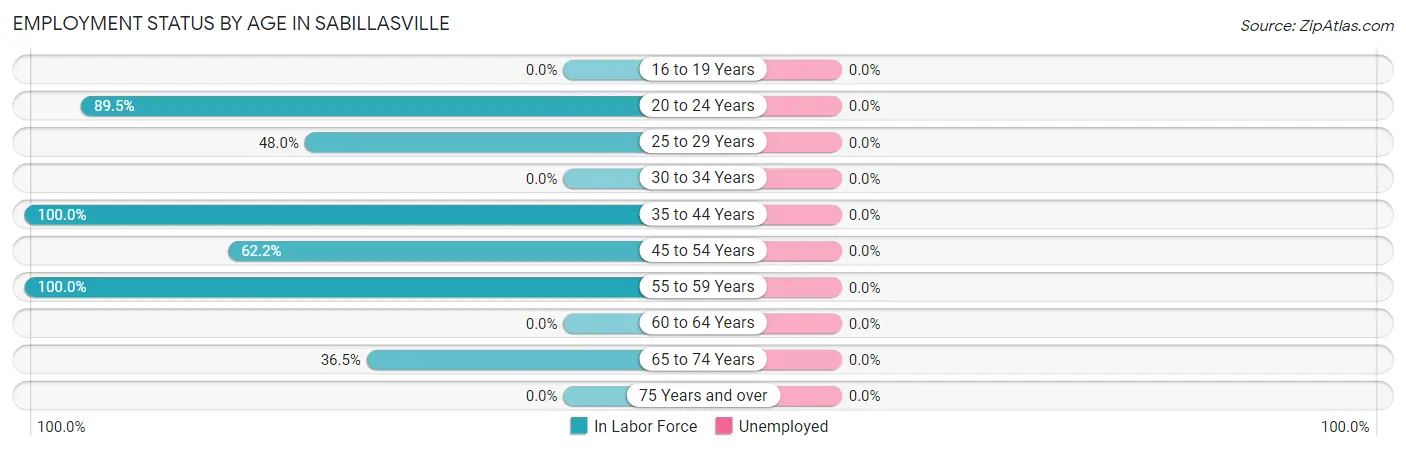
| Age Bracket | In Labor Force | Unemployed |
| 16 to 19 Years | 0 (0.0%) | 0 (0.0%) |
| 20 to 24 Years | 68 (89.5%) | 0 (0.0%) |
| 25 to 29 Years | 12 (48.0%) | 0 (0.0%) |
| 30 to 34 Years | 0 (0.0%) | 0 (0.0%) |
| 35 to 44 Years | 21 (100.0%) | 0 (0.0%) |
| 45 to 54 Years | 46 (62.2%) | 0 (0.0%) |
| 55 to 59 Years | 48 (100.0%) | 0 (0.0%) |
| 60 to 64 Years | 0 (0.0%) | 0 (0.0%) |
| 65 to 74 Years | 27 (36.5%) | 0 (0.0%) |
| 75 Years and over | 0 (0.0%) | 0 (0.0%) |
| Total | 222 (59.2%) | 0 (0.0%) |
Employment Status by Educational Attainment in Sabillasville
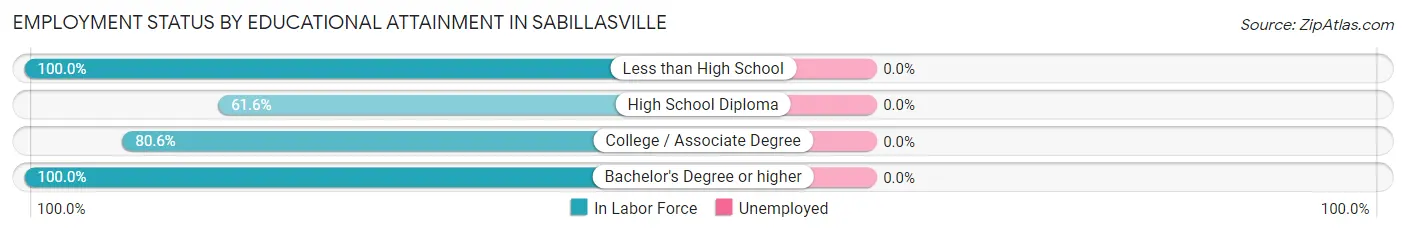
| Educational Attainment | In Labor Force | Unemployed |
| Less than High School | 11 (100.0%) | 0 (0.0%) |
| High School Diploma | 45 (61.6%) | 0 (0.0%) |
| College / Associate Degree | 54 (80.6%) | 0 (0.0%) |
| Bachelor's Degree or higher | 17 (100.0%) | 0 (0.0%) |
| Total | 127 (75.6%) | 0 (0.0%) |
Employment Occupations by Sex in Sabillasville
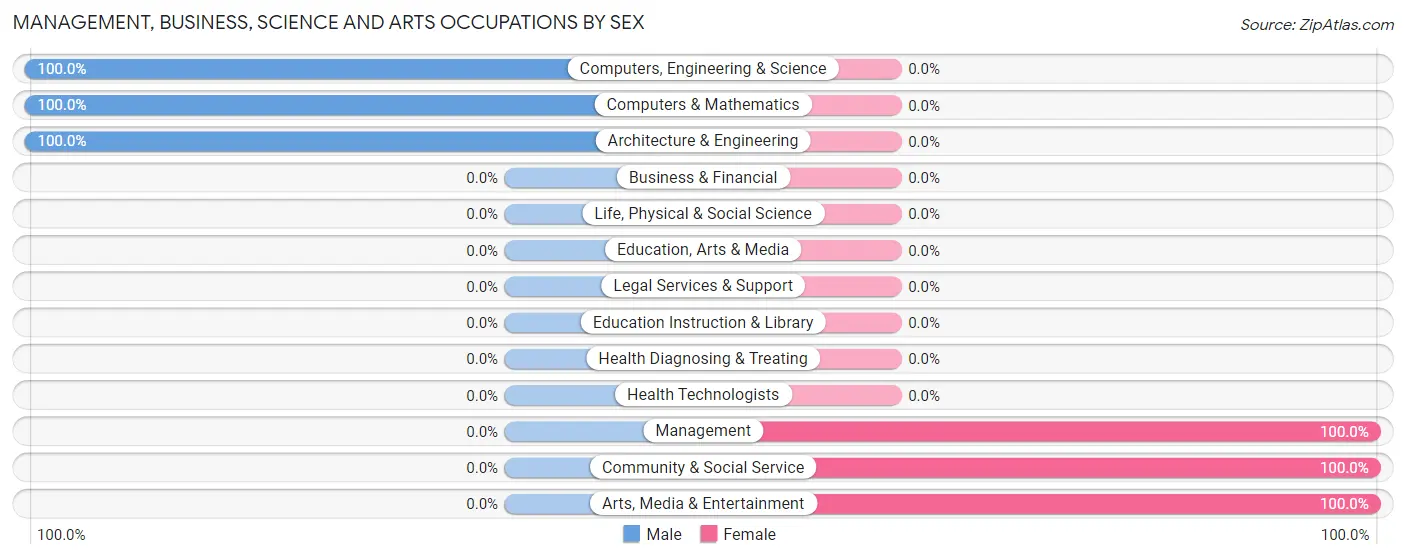
Management, Business, Science and Arts Occupations
The most common Management, Business, Science and Arts occupations in Sabillasville are Computers, Engineering & Science (20 | 9.0%), Computers & Mathematics (14 | 6.3%), Community & Social Service (12 | 5.4%), Arts, Media & Entertainment (12 | 5.4%), and Management (6 | 2.7%).
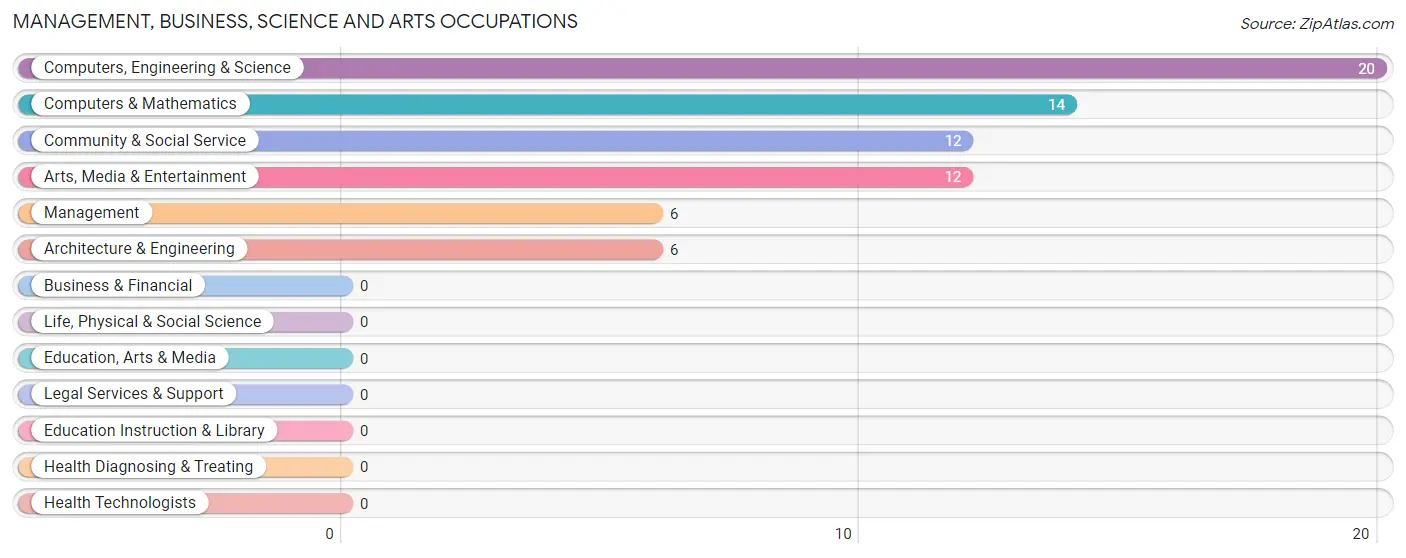
Management, Business, Science and Arts Occupations by Sex
Within the Management, Business, Science and Arts occupations in Sabillasville, the most male-oriented occupations are Computers, Engineering & Science (100.0%), Computers & Mathematics (100.0%), and Architecture & Engineering (100.0%), while the most female-oriented occupations are Management (100.0%), Community & Social Service (100.0%), and Arts, Media & Entertainment (100.0%).
| Occupation | Male | Female |
| Management | 0 (0.0%) | 6 (100.0%) |
| Business & Financial | 0 (0.0%) | 0 (0.0%) |
| Computers, Engineering & Science | 20 (100.0%) | 0 (0.0%) |
| Computers & Mathematics | 14 (100.0%) | 0 (0.0%) |
| Architecture & Engineering | 6 (100.0%) | 0 (0.0%) |
| Life, Physical & Social Science | 0 (0.0%) | 0 (0.0%) |
| Community & Social Service | 0 (0.0%) | 12 (100.0%) |
| Education, Arts & Media | 0 (0.0%) | 0 (0.0%) |
| Legal Services & Support | 0 (0.0%) | 0 (0.0%) |
| Education Instruction & Library | 0 (0.0%) | 0 (0.0%) |
| Arts, Media & Entertainment | 0 (0.0%) | 12 (100.0%) |
| Health Diagnosing & Treating | 0 (0.0%) | 0 (0.0%) |
| Health Technologists | 0 (0.0%) | 0 (0.0%) |
| Total (Category) | 20 (52.6%) | 18 (47.4%) |
| Total (Overall) | 123 (55.4%) | 99 (44.6%) |
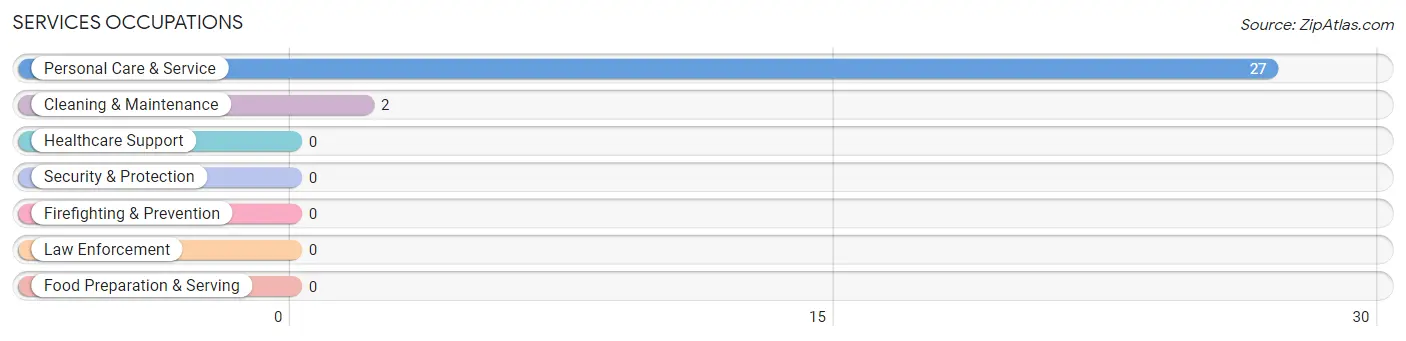
Services Occupations
The most common Services occupations in Sabillasville are Personal Care & Service (27 | 12.2%), and Cleaning & Maintenance (2 | 0.9%).
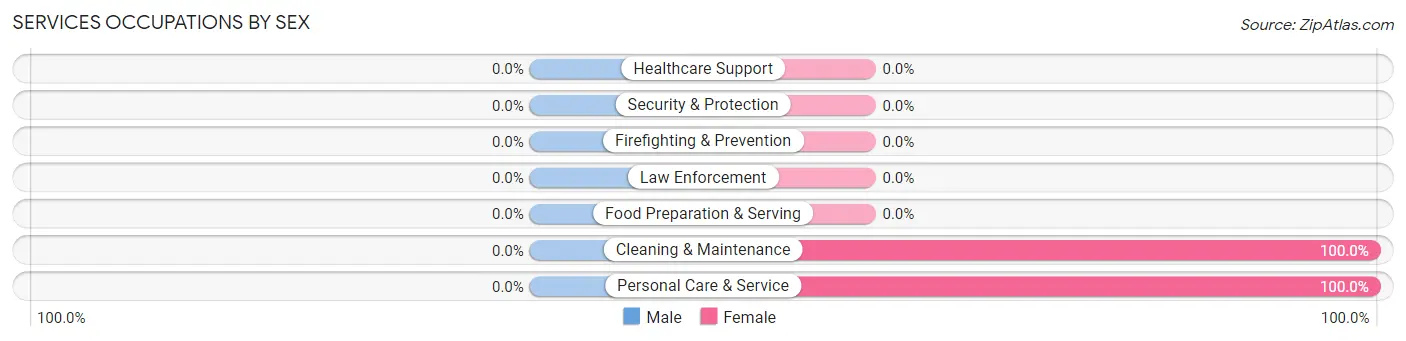
Services Occupations by Sex
| Occupation | Male | Female |
| Healthcare Support | 0 (0.0%) | 0 (0.0%) |
| Security & Protection | 0 (0.0%) | 0 (0.0%) |
| Firefighting & Prevention | 0 (0.0%) | 0 (0.0%) |
| Law Enforcement | 0 (0.0%) | 0 (0.0%) |
| Food Preparation & Serving | 0 (0.0%) | 0 (0.0%) |
| Cleaning & Maintenance | 0 (0.0%) | 2 (100.0%) |
| Personal Care & Service | 0 (0.0%) | 27 (100.0%) |
| Total (Category) | 0 (0.0%) | 29 (100.0%) |
| Total (Overall) | 123 (55.4%) | 99 (44.6%) |
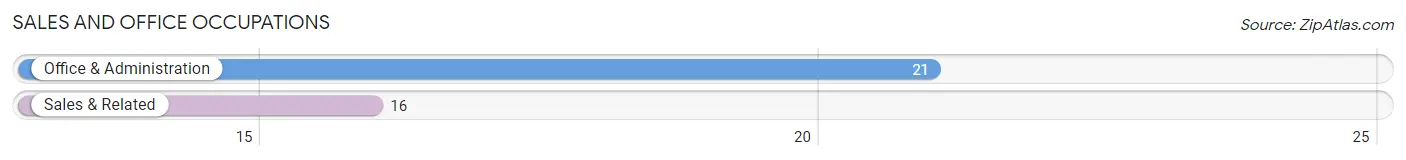
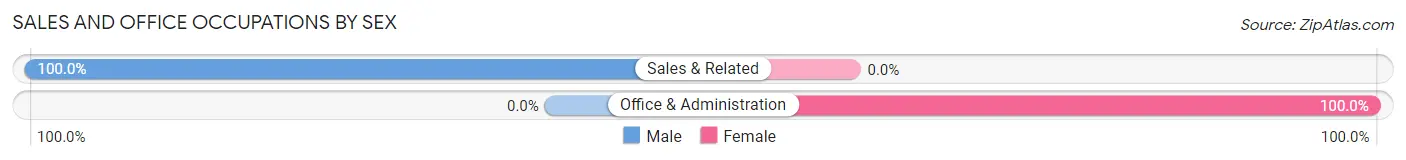
Sales and Office Occupations
The most common Sales and Office occupations in Sabillasville are Office & Administration (21 | 9.5%), and Sales & Related (16 | 7.2%).
Sales and Office Occupations by Sex
| Occupation | Male | Female |
| Sales & Related | 16 (100.0%) | 0 (0.0%) |
| Office & Administration | 0 (0.0%) | 21 (100.0%) |
| Total (Category) | 16 (43.2%) | 21 (56.8%) |
| Total (Overall) | 123 (55.4%) | 99 (44.6%) |
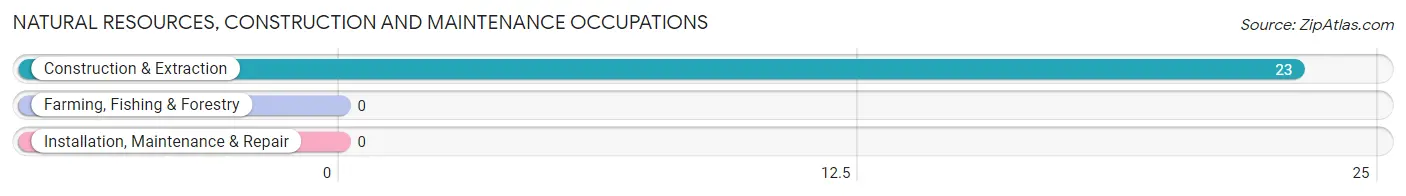
Natural Resources, Construction and Maintenance Occupations
The most common Natural Resources, Construction and Maintenance occupations in Sabillasville are , and Construction & Extraction (23 | 10.4%).
Natural Resources, Construction and Maintenance Occupations by Sex
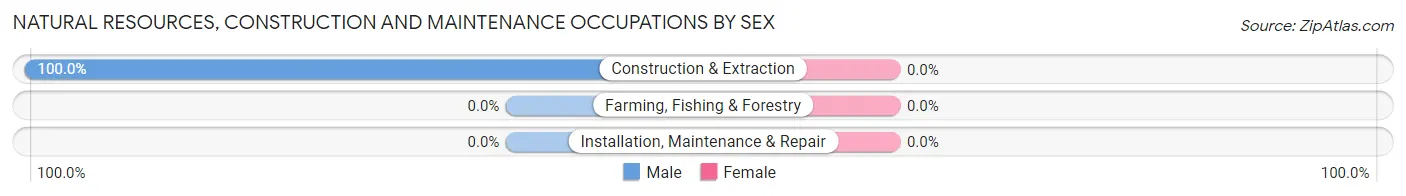
| Occupation | Male | Female |
| Farming, Fishing & Forestry | 0 (0.0%) | 0 (0.0%) |
| Construction & Extraction | 23 (100.0%) | 0 (0.0%) |
| Installation, Maintenance & Repair | 0 (0.0%) | 0 (0.0%) |
| Total (Category) | 23 (100.0%) | 0 (0.0%) |
| Total (Overall) | 123 (55.4%) | 99 (44.6%) |
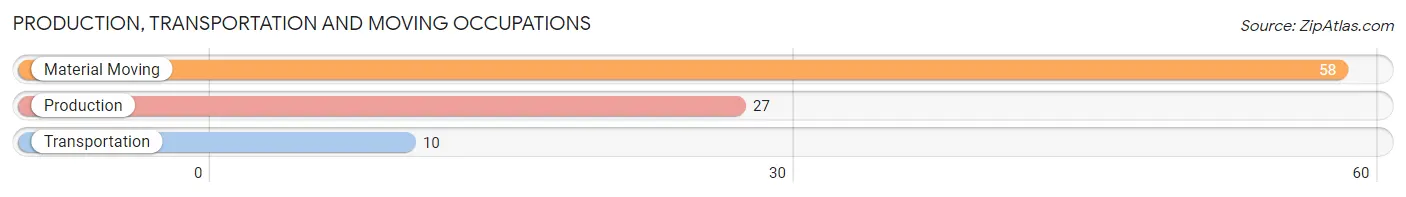
Production, Transportation and Moving Occupations
The most common Production, Transportation and Moving occupations in Sabillasville are Material Moving (58 | 26.1%), Production (27 | 12.2%), and Transportation (10 | 4.5%).
Production, Transportation and Moving Occupations by Sex
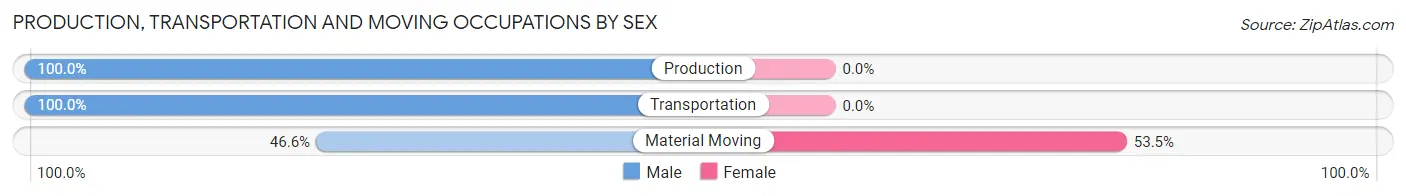
| Occupation | Male | Female |
| Production | 27 (100.0%) | 0 (0.0%) |
| Transportation | 10 (100.0%) | 0 (0.0%) |
| Material Moving | 27 (46.6%) | 31 (53.4%) |
| Total (Category) | 64 (67.4%) | 31 (32.6%) |
| Total (Overall) | 123 (55.4%) | 99 (44.6%) |
Employment Industries by Sex in Sabillasville
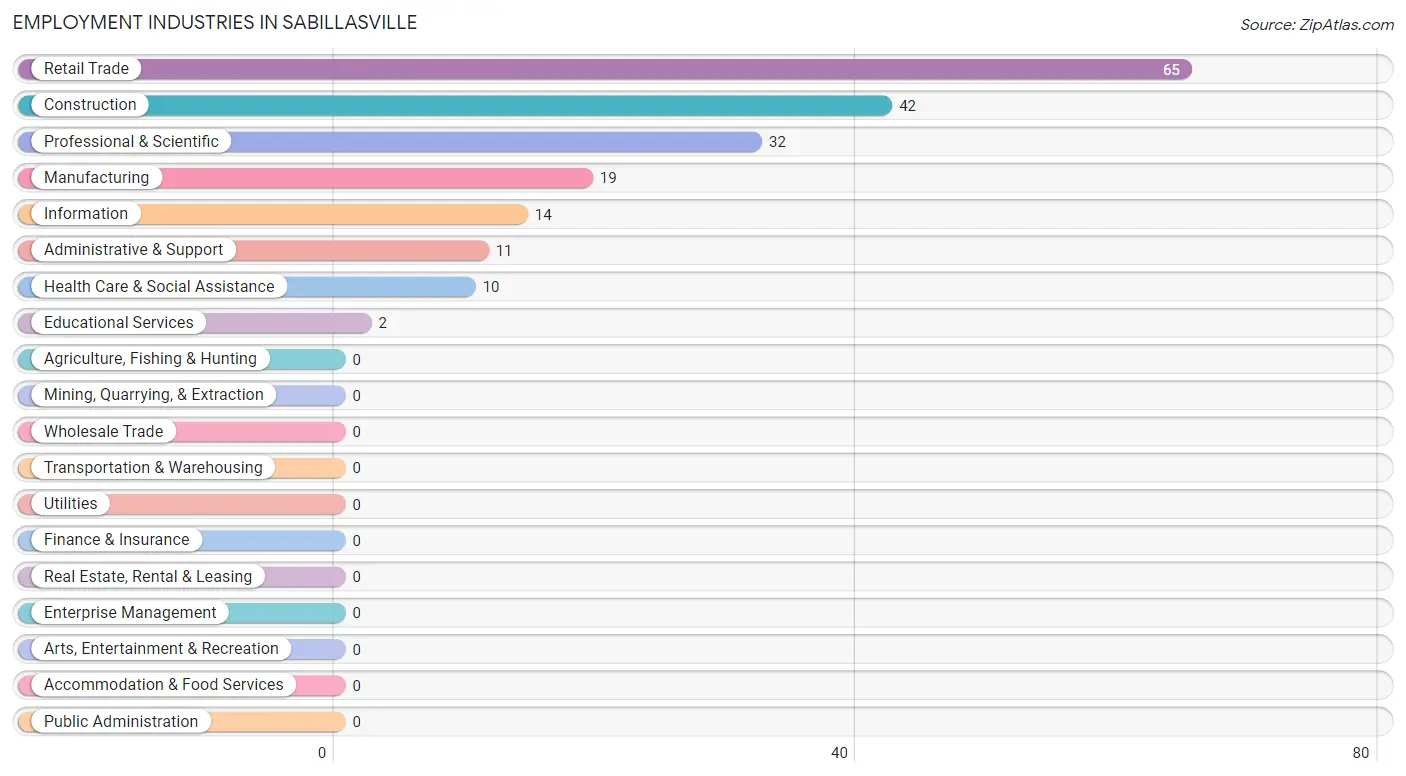
Employment Industries in Sabillasville
The major employment industries in Sabillasville include Retail Trade (65 | 29.3%), Construction (42 | 18.9%), Professional & Scientific (32 | 14.4%), Manufacturing (19 | 8.6%), and Information (14 | 6.3%).
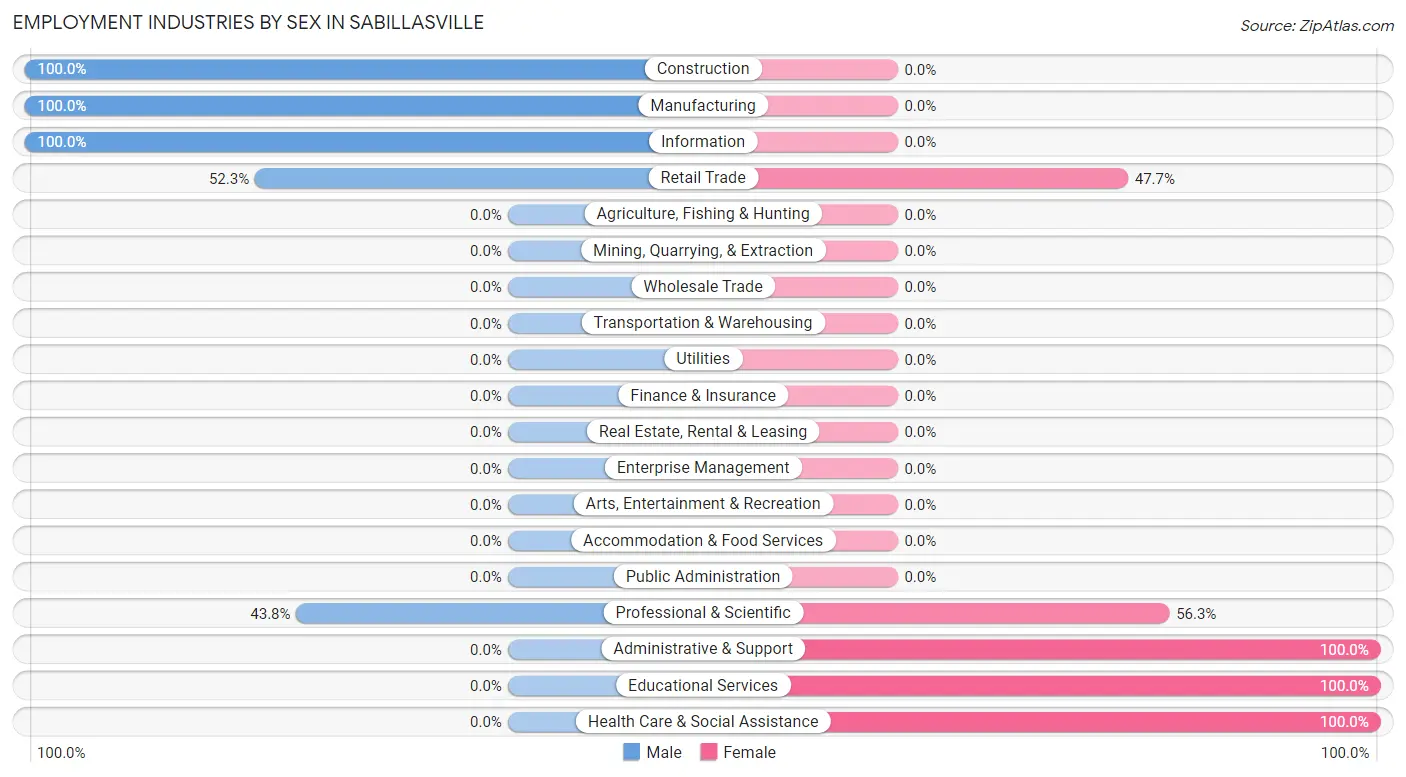
Employment Industries by Sex in Sabillasville
The Sabillasville industries that see more men than women are Construction (100.0%), Manufacturing (100.0%), and Information (100.0%), whereas the industries that tend to have a higher number of women are Administrative & Support (100.0%), Educational Services (100.0%), and Health Care & Social Assistance (100.0%).
| Industry | Male | Female |
| Agriculture, Fishing & Hunting | 0 (0.0%) | 0 (0.0%) |
| Mining, Quarrying, & Extraction | 0 (0.0%) | 0 (0.0%) |
| Construction | 42 (100.0%) | 0 (0.0%) |
| Manufacturing | 19 (100.0%) | 0 (0.0%) |
| Wholesale Trade | 0 (0.0%) | 0 (0.0%) |
| Retail Trade | 34 (52.3%) | 31 (47.7%) |
| Transportation & Warehousing | 0 (0.0%) | 0 (0.0%) |
| Utilities | 0 (0.0%) | 0 (0.0%) |
| Information | 14 (100.0%) | 0 (0.0%) |
| Finance & Insurance | 0 (0.0%) | 0 (0.0%) |
| Real Estate, Rental & Leasing | 0 (0.0%) | 0 (0.0%) |
| Professional & Scientific | 14 (43.8%) | 18 (56.2%) |
| Enterprise Management | 0 (0.0%) | 0 (0.0%) |
| Administrative & Support | 0 (0.0%) | 11 (100.0%) |
| Educational Services | 0 (0.0%) | 2 (100.0%) |
| Health Care & Social Assistance | 0 (0.0%) | 10 (100.0%) |
| Arts, Entertainment & Recreation | 0 (0.0%) | 0 (0.0%) |
| Accommodation & Food Services | 0 (0.0%) | 0 (0.0%) |
| Public Administration | 0 (0.0%) | 0 (0.0%) |
| Total | 123 (55.4%) | 99 (44.6%) |
Education in Sabillasville
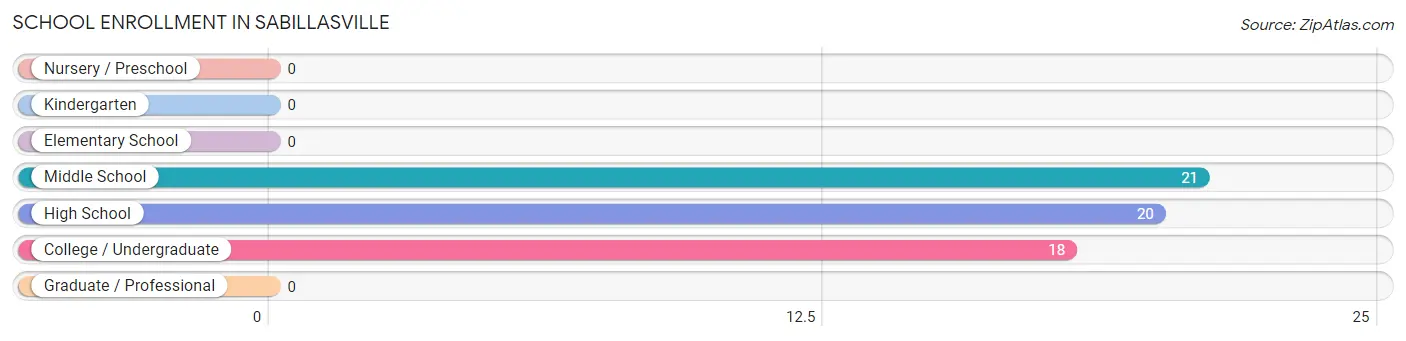
School Enrollment in Sabillasville
The most common levels of schooling among the 59 students in Sabillasville are middle school (21 | 35.6%), high school (20 | 33.9%), and college / undergraduate (18 | 30.5%).
| School Level | # Students | % Students |
| Nursery / Preschool | 0 | 0.0% |
| Kindergarten | 0 | 0.0% |
| Elementary School | 0 | 0.0% |
| Middle School | 21 | 35.6% |
| High School | 20 | 33.9% |
| College / Undergraduate | 18 | 30.5% |
| Graduate / Professional | 0 | 0.0% |
| Total | 59 | 100.0% |
School Enrollment by Age by Funding Source in Sabillasville
Out of a total of 59 students who are enrolled in schools in Sabillasville, 5 (8.5%) attend a private institution, while the remaining 54 (91.5%) are enrolled in public schools. The age group of 15 to 17 year olds has the highest likelihood of being enrolled in private schools, with 5 (26.3% in the age bracket) enrolled. Conversely, the age group of 10 to 14 year olds has the lowest likelihood of being enrolled in a private school, with 16 (100.0% in the age bracket) attending a public institution.
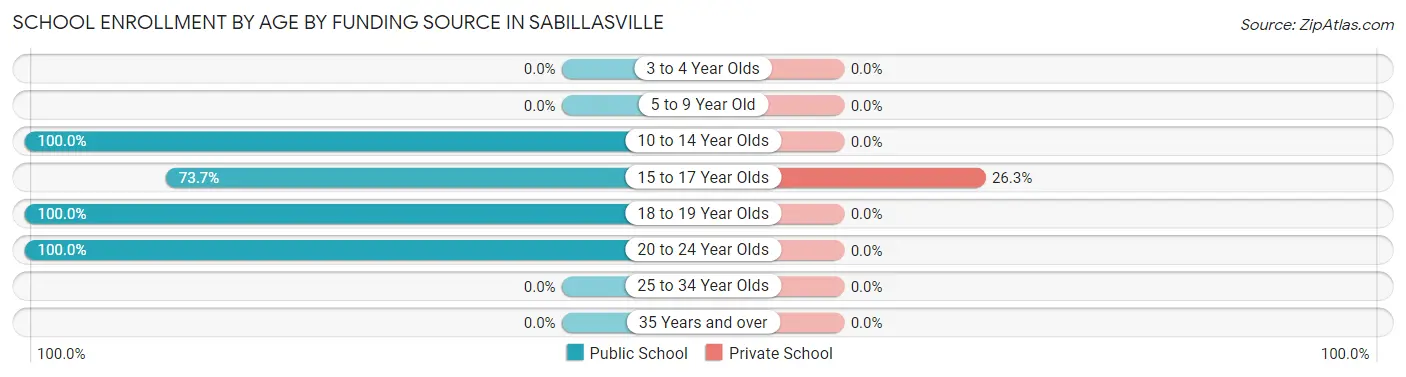
| Age Bracket | Public School | Private School |
| 3 to 4 Year Olds | 0 (0.0%) | 0 (0.0%) |
| 5 to 9 Year Old | 0 (0.0%) | 0 (0.0%) |
| 10 to 14 Year Olds | 16 (100.0%) | 0 (0.0%) |
| 15 to 17 Year Olds | 14 (73.7%) | 5 (26.3%) |
| 18 to 19 Year Olds | 6 (100.0%) | 0 (0.0%) |
| 20 to 24 Year Olds | 18 (100.0%) | 0 (0.0%) |
| 25 to 34 Year Olds | 0 (0.0%) | 0 (0.0%) |
| 35 Years and over | 0 (0.0%) | 0 (0.0%) |
| Total | 54 (91.5%) | 5 (8.5%) |
Educational Attainment by Field of Study in Sabillasville
Social sciences (11 | 64.7%), and bio, nature & agricultural (6 | 35.3%) are the most common fields of study among 17 individuals in Sabillasville who have obtained a bachelor's degree or higher.
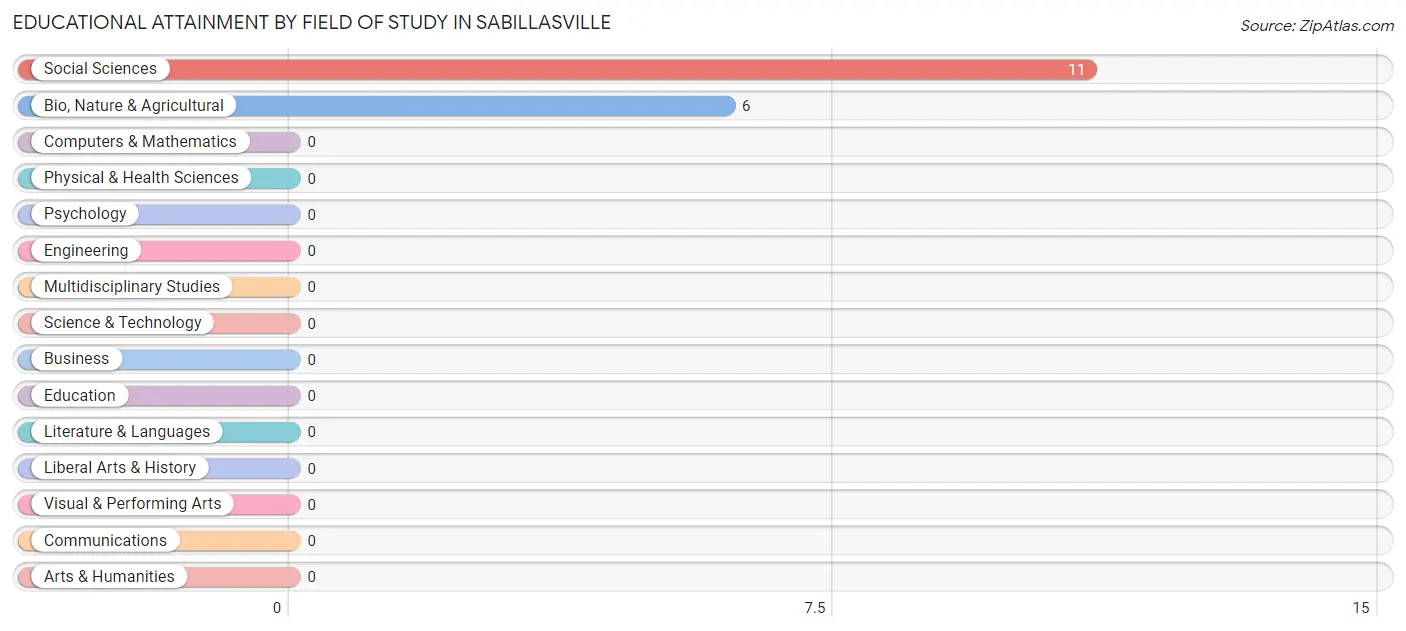
| Field of Study | # Graduates | % Graduates |
| Computers & Mathematics | 0 | 0.0% |
| Bio, Nature & Agricultural | 6 | 35.3% |
| Physical & Health Sciences | 0 | 0.0% |
| Psychology | 0 | 0.0% |
| Social Sciences | 11 | 64.7% |
| Engineering | 0 | 0.0% |
| Multidisciplinary Studies | 0 | 0.0% |
| Science & Technology | 0 | 0.0% |
| Business | 0 | 0.0% |
| Education | 0 | 0.0% |
| Literature & Languages | 0 | 0.0% |
| Liberal Arts & History | 0 | 0.0% |
| Visual & Performing Arts | 0 | 0.0% |
| Communications | 0 | 0.0% |
| Arts & Humanities | 0 | 0.0% |
| Total | 17 | 100.0% |
Transportation & Commute in Sabillasville
Vehicle Availability by Sex in Sabillasville
The most prevalent vehicle ownership categories in Sabillasville are males with 4 vehicles (32, accounting for 28.1%) and females with 4 vehicles (0, making up 37.7%).
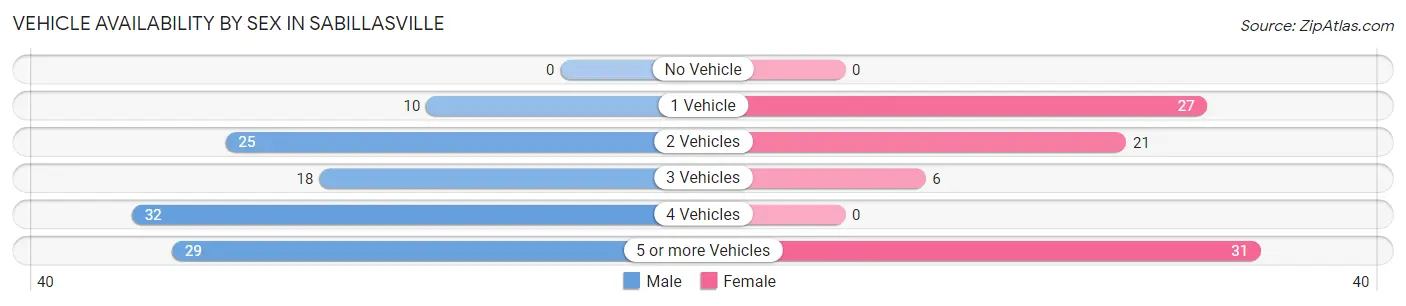
| Vehicles Available | Male | Female |
| No Vehicle | 0 (0.0%) | 0 (0.0%) |
| 1 Vehicle | 10 (8.8%) | 27 (31.8%) |
| 2 Vehicles | 25 (21.9%) | 21 (24.7%) |
| 3 Vehicles | 18 (15.8%) | 6 (7.1%) |
| 4 Vehicles | 32 (28.1%) | 0 (0.0%) |
| 5 or more Vehicles | 29 (25.4%) | 31 (36.5%) |
| Total | 114 (100.0%) | 85 (100.0%) |
Commute Time in Sabillasville
The most frequently occuring commute durations in Sabillasville are 10 to 14 minutes (61 commuters, 30.6%), 35 to 39 minutes (33 commuters, 16.6%), and 20 to 24 minutes (31 commuters, 15.6%).
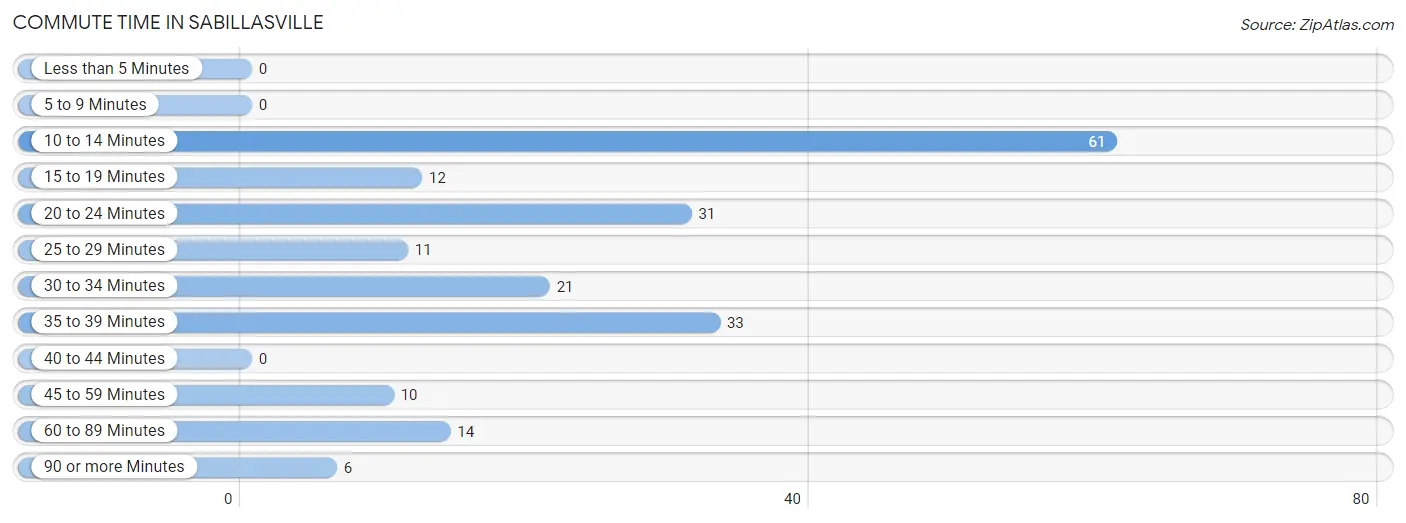
| Commute Time | # Commuters | % Commuters |
| Less than 5 Minutes | 0 | 0.0% |
| 5 to 9 Minutes | 0 | 0.0% |
| 10 to 14 Minutes | 61 | 30.6% |
| 15 to 19 Minutes | 12 | 6.0% |
| 20 to 24 Minutes | 31 | 15.6% |
| 25 to 29 Minutes | 11 | 5.5% |
| 30 to 34 Minutes | 21 | 10.5% |
| 35 to 39 Minutes | 33 | 16.6% |
| 40 to 44 Minutes | 0 | 0.0% |
| 45 to 59 Minutes | 10 | 5.0% |
| 60 to 89 Minutes | 14 | 7.0% |
| 90 or more Minutes | 6 | 3.0% |
Commute Time by Sex in Sabillasville
The most common commute times in Sabillasville are 20 to 24 minutes (31 commuters, 27.2%) for males and 35 to 39 minutes (33 commuters, 38.8%) for females.
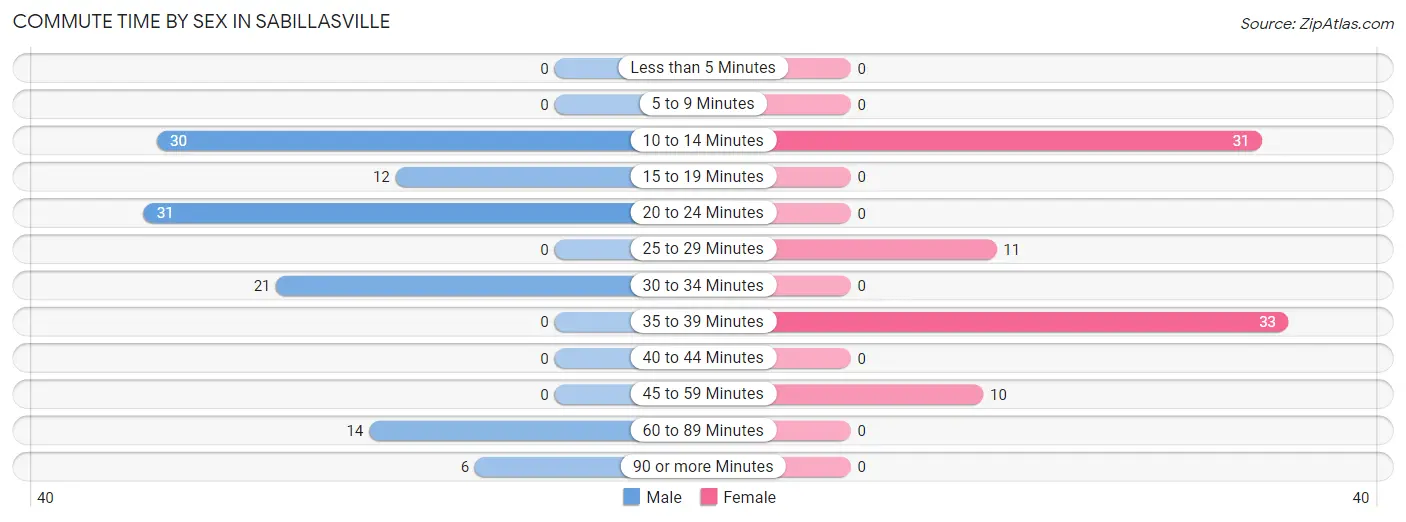
| Commute Time | Male | Female |
| Less than 5 Minutes | 0 (0.0%) | 0 (0.0%) |
| 5 to 9 Minutes | 0 (0.0%) | 0 (0.0%) |
| 10 to 14 Minutes | 30 (26.3%) | 31 (36.5%) |
| 15 to 19 Minutes | 12 (10.5%) | 0 (0.0%) |
| 20 to 24 Minutes | 31 (27.2%) | 0 (0.0%) |
| 25 to 29 Minutes | 0 (0.0%) | 11 (12.9%) |
| 30 to 34 Minutes | 21 (18.4%) | 0 (0.0%) |
| 35 to 39 Minutes | 0 (0.0%) | 33 (38.8%) |
| 40 to 44 Minutes | 0 (0.0%) | 0 (0.0%) |
| 45 to 59 Minutes | 0 (0.0%) | 10 (11.8%) |
| 60 to 89 Minutes | 14 (12.3%) | 0 (0.0%) |
| 90 or more Minutes | 6 (5.3%) | 0 (0.0%) |
Time of Departure to Work by Sex in Sabillasville
The most frequent times of departure to work in Sabillasville are 5:00 AM to 5:29 AM (21, 18.4%) for males and 7:30 AM to 7:59 AM (54, 63.5%) for females.
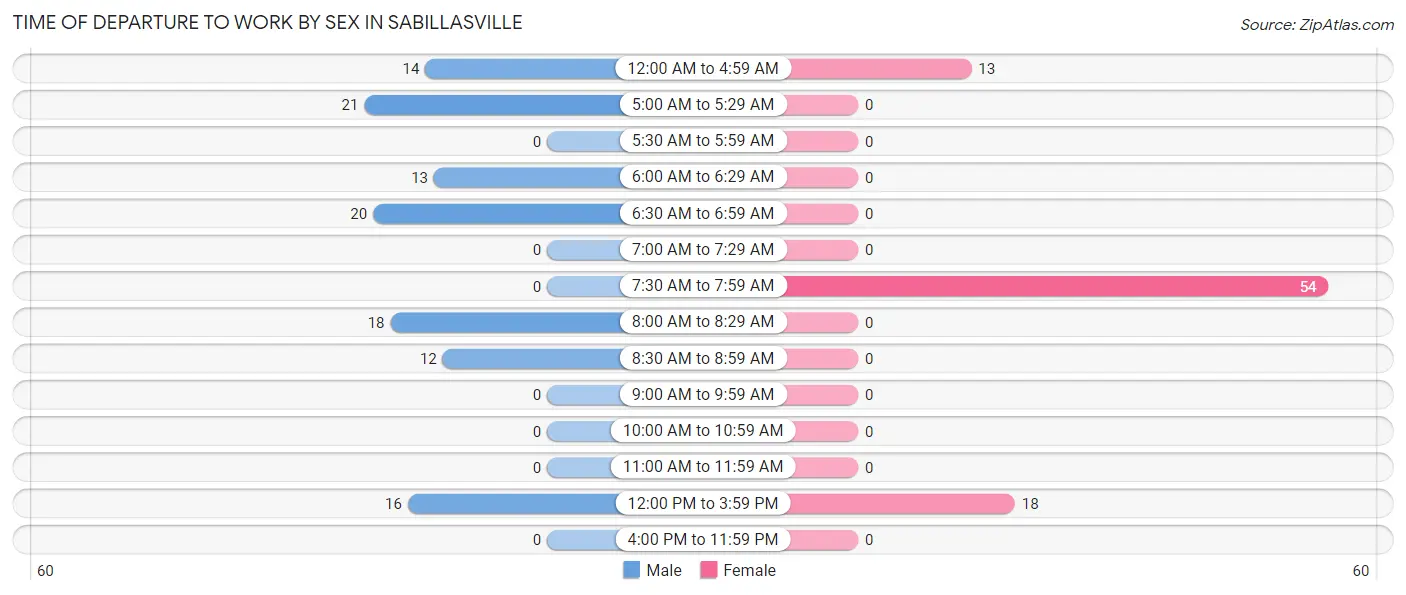
| Time of Departure | Male | Female |
| 12:00 AM to 4:59 AM | 14 (12.3%) | 13 (15.3%) |
| 5:00 AM to 5:29 AM | 21 (18.4%) | 0 (0.0%) |
| 5:30 AM to 5:59 AM | 0 (0.0%) | 0 (0.0%) |
| 6:00 AM to 6:29 AM | 13 (11.4%) | 0 (0.0%) |
| 6:30 AM to 6:59 AM | 20 (17.5%) | 0 (0.0%) |
| 7:00 AM to 7:29 AM | 0 (0.0%) | 0 (0.0%) |
| 7:30 AM to 7:59 AM | 0 (0.0%) | 54 (63.5%) |
| 8:00 AM to 8:29 AM | 18 (15.8%) | 0 (0.0%) |
| 8:30 AM to 8:59 AM | 12 (10.5%) | 0 (0.0%) |
| 9:00 AM to 9:59 AM | 0 (0.0%) | 0 (0.0%) |
| 10:00 AM to 10:59 AM | 0 (0.0%) | 0 (0.0%) |
| 11:00 AM to 11:59 AM | 0 (0.0%) | 0 (0.0%) |
| 12:00 PM to 3:59 PM | 16 (14.0%) | 18 (21.2%) |
| 4:00 PM to 11:59 PM | 0 (0.0%) | 0 (0.0%) |
| Total | 114 (100.0%) | 85 (100.0%) |
Housing Occupancy in Sabillasville
Occupancy by Ownership in Sabillasville
Of the total 141 dwellings in Sabillasville, owner-occupied units account for 141 (100.0%), while renter-occupied units make up 0 (0.0%).
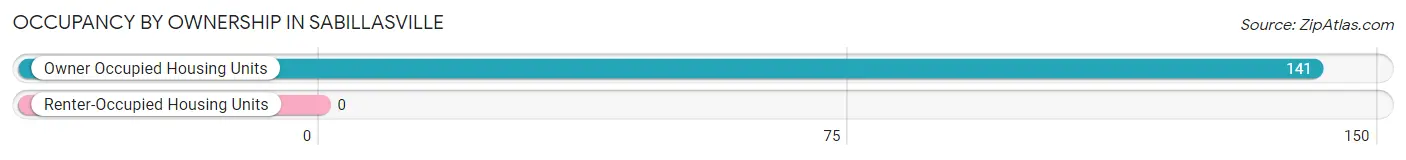
| Occupancy | # Housing Units | % Housing Units |
| Owner Occupied Housing Units | 141 | 100.0% |
| Renter-Occupied Housing Units | 0 | 0.0% |
| Total Occupied Housing Units | 141 | 100.0% |
Occupancy by Household Size in Sabillasville
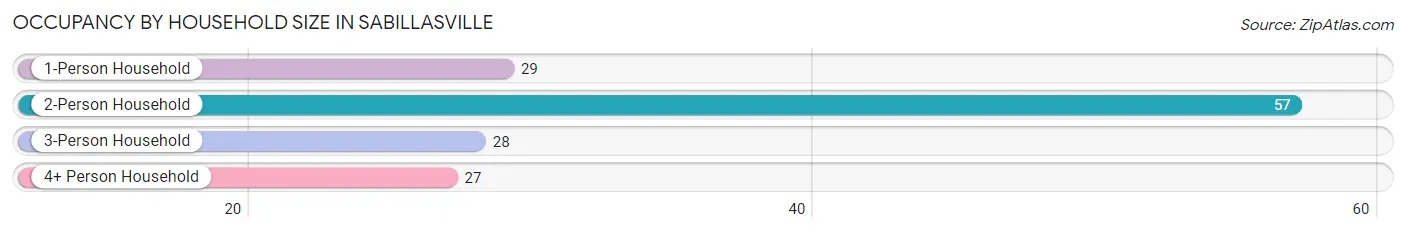
| Household Size | # Housing Units | % Housing Units |
| 1-Person Household | 29 | 20.6% |
| 2-Person Household | 57 | 40.4% |
| 3-Person Household | 28 | 19.9% |
| 4+ Person Household | 27 | 19.2% |
| Total Housing Units | 141 | 100.0% |
Occupancy by Ownership by Household Size in Sabillasville
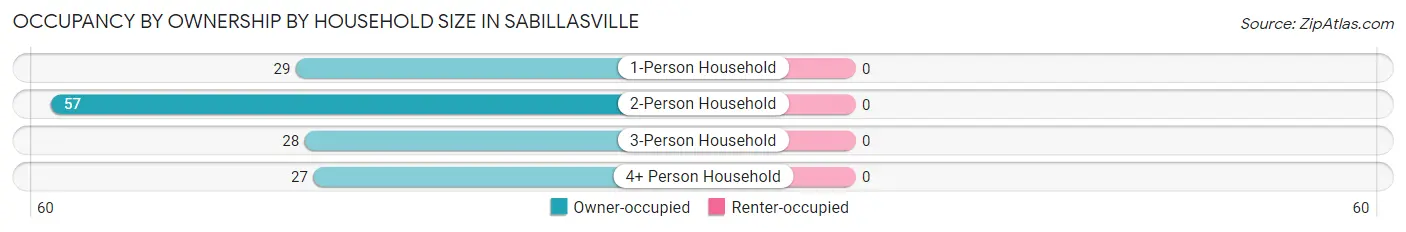
| Household Size | Owner-occupied | Renter-occupied |
| 1-Person Household | 29 (100.0%) | 0 (0.0%) |
| 2-Person Household | 57 (100.0%) | 0 (0.0%) |
| 3-Person Household | 28 (100.0%) | 0 (0.0%) |
| 4+ Person Household | 27 (100.0%) | 0 (0.0%) |
| Total Housing Units | 141 (100.0%) | 0 (0.0%) |
Occupancy by Educational Attainment in Sabillasville
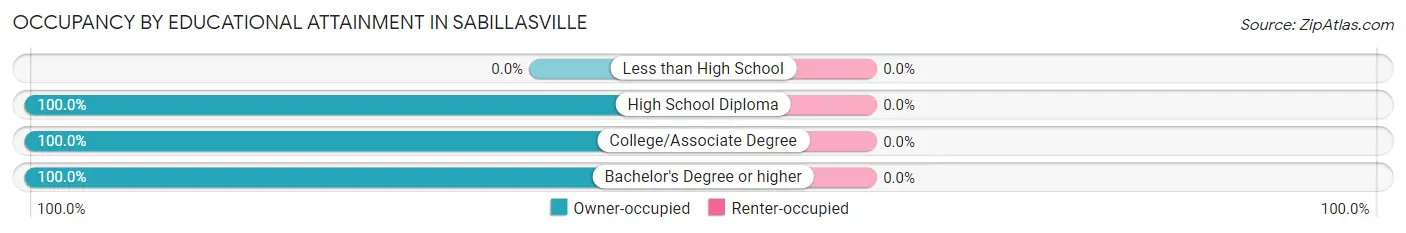
| Household Size | Owner-occupied | Renter-occupied |
| Less than High School | 0 (0.0%) | 0 (0.0%) |
| High School Diploma | 88 (100.0%) | 0 (0.0%) |
| College/Associate Degree | 36 (100.0%) | 0 (0.0%) |
| Bachelor's Degree or higher | 17 (100.0%) | 0 (0.0%) |
Occupancy by Age of Householder in Sabillasville
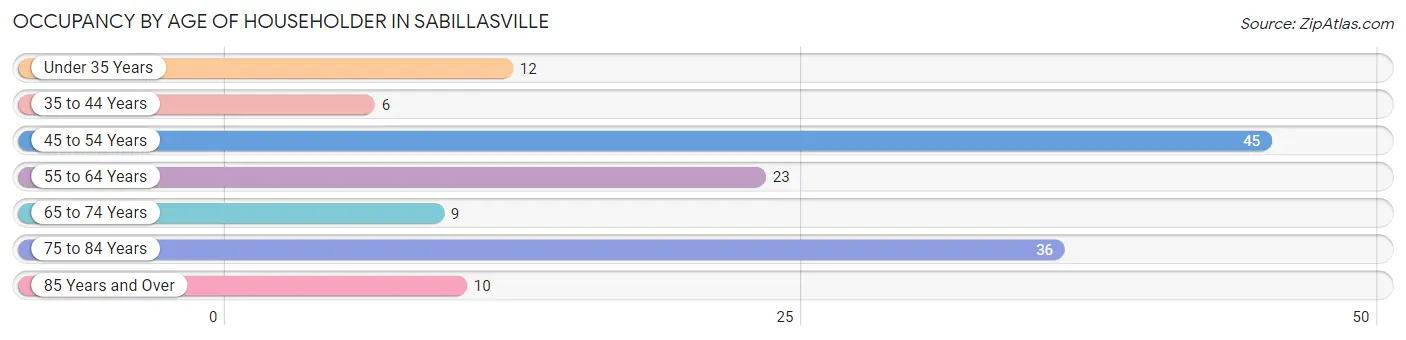
| Age Bracket | # Households | % Households |
| Under 35 Years | 12 | 8.5% |
| 35 to 44 Years | 6 | 4.3% |
| 45 to 54 Years | 45 | 31.9% |
| 55 to 64 Years | 23 | 16.3% |
| 65 to 74 Years | 9 | 6.4% |
| 75 to 84 Years | 36 | 25.5% |
| 85 Years and Over | 10 | 7.1% |
| Total | 141 | 100.0% |
Housing Finances in Sabillasville
Median Income by Occupancy in Sabillasville
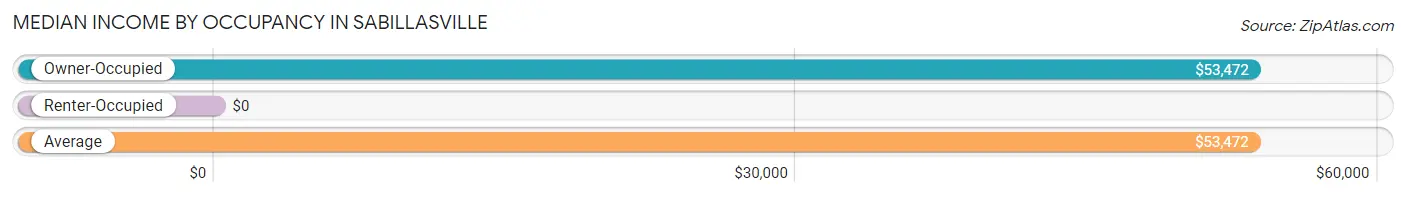
| Occupancy Type | # Households | Median Income |
| Owner-Occupied | 141 (100.0%) | $53,472 |
| Renter-Occupied | 0 (0.0%) | $0 |
| Average | 141 (100.0%) | $53,472 |
Occupancy by Householder Income Bracket in Sabillasville
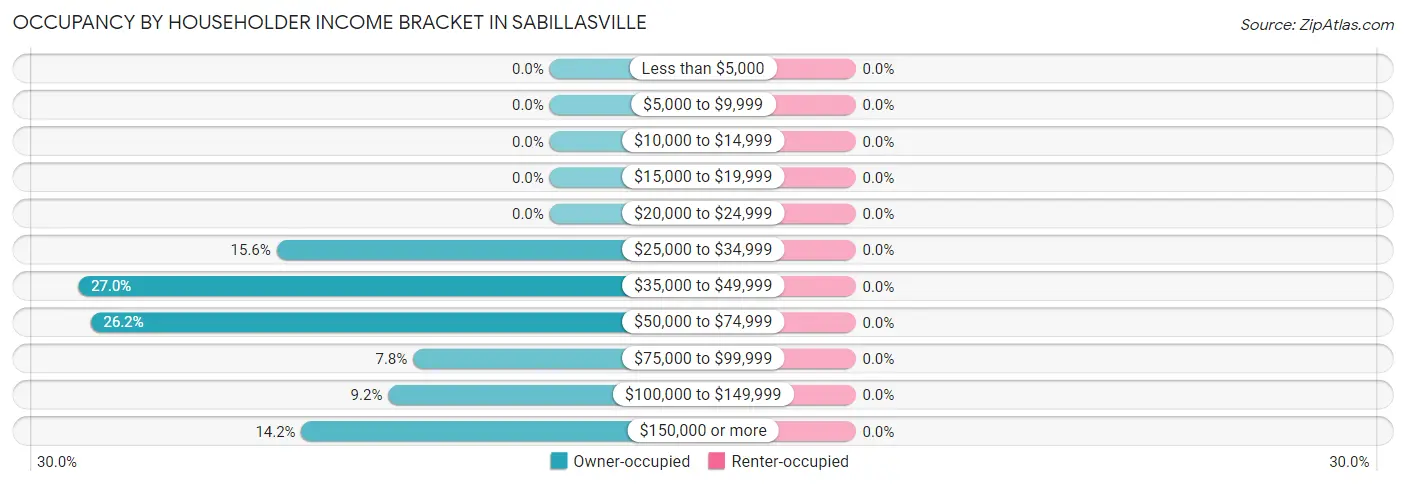
| Income Bracket | Owner-occupied | Renter-occupied |
| Less than $5,000 | 0 (0.0%) | 0 (0.0%) |
| $5,000 to $9,999 | 0 (0.0%) | 0 (0.0%) |
| $10,000 to $14,999 | 0 (0.0%) | 0 (0.0%) |
| $15,000 to $19,999 | 0 (0.0%) | 0 (0.0%) |
| $20,000 to $24,999 | 0 (0.0%) | 0 (0.0%) |
| $25,000 to $34,999 | 22 (15.6%) | 0 (0.0%) |
| $35,000 to $49,999 | 38 (27.0%) | 0 (0.0%) |
| $50,000 to $74,999 | 37 (26.2%) | 0 (0.0%) |
| $75,000 to $99,999 | 11 (7.8%) | 0 (0.0%) |
| $100,000 to $149,999 | 13 (9.2%) | 0 (0.0%) |
| $150,000 or more | 20 (14.2%) | 0 (0.0%) |
| Total | 141 (100.0%) | 0 (0.0%) |
Monthly Housing Cost Tiers in Sabillasville
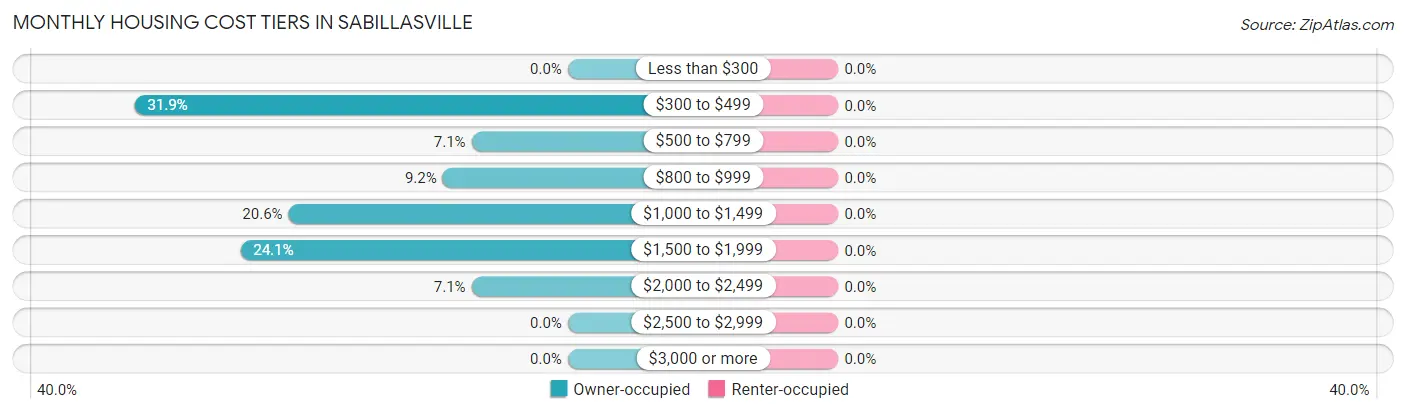
| Monthly Cost | Owner-occupied | Renter-occupied |
| Less than $300 | 0 (0.0%) | 0 (0.0%) |
| $300 to $499 | 45 (31.9%) | 0 (0.0%) |
| $500 to $799 | 10 (7.1%) | 0 (0.0%) |
| $800 to $999 | 13 (9.2%) | 0 (0.0%) |
| $1,000 to $1,499 | 29 (20.6%) | 0 (0.0%) |
| $1,500 to $1,999 | 34 (24.1%) | 0 (0.0%) |
| $2,000 to $2,499 | 10 (7.1%) | 0 (0.0%) |
| $2,500 to $2,999 | 0 (0.0%) | 0 (0.0%) |
| $3,000 or more | 0 (0.0%) | 0 (0.0%) |
| Total | 141 (100.0%) | 0 (0.0%) |
Physical Housing Characteristics in Sabillasville
Housing Structures in Sabillasville
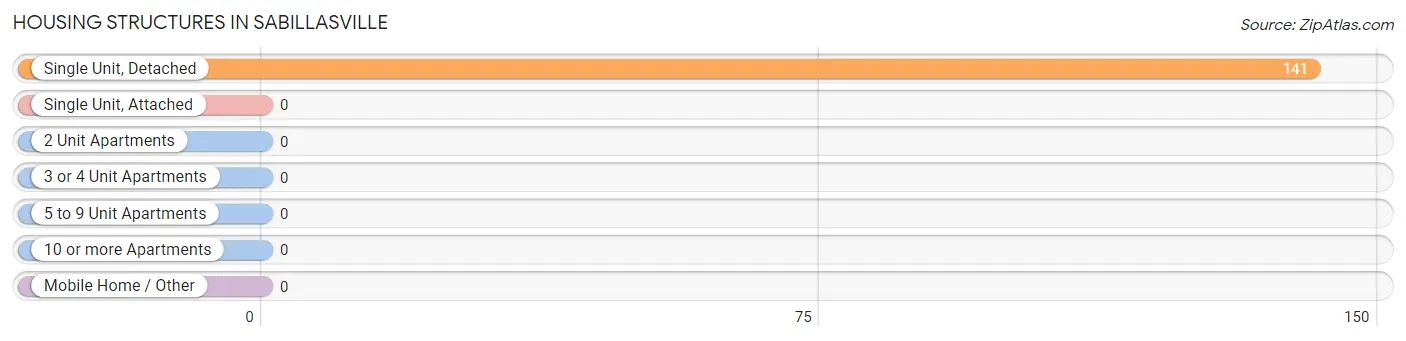
| Structure Type | # Housing Units | % Housing Units |
| Single Unit, Detached | 141 | 100.0% |
| Single Unit, Attached | 0 | 0.0% |
| 2 Unit Apartments | 0 | 0.0% |
| 3 or 4 Unit Apartments | 0 | 0.0% |
| 5 to 9 Unit Apartments | 0 | 0.0% |
| 10 or more Apartments | 0 | 0.0% |
| Mobile Home / Other | 0 | 0.0% |
| Total | 141 | 100.0% |
Housing Structures by Occupancy in Sabillasville
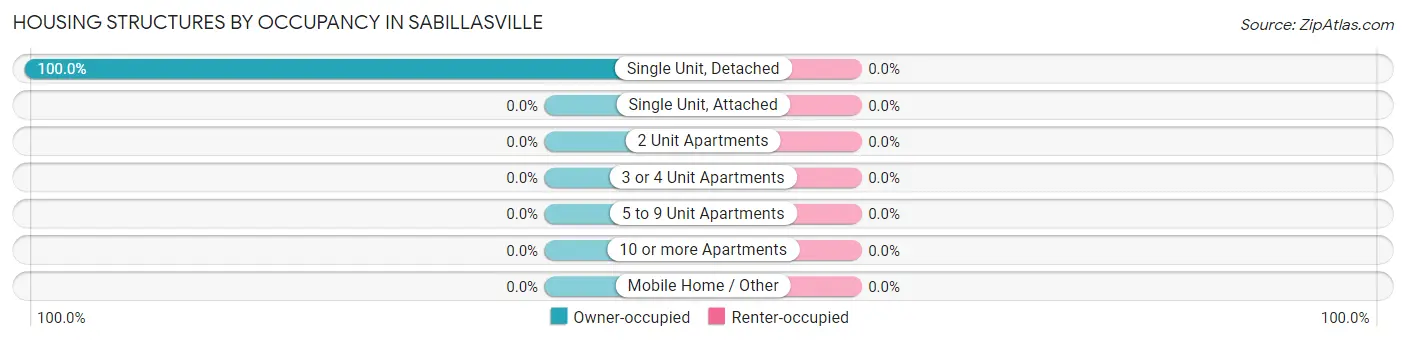
| Structure Type | Owner-occupied | Renter-occupied |
| Single Unit, Detached | 141 (100.0%) | 0 (0.0%) |
| Single Unit, Attached | 0 (0.0%) | 0 (0.0%) |
| 2 Unit Apartments | 0 (0.0%) | 0 (0.0%) |
| 3 or 4 Unit Apartments | 0 (0.0%) | 0 (0.0%) |
| 5 to 9 Unit Apartments | 0 (0.0%) | 0 (0.0%) |
| 10 or more Apartments | 0 (0.0%) | 0 (0.0%) |
| Mobile Home / Other | 0 (0.0%) | 0 (0.0%) |
| Total | 141 (100.0%) | 0 (0.0%) |
Housing Structures by Number of Rooms in Sabillasville
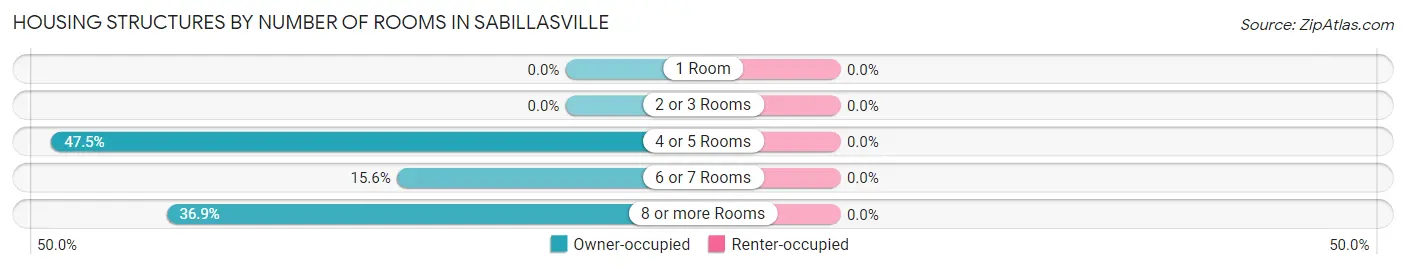
| Number of Rooms | Owner-occupied | Renter-occupied |
| 1 Room | 0 (0.0%) | 0 (0.0%) |
| 2 or 3 Rooms | 0 (0.0%) | 0 (0.0%) |
| 4 or 5 Rooms | 67 (47.5%) | 0 (0.0%) |
| 6 or 7 Rooms | 22 (15.6%) | 0 (0.0%) |
| 8 or more Rooms | 52 (36.9%) | 0 (0.0%) |
| Total | 141 (100.0%) | 0 (0.0%) |
Housing Structure by Heating Type in Sabillasville
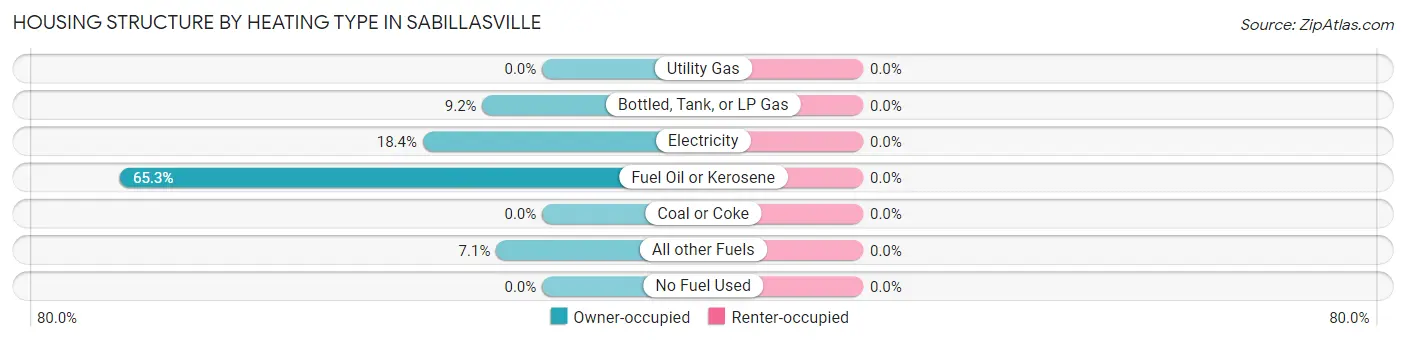
| Heating Type | Owner-occupied | Renter-occupied |
| Utility Gas | 0 (0.0%) | 0 (0.0%) |
| Bottled, Tank, or LP Gas | 13 (9.2%) | 0 (0.0%) |
| Electricity | 26 (18.4%) | 0 (0.0%) |
| Fuel Oil or Kerosene | 92 (65.2%) | 0 (0.0%) |
| Coal or Coke | 0 (0.0%) | 0 (0.0%) |
| All other Fuels | 10 (7.1%) | 0 (0.0%) |
| No Fuel Used | 0 (0.0%) | 0 (0.0%) |
| Total | 141 (100.0%) | 0 (0.0%) |
Household Vehicle Usage in Sabillasville
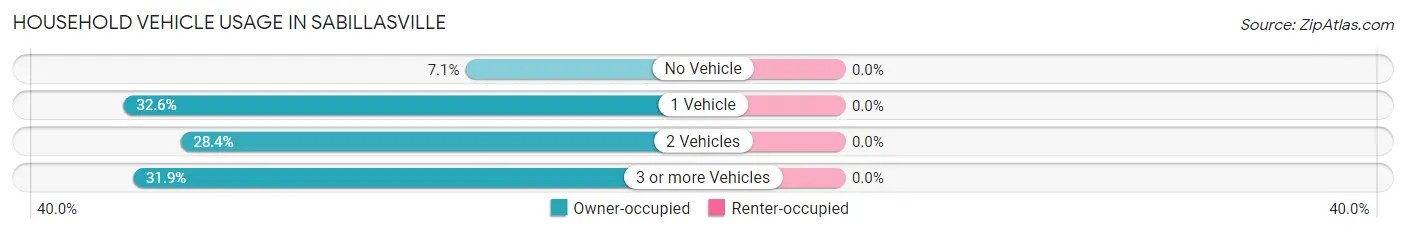
| Vehicles per Household | Owner-occupied | Renter-occupied |
| No Vehicle | 10 (7.1%) | 0 (0.0%) |
| 1 Vehicle | 46 (32.6%) | 0 (0.0%) |
| 2 Vehicles | 40 (28.4%) | 0 (0.0%) |
| 3 or more Vehicles | 45 (31.9%) | 0 (0.0%) |
| Total | 141 (100.0%) | 0 (0.0%) |
Real Estate & Mortgages in Sabillasville
Real Estate and Mortgage Overview in Sabillasville
| Characteristic | Without Mortgage | With Mortgage |
| Housing Units | 55 | 86 |
| Median Property Value | $157,900 | $261,400 |
| Median Household Income | $47,361 | $20 |
| Monthly Housing Costs | $353 | $0 |
| Real Estate Taxes | $1,843 | $12 |
Property Value by Mortgage Status in Sabillasville
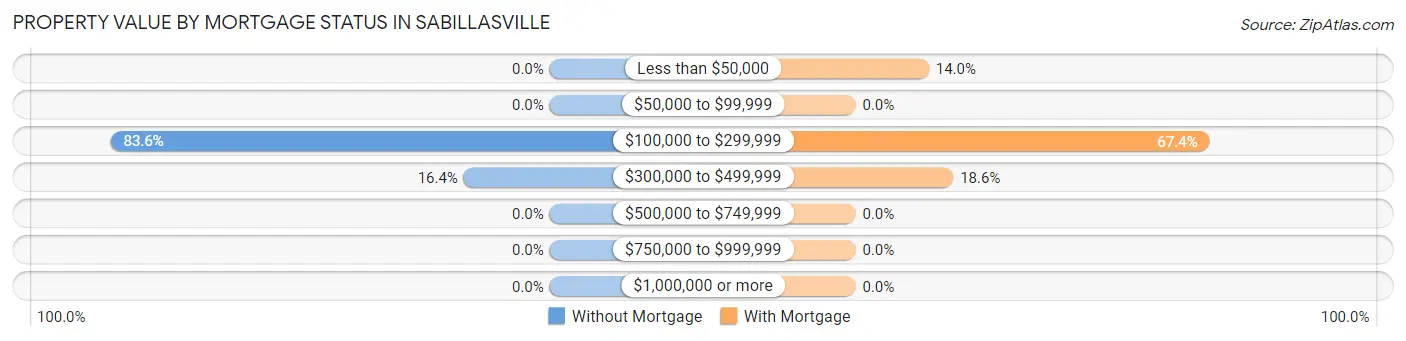
| Property Value | Without Mortgage | With Mortgage |
| Less than $50,000 | 0 (0.0%) | 12 (14.0%) |
| $50,000 to $99,999 | 0 (0.0%) | 0 (0.0%) |
| $100,000 to $299,999 | 46 (83.6%) | 58 (67.4%) |
| $300,000 to $499,999 | 9 (16.4%) | 16 (18.6%) |
| $500,000 to $749,999 | 0 (0.0%) | 0 (0.0%) |
| $750,000 to $999,999 | 0 (0.0%) | 0 (0.0%) |
| $1,000,000 or more | 0 (0.0%) | 0 (0.0%) |
| Total | 55 (100.0%) | 86 (100.0%) |
Household Income by Mortgage Status in Sabillasville
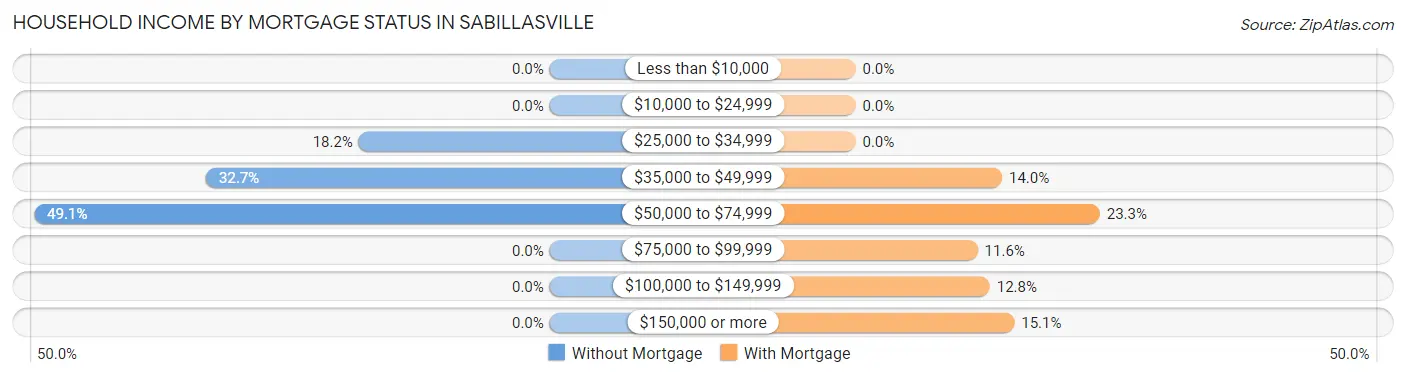
| Household Income | Without Mortgage | With Mortgage |
| Less than $10,000 | 0 (0.0%) | 0 (0.0%) |
| $10,000 to $24,999 | 0 (0.0%) | 0 (0.0%) |
| $25,000 to $34,999 | 10 (18.2%) | 0 (0.0%) |
| $35,000 to $49,999 | 18 (32.7%) | 12 (14.0%) |
| $50,000 to $74,999 | 27 (49.1%) | 20 (23.3%) |
| $75,000 to $99,999 | 0 (0.0%) | 10 (11.6%) |
| $100,000 to $149,999 | 0 (0.0%) | 11 (12.8%) |
| $150,000 or more | 0 (0.0%) | 13 (15.1%) |
| Total | 55 (100.0%) | 86 (100.0%) |
Property Value to Household Income Ratio in Sabillasville
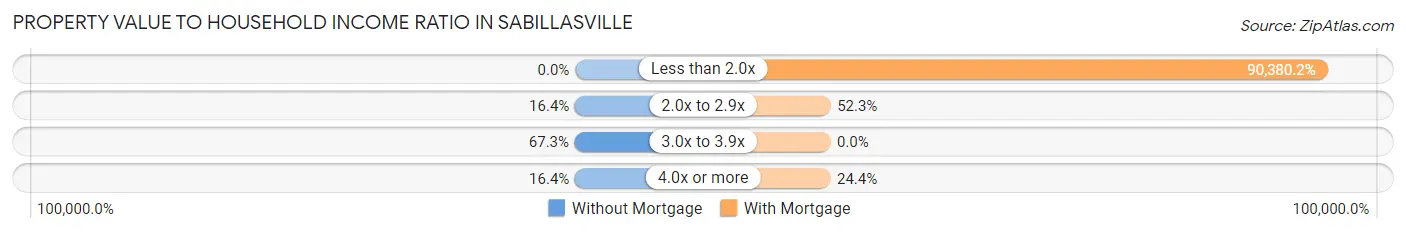
| Value-to-Income Ratio | Without Mortgage | With Mortgage |
| Less than 2.0x | 0 (0.0%) | 77,727 (90,380.2%) |
| 2.0x to 2.9x | 9 (16.4%) | 45 (52.3%) |
| 3.0x to 3.9x | 37 (67.3%) | 0 (0.0%) |
| 4.0x or more | 9 (16.4%) | 21 (24.4%) |
| Total | 55 (100.0%) | 86 (100.0%) |
Real Estate Taxes by Mortgage Status in Sabillasville
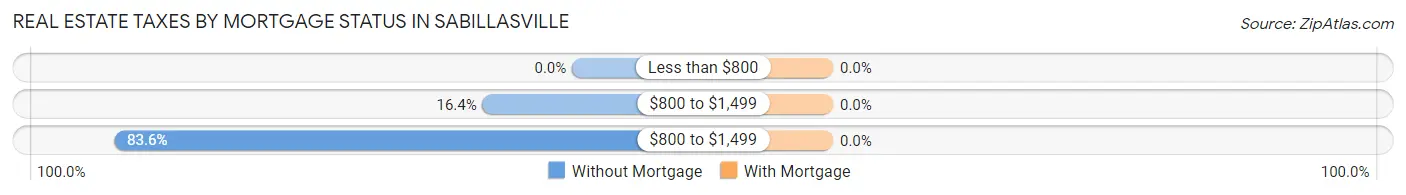
| Property Taxes | Without Mortgage | With Mortgage |
| Less than $800 | 0 (0.0%) | 0 (0.0%) |
| $800 to $1,499 | 9 (16.4%) | 0 (0.0%) |
| $800 to $1,499 | 46 (83.6%) | 0 (0.0%) |
| Total | 55 (100.0%) | 86 (100.0%) |
Health & Disability in Sabillasville
Health Insurance Coverage by Age in Sabillasville
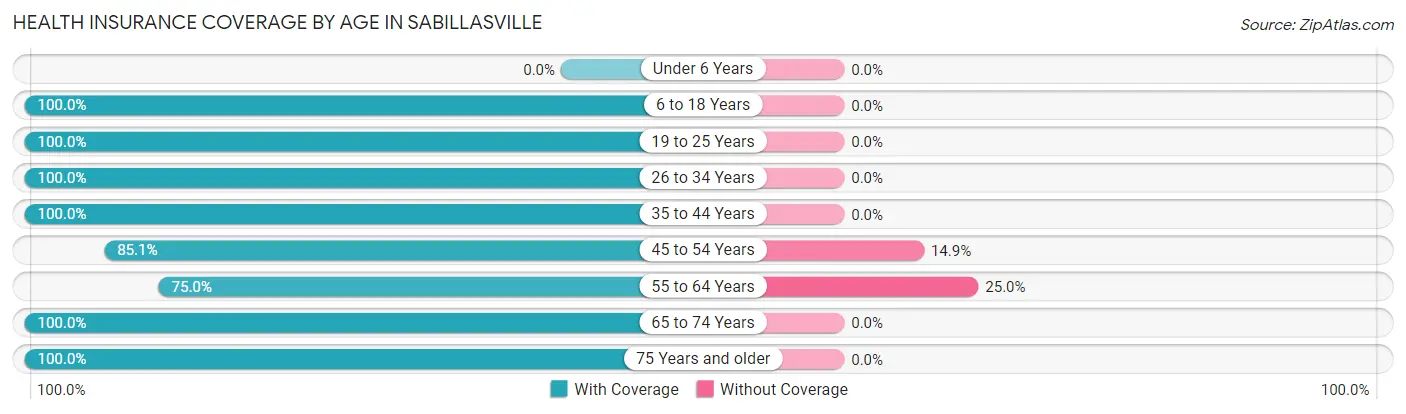
| Age Bracket | With Coverage | Without Coverage |
| Under 6 Years | 0 (0.0%) | 0 (0.0%) |
| 6 to 18 Years | 16 (100.0%) | 0 (0.0%) |
| 19 to 25 Years | 68 (100.0%) | 0 (0.0%) |
| 26 to 34 Years | 25 (100.0%) | 0 (0.0%) |
| 35 to 44 Years | 21 (100.0%) | 0 (0.0%) |
| 45 to 54 Years | 63 (85.1%) | 11 (14.9%) |
| 55 to 64 Years | 36 (75.0%) | 12 (25.0%) |
| 65 to 74 Years | 74 (100.0%) | 0 (0.0%) |
| 75 Years and older | 46 (100.0%) | 0 (0.0%) |
| Total | 349 (93.8%) | 23 (6.2%) |
Health Insurance Coverage by Citizenship Status in Sabillasville
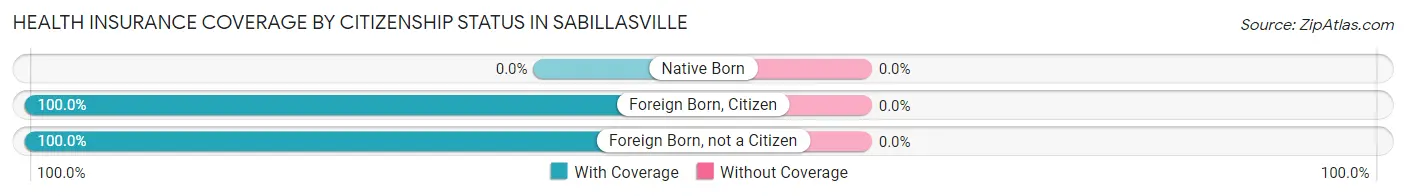
| Citizenship Status | With Coverage | Without Coverage |
| Native Born | 0 (0.0%) | 0 (0.0%) |
| Foreign Born, Citizen | 16 (100.0%) | 0 (0.0%) |
| Foreign Born, not a Citizen | 68 (100.0%) | 0 (0.0%) |
Health Insurance Coverage by Household Income in Sabillasville
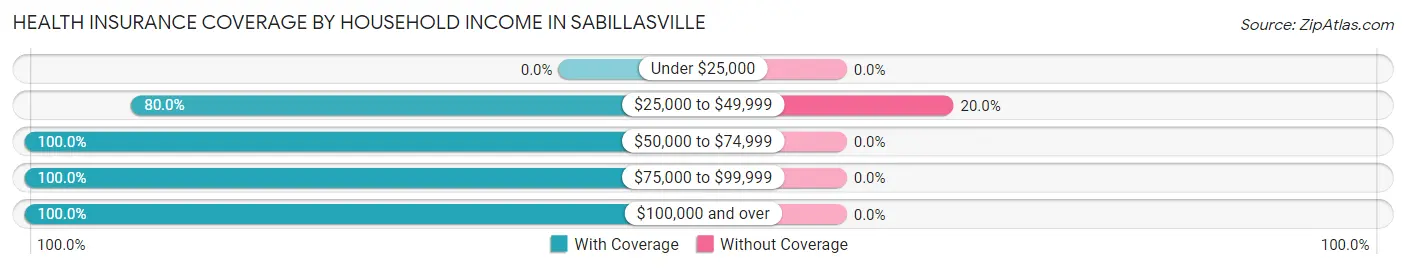
| Household Income | With Coverage | Without Coverage |
| Under $25,000 | 0 (0.0%) | 0 (0.0%) |
| $25,000 to $49,999 | 92 (80.0%) | 23 (20.0%) |
| $50,000 to $74,999 | 73 (100.0%) | 0 (0.0%) |
| $75,000 to $99,999 | 25 (100.0%) | 0 (0.0%) |
| $100,000 and over | 159 (100.0%) | 0 (0.0%) |
Public vs Private Health Insurance Coverage by Age in Sabillasville
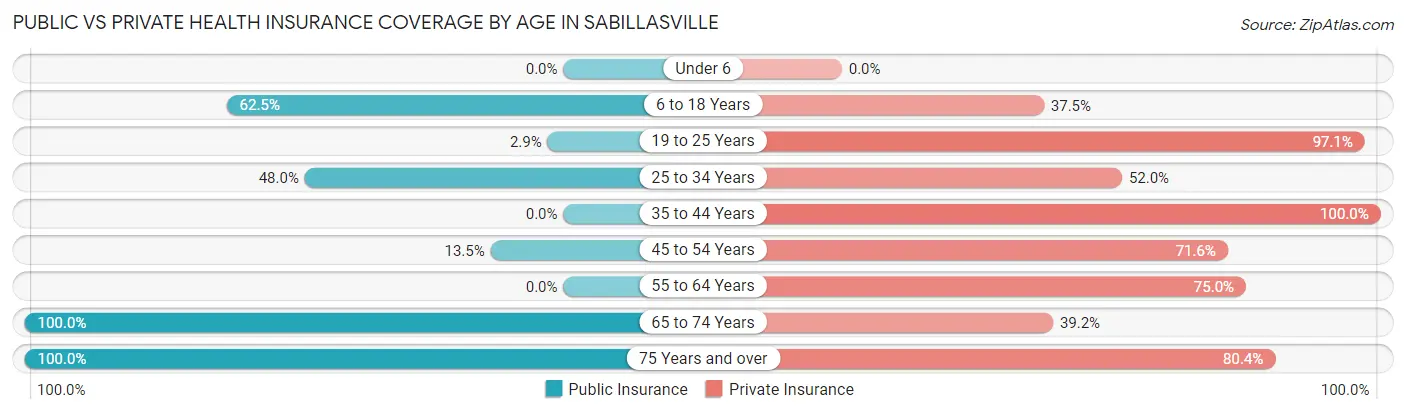
| Age Bracket | Public Insurance | Private Insurance |
| Under 6 | 0 (0.0%) | 0 (0.0%) |
| 6 to 18 Years | 10 (62.5%) | 6 (37.5%) |
| 19 to 25 Years | 2 (2.9%) | 66 (97.1%) |
| 25 to 34 Years | 12 (48.0%) | 13 (52.0%) |
| 35 to 44 Years | 0 (0.0%) | 21 (100.0%) |
| 45 to 54 Years | 10 (13.5%) | 53 (71.6%) |
| 55 to 64 Years | 0 (0.0%) | 36 (75.0%) |
| 65 to 74 Years | 74 (100.0%) | 29 (39.2%) |
| 75 Years and over | 46 (100.0%) | 37 (80.4%) |
| Total | 154 (41.4%) | 261 (70.2%) |
Disability Status by Sex by Age in Sabillasville
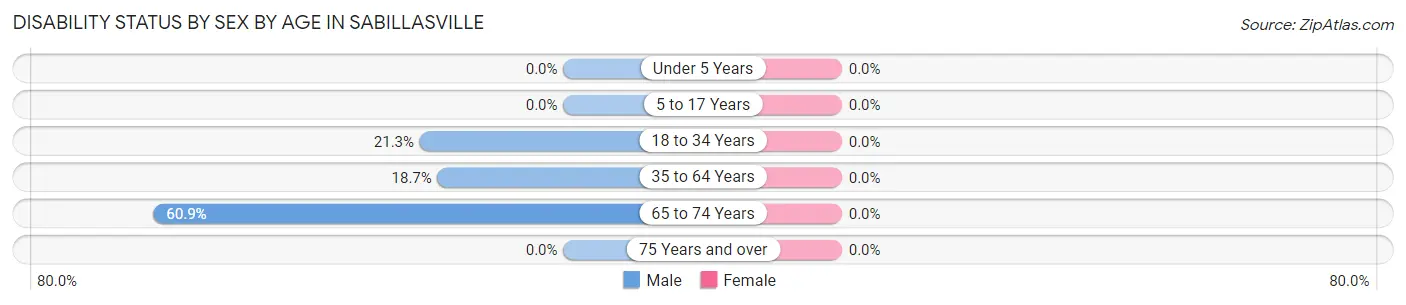
| Age Bracket | Male | Female |
| Under 5 Years | 0 (0.0%) | 0 (0.0%) |
| 5 to 17 Years | 0 (0.0%) | 0 (0.0%) |
| 18 to 34 Years | 13 (21.3%) | 0 (0.0%) |
| 35 to 64 Years | 14 (18.7%) | 0 (0.0%) |
| 65 to 74 Years | 14 (60.9%) | 0 (0.0%) |
| 75 Years and over | 0 (0.0%) | 0 (0.0%) |
Disability Class by Sex by Age in Sabillasville
Disability Class: Hearing Difficulty
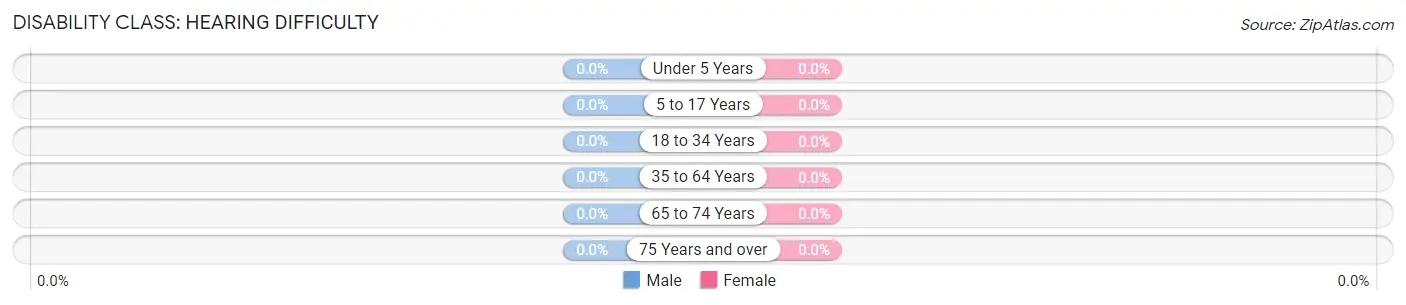
| Age Bracket | Male | Female |
| Under 5 Years | 0 (0.0%) | 0 (0.0%) |
| 5 to 17 Years | 0 (0.0%) | 0 (0.0%) |
| 18 to 34 Years | 0 (0.0%) | 0 (0.0%) |
| 35 to 64 Years | 0 (0.0%) | 0 (0.0%) |
| 65 to 74 Years | 0 (0.0%) | 0 (0.0%) |
| 75 Years and over | 0 (0.0%) | 0 (0.0%) |
Disability Class: Vision Difficulty
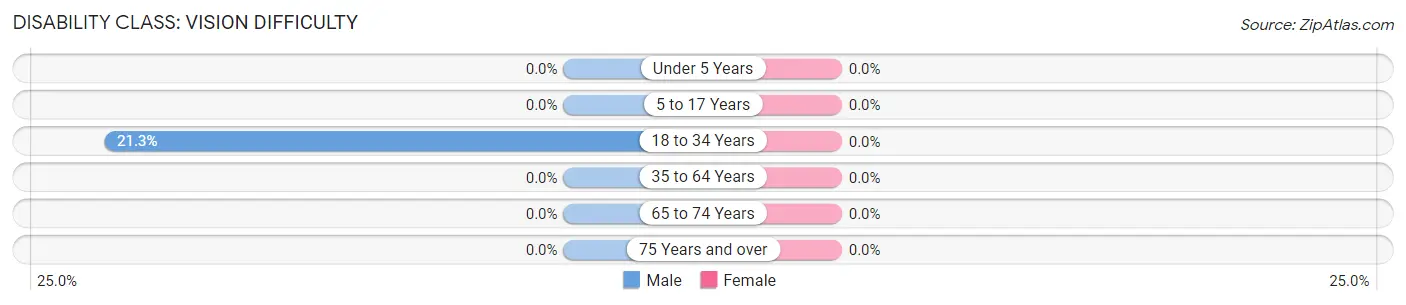
| Age Bracket | Male | Female |
| Under 5 Years | 0 (0.0%) | 0 (0.0%) |
| 5 to 17 Years | 0 (0.0%) | 0 (0.0%) |
| 18 to 34 Years | 13 (21.3%) | 0 (0.0%) |
| 35 to 64 Years | 0 (0.0%) | 0 (0.0%) |
| 65 to 74 Years | 0 (0.0%) | 0 (0.0%) |
| 75 Years and over | 0 (0.0%) | 0 (0.0%) |
Disability Class: Cognitive Difficulty
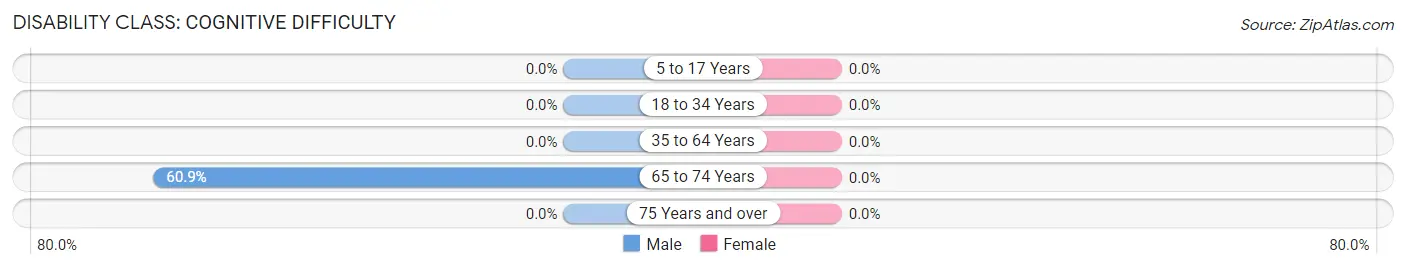
| Age Bracket | Male | Female |
| 5 to 17 Years | 0 (0.0%) | 0 (0.0%) |
| 18 to 34 Years | 0 (0.0%) | 0 (0.0%) |
| 35 to 64 Years | 0 (0.0%) | 0 (0.0%) |
| 65 to 74 Years | 14 (60.9%) | 0 (0.0%) |
| 75 Years and over | 0 (0.0%) | 0 (0.0%) |
Disability Class: Ambulatory Difficulty
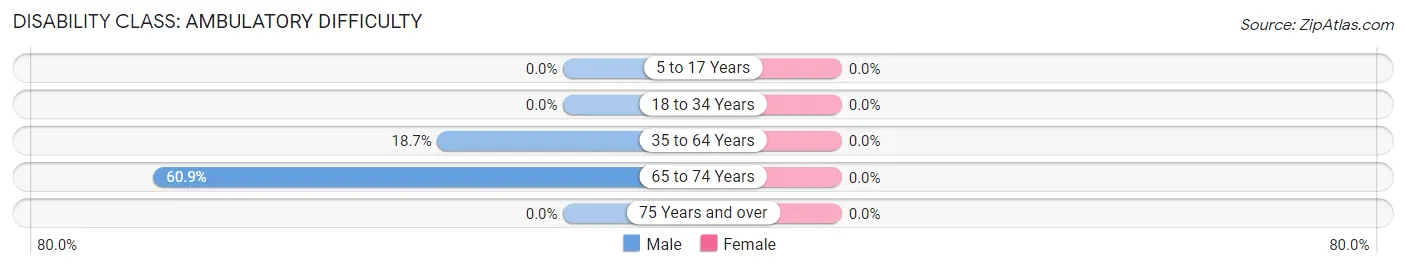
| Age Bracket | Male | Female |
| 5 to 17 Years | 0 (0.0%) | 0 (0.0%) |
| 18 to 34 Years | 0 (0.0%) | 0 (0.0%) |
| 35 to 64 Years | 14 (18.7%) | 0 (0.0%) |
| 65 to 74 Years | 14 (60.9%) | 0 (0.0%) |
| 75 Years and over | 0 (0.0%) | 0 (0.0%) |
Disability Class: Self-Care Difficulty
| Age Bracket | Male | Female |
| 5 to 17 Years | 0 (0.0%) | 0 (0.0%) |
| 18 to 34 Years | 0 (0.0%) | 0 (0.0%) |
| 35 to 64 Years | 0 (0.0%) | 0 (0.0%) |
| 65 to 74 Years | 0 (0.0%) | 0 (0.0%) |
| 75 Years and over | 0 (0.0%) | 0 (0.0%) |
Technology Access in Sabillasville
Computing Device Access in Sabillasville
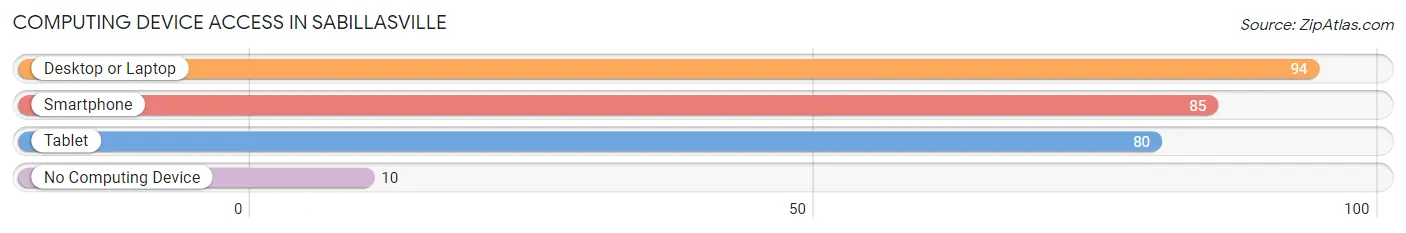
| Device Type | # Households | % Households |
| Desktop or Laptop | 94 | 66.7% |
| Smartphone | 85 | 60.3% |
| Tablet | 80 | 56.7% |
| No Computing Device | 10 | 7.1% |
| Total | 141 | 100.0% |
Internet Access in Sabillasville
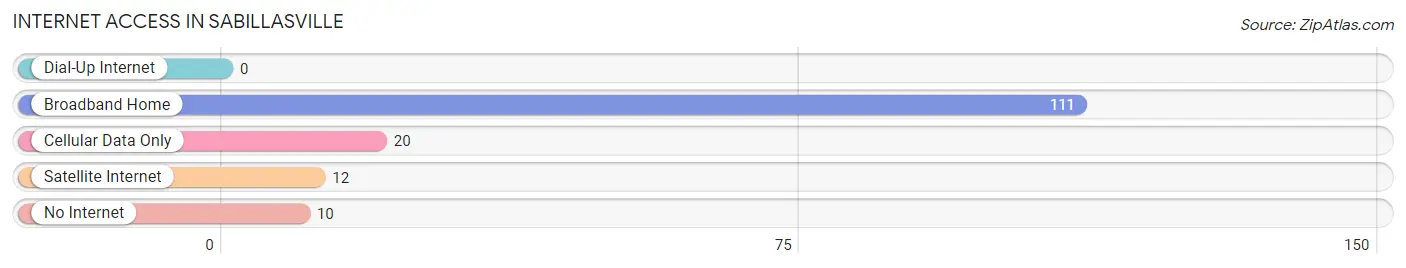
| Internet Type | # Households | % Households |
| Dial-Up Internet | 0 | 0.0% |
| Broadband Home | 111 | 78.7% |
| Cellular Data Only | 20 | 14.2% |
| Satellite Internet | 12 | 8.5% |
| No Internet | 10 | 7.1% |
| Total | 141 | 100.0% |
Sabillasville Summary
Sabillasville is a small unincorporated community located in Frederick County, Maryland. It is situated in the Catoctin Mountains, approximately 10 miles north of Frederick and 30 miles northwest of Washington, D.C. The population of Sabillasville was estimated to be around 500 in 2020.
History
The area that is now Sabillasville was first settled in the late 1700s by German immigrants. The town was originally known as “Sauersville” after the Sauers family, who were among the first settlers. The name was changed to Sabillasville in 1845, after the Sabillas family, who had moved to the area from Pennsylvania.
The town was a popular stop for travelers on the National Road, which ran through the area in the early 1800s. The road was the first federally funded highway in the United States and was used to transport goods and people between the east and west coasts.
The town was also home to a number of businesses, including a blacksmith shop, a general store, a post office, and a hotel. The hotel was a popular destination for travelers, and it was also used as a meeting place for local farmers and merchants.
Geography
Sabillasville is located in the Catoctin Mountains, which are part of the Appalachian Mountains. The town is situated at an elevation of 1,400 feet and is surrounded by rolling hills and forests. The Catoctin Creek runs through the town, and there are several small lakes in the area.
The climate in Sabillasville is temperate, with hot summers and cold winters. The average temperature in the summer is around 75 degrees Fahrenheit, and the average temperature in the winter is around 30 degrees Fahrenheit.
Economy
The economy of Sabillasville is largely based on agriculture and tourism. The town is home to several farms, which produce a variety of crops, including corn, soybeans, and hay. The town is also home to several wineries, which produce a variety of wines.
Tourism is an important part of the economy in Sabillasville. The town is home to several historic sites, including the National Road, which was the first federally funded highway in the United States. The town is also home to several parks, including Catoctin Mountain Park, which is a popular destination for hikers and campers.
Demographics
The population of Sabillasville was estimated to be around 500 in 2020. The town is predominantly white, with a small African American population. The median household income in Sabillasville is around $50,000, and the median home value is around $200,000.
The town is served by the Frederick County Public Schools system. The town is also home to several churches, including the Sabillasville United Methodist Church and the Sabillasville Baptist Church.
Conclusion
Sabillasville is a small unincorporated community located in Frederick County, Maryland. It is situated in the Catoctin Mountains, approximately 10 miles north of Frederick and 30 miles northwest of Washington, D.C. The town was originally settled in the late 1700s by German immigrants, and it has since become a popular destination for tourists and outdoor enthusiasts. The economy of Sabillasville is largely based on agriculture and tourism, and the population of the town was estimated to be around 500 in 2020.
Common Questions
What is Per Capita Income in Sabillasville?
Per Capita income in Sabillasville is $27,613.
What is the Median Family Income in Sabillasville?
Median Family Income in Sabillasville is $54,352.
What is the Median Household income in Sabillasville?
Median Household Income in Sabillasville is $53,472.
What is Income or Wage Gap in Sabillasville?
Income or Wage Gap in Sabillasville is 50.3%.
Women in Sabillasville earn 49.7 cents for every dollar earned by a man.
What is Inequality or Gini Index in Sabillasville?
Inequality or Gini Index in Sabillasville is 0.37.
What is the Total Population of Sabillasville?
Total Population of Sabillasville is 405.
What is the Total Male Population of Sabillasville?
Total Male Population of Sabillasville is 207.
What is the Total Female Population of Sabillasville?
Total Female Population of Sabillasville is 198.
What is the Ratio of Males per 100 Females in Sabillasville?
There are 104.55 Males per 100 Females in Sabillasville.
What is the Ratio of Females per 100 Males in Sabillasville?
There are 95.65 Females per 100 Males in Sabillasville.
What is the Median Population Age in Sabillasville?
Median Population Age in Sabillasville is 50.5 Years.
What is the Average Family Size in Sabillasville
Average Family Size in Sabillasville is 2.9 People.
What is the Average Household Size in Sabillasville
Average Household Size in Sabillasville is 2.6 People.
How Large is the Labor Force in Sabillasville?
There are 222 People in the Labor Forcein in Sabillasville.
What is the Percentage of People in the Labor Force in Sabillasville?
59.2% of People are in the Labor Force in Sabillasville.