Zip Codes with the Lowest Poverty Level Among Children Under the Age of 5 in Milwaukee, WI

RELATED REPORTS & OPTIONS

Lowest Poverty | Child 0-5
Population
Families and Households
Female Fertility
Female Fertility (Unmarried)
Race (Community Size)
Race (Percentage)
Ancestry (Community Size)
AfricanAlaska NativeAlaskan AthabascanAlbanianAleutAlsatianAmericanApacheArabArgentineanArmenianAssyrian / Chaldean / SyriacAustralianAustrianBahamianBangladeshiBarbadianBelgianBelizeanBhutaneseBlackfeetBolivianBrazilianBritishBritish West IndianBulgarianBurmeseCanadianCape VerdeanCarpatho RusynCelticCentral AmericanCentral American IndianCherokeeCheyenneChickasawChileanChippewaChoctawColombianCosta RicanCreekCroatianCrowCubanCzechCzechoslovakianDanishDominicanDutchEastern EuropeanEcuadorianEgyptianEnglishEstonianEthiopianEuropeanFilipinoFinnishFrenchFrench American IndianFrench CanadianGermanGerman RussianGhanaianGreekGuamanian / ChamorroGuatemalanHaitianHonduranHungarianIcelanderIndian (Asian)IndonesianIranianIraqiIrishIroquoisIsraeliItalianJamaicanJapaneseJordanianKenyanKoreanLaotianLatvianLebaneseLithuanianLuxembourgerMacedonianMalaysianMenomineeMexicanMexican American IndianMongolianMoroccanNative HawaiianNavajoNicaraguanNigerianNorthern EuropeanNorwegianOttawaPakistaniPalestinianPanamanianParaguayanPennsylvania GermanPeruvianPimaPolishPortuguesePotawatomiPuerto RicanRomanianRussianSalvadoranSamoanScandinavianScotch-IrishScottishSeminoleSenegaleseSerbianSiouxSlavicSlovakSloveneSomaliSouth AfricanSouth AmericanSouth American IndianSpaniardSpanishSri LankanSubsaharan AfricanSwedishSwissSyrianThaiTonganTrinidadian and TobagonianTurkishUgandanUkrainianVenezuelanVietnameseWelshWest IndianYugoslavian
Ancestry (Percentage)
AfricanAlaska NativeAlaskan AthabascanAlbanianAleutAlsatianAmericanApacheArabArgentineanArmenianAssyrian / Chaldean / SyriacAustralianAustrianBahamianBangladeshiBarbadianBelgianBelizeanBhutaneseBlackfeetBolivianBrazilianBritishBritish West IndianBulgarianBurmeseCanadianCape VerdeanCarpatho RusynCelticCentral AmericanCentral American IndianCherokeeCheyenneChickasawChileanChippewaChoctawColombianCosta RicanCreekCroatianCrowCubanCzechCzechoslovakianDanishDominicanDutchEastern EuropeanEcuadorianEgyptianEnglishEstonianEthiopianEuropeanFilipinoFinnishFrenchFrench American IndianFrench CanadianGermanGerman RussianGhanaianGreekGuamanian / ChamorroGuatemalanHaitianHonduranHungarianIcelanderIndian (Asian)IndonesianIranianIraqiIrishIroquoisIsraeliItalianJamaicanJapaneseJordanianKenyanKoreanLaotianLatvianLebaneseLithuanianLuxembourgerMacedonianMalaysianMenomineeMexicanMexican American IndianMongolianMoroccanNative HawaiianNavajoNicaraguanNigerianNorthern EuropeanNorwegianOttawaPakistaniPalestinianPanamanianParaguayanPennsylvania GermanPeruvianPimaPolishPortuguesePotawatomiPuerto RicanRomanianRussianSalvadoranSamoanScandinavianScotch-IrishScottishSeminoleSenegaleseSerbianSiouxSlavicSlovakSloveneSomaliSouth AfricanSouth AmericanSouth American IndianSpaniardSpanishSri LankanSubsaharan AfricanSwedishSwissSyrianThaiTonganTrinidadian and TobagonianTurkishUgandanUkrainianVenezuelanVietnameseWelshWest IndianYugoslavian
Immigrant Origin (Total)
AfricaAlbaniaArgentinaAsiaAustraliaAustriaBangladeshBelarusBelgiumBelizeBoliviaBosnia and HerzegovinaBrazilBulgariaBurma / MyanmarCambodiaCameroonCanadaCaribbeanCentral AmericaChileChinaColombiaCongoCosta RicaCroatiaCubaCzechoslovakiaDominicaDominican RepublicEastern AfricaEastern AsiaEastern EuropeEcuadorEgyptEl SalvadorEnglandEritreaEthiopiaEuropeFranceGermanyGhanaGreeceGuatemalaHaitiHondurasHong KongHungaryIndiaIndonesiaIranIraqIrelandIsraelItalyJamaicaJapanJordanKazakhstanKenyaKoreaKuwaitLaosLatin AmericaLatviaLebanonLiberiaLithuaniaMalaysiaMexicoMiddle AfricaMoroccoNepalNetherlandsNicaraguaNigeriaNorthern AfricaNorthern EuropeOceaniaPakistanPanamaPeruPhilippinesPolandRomaniaRussiaSaudi ArabiaScotlandSenegalSerbiaSierra LeoneSingaporeSomaliaSouth AfricaSouth AmericaSouth Central AsiaSouth Eastern AsiaSouthern EuropeSpainSwedenTaiwanThailandTrinidad and TobagoTurkeyUgandaUkraineUzbekistanVenezuelaVietnamWestern AfricaWestern AsiaWestern EuropeZaire
Immigrant Origin (Percentage)
AfricaAlbaniaArgentinaAsiaAustraliaAustriaBangladeshBelarusBelgiumBelizeBoliviaBosnia and HerzegovinaBrazilBulgariaBurma / MyanmarCambodiaCameroonCanadaCaribbeanCentral AmericaChileChinaColombiaCongoCosta RicaCroatiaCubaCzechoslovakiaDominicaDominican RepublicEastern AfricaEastern AsiaEastern EuropeEcuadorEgyptEl SalvadorEnglandEritreaEthiopiaEuropeFranceGermanyGhanaGreeceGuatemalaHaitiHondurasHong KongHungaryIndiaIndonesiaIranIraqIrelandIsraelItalyJamaicaJapanJordanKazakhstanKenyaKoreaKuwaitLaosLatin AmericaLatviaLebanonLiberiaLithuaniaMalaysiaMexicoMiddle AfricaMoroccoNepalNetherlandsNicaraguaNigeriaNorthern AfricaNorthern EuropeOceaniaPakistanPanamaPeruPhilippinesPolandRomaniaRussiaSaudi ArabiaScotlandSenegalSerbiaSierra LeoneSingaporeSomaliaSouth AfricaSouth AmericaSouth Central AsiaSouth Eastern AsiaSouthern EuropeSpainSwedenTaiwanThailandTrinidad and TobagoTurkeyUgandaUkraineUzbekistanVenezuelaVietnamWestern AfricaWestern AsiaWestern EuropeZaire
Income
Income (Families)
Income (Households)
Poverty
Poverty (Families)
Unemployment
Employment Occupations
Employment Industries
Employer Class
Commute Time
Commute Means
School Enrollment
Education by Degree Field
Occupancy
Finances
Physical Characteristics
Milwaukee
Compare Zip Codes
Comparison Subject

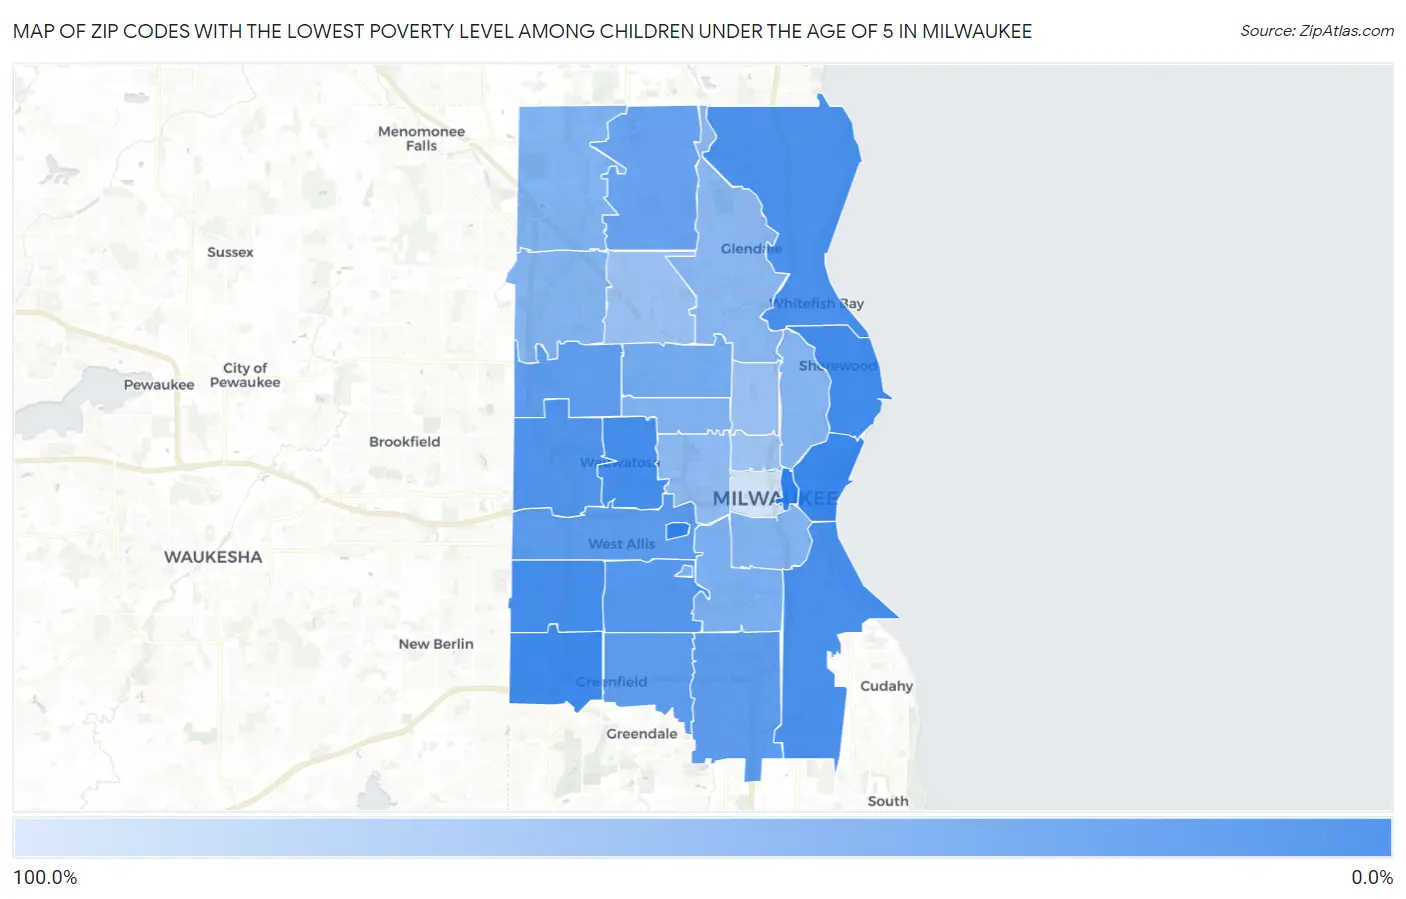
Map of Zip Codes with the Lowest Poverty Level Among Children Under the Age of 5 in Milwaukee

100.0%
0.0%
Zip Codes with the Lowest Poverty Level Among Children Under the Age of 5 in Milwaukee Map

Zip Codes with the Lowest Poverty Level Among Children Under the Age of 5 in Milwaukee, WI

Zip Code Child Poverty vs State vs National
1.532020.87%14.9%(-14.0)#818.1%(-17.2)#213
2.532282.0%14.9%(-12.9)#3218.1%(-16.0)#844
3.532113.9%14.9%(-11.0)#7818.1%(-14.2)#2,095
4.532134.8%14.9%(-10.1)#9818.1%(-13.3)#2,755
5.532275.4%14.9%(-9.51)#11318.1%(-12.7)#3,139
6.532077.1%14.9%(-7.74)#16018.1%(-10.9)#4,357
7.532177.8%14.9%(-7.08)#17618.1%(-10.3)#4,799
8.5322610.7%14.9%(-4.19)#25218.1%(-7.37)#6,670
9.5321913.1%14.9%(-1.78)#30918.1%(-4.96)#8,101
10.5321415.9%14.9%(+1.01)#35518.1%(-2.17)#9,700
11.5322116.9%14.9%(+1.98)#37418.1%(-1.20)#10,190
12.5322217.1%14.9%(+2.22)#38118.1%(-0.957)#10,293
13.5322017.8%14.9%(+2.92)#39418.1%(-0.258)#10,614
14.5322323.0%14.9%(+8.09)#45118.1%(+4.91)#12,894
15.5321629.9%14.9%(+15.0)#50318.1%(+11.8)#15,294
16.5321534.0%14.9%(+19.1)#52518.1%(+15.9)#16,369
17.5321036.5%14.9%(+21.7)#53518.1%(+18.5)#16,976
18.5322437.5%14.9%(+22.6)#53918.1%(+19.4)#17,168
19.5320437.5%14.9%(+22.7)#54018.1%(+19.5)#17,190
20.5322537.8%14.9%(+22.9)#54118.1%(+19.7)#17,224
21.5321239.9%14.9%(+25.0)#54918.1%(+21.8)#17,620
22.5320943.0%14.9%(+28.2)#56218.1%(+25.0)#18,197
23.5320845.9%14.9%(+31.0)#56618.1%(+27.8)#18,605
24.5321853.0%14.9%(+38.1)#57518.1%(+34.9)#19,424
25.5320653.7%14.9%(+38.8)#57718.1%(+35.6)#19,500
26.5320556.1%14.9%(+41.2)#57818.1%(+38.0)#19,689
27.5323396.0%14.9%(+81.1)#59218.1%(+77.9)#21,100

Common Questions

What are the Top 10 Zip Codes with the Lowest Poverty Level Among Children Under the Age of 5 in Milwaukee, WI?
Top 10 Zip Codes with the Lowest Poverty Level Among Children Under the Age of 5 in Milwaukee, WI are:
#1
0.0%
#2
0.0%
#3
0.87%
#4
2.0%
#5
3.9%
#6
4.8%
#7
5.4%
#8
7.1%
#9
7.8%
#10
10.7%
What zip code has the Lowest Poverty Level Among Children Under the Age of 5 in Milwaukee, WI?
53202 has the Lowest Poverty Level Among Children Under the Age of 5 in Milwaukee, WI with 0.87%.
What is the Poverty Level Among Children Under the Age of 5 in Milwaukee, WI?
Poverty Level Among Children Under the Age of 5 in Milwaukee is 35.2%.
What is the Poverty Level Among Children Under the Age of 5 in Wisconsin?
Poverty Level Among Children Under the Age of 5 in Wisconsin is 14.9%.
What is the Poverty Level Among Children Under the Age of 5 in the United States?
Poverty Level Among Children Under the Age of 5 in the United States is 18.1%.