Zip Codes with the Highest Percentage of Population Employed in Life, Physical & Social Science in Barton, VT
RELATED REPORTS & OPTIONS
Life, Physical & Social Science
Barton
Compare Zip Codes
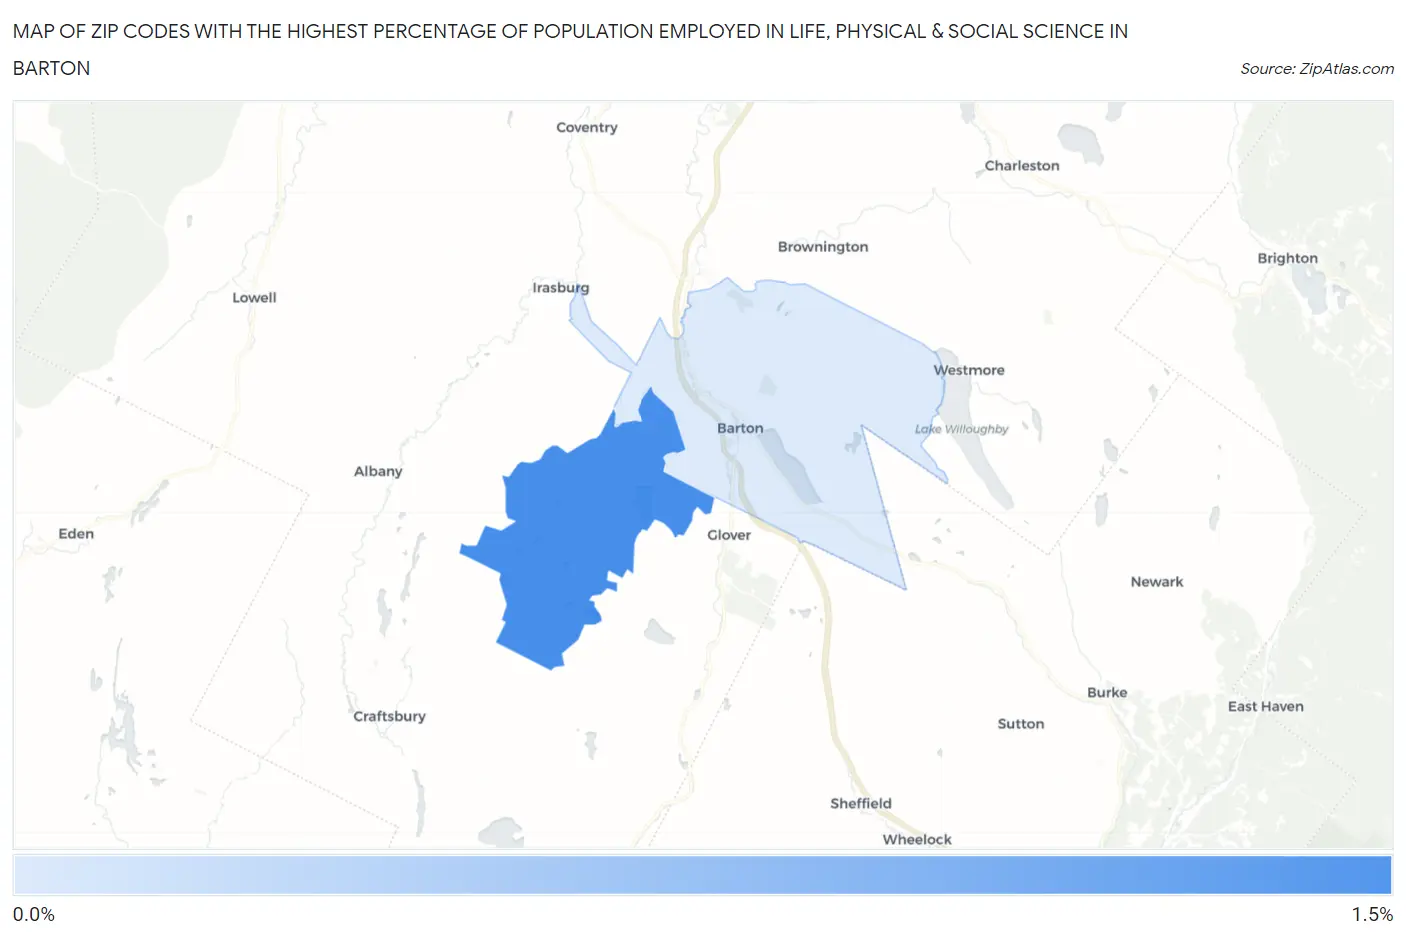
Map of Zip Codes with the Highest Percentage of Population Employed in Life, Physical & Social Science in Barton
0.11%
1.4%
Zip Codes with the Highest Percentage of Population Employed in Life, Physical & Social Science in Barton, VT
| Zip Code | % Employed | vs State | vs National | |
| 1. | 05875 | 1.4% | 1.2%(+0.215)#75 | 1.1%(+0.318)#6,146 |
| 2. | 05822 | 0.11% | 1.2%(-1.08)#162 | 1.1%(-0.979)#18,998 |
1
Common Questions
What are the Top Zip Codes with the Highest Percentage of Population Employed in Life, Physical & Social Science in Barton, VT?
Top Zip Codes with the Highest Percentage of Population Employed in Life, Physical & Social Science in Barton, VT are:
What zip code has the Highest Percentage of Population Employed in Life, Physical & Social Science in Barton, VT?
05875 has the Highest Percentage of Population Employed in Life, Physical & Social Science in Barton, VT with 1.4%.
What is the Percentage of Population Employed in Life, Physical & Social Science in Vermont?
Percentage of Population Employed in Life, Physical & Social Science in Vermont is 1.2%.
What is the Percentage of Population Employed in Life, Physical & Social Science in the United States?
Percentage of Population Employed in Life, Physical & Social Science in the United States is 1.1%.