Immigrants from Cambodia vs Immigrants from Western Africa 1 or more Vehicles in Household
COMPARE
Immigrants from Cambodia
Immigrants from Western Africa
1 or more Vehicles in Household
1 or more Vehicles in Household Comparison
Immigrants from Cambodia
Immigrants from Western Africa
89.8%
1 OR MORE VEHICLES IN HOUSEHOLD
60.1/ 100
METRIC RATING
168th/ 347
METRIC RANK
84.9%
1 OR MORE VEHICLES IN HOUSEHOLD
0.0/ 100
METRIC RATING
306th/ 347
METRIC RANK
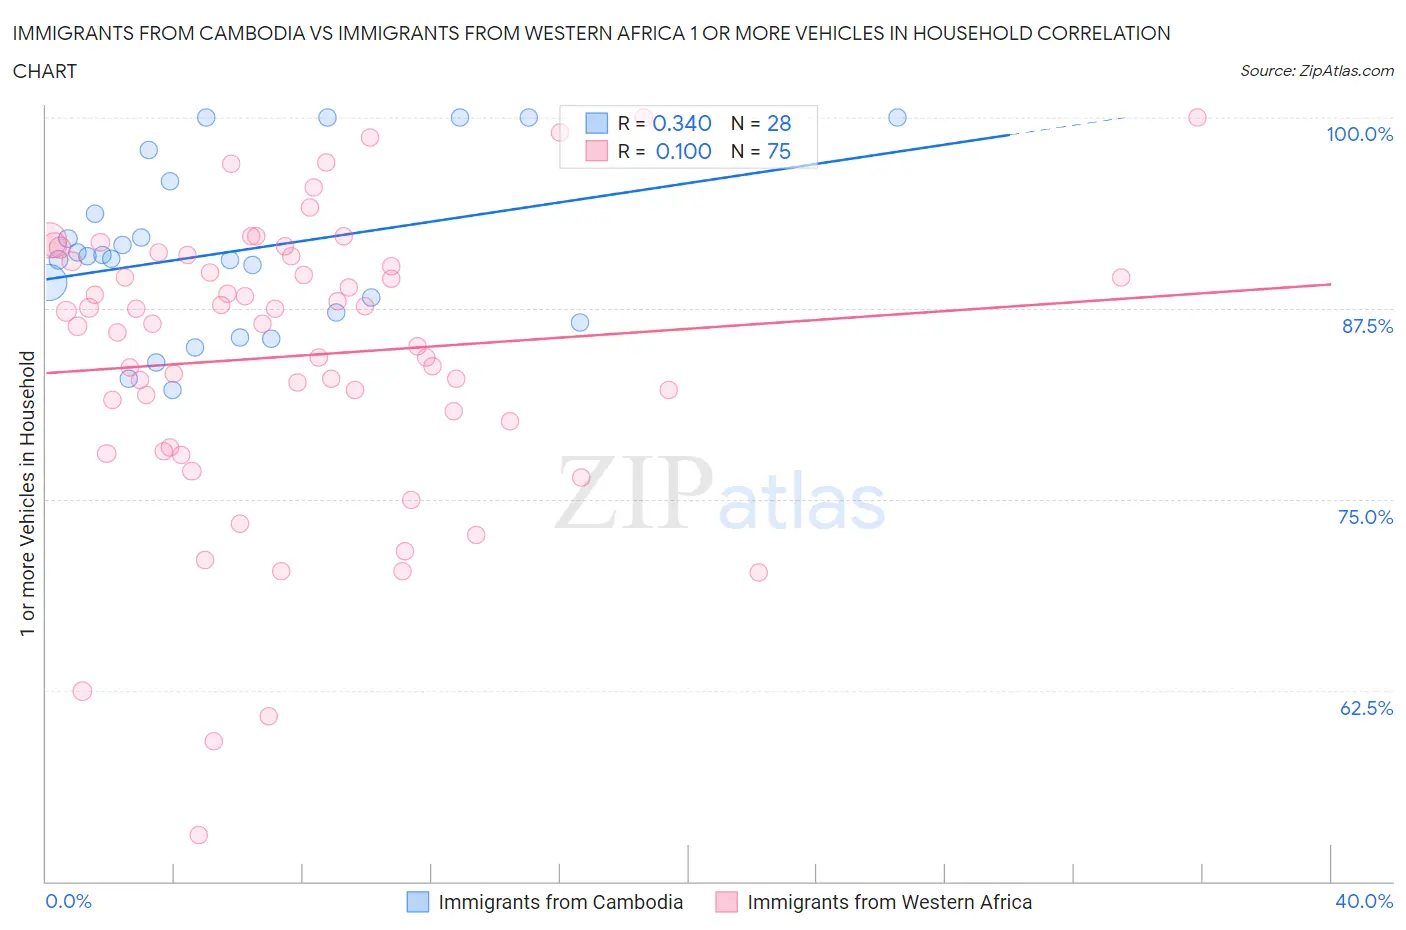
Immigrants from Cambodia vs Immigrants from Western Africa 1 or more Vehicles in Household Correlation Chart
The statistical analysis conducted on geographies consisting of 205,137,699 people shows a mild positive correlation between the proportion of Immigrants from Cambodia and percentage of households with 1 or more vehicles available in the United States with a correlation coefficient (R) of 0.340 and weighted average of 89.8%. Similarly, the statistical analysis conducted on geographies consisting of 357,592,771 people shows a poor positive correlation between the proportion of Immigrants from Western Africa and percentage of households with 1 or more vehicles available in the United States with a correlation coefficient (R) of 0.100 and weighted average of 84.9%, a difference of 5.8%.
1 or more Vehicles in Household Correlation Summary
| Measurement | Immigrants from Cambodia | Immigrants from Western Africa |
| Minimum | 82.2% | 53.0% |
| Maximum | 100.0% | 100.0% |
| Range | 17.8% | 47.0% |
| Mean | 91.3% | 84.4% |
| Median | 90.8% | 86.5% |
| Interquartile 25% (IQ1) | 86.9% | 80.2% |
| Interquartile 75% (IQ3) | 94.8% | 90.9% |
| Interquartile Range (IQR) | 7.8% | 10.8% |
| Standard Deviation (Sample) | 5.5% | 9.5% |
| Standard Deviation (Population) | 5.4% | 9.4% |
Similar Demographics by 1 or more Vehicles in Household
Demographics Similar to Immigrants from Cambodia by 1 or more Vehicles in Household
In terms of 1 or more vehicles in household, the demographic groups most similar to Immigrants from Cambodia are Immigrants from Latin America (89.8%, a difference of 0.0%), Native/Alaskan (89.8%, a difference of 0.010%), Immigrants from Saudi Arabia (89.9%, a difference of 0.040%), Immigrants from Middle Africa (89.9%, a difference of 0.040%), and Immigrants from Costa Rica (89.8%, a difference of 0.040%).
| Demographics | Rating | Rank | 1 or more Vehicles in Household |
| Salvadorans | 68.7 /100 | #161 | Good 90.0% |
| Spanish American Indians | 67.0 /100 | #162 | Good 89.9% |
| Immigrants | Austria | 65.5 /100 | #163 | Good 89.9% |
| Comanche | 63.4 /100 | #164 | Good 89.9% |
| Immigrants | Saudi Arabia | 62.6 /100 | #165 | Good 89.9% |
| Immigrants | Middle Africa | 62.2 /100 | #166 | Good 89.9% |
| Immigrants | Latin America | 60.3 /100 | #167 | Good 89.8% |
| Immigrants | Cambodia | 60.1 /100 | #168 | Good 89.8% |
| Natives/Alaskans | 59.5 /100 | #169 | Average 89.8% |
| Immigrants | Costa Rica | 57.6 /100 | #170 | Average 89.8% |
| French American Indians | 54.4 /100 | #171 | Average 89.8% |
| Indonesians | 53.0 /100 | #172 | Average 89.7% |
| Lumbee | 52.8 /100 | #173 | Average 89.7% |
| Filipinos | 50.0 /100 | #174 | Average 89.7% |
| Immigrants | Burma/Myanmar | 47.6 /100 | #175 | Average 89.7% |
Demographics Similar to Immigrants from Western Africa by 1 or more Vehicles in Household
In terms of 1 or more vehicles in household, the demographic groups most similar to Immigrants from Western Africa are Immigrants from China (84.9%, a difference of 0.020%), Tohono O'odham (84.7%, a difference of 0.26%), Immigrants from Belize (84.7%, a difference of 0.29%), Immigrants from Haiti (84.7%, a difference of 0.30%), and U.S. Virgin Islander (84.6%, a difference of 0.33%).
| Demographics | Rating | Rank | 1 or more Vehicles in Household |
| Yuman | 0.0 /100 | #299 | Tragic 85.5% |
| Immigrants | Russia | 0.0 /100 | #300 | Tragic 85.4% |
| Immigrants | Panama | 0.0 /100 | #301 | Tragic 85.4% |
| Moroccans | 0.0 /100 | #302 | Tragic 85.4% |
| Immigrants | Greece | 0.0 /100 | #303 | Tragic 85.4% |
| Immigrants | Ukraine | 0.0 /100 | #304 | Tragic 85.2% |
| Immigrants | China | 0.0 /100 | #305 | Tragic 84.9% |
| Immigrants | Western Africa | 0.0 /100 | #306 | Tragic 84.9% |
| Tohono O'odham | 0.0 /100 | #307 | Tragic 84.7% |
| Immigrants | Belize | 0.0 /100 | #308 | Tragic 84.7% |
| Immigrants | Haiti | 0.0 /100 | #309 | Tragic 84.7% |
| U.S. Virgin Islanders | 0.0 /100 | #310 | Tragic 84.6% |
| Puerto Ricans | 0.0 /100 | #311 | Tragic 84.6% |
| Cape Verdeans | 0.0 /100 | #312 | Tragic 84.5% |
| Immigrants | Israel | 0.0 /100 | #313 | Tragic 84.5% |