Apache vs Subsaharan African 1 or more Vehicles in Household
COMPARE
Apache
Subsaharan African
1 or more Vehicles in Household
1 or more Vehicles in Household Comparison
Apache
Sub-Saharan Africans
89.1%
1 OR MORE VEHICLES IN HOUSEHOLD
16.2/ 100
METRIC RATING
206th/ 347
METRIC RANK
87.9%
1 OR MORE VEHICLES IN HOUSEHOLD
0.5/ 100
METRIC RATING
262nd/ 347
METRIC RANK
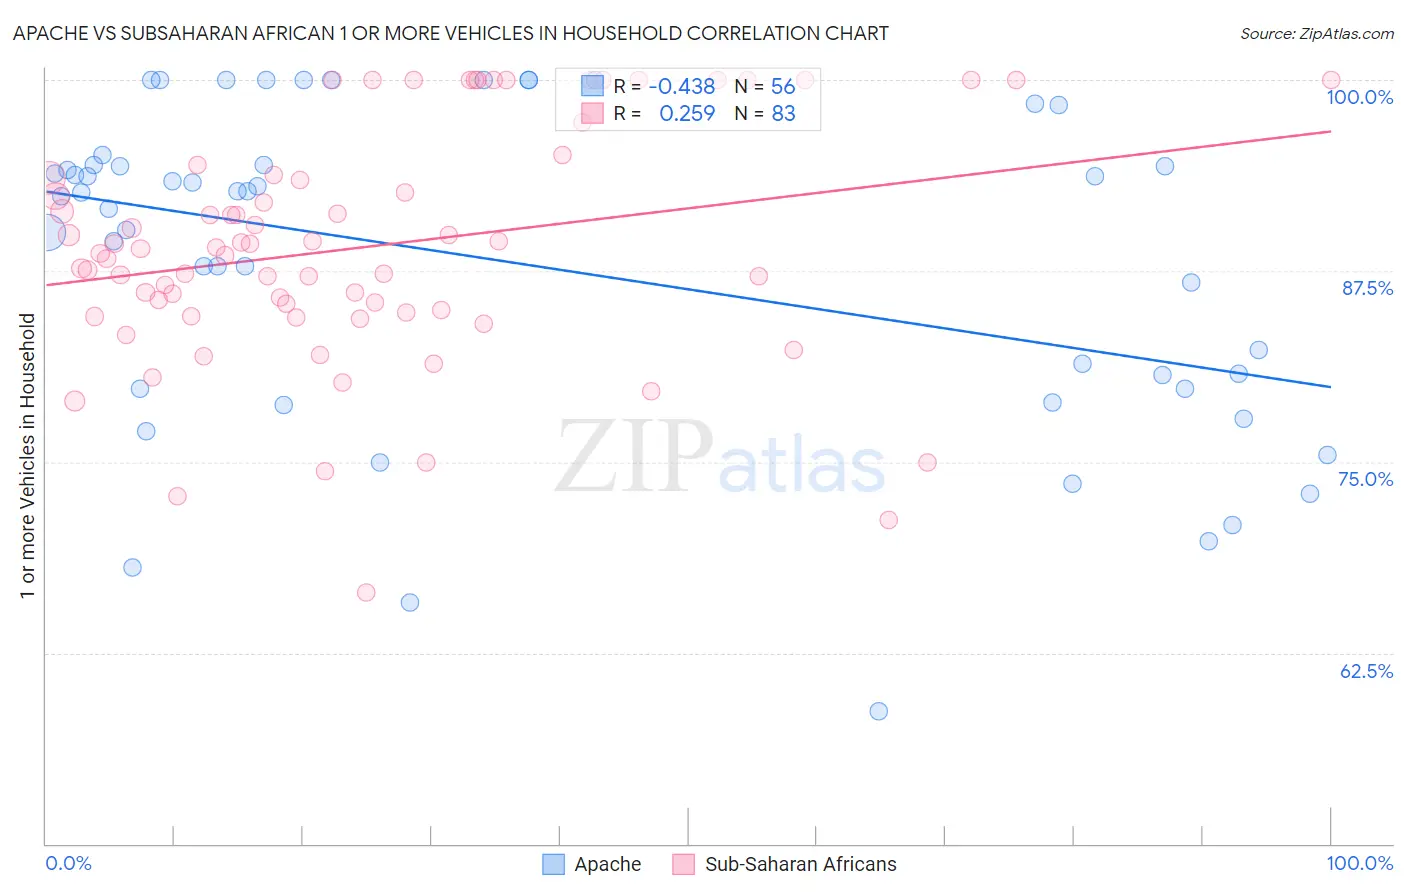
Apache vs Subsaharan African 1 or more Vehicles in Household Correlation Chart
The statistical analysis conducted on geographies consisting of 231,048,129 people shows a moderate negative correlation between the proportion of Apache and percentage of households with 1 or more vehicles available in the United States with a correlation coefficient (R) of -0.438 and weighted average of 89.1%. Similarly, the statistical analysis conducted on geographies consisting of 507,682,612 people shows a weak positive correlation between the proportion of Sub-Saharan Africans and percentage of households with 1 or more vehicles available in the United States with a correlation coefficient (R) of 0.259 and weighted average of 87.9%, a difference of 1.4%.
1 or more Vehicles in Household Correlation Summary
| Measurement | Apache | Subsaharan African |
| Minimum | 58.7% | 66.4% |
| Maximum | 100.0% | 100.0% |
| Range | 41.3% | 33.6% |
| Mean | 88.0% | 89.1% |
| Median | 92.5% | 89.0% |
| Interquartile 25% (IQ1) | 79.8% | 84.8% |
| Interquartile 75% (IQ3) | 94.4% | 93.8% |
| Interquartile Range (IQR) | 14.6% | 9.0% |
| Standard Deviation (Sample) | 10.5% | 7.7% |
| Standard Deviation (Population) | 10.4% | 7.6% |
Similar Demographics by 1 or more Vehicles in Household
Demographics Similar to Apache by 1 or more Vehicles in Household
In terms of 1 or more vehicles in household, the demographic groups most similar to Apache are Immigrants from Denmark (89.1%, a difference of 0.040%), Guatemalan (89.2%, a difference of 0.050%), Immigrants from Chile (89.1%, a difference of 0.050%), Romanian (89.2%, a difference of 0.060%), and Immigrants from Italy (89.1%, a difference of 0.070%).
| Demographics | Rating | Rank | 1 or more Vehicles in Household |
| Immigrants | Asia | 22.8 /100 | #199 | Fair 89.3% |
| Central Americans | 21.4 /100 | #200 | Fair 89.2% |
| Immigrants | Western Europe | 20.5 /100 | #201 | Fair 89.2% |
| Iroquois | 19.8 /100 | #202 | Poor 89.2% |
| Cambodians | 18.9 /100 | #203 | Poor 89.2% |
| Romanians | 18.2 /100 | #204 | Poor 89.2% |
| Guatemalans | 17.8 /100 | #205 | Poor 89.2% |
| Apache | 16.2 /100 | #206 | Poor 89.1% |
| Immigrants | Denmark | 14.8 /100 | #207 | Poor 89.1% |
| Immigrants | Chile | 14.4 /100 | #208 | Poor 89.1% |
| Immigrants | Italy | 14.0 /100 | #209 | Poor 89.1% |
| Dutch West Indians | 13.5 /100 | #210 | Poor 89.0% |
| Sierra Leoneans | 13.0 /100 | #211 | Poor 89.0% |
| Somalis | 12.8 /100 | #212 | Poor 89.0% |
| Immigrants | Western Asia | 12.3 /100 | #213 | Poor 89.0% |
Demographics Similar to Sub-Saharan Africans by 1 or more Vehicles in Household
In terms of 1 or more vehicles in household, the demographic groups most similar to Sub-Saharan Africans are Immigrants from Switzerland (87.9%, a difference of 0.030%), Macedonian (87.9%, a difference of 0.070%), Immigrants from Egypt (87.8%, a difference of 0.070%), Immigrants from Liberia (87.8%, a difference of 0.080%), and African (87.8%, a difference of 0.11%).
| Demographics | Rating | Rank | 1 or more Vehicles in Household |
| Immigrants | Latvia | 0.9 /100 | #255 | Tragic 88.1% |
| Colombians | 0.9 /100 | #256 | Tragic 88.0% |
| Liberians | 0.9 /100 | #257 | Tragic 88.0% |
| South American Indians | 0.9 /100 | #258 | Tragic 88.0% |
| Nigerians | 0.8 /100 | #259 | Tragic 88.0% |
| Macedonians | 0.6 /100 | #260 | Tragic 87.9% |
| Immigrants | Switzerland | 0.6 /100 | #261 | Tragic 87.9% |
| Sub-Saharan Africans | 0.5 /100 | #262 | Tragic 87.9% |
| Immigrants | Egypt | 0.5 /100 | #263 | Tragic 87.8% |
| Immigrants | Liberia | 0.4 /100 | #264 | Tragic 87.8% |
| Africans | 0.4 /100 | #265 | Tragic 87.8% |
| Israelis | 0.3 /100 | #266 | Tragic 87.7% |
| Immigrants | Colombia | 0.3 /100 | #267 | Tragic 87.6% |
| Immigrants | Europe | 0.2 /100 | #268 | Tragic 87.6% |
| Immigrants | Africa | 0.2 /100 | #269 | Tragic 87.6% |