Apache vs Turkish 1 or more Vehicles in Household
COMPARE
Apache
Turkish
1 or more Vehicles in Household
1 or more Vehicles in Household Comparison
Apache
Turks
89.1%
1 OR MORE VEHICLES IN HOUSEHOLD
16.2/ 100
METRIC RATING
206th/ 347
METRIC RANK
88.4%
1 OR MORE VEHICLES IN HOUSEHOLD
2.5/ 100
METRIC RATING
242nd/ 347
METRIC RANK
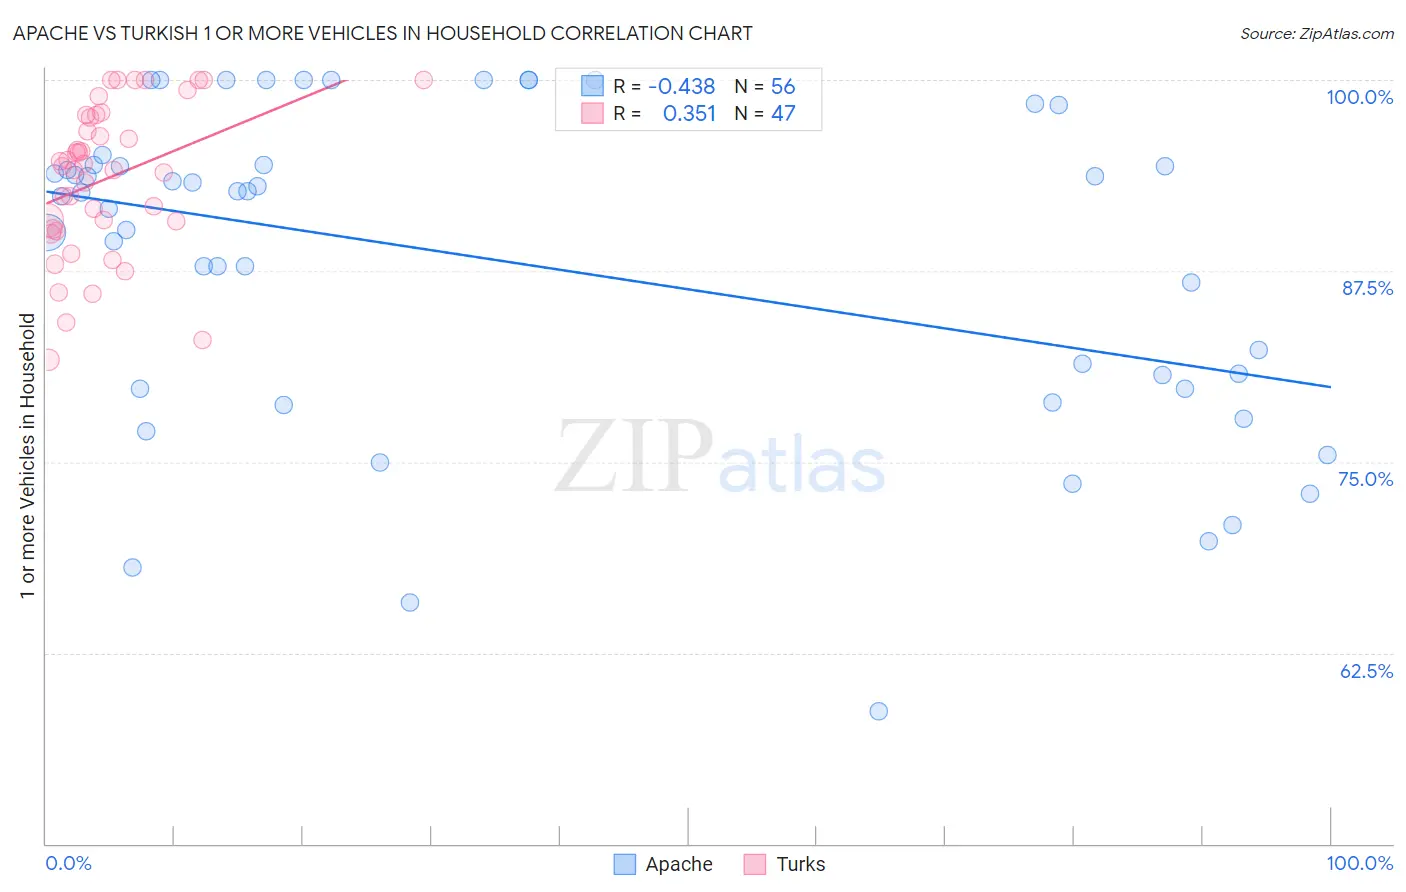
Apache vs Turkish 1 or more Vehicles in Household Correlation Chart
The statistical analysis conducted on geographies consisting of 231,048,129 people shows a moderate negative correlation between the proportion of Apache and percentage of households with 1 or more vehicles available in the United States with a correlation coefficient (R) of -0.438 and weighted average of 89.1%. Similarly, the statistical analysis conducted on geographies consisting of 271,719,396 people shows a mild positive correlation between the proportion of Turks and percentage of households with 1 or more vehicles available in the United States with a correlation coefficient (R) of 0.351 and weighted average of 88.4%, a difference of 0.80%.
1 or more Vehicles in Household Correlation Summary
| Measurement | Apache | Turkish |
| Minimum | 58.7% | 81.7% |
| Maximum | 100.0% | 100.0% |
| Range | 41.3% | 18.3% |
| Mean | 88.0% | 93.6% |
| Median | 92.5% | 94.4% |
| Interquartile 25% (IQ1) | 79.8% | 90.3% |
| Interquartile 75% (IQ3) | 94.4% | 97.7% |
| Interquartile Range (IQR) | 14.6% | 7.4% |
| Standard Deviation (Sample) | 10.5% | 4.9% |
| Standard Deviation (Population) | 10.4% | 4.9% |
Similar Demographics by 1 or more Vehicles in Household
Demographics Similar to Apache by 1 or more Vehicles in Household
In terms of 1 or more vehicles in household, the demographic groups most similar to Apache are Immigrants from Denmark (89.1%, a difference of 0.040%), Guatemalan (89.2%, a difference of 0.050%), Immigrants from Chile (89.1%, a difference of 0.050%), Romanian (89.2%, a difference of 0.060%), and Immigrants from Italy (89.1%, a difference of 0.070%).
| Demographics | Rating | Rank | 1 or more Vehicles in Household |
| Immigrants | Asia | 22.8 /100 | #199 | Fair 89.3% |
| Central Americans | 21.4 /100 | #200 | Fair 89.2% |
| Immigrants | Western Europe | 20.5 /100 | #201 | Fair 89.2% |
| Iroquois | 19.8 /100 | #202 | Poor 89.2% |
| Cambodians | 18.9 /100 | #203 | Poor 89.2% |
| Romanians | 18.2 /100 | #204 | Poor 89.2% |
| Guatemalans | 17.8 /100 | #205 | Poor 89.2% |
| Apache | 16.2 /100 | #206 | Poor 89.1% |
| Immigrants | Denmark | 14.8 /100 | #207 | Poor 89.1% |
| Immigrants | Chile | 14.4 /100 | #208 | Poor 89.1% |
| Immigrants | Italy | 14.0 /100 | #209 | Poor 89.1% |
| Dutch West Indians | 13.5 /100 | #210 | Poor 89.0% |
| Sierra Leoneans | 13.0 /100 | #211 | Poor 89.0% |
| Somalis | 12.8 /100 | #212 | Poor 89.0% |
| Immigrants | Western Asia | 12.3 /100 | #213 | Poor 89.0% |
Demographics Similar to Turks by 1 or more Vehicles in Household
In terms of 1 or more vehicles in household, the demographic groups most similar to Turks are Taiwanese (88.4%, a difference of 0.020%), Immigrants from Belgium (88.4%, a difference of 0.060%), Eastern European (88.5%, a difference of 0.070%), Immigrants from Portugal (88.3%, a difference of 0.080%), and Immigrants from Czechoslovakia (88.3%, a difference of 0.10%).
| Demographics | Rating | Rank | 1 or more Vehicles in Household |
| Paiute | 4.6 /100 | #235 | Tragic 88.6% |
| Immigrants | Pakistan | 4.5 /100 | #236 | Tragic 88.6% |
| Immigrants | Turkey | 4.4 /100 | #237 | Tragic 88.6% |
| Immigrants | Somalia | 4.2 /100 | #238 | Tragic 88.6% |
| Kiowa | 3.8 /100 | #239 | Tragic 88.6% |
| Eastern Europeans | 3.0 /100 | #240 | Tragic 88.5% |
| Taiwanese | 2.6 /100 | #241 | Tragic 88.4% |
| Turks | 2.5 /100 | #242 | Tragic 88.4% |
| Immigrants | Belgium | 2.1 /100 | #243 | Tragic 88.4% |
| Immigrants | Portugal | 2.0 /100 | #244 | Tragic 88.3% |
| Immigrants | Czechoslovakia | 1.9 /100 | #245 | Tragic 88.3% |
| Menominee | 1.9 /100 | #246 | Tragic 88.3% |
| Immigrants | Honduras | 1.7 /100 | #247 | Tragic 88.3% |
| Immigrants | Nigeria | 1.5 /100 | #248 | Tragic 88.2% |
| Blacks/African Americans | 1.4 /100 | #249 | Tragic 88.2% |