Zip Codes with the Highest Percentage of Population with a Degree in Liberal Arts and History in Millington, TN
RELATED REPORTS & OPTIONS
Liberal Arts and History
Millington
Compare Zip Codes
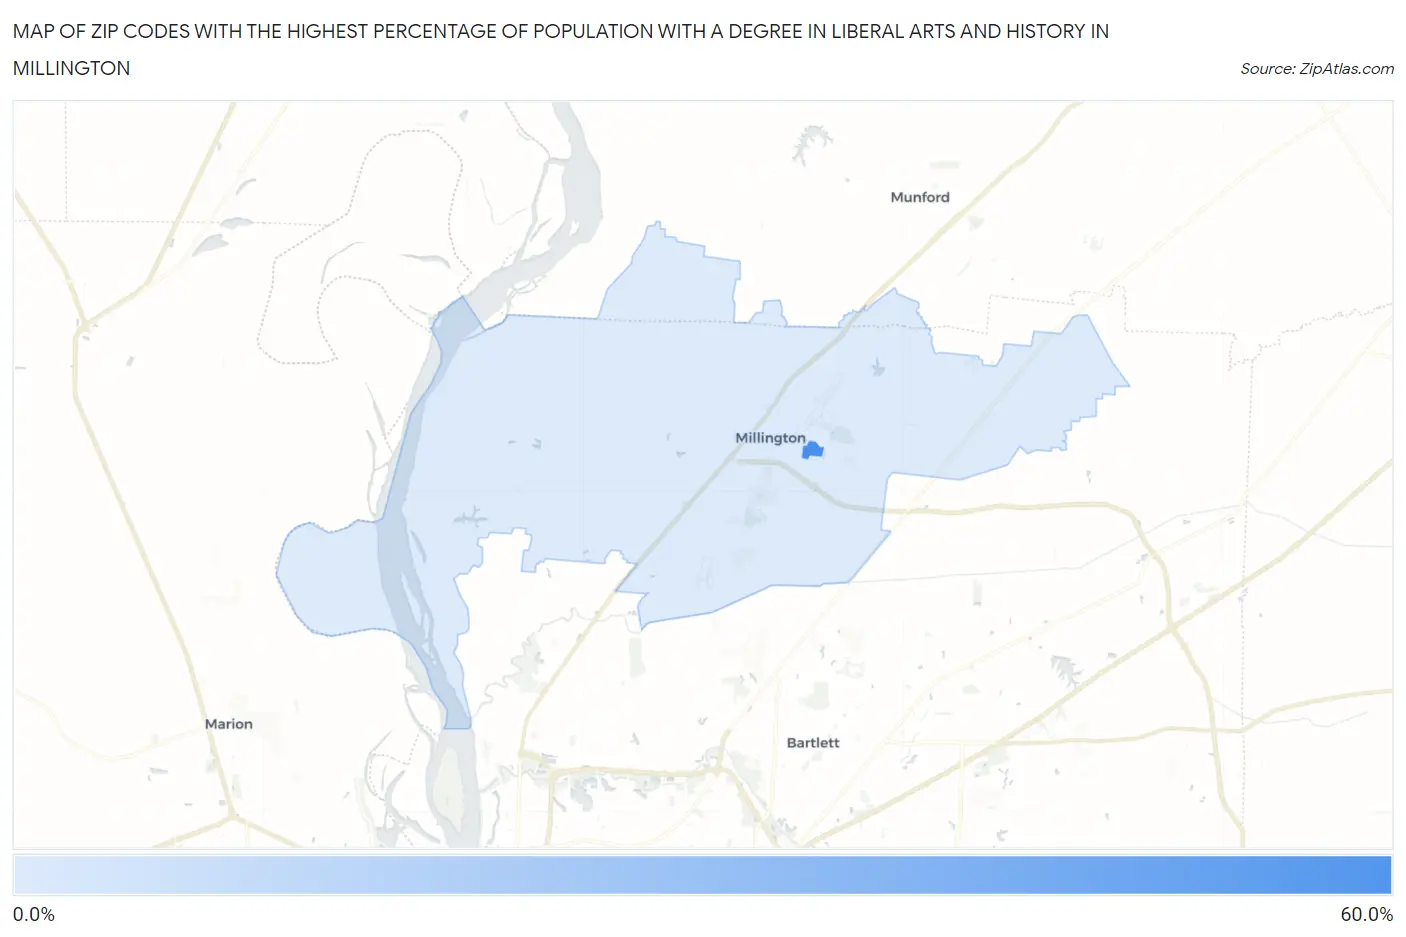
Map of Zip Codes with the Highest Percentage of Population with a Degree in Liberal Arts and History in Millington
3.0%
58.3%
Zip Codes with the Highest Percentage of Population with a Degree in Liberal Arts and History in Millington, TN
| Zip Code | % Graduates | vs State | vs National | |
| 1. | 38054 | 58.3% | 4.9%(+53.5)#2 | 4.9%(+53.5)#110 |
| 2. | 38053 | 3.0% | 4.9%(-1.86)#360 | 4.9%(-1.85)#18,287 |
1
Common Questions
What are the Top Zip Codes with the Highest Percentage of Population with a Degree in Liberal Arts and History in Millington, TN?
Top Zip Codes with the Highest Percentage of Population with a Degree in Liberal Arts and History in Millington, TN are:
What zip code has the Highest Percentage of Population with a Degree in Liberal Arts and History in Millington, TN?
38054 has the Highest Percentage of Population with a Degree in Liberal Arts and History in Millington, TN with 58.3%.
What is the Percentage of Population with a Degree in Liberal Arts and History in Millington, TN?
Percentage of Population with a Degree in Liberal Arts and History in Millington is 3.0%.
What is the Percentage of Population with a Degree in Liberal Arts and History in Tennessee?
Percentage of Population with a Degree in Liberal Arts and History in Tennessee is 4.9%.
What is the Percentage of Population with a Degree in Liberal Arts and History in the United States?
Percentage of Population with a Degree in Liberal Arts and History in the United States is 4.9%.