Zip Codes with the Highest Percentage of Population Employed in Legal Services & Support in Beaufort, SC
RELATED REPORTS & OPTIONS
Legal Services & Support
Beaufort
Compare Zip Codes
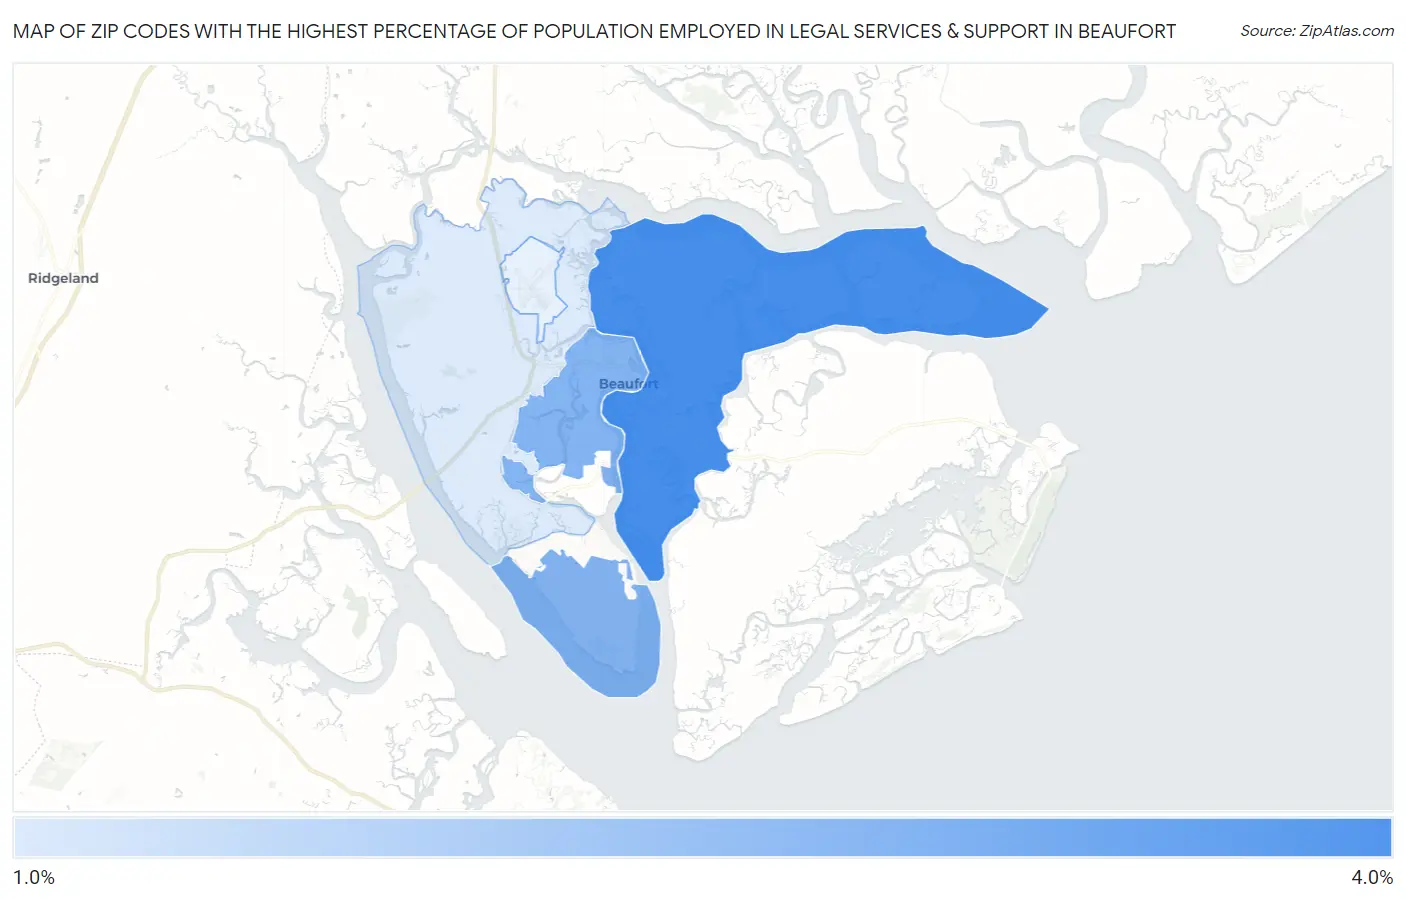
Map of Zip Codes with the Highest Percentage of Population Employed in Legal Services & Support in Beaufort
1.0%
3.0%
Zip Codes with the Highest Percentage of Population Employed in Legal Services & Support in Beaufort, SC
| Zip Code | % Employed | vs State | vs National | |
| 1. | 29907 | 3.0% | 0.97%(+2.04)#15 | 1.2%(+1.83)#1,827 |
| 2. | 29902 | 2.2% | 0.97%(+1.25)#28 | 1.2%(+1.04)#2,984 |
| 3. | 29906 | 1.0% | 0.97%(+0.039)#90 | 1.2%(-0.170)#7,728 |
1
Common Questions
What are the Top 3 Zip Codes with the Highest Percentage of Population Employed in Legal Services & Support in Beaufort, SC?
Top 3 Zip Codes with the Highest Percentage of Population Employed in Legal Services & Support in Beaufort, SC are:
What zip code has the Highest Percentage of Population Employed in Legal Services & Support in Beaufort, SC?
29907 has the Highest Percentage of Population Employed in Legal Services & Support in Beaufort, SC with 3.0%.
What is the Percentage of Population Employed in Legal Services & Support in Beaufort, SC?
Percentage of Population Employed in Legal Services & Support in Beaufort is 2.7%.
What is the Percentage of Population Employed in Legal Services & Support in South Carolina?
Percentage of Population Employed in Legal Services & Support in South Carolina is 0.97%.
What is the Percentage of Population Employed in Legal Services & Support in the United States?
Percentage of Population Employed in Legal Services & Support in the United States is 1.2%.