Romanian vs Chinese Receiving Food Stamps
COMPARE
Romanian
Chinese
Receiving Food Stamps
Receiving Food Stamps Comparison
Romanians
Chinese
10.4%
RECEIVING FOOD STAMPS
95.8/ 100
METRIC RATING
111th/ 347
METRIC RANK
9.8%
RECEIVING FOOD STAMPS
99.2/ 100
METRIC RATING
63rd/ 347
METRIC RANK
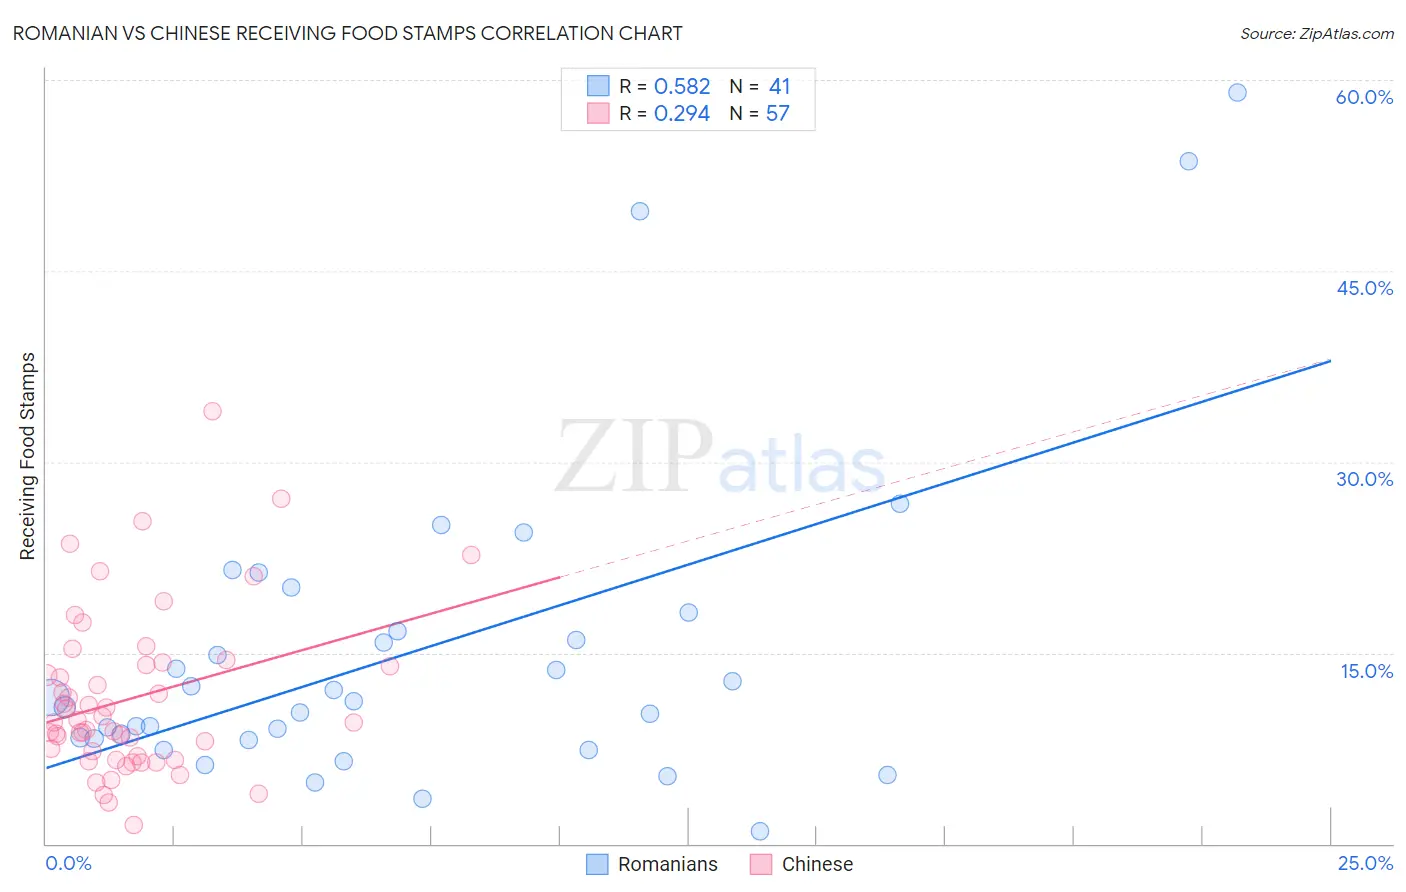
Romanian vs Chinese Receiving Food Stamps Correlation Chart
The statistical analysis conducted on geographies consisting of 376,766,958 people shows a substantial positive correlation between the proportion of Romanians and percentage of population receiving government assistance and/or food stamps in the United States with a correlation coefficient (R) of 0.582 and weighted average of 10.4%. Similarly, the statistical analysis conducted on geographies consisting of 64,766,872 people shows a weak positive correlation between the proportion of Chinese and percentage of population receiving government assistance and/or food stamps in the United States with a correlation coefficient (R) of 0.294 and weighted average of 9.8%, a difference of 7.0%.
Receiving Food Stamps Correlation Summary
| Measurement | Romanian | Chinese |
| Minimum | 1.0% | 1.5% |
| Maximum | 59.0% | 34.0% |
| Range | 58.0% | 32.5% |
| Mean | 15.1% | 11.5% |
| Median | 11.1% | 9.5% |
| Interquartile 25% (IQ1) | 8.2% | 6.8% |
| Interquartile 75% (IQ3) | 17.4% | 14.1% |
| Interquartile Range (IQR) | 9.2% | 7.3% |
| Standard Deviation (Sample) | 12.6% | 6.5% |
| Standard Deviation (Population) | 12.5% | 6.4% |
Similar Demographics by Receiving Food Stamps
Demographics Similar to Romanians by Receiving Food Stamps
In terms of receiving food stamps, the demographic groups most similar to Romanians are Mongolian (10.5%, a difference of 0.010%), Pakistani (10.4%, a difference of 0.10%), Immigrants from Pakistan (10.4%, a difference of 0.38%), Icelander (10.5%, a difference of 0.39%), and Carpatho Rusyn (10.4%, a difference of 0.43%).
| Demographics | Rating | Rank | Receiving Food Stamps |
| Immigrants | Hungary | 96.7 /100 | #104 | Exceptional 10.3% |
| Immigrants | Malaysia | 96.5 /100 | #105 | Exceptional 10.4% |
| Immigrants | Italy | 96.4 /100 | #106 | Exceptional 10.4% |
| Koreans | 96.3 /100 | #107 | Exceptional 10.4% |
| Carpatho Rusyns | 96.2 /100 | #108 | Exceptional 10.4% |
| Immigrants | Pakistan | 96.2 /100 | #109 | Exceptional 10.4% |
| Pakistanis | 95.9 /100 | #110 | Exceptional 10.4% |
| Romanians | 95.8 /100 | #111 | Exceptional 10.4% |
| Mongolians | 95.8 /100 | #112 | Exceptional 10.5% |
| Icelanders | 95.4 /100 | #113 | Exceptional 10.5% |
| Scotch-Irish | 95.1 /100 | #114 | Exceptional 10.5% |
| Immigrants | Saudi Arabia | 94.9 /100 | #115 | Exceptional 10.5% |
| Canadians | 94.8 /100 | #116 | Exceptional 10.5% |
| Immigrants | Nepal | 94.6 /100 | #117 | Exceptional 10.6% |
| Assyrians/Chaldeans/Syriacs | 94.1 /100 | #118 | Exceptional 10.6% |
Demographics Similar to Chinese by Receiving Food Stamps
In terms of receiving food stamps, the demographic groups most similar to Chinese are Immigrants from Bulgaria (9.8%, a difference of 0.030%), Immigrants from North America (9.8%, a difference of 0.090%), English (9.8%, a difference of 0.11%), German (9.7%, a difference of 0.25%), and Immigrants from Turkey (9.8%, a difference of 0.26%).
| Demographics | Rating | Rank | Receiving Food Stamps |
| Immigrants | Canada | 99.3 /100 | #56 | Exceptional 9.7% |
| Greeks | 99.3 /100 | #57 | Exceptional 9.7% |
| Scandinavians | 99.2 /100 | #58 | Exceptional 9.7% |
| British | 99.2 /100 | #59 | Exceptional 9.7% |
| Germans | 99.2 /100 | #60 | Exceptional 9.7% |
| English | 99.2 /100 | #61 | Exceptional 9.8% |
| Immigrants | Bulgaria | 99.2 /100 | #62 | Exceptional 9.8% |
| Chinese | 99.2 /100 | #63 | Exceptional 9.8% |
| Immigrants | North America | 99.2 /100 | #64 | Exceptional 9.8% |
| Immigrants | Turkey | 99.1 /100 | #65 | Exceptional 9.8% |
| Slovenes | 99.1 /100 | #66 | Exceptional 9.8% |
| Immigrants | Indonesia | 99.0 /100 | #67 | Exceptional 9.8% |
| Northern Europeans | 99.0 /100 | #68 | Exceptional 9.8% |
| Italians | 99.0 /100 | #69 | Exceptional 9.9% |
| Immigrants | Serbia | 99.0 /100 | #70 | Exceptional 9.9% |