Romanian vs Chilean Receiving Food Stamps

COMPARE

Romanian
Race
Ancestry
AfghanAfricanAlaska NativeAlaskan AthabascanAlbanianAleutAlsatianAmericanApacheArabArapahoArgentineanArmenianAssyrian/Chaldean/SyriacAustralianAustrianBahamianBangladeshiBarbadianBasqueBelgianBelizeanBermudanBhutaneseBlackfeetBolivianBrazilianBritishBritish West IndianBulgarianBurmeseCajunCambodianCanadianCape VerdeanCarpatho RusynCelticCentral AmericanCentral American IndianCherokeeCheyenneChickasawChineseChippewaChoctawColombianColvilleComancheCosta RicanCreeCreekCroatianCrowCubanCypriotCzechCzechoslovakianDanishDelawareDominicanDutchDutch West IndianEastern EuropeanEcuadorianEgyptianEnglishEstonianEthiopianEuropeanFijianFilipinoFinnishFrenchFrench American IndianFrench CanadianGermanGerman RussianGhanaianGreekGuamanian/ChamorroGuatemalanGuyaneseHaitianHmongHonduranHopiHoumaHungarianIcelanderIndian (Asian)IndonesianInupiatIranianIraqiIrishIroquoisIsraeliItalianJamaicanJapaneseJordanianKenyanKiowaKoreanLaotianLatvianLebaneseLiberianLithuanianLumbeeLuxembourgerMacedonianMalaysianMalteseMarshalleseMenomineeMexicanMexican American IndianMongolianMoroccanNative HawaiianNavajoNepaleseNew ZealanderNicaraguanNigerianNorthern EuropeanNorwegianOkinawanOsageOttawaPaiutePakistaniPalestinianPanamanianParaguayanPennsylvania GermanPeruvianPimaPolishPortuguesePotawatomiPuebloPuerto RicanPuget Sound SalishRomanianRussianSalvadoranSamoanScandinavianScotch-IrishScottishSeminoleSenegaleseSerbianShoshoneSierra LeoneanSiouxSlavicSlovakSloveneSomaliSouth AfricanSouth AmericanSouth American IndianSoviet UnionSpaniardSpanishSpanish AmericanSpanish American IndianSri LankanSubsaharan AfricanSudaneseSwedishSwissSyrianTaiwaneseThaiTlingit-HaidaTohono O'OdhamTonganTrinidadian and TobagonianTsimshianTurkishU.S. Virgin IslanderUgandanUkrainianUruguayanUteVenezuelanVietnameseWelshWest IndianYakamaYaquiYugoslavianYumanYup'ikZimbabwean
Immigration
NonimmigrantsImmigrantsAfghanistanAfricaAlbaniaArgentinaArmeniaAsiaAustraliaAustriaBahamasBangladeshBarbadosBelarusBelgiumBelizeBoliviaBosnia and HerzegovinaBrazilBulgariaBurma/MyanmarCabo VerdeCambodiaCameroonCanadaCaribbeanCentral AmericaChileChinaColombiaCongoCosta RicaCroatiaCubaCzechoslovakiaDenmarkDominicaDominican RepublicEastern AfricaEastern AsiaEastern EuropeEcuadorEgyptEl SalvadorEnglandEritreaEthiopiaEuropeFijiFranceGermanyGhanaGreeceGrenadaGuatemalaGuyanaHaitiHondurasHong KongHungaryIndiaIndonesiaIranIraqIrelandIsraelItalyJamaicaJapanJordanKazakhstanKenyaKoreaKuwaitLaosLatin AmericaLatviaLebanonLiberiaLithuaniaMalaysiaMexicoMicronesiaMiddle AfricaMoldovaMoroccoNepalNetherlandsNicaraguaNigeriaNorth AmericaNorth MacedoniaNorthern AfricaNorthern EuropeNorwayOceaniaPakistanPanamaPeruPhilippinesPolandPortugalRomaniaRussiaSaudi ArabiaScotlandSenegalSerbiaSierra LeoneSingaporeSomaliaSouth AfricaSouth AmericaSouth Central AsiaSouth Eastern AsiaSouthern EuropeSpainSri LankaSt. Vincent and the GrenadinesSudanSwedenSwitzerlandSyriaTaiwanThailandTrinidad and TobagoTurkeyUgandaUkraineUruguayUzbekistanVenezuelaVietnamWest IndiesWestern AfricaWestern AsiaWestern EuropeYemenZaireZimbabweAzores
Chilean
Race
Ancestry
AfghanAfricanAlaska NativeAlaskan AthabascanAlbanianAleutAlsatianAmericanApacheArabArapahoArgentineanArmenianAssyrian/Chaldean/SyriacAustralianAustrianBahamianBangladeshiBarbadianBasqueBelgianBelizeanBermudanBhutaneseBlackfeetBolivianBrazilianBritishBritish West IndianBulgarianBurmeseCajunCambodianCanadianCape VerdeanCarpatho RusynCelticCentral AmericanCentral American IndianCherokeeCheyenneChickasawChileanChineseChippewaChoctawColombianColvilleComancheCosta RicanCreeCreekCroatianCrowCubanCypriotCzechCzechoslovakianDanishDelawareDominicanDutchDutch West IndianEastern EuropeanEcuadorianEgyptianEnglishEstonianEthiopianEuropeanFijianFilipinoFinnishFrenchFrench American IndianFrench CanadianGermanGerman RussianGhanaianGreekGuamanian/ChamorroGuatemalanGuyaneseHaitianHmongHonduranHopiHoumaHungarianIcelanderIndian (Asian)IndonesianInupiatIranianIraqiIrishIroquoisIsraeliItalianJamaicanJapaneseJordanianKenyanKiowaKoreanLaotianLatvianLebaneseLiberianLithuanianLumbeeLuxembourgerMacedonianMalaysianMalteseMarshalleseMenomineeMexicanMexican American IndianMongolianMoroccanNative HawaiianNavajoNepaleseNew ZealanderNicaraguanNigerianNorthern EuropeanNorwegianOkinawanOsageOttawaPaiutePakistaniPalestinianPanamanianParaguayanPennsylvania GermanPeruvianPimaPolishPortuguesePotawatomiPuebloPuerto RicanPuget Sound SalishRussianSalvadoranSamoanScandinavianScotch-IrishScottishSeminoleSenegaleseSerbianShoshoneSierra LeoneanSiouxSlavicSlovakSloveneSomaliSouth AfricanSouth AmericanSouth American IndianSoviet UnionSpaniardSpanishSpanish AmericanSpanish American IndianSri LankanSubsaharan AfricanSudaneseSwedishSwissSyrianTaiwaneseThaiTlingit-HaidaTohono O'OdhamTonganTrinidadian and TobagonianTsimshianTurkishU.S. Virgin IslanderUgandanUkrainianUruguayanUteVenezuelanVietnameseWelshWest IndianYakamaYaquiYugoslavianYumanYup'ikZimbabwean
Immigration
NonimmigrantsImmigrantsAfghanistanAfricaAlbaniaArgentinaArmeniaAsiaAustraliaAustriaBahamasBangladeshBarbadosBelarusBelgiumBelizeBoliviaBosnia and HerzegovinaBrazilBulgariaBurma/MyanmarCabo VerdeCambodiaCameroonCanadaCaribbeanCentral AmericaChileChinaColombiaCongoCosta RicaCroatiaCubaCzechoslovakiaDenmarkDominicaDominican RepublicEastern AfricaEastern AsiaEastern EuropeEcuadorEgyptEl SalvadorEnglandEritreaEthiopiaEuropeFijiFranceGermanyGhanaGreeceGrenadaGuatemalaGuyanaHaitiHondurasHong KongHungaryIndiaIndonesiaIranIraqIrelandIsraelItalyJamaicaJapanJordanKazakhstanKenyaKoreaKuwaitLaosLatin AmericaLatviaLebanonLiberiaLithuaniaMalaysiaMexicoMicronesiaMiddle AfricaMoldovaMoroccoNepalNetherlandsNicaraguaNigeriaNorth AmericaNorth MacedoniaNorthern AfricaNorthern EuropeNorwayOceaniaPakistanPanamaPeruPhilippinesPolandPortugalRomaniaRussiaSaudi ArabiaScotlandSenegalSerbiaSierra LeoneSingaporeSomaliaSouth AfricaSouth AmericaSouth Central AsiaSouth Eastern AsiaSouthern EuropeSpainSri LankaSt. Vincent and the GrenadinesSudanSwedenSwitzerlandSyriaTaiwanThailandTrinidad and TobagoTurkeyUgandaUkraineUruguayUzbekistanVenezuelaVietnamWest IndiesWestern AfricaWestern AsiaWestern EuropeYemenZaireZimbabweAzores
Receiving Food Stamps
Income
Poverty
Unemployment
Labor Participation
Family Structure
Vehicle Availability
Education Level
Disability

Receiving Food Stamps Comparison

Romanians

Chileans

Exceptional
Excellent
10.4%
RECEIVING FOOD STAMPS
95.8/ 100
METRIC RATING
111th/ 347
METRIC RANK
11.0%
RECEIVING FOOD STAMPS
86.2/ 100
METRIC RATING
142nd/ 347
METRIC RANK

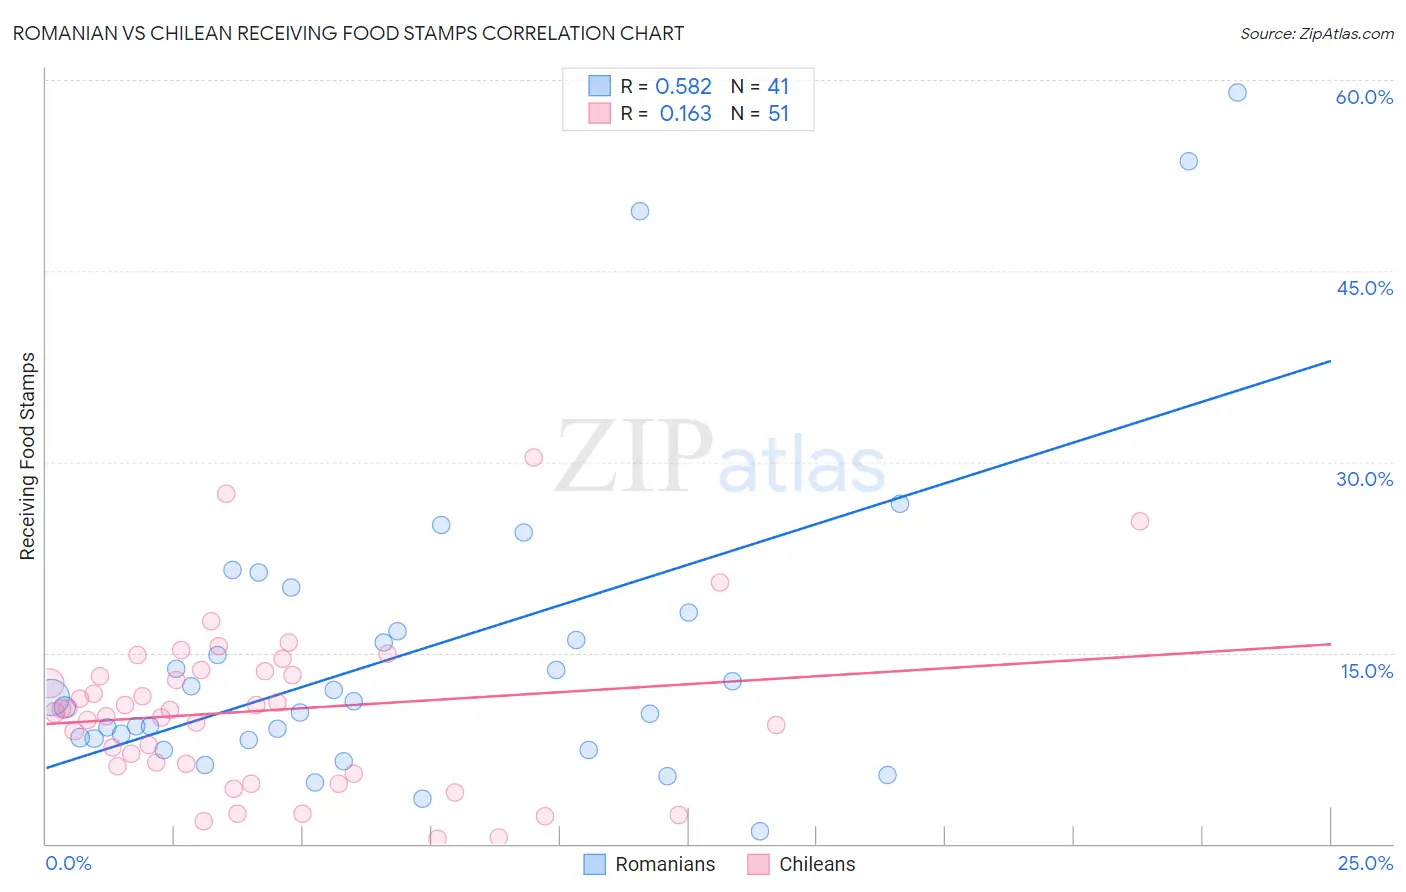
Romanian vs Chilean Receiving Food Stamps Correlation Chart

The statistical analysis conducted on geographies consisting of 376,766,958 people shows a substantial positive correlation between the proportion of Romanians and percentage of population receiving government assistance and/or food stamps in the United States with a correlation coefficient (R) of 0.582 and weighted average of 10.4%. Similarly, the statistical analysis conducted on geographies consisting of 256,152,699 people shows a poor positive correlation between the proportion of Chileans and percentage of population receiving government assistance and/or food stamps in the United States with a correlation coefficient (R) of 0.163 and weighted average of 11.0%, a difference of 5.1%.
Romanian vs Chilean Receiving Food Stamps

Receiving Food Stamps Correlation Summary

MeasurementRomanianChilean
Minimum1.0%0.40%
Maximum59.0%30.3%
Range58.0%29.9%
Mean15.1%10.5%
Median11.1%10.5%
Interquartile 25% (IQ1)8.2%6.1%
Interquartile 75% (IQ3)17.4%13.5%
Interquartile Range (IQR)9.2%7.4%
Standard Deviation (Sample)12.6%6.4%
Standard Deviation (Population)12.5%6.3%

Similar Demographics by Receiving Food Stamps

Demographics Similar to Romanians by Receiving Food Stamps

In terms of receiving food stamps, the demographic groups most similar to Romanians are Mongolian (10.5%, a difference of 0.010%), Pakistani (10.4%, a difference of 0.10%), Immigrants from Pakistan (10.4%, a difference of 0.38%), Icelander (10.5%, a difference of 0.39%), and Carpatho Rusyn (10.4%, a difference of 0.43%).
DemographicsRating | RankReceiving Food Stamps
Immigrants | Hungary
96.7
/100
|
#104
Exceptional
10.3%
Immigrants | Malaysia
96.5
/100
|
#105
Exceptional
10.4%
Immigrants | Italy
96.4
/100
|
#106
Exceptional
10.4%
Koreans
96.3
/100
|
#107
Exceptional
10.4%
Carpatho Rusyns
96.2
/100
|
#108
Exceptional
10.4%
Immigrants | Pakistan
96.2
/100
|
#109
Exceptional
10.4%
Pakistanis
95.9
/100
|
#110
Exceptional
10.4%
Romanians
95.8
/100
|
#111
Exceptional
10.4%
Mongolians
95.8
/100
|
#112
Exceptional
10.5%
Icelanders
95.4
/100
|
#113
Exceptional
10.5%
Scotch-Irish
95.1
/100
|
#114
Exceptional
10.5%
Immigrants | Saudi Arabia
94.9
/100
|
#115
Exceptional
10.5%
Canadians
94.8
/100
|
#116
Exceptional
10.5%
Immigrants | Nepal
94.6
/100
|
#117
Exceptional
10.6%
Assyrians/Chaldeans/Syriacs
94.1
/100
|
#118
Exceptional
10.6%

Demographics Similar to Chileans by Receiving Food Stamps

In terms of receiving food stamps, the demographic groups most similar to Chileans are Immigrants from Northern Africa (11.0%, a difference of 0.080%), Immigrants from Vietnam (11.0%, a difference of 0.17%), Syrian (11.0%, a difference of 0.23%), Hungarian (11.0%, a difference of 0.35%), and Celtic (10.9%, a difference of 0.53%).
DemographicsRating | RankReceiving Food Stamps
Argentineans
90.2
/100
|
#135
Exceptional
10.8%
Slovaks
89.8
/100
|
#136
Excellent
10.8%
Immigrants | Eastern Europe
89.8
/100
|
#137
Excellent
10.8%
Immigrants | Moldova
88.5
/100
|
#138
Excellent
10.9%
Hmong
88.4
/100
|
#139
Excellent
10.9%
Celtics
87.8
/100
|
#140
Excellent
10.9%
Immigrants | Vietnam
86.7
/100
|
#141
Excellent
11.0%
Chileans
86.2
/100
|
#142
Excellent
11.0%
Immigrants | Northern Africa
86.0
/100
|
#143
Excellent
11.0%
Syrians
85.5
/100
|
#144
Excellent
11.0%
Hungarians
85.1
/100
|
#145
Excellent
11.0%
Taiwanese
84.2
/100
|
#146
Excellent
11.0%
Whites/Caucasians
83.9
/100
|
#147
Excellent
11.1%
Immigrants | South Eastern Asia
83.3
/100
|
#148
Excellent
11.1%
Brazilians
83.2
/100
|
#149
Excellent
11.1%