Romanian vs Immigrants from Africa Receiving Food Stamps
COMPARE
Romanian
Immigrants from Africa
Receiving Food Stamps
Receiving Food Stamps Comparison
Romanians
Immigrants from Africa
10.4%
RECEIVING FOOD STAMPS
95.8/ 100
METRIC RATING
111th/ 347
METRIC RANK
12.8%
RECEIVING FOOD STAMPS
7.6/ 100
METRIC RATING
214th/ 347
METRIC RANK
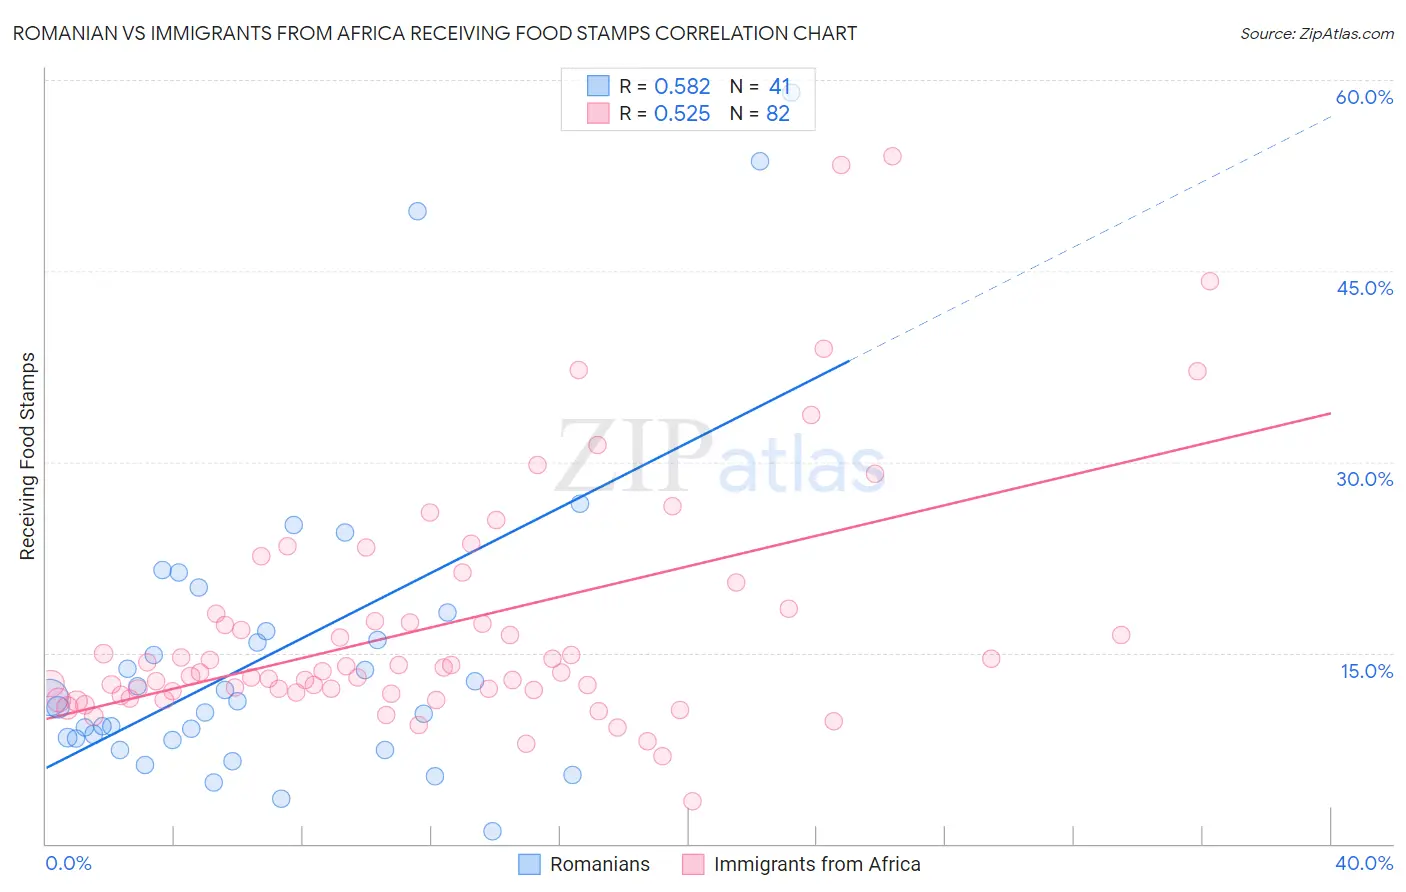
Romanian vs Immigrants from Africa Receiving Food Stamps Correlation Chart
The statistical analysis conducted on geographies consisting of 376,766,958 people shows a substantial positive correlation between the proportion of Romanians and percentage of population receiving government assistance and/or food stamps in the United States with a correlation coefficient (R) of 0.582 and weighted average of 10.4%. Similarly, the statistical analysis conducted on geographies consisting of 467,597,829 people shows a substantial positive correlation between the proportion of Immigrants from Africa and percentage of population receiving government assistance and/or food stamps in the United States with a correlation coefficient (R) of 0.525 and weighted average of 12.8%, a difference of 22.2%.
Receiving Food Stamps Correlation Summary
| Measurement | Romanian | Immigrants from Africa |
| Minimum | 1.0% | 3.3% |
| Maximum | 59.0% | 54.0% |
| Range | 58.0% | 50.7% |
| Mean | 15.1% | 17.1% |
| Median | 11.1% | 13.5% |
| Interquartile 25% (IQ1) | 8.2% | 11.9% |
| Interquartile 75% (IQ3) | 17.4% | 18.1% |
| Interquartile Range (IQR) | 9.2% | 6.2% |
| Standard Deviation (Sample) | 12.6% | 9.7% |
| Standard Deviation (Population) | 12.5% | 9.6% |
Similar Demographics by Receiving Food Stamps
Demographics Similar to Romanians by Receiving Food Stamps
In terms of receiving food stamps, the demographic groups most similar to Romanians are Mongolian (10.5%, a difference of 0.010%), Pakistani (10.4%, a difference of 0.10%), Immigrants from Pakistan (10.4%, a difference of 0.38%), Icelander (10.5%, a difference of 0.39%), and Carpatho Rusyn (10.4%, a difference of 0.43%).
| Demographics | Rating | Rank | Receiving Food Stamps |
| Immigrants | Hungary | 96.7 /100 | #104 | Exceptional 10.3% |
| Immigrants | Malaysia | 96.5 /100 | #105 | Exceptional 10.4% |
| Immigrants | Italy | 96.4 /100 | #106 | Exceptional 10.4% |
| Koreans | 96.3 /100 | #107 | Exceptional 10.4% |
| Carpatho Rusyns | 96.2 /100 | #108 | Exceptional 10.4% |
| Immigrants | Pakistan | 96.2 /100 | #109 | Exceptional 10.4% |
| Pakistanis | 95.9 /100 | #110 | Exceptional 10.4% |
| Romanians | 95.8 /100 | #111 | Exceptional 10.4% |
| Mongolians | 95.8 /100 | #112 | Exceptional 10.5% |
| Icelanders | 95.4 /100 | #113 | Exceptional 10.5% |
| Scotch-Irish | 95.1 /100 | #114 | Exceptional 10.5% |
| Immigrants | Saudi Arabia | 94.9 /100 | #115 | Exceptional 10.5% |
| Canadians | 94.8 /100 | #116 | Exceptional 10.5% |
| Immigrants | Nepal | 94.6 /100 | #117 | Exceptional 10.6% |
| Assyrians/Chaldeans/Syriacs | 94.1 /100 | #118 | Exceptional 10.6% |
Demographics Similar to Immigrants from Africa by Receiving Food Stamps
In terms of receiving food stamps, the demographic groups most similar to Immigrants from Africa are Moroccan (12.8%, a difference of 0.030%), Malaysian (12.7%, a difference of 0.43%), Native Hawaiian (12.8%, a difference of 0.44%), Immigrants from South America (12.8%, a difference of 0.55%), and Immigrants from Burma/Myanmar (12.9%, a difference of 0.81%).
| Demographics | Rating | Rank | Receiving Food Stamps |
| South Americans | 16.0 /100 | #207 | Poor 12.4% |
| Potawatomi | 14.6 /100 | #208 | Poor 12.5% |
| Immigrants | Sierra Leone | 12.9 /100 | #209 | Poor 12.5% |
| Immigrants | Uruguay | 12.8 /100 | #210 | Poor 12.5% |
| Colombians | 10.2 /100 | #211 | Poor 12.6% |
| Malaysians | 8.5 /100 | #212 | Tragic 12.7% |
| Moroccans | 7.6 /100 | #213 | Tragic 12.8% |
| Immigrants | Africa | 7.6 /100 | #214 | Tragic 12.8% |
| Native Hawaiians | 6.7 /100 | #215 | Tragic 12.8% |
| Immigrants | South America | 6.5 /100 | #216 | Tragic 12.8% |
| Immigrants | Burma/Myanmar | 6.0 /100 | #217 | Tragic 12.9% |
| Hawaiians | 5.4 /100 | #218 | Tragic 12.9% |
| Immigrants | Middle Africa | 5.4 /100 | #219 | Tragic 12.9% |
| Immigrants | Colombia | 5.3 /100 | #220 | Tragic 12.9% |
| Bermudans | 4.8 /100 | #221 | Tragic 13.0% |