Romanian vs Fijian Receiving Food Stamps
COMPARE
Romanian
Fijian
Receiving Food Stamps
Receiving Food Stamps Comparison
Romanians
Fijians
10.4%
RECEIVING FOOD STAMPS
95.8/ 100
METRIC RATING
111th/ 347
METRIC RANK
13.0%
RECEIVING FOOD STAMPS
4.3/ 100
METRIC RATING
225th/ 347
METRIC RANK
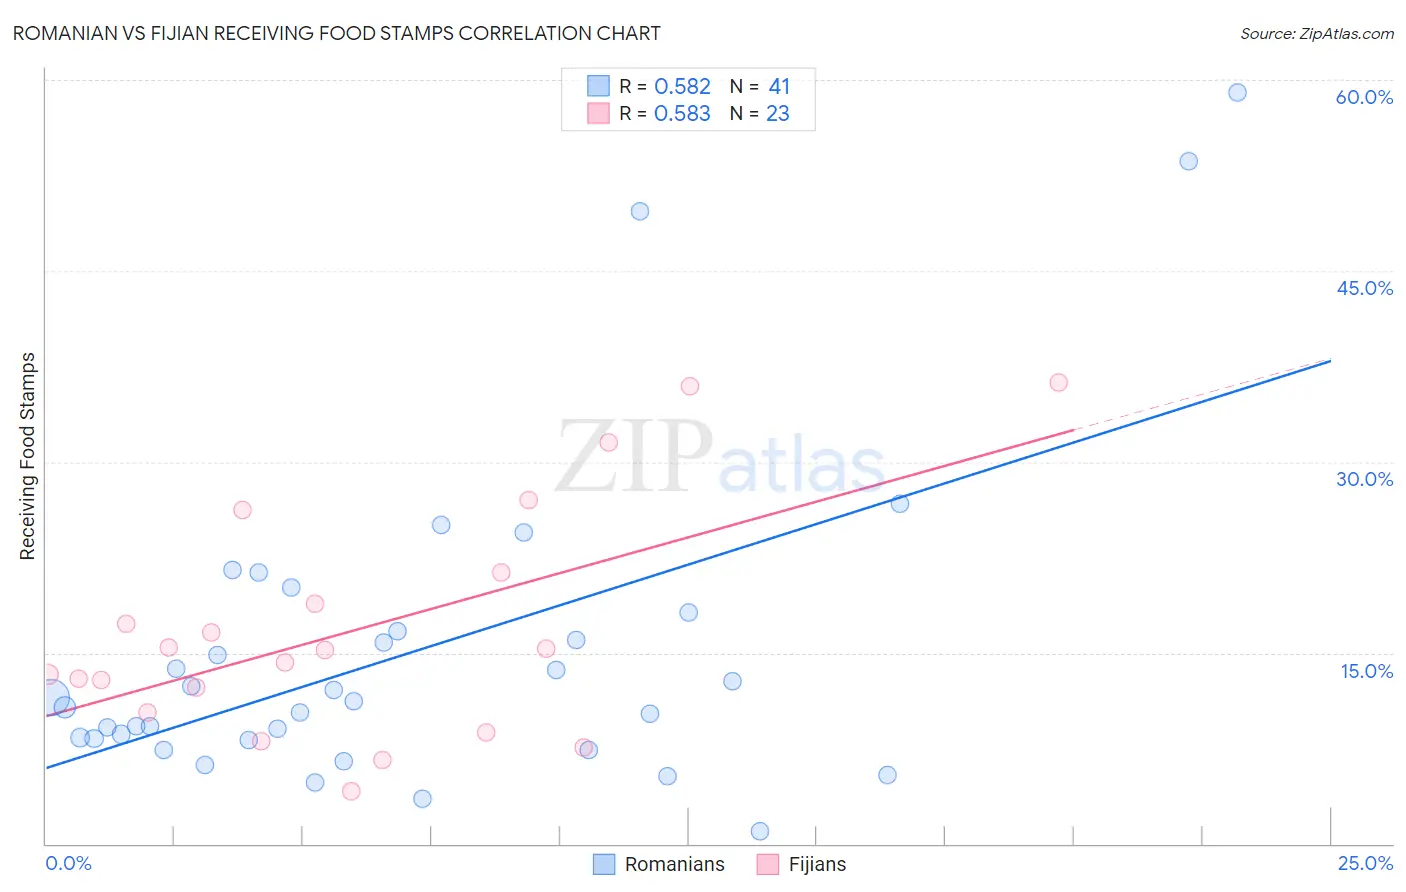
Romanian vs Fijian Receiving Food Stamps Correlation Chart
The statistical analysis conducted on geographies consisting of 376,766,958 people shows a substantial positive correlation between the proportion of Romanians and percentage of population receiving government assistance and/or food stamps in the United States with a correlation coefficient (R) of 0.582 and weighted average of 10.4%. Similarly, the statistical analysis conducted on geographies consisting of 55,945,460 people shows a substantial positive correlation between the proportion of Fijians and percentage of population receiving government assistance and/or food stamps in the United States with a correlation coefficient (R) of 0.583 and weighted average of 13.0%, a difference of 24.5%.
Receiving Food Stamps Correlation Summary
| Measurement | Romanian | Fijian |
| Minimum | 1.0% | 4.1% |
| Maximum | 59.0% | 36.2% |
| Range | 58.0% | 32.1% |
| Mean | 15.1% | 16.9% |
| Median | 11.1% | 15.2% |
| Interquartile 25% (IQ1) | 8.2% | 10.3% |
| Interquartile 75% (IQ3) | 17.4% | 21.3% |
| Interquartile Range (IQR) | 9.2% | 11.0% |
| Standard Deviation (Sample) | 12.6% | 9.0% |
| Standard Deviation (Population) | 12.5% | 8.8% |
Similar Demographics by Receiving Food Stamps
Demographics Similar to Romanians by Receiving Food Stamps
In terms of receiving food stamps, the demographic groups most similar to Romanians are Mongolian (10.5%, a difference of 0.010%), Pakistani (10.4%, a difference of 0.10%), Immigrants from Pakistan (10.4%, a difference of 0.38%), Icelander (10.5%, a difference of 0.39%), and Carpatho Rusyn (10.4%, a difference of 0.43%).
| Demographics | Rating | Rank | Receiving Food Stamps |
| Immigrants | Hungary | 96.7 /100 | #104 | Exceptional 10.3% |
| Immigrants | Malaysia | 96.5 /100 | #105 | Exceptional 10.4% |
| Immigrants | Italy | 96.4 /100 | #106 | Exceptional 10.4% |
| Koreans | 96.3 /100 | #107 | Exceptional 10.4% |
| Carpatho Rusyns | 96.2 /100 | #108 | Exceptional 10.4% |
| Immigrants | Pakistan | 96.2 /100 | #109 | Exceptional 10.4% |
| Pakistanis | 95.9 /100 | #110 | Exceptional 10.4% |
| Romanians | 95.8 /100 | #111 | Exceptional 10.4% |
| Mongolians | 95.8 /100 | #112 | Exceptional 10.5% |
| Icelanders | 95.4 /100 | #113 | Exceptional 10.5% |
| Scotch-Irish | 95.1 /100 | #114 | Exceptional 10.5% |
| Immigrants | Saudi Arabia | 94.9 /100 | #115 | Exceptional 10.5% |
| Canadians | 94.8 /100 | #116 | Exceptional 10.5% |
| Immigrants | Nepal | 94.6 /100 | #117 | Exceptional 10.6% |
| Assyrians/Chaldeans/Syriacs | 94.1 /100 | #118 | Exceptional 10.6% |
Demographics Similar to Fijians by Receiving Food Stamps
In terms of receiving food stamps, the demographic groups most similar to Fijians are Immigrants from Armenia (13.0%, a difference of 0.020%), Immigrants from Albania (13.0%, a difference of 0.090%), Immigrants (13.0%, a difference of 0.13%), Bermudan (13.0%, a difference of 0.39%), and Chickasaw (13.1%, a difference of 0.60%).
| Demographics | Rating | Rank | Receiving Food Stamps |
| Hawaiians | 5.4 /100 | #218 | Tragic 12.9% |
| Immigrants | Middle Africa | 5.4 /100 | #219 | Tragic 12.9% |
| Immigrants | Colombia | 5.3 /100 | #220 | Tragic 12.9% |
| Bermudans | 4.8 /100 | #221 | Tragic 13.0% |
| Immigrants | Immigrants | 4.4 /100 | #222 | Tragic 13.0% |
| Immigrants | Albania | 4.4 /100 | #223 | Tragic 13.0% |
| Immigrants | Armenia | 4.3 /100 | #224 | Tragic 13.0% |
| Fijians | 4.3 /100 | #225 | Tragic 13.0% |
| Chickasaw | 3.6 /100 | #226 | Tragic 13.1% |
| Nigerians | 3.5 /100 | #227 | Tragic 13.1% |
| Panamanians | 3.5 /100 | #228 | Tragic 13.1% |
| Ottawa | 3.5 /100 | #229 | Tragic 13.1% |
| Puget Sound Salish | 3.4 /100 | #230 | Tragic 13.1% |
| Immigrants | Nigeria | 3.4 /100 | #231 | Tragic 13.1% |
| Salvadorans | 2.7 /100 | #232 | Tragic 13.2% |