Romanian vs Immigrants from Iraq Receiving Food Stamps
COMPARE
Romanian
Immigrants from Iraq
Receiving Food Stamps
Receiving Food Stamps Comparison
Romanians
Immigrants from Iraq
10.4%
RECEIVING FOOD STAMPS
95.8/ 100
METRIC RATING
111th/ 347
METRIC RANK
12.0%
RECEIVING FOOD STAMPS
37.1/ 100
METRIC RATING
185th/ 347
METRIC RANK
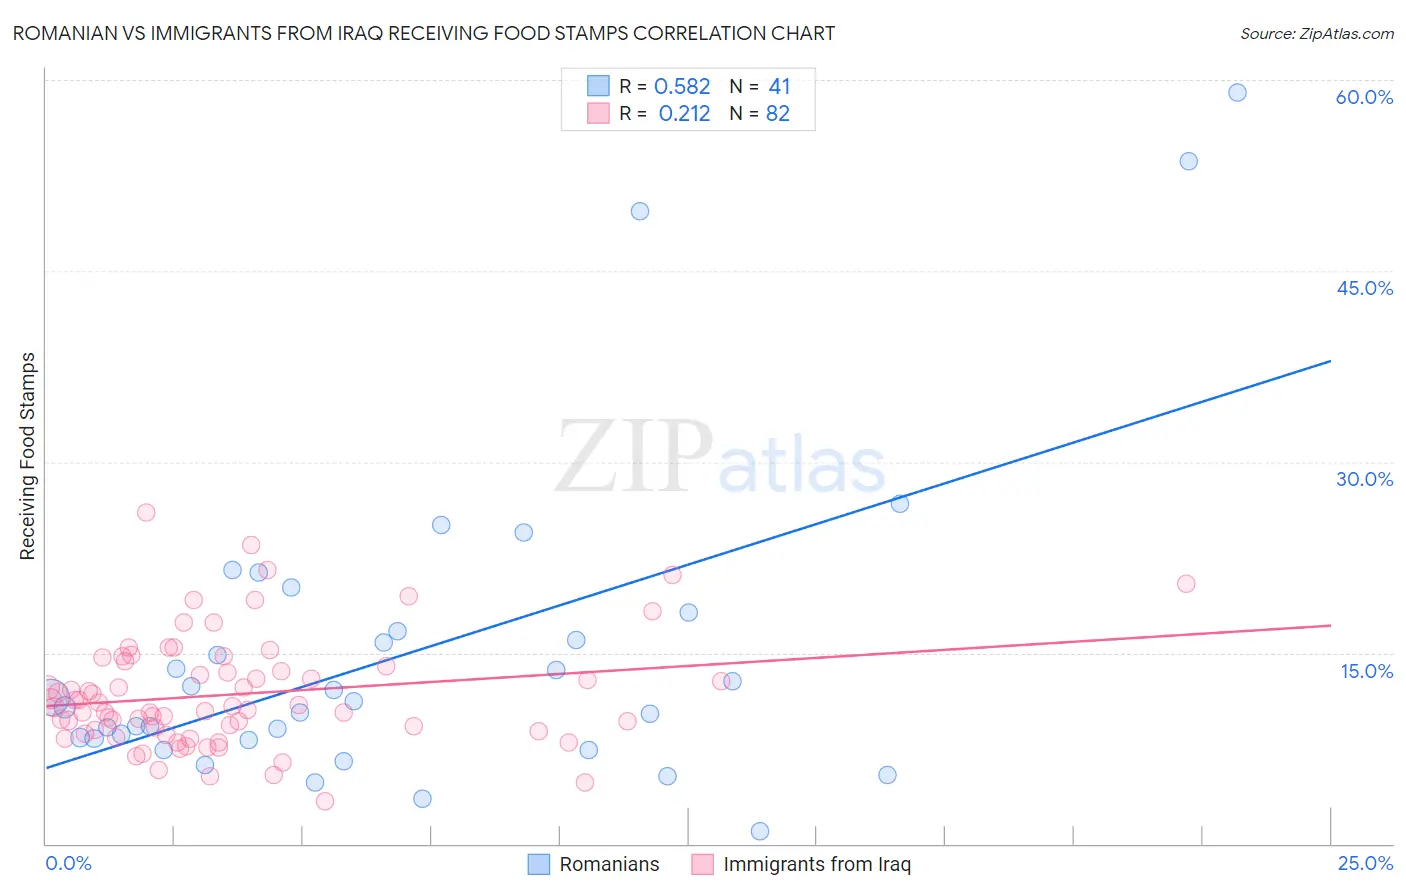
Romanian vs Immigrants from Iraq Receiving Food Stamps Correlation Chart
The statistical analysis conducted on geographies consisting of 376,766,958 people shows a substantial positive correlation between the proportion of Romanians and percentage of population receiving government assistance and/or food stamps in the United States with a correlation coefficient (R) of 0.582 and weighted average of 10.4%. Similarly, the statistical analysis conducted on geographies consisting of 194,550,826 people shows a weak positive correlation between the proportion of Immigrants from Iraq and percentage of population receiving government assistance and/or food stamps in the United States with a correlation coefficient (R) of 0.212 and weighted average of 12.0%, a difference of 14.4%.
Receiving Food Stamps Correlation Summary
| Measurement | Romanian | Immigrants from Iraq |
| Minimum | 1.0% | 3.3% |
| Maximum | 59.0% | 26.0% |
| Range | 58.0% | 22.7% |
| Mean | 15.1% | 11.7% |
| Median | 11.1% | 10.7% |
| Interquartile 25% (IQ1) | 8.2% | 8.8% |
| Interquartile 75% (IQ3) | 17.4% | 13.9% |
| Interquartile Range (IQR) | 9.2% | 5.1% |
| Standard Deviation (Sample) | 12.6% | 4.4% |
| Standard Deviation (Population) | 12.5% | 4.4% |
Similar Demographics by Receiving Food Stamps
Demographics Similar to Romanians by Receiving Food Stamps
In terms of receiving food stamps, the demographic groups most similar to Romanians are Mongolian (10.5%, a difference of 0.010%), Pakistani (10.4%, a difference of 0.10%), Immigrants from Pakistan (10.4%, a difference of 0.38%), Icelander (10.5%, a difference of 0.39%), and Carpatho Rusyn (10.4%, a difference of 0.43%).
| Demographics | Rating | Rank | Receiving Food Stamps |
| Immigrants | Hungary | 96.7 /100 | #104 | Exceptional 10.3% |
| Immigrants | Malaysia | 96.5 /100 | #105 | Exceptional 10.4% |
| Immigrants | Italy | 96.4 /100 | #106 | Exceptional 10.4% |
| Koreans | 96.3 /100 | #107 | Exceptional 10.4% |
| Carpatho Rusyns | 96.2 /100 | #108 | Exceptional 10.4% |
| Immigrants | Pakistan | 96.2 /100 | #109 | Exceptional 10.4% |
| Pakistanis | 95.9 /100 | #110 | Exceptional 10.4% |
| Romanians | 95.8 /100 | #111 | Exceptional 10.4% |
| Mongolians | 95.8 /100 | #112 | Exceptional 10.5% |
| Icelanders | 95.4 /100 | #113 | Exceptional 10.5% |
| Scotch-Irish | 95.1 /100 | #114 | Exceptional 10.5% |
| Immigrants | Saudi Arabia | 94.9 /100 | #115 | Exceptional 10.5% |
| Canadians | 94.8 /100 | #116 | Exceptional 10.5% |
| Immigrants | Nepal | 94.6 /100 | #117 | Exceptional 10.6% |
| Assyrians/Chaldeans/Syriacs | 94.1 /100 | #118 | Exceptional 10.6% |
Demographics Similar to Immigrants from Iraq by Receiving Food Stamps
In terms of receiving food stamps, the demographic groups most similar to Immigrants from Iraq are Spanish (12.0%, a difference of 0.040%), Albanian (12.0%, a difference of 0.25%), Spaniard (11.9%, a difference of 0.38%), Immigrants from Uganda (11.9%, a difference of 0.46%), and Immigrants from Morocco (11.9%, a difference of 0.52%).
| Demographics | Rating | Rank | Receiving Food Stamps |
| German Russians | 48.1 /100 | #178 | Average 11.8% |
| Immigrants | Kenya | 46.4 /100 | #179 | Average 11.8% |
| Uruguayans | 44.8 /100 | #180 | Average 11.8% |
| South American Indians | 41.7 /100 | #181 | Average 11.9% |
| Immigrants | Morocco | 40.7 /100 | #182 | Average 11.9% |
| Immigrants | Uganda | 40.3 /100 | #183 | Average 11.9% |
| Spaniards | 39.8 /100 | #184 | Fair 11.9% |
| Immigrants | Iraq | 37.1 /100 | #185 | Fair 12.0% |
| Spanish | 36.9 /100 | #186 | Fair 12.0% |
| Albanians | 35.4 /100 | #187 | Fair 12.0% |
| Sudanese | 33.4 /100 | #188 | Fair 12.0% |
| Immigrants | Cameroon | 32.5 /100 | #189 | Fair 12.0% |
| Immigrants | Peru | 32.2 /100 | #190 | Fair 12.0% |
| Venezuelans | 32.1 /100 | #191 | Fair 12.0% |
| Samoans | 31.0 /100 | #192 | Fair 12.1% |