Romanian vs Tohono O'odham Receiving Food Stamps
COMPARE
Romanian
Tohono O'odham
Receiving Food Stamps
Receiving Food Stamps Comparison
Romanians
Tohono O'odham
10.4%
RECEIVING FOOD STAMPS
95.8/ 100
METRIC RATING
111th/ 347
METRIC RANK
21.5%
RECEIVING FOOD STAMPS
0.0/ 100
METRIC RATING
340th/ 347
METRIC RANK
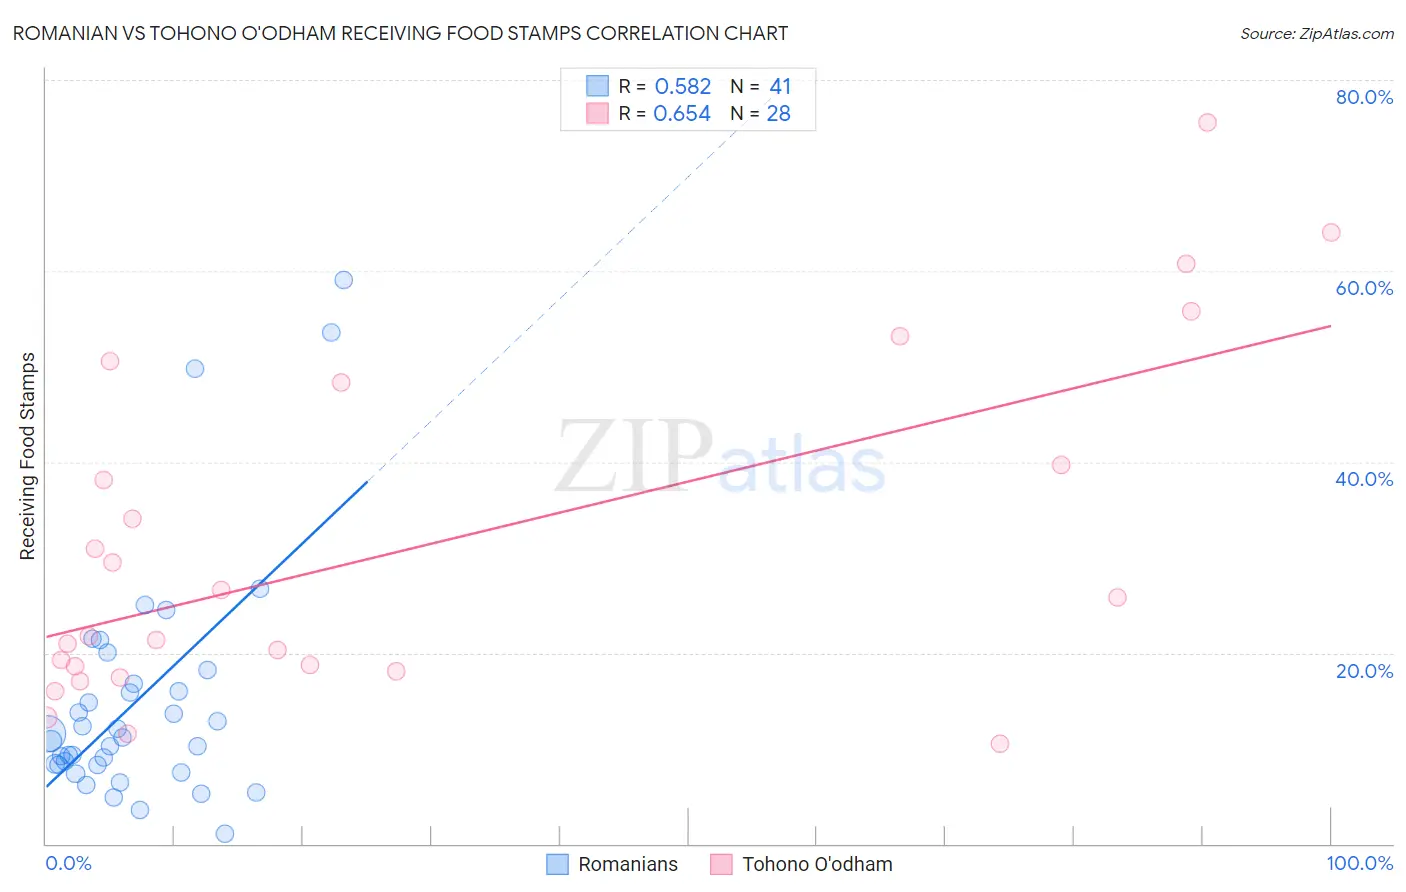
Romanian vs Tohono O'odham Receiving Food Stamps Correlation Chart
The statistical analysis conducted on geographies consisting of 376,766,958 people shows a substantial positive correlation between the proportion of Romanians and percentage of population receiving government assistance and/or food stamps in the United States with a correlation coefficient (R) of 0.582 and weighted average of 10.4%. Similarly, the statistical analysis conducted on geographies consisting of 58,698,945 people shows a significant positive correlation between the proportion of Tohono O'odham and percentage of population receiving government assistance and/or food stamps in the United States with a correlation coefficient (R) of 0.654 and weighted average of 21.5%, a difference of 105.5%.
Receiving Food Stamps Correlation Summary
| Measurement | Romanian | Tohono O'odham |
| Minimum | 1.0% | 10.5% |
| Maximum | 59.0% | 75.6% |
| Range | 58.0% | 65.1% |
| Mean | 15.1% | 31.3% |
| Median | 11.1% | 23.7% |
| Interquartile 25% (IQ1) | 8.2% | 18.4% |
| Interquartile 75% (IQ3) | 17.4% | 44.0% |
| Interquartile Range (IQR) | 9.2% | 25.6% |
| Standard Deviation (Sample) | 12.6% | 17.9% |
| Standard Deviation (Population) | 12.5% | 17.6% |
Similar Demographics by Receiving Food Stamps
Demographics Similar to Romanians by Receiving Food Stamps
In terms of receiving food stamps, the demographic groups most similar to Romanians are Mongolian (10.5%, a difference of 0.010%), Pakistani (10.4%, a difference of 0.10%), Immigrants from Pakistan (10.4%, a difference of 0.38%), Icelander (10.5%, a difference of 0.39%), and Carpatho Rusyn (10.4%, a difference of 0.43%).
| Demographics | Rating | Rank | Receiving Food Stamps |
| Immigrants | Hungary | 96.7 /100 | #104 | Exceptional 10.3% |
| Immigrants | Malaysia | 96.5 /100 | #105 | Exceptional 10.4% |
| Immigrants | Italy | 96.4 /100 | #106 | Exceptional 10.4% |
| Koreans | 96.3 /100 | #107 | Exceptional 10.4% |
| Carpatho Rusyns | 96.2 /100 | #108 | Exceptional 10.4% |
| Immigrants | Pakistan | 96.2 /100 | #109 | Exceptional 10.4% |
| Pakistanis | 95.9 /100 | #110 | Exceptional 10.4% |
| Romanians | 95.8 /100 | #111 | Exceptional 10.4% |
| Mongolians | 95.8 /100 | #112 | Exceptional 10.5% |
| Icelanders | 95.4 /100 | #113 | Exceptional 10.5% |
| Scotch-Irish | 95.1 /100 | #114 | Exceptional 10.5% |
| Immigrants | Saudi Arabia | 94.9 /100 | #115 | Exceptional 10.5% |
| Canadians | 94.8 /100 | #116 | Exceptional 10.5% |
| Immigrants | Nepal | 94.6 /100 | #117 | Exceptional 10.6% |
| Assyrians/Chaldeans/Syriacs | 94.1 /100 | #118 | Exceptional 10.6% |
Demographics Similar to Tohono O'odham by Receiving Food Stamps
In terms of receiving food stamps, the demographic groups most similar to Tohono O'odham are Yakama (21.4%, a difference of 0.26%), Hopi (21.6%, a difference of 0.37%), Dominican (21.4%, a difference of 0.52%), Immigrants from Yemen (21.6%, a difference of 0.78%), and Cape Verdean (21.1%, a difference of 1.9%).
| Demographics | Rating | Rank | Receiving Food Stamps |
| Inupiat | 0.0 /100 | #333 | Tragic 20.1% |
| Yuman | 0.0 /100 | #334 | Tragic 20.2% |
| Immigrants | Cuba | 0.0 /100 | #335 | Tragic 20.8% |
| Navajo | 0.0 /100 | #336 | Tragic 21.1% |
| Cape Verdeans | 0.0 /100 | #337 | Tragic 21.1% |
| Dominicans | 0.0 /100 | #338 | Tragic 21.4% |
| Yakama | 0.0 /100 | #339 | Tragic 21.4% |
| Tohono O'odham | 0.0 /100 | #340 | Tragic 21.5% |
| Hopi | 0.0 /100 | #341 | Tragic 21.6% |
| Immigrants | Yemen | 0.0 /100 | #342 | Tragic 21.6% |
| Immigrants | Dominican Republic | 0.0 /100 | #343 | Tragic 22.1% |
| Lumbee | 0.0 /100 | #344 | Tragic 22.9% |
| Immigrants | Cabo Verde | 0.0 /100 | #345 | Tragic 23.8% |
| Puerto Ricans | 0.0 /100 | #346 | Tragic 26.0% |
| Yup'ik | 0.0 /100 | #347 | Tragic 32.7% |