Black/African American Unemployment
COMPARE
Black/African American
Select to Compare
Unemployment
Black/African American Unemployment
6.6%
UNEMPLOYMENT
0.0/ 100
METRIC RATING
314th/ 347
METRIC RANK
Black/African American Unemployment Correlation Chart
The statistical analysis conducted on geographies consisting of 562,987,434 people shows a very strong positive correlation between the proportion of Blacks/African Americans and unemployment in the United States with a correlation coefficient (R) of 0.873 and weighted average of 6.6%. On average, for every 1% (one percent) increase in Blacks/African Americans within a typical geography, there is an increase of 0.081% in unemployment.
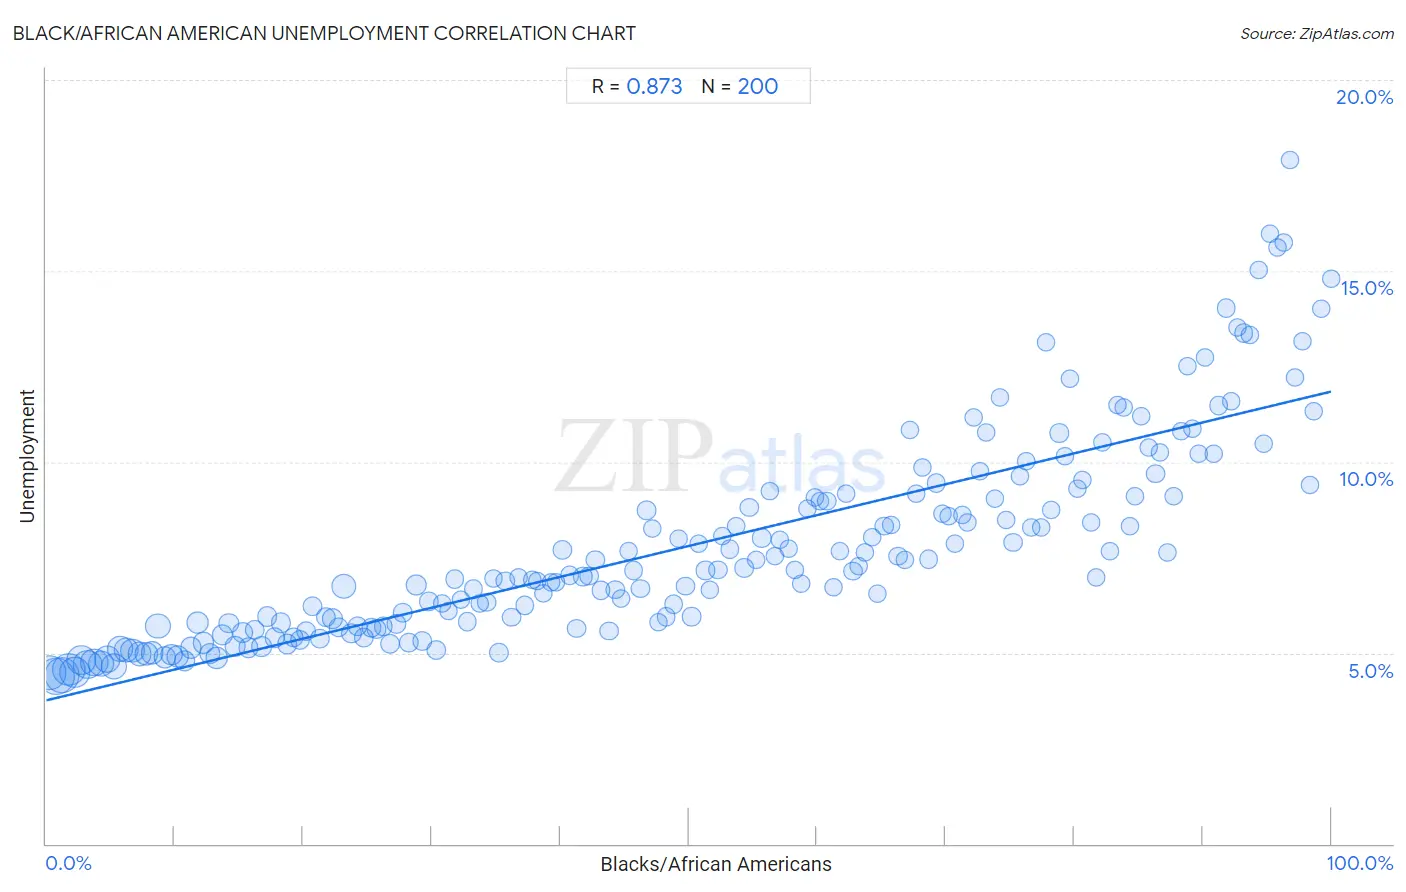
It is essential to understand that the correlation between the percentage of Blacks/African Americans and unemployment does not imply a direct cause-and-effect relationship. It remains uncertain whether the presence of Blacks/African Americans influences an upward or downward trend in the level of unemployment within an area, or if Blacks/African Americans simply ended up residing in those areas with higher or lower levels of unemployment due to other factors.
Demographics Similar to Blacks/African Americans by Unemployment
In terms of unemployment, the demographic groups most similar to Blacks/African Americans are Immigrants from Barbados (6.6%, a difference of 0.55%), Houma (6.7%, a difference of 0.80%), Colville (6.6%, a difference of 0.93%), Cape Verdean (6.5%, a difference of 1.5%), and Immigrants from Dominica (6.7%, a difference of 1.6%).
| Demographics | Rating | Rank | Unemployment |
| Immigrants from Bangladesh | 0.0 /100 | #307 | Tragic 6.5% |
| Barbadians | 0.0 /100 | #308 | Tragic 6.5% |
| Vietnamese | 0.0 /100 | #309 | Tragic 6.5% |
| Immigrants from Belize | 0.0 /100 | #310 | Tragic 6.5% |
| Cape Verdeans | 0.0 /100 | #311 | Tragic 6.5% |
| Colville | 0.0 /100 | #312 | Tragic 6.6% |
| Immigrants from Barbados | 0.0 /100 | #313 | Tragic 6.6% |
| Blacks/African Americans | 0.0 /100 | #314 | Tragic 6.6% |
| Houma | 0.0 /100 | #315 | Tragic 6.7% |
| Immigrants from Dominica | 0.0 /100 | #316 | Tragic 6.7% |
| Shoshone | 0.0 /100 | #317 | Tragic 6.8% |
| Immigrants from Cabo Verde | 0.0 /100 | #318 | Tragic 6.8% |
| British West Indians | 0.0 /100 | #319 | Tragic 6.8% |
| Immigrants from St. Vincent and the Grenadines | 0.0 /100 | #320 | Tragic 6.9% |
| Immigrants from Guyana | 0.0 /100 | #321 | Tragic 6.9% |
Black/African American Unemployment Correlation Summary
| Measurement | Black/African American Data | Unemployment Data |
| Minimum | 0.26% | 4.4% |
| Maximum | 100.0% | 17.9% |
| Range | 99.7% | 13.5% |
| Mean | 50.0% | 7.8% |
| Median | 50.0% | 7.1% |
| Interquartile 25% (IQ1) | 25.0% | 5.7% |
| Interquartile 75% (IQ3) | 75.0% | 9.1% |
| Interquartile Range (IQR) | 49.9% | 3.4% |
| Standard Deviation (Sample) | 28.9% | 2.7% |
| Standard Deviation (Population) | 28.9% | 2.7% |
Correlation Details
| Black/African American Percentile | Sample Size | Unemployment |
[ 0.0% - 0.5% ] 0.26% | 29,821,432 | 4.5% |
[ 0.5% - 1.0% ] 0.74% | 35,157,769 | 4.4% |
[ 1.0% - 1.5% ] 1.23% | 32,241,328 | 4.4% |
[ 1.5% - 2.0% ] 1.74% | 27,854,320 | 4.6% |
[ 2.0% - 2.5% ] 2.24% | 24,283,918 | 4.5% |
[ 2.5% - 3.0% ] 2.75% | 20,684,208 | 4.8% |
[ 3.0% - 3.5% ] 3.25% | 20,657,530 | 4.7% |
[ 3.5% - 4.0% ] 3.74% | 16,767,643 | 4.7% |
[ 4.0% - 4.5% ] 4.24% | 14,592,508 | 4.7% |
[ 4.5% - 5.0% ] 4.74% | 14,870,840 | 4.8% |
[ 5.0% - 5.5% ] 5.24% | 13,598,567 | 4.6% |
[ 5.5% - 6.0% ] 5.76% | 13,794,350 | 5.1% |
[ 6.0% - 6.5% ] 6.23% | 11,756,774 | 5.1% |
[ 6.5% - 7.0% ] 6.72% | 11,712,669 | 5.1% |
[ 7.0% - 7.5% ] 7.26% | 10,964,845 | 5.0% |
[ 7.5% - 8.0% ] 7.75% | 9,088,746 | 5.0% |
[ 8.0% - 8.5% ] 8.24% | 8,281,115 | 5.0% |
[ 8.5% - 9.0% ] 8.69% | 12,384,450 | 5.7% |
[ 9.0% - 9.5% ] 9.24% | 7,619,579 | 4.9% |
[ 9.5% - 10.0% ] 9.75% | 5,932,756 | 4.9% |
[ 10.0% - 10.5% ] 10.26% | 6,430,251 | 4.9% |
[ 10.5% - 11.0% ] 10.76% | 6,051,194 | 4.8% |
[ 11.0% - 11.5% ] 11.27% | 5,996,002 | 5.1% |
[ 11.5% - 12.0% ] 11.75% | 6,634,382 | 5.8% |
[ 12.0% - 12.5% ] 12.24% | 5,830,972 | 5.3% |
[ 12.5% - 13.0% ] 12.73% | 5,222,457 | 5.0% |
[ 13.0% - 13.5% ] 13.26% | 5,598,442 | 4.9% |
[ 13.5% - 14.0% ] 13.72% | 4,983,021 | 5.5% |
[ 14.0% - 14.5% ] 14.23% | 4,358,978 | 5.8% |
[ 14.5% - 15.0% ] 14.73% | 4,183,358 | 5.2% |
[ 15.0% - 15.5% ] 15.25% | 4,393,725 | 5.5% |
[ 15.5% - 16.0% ] 15.75% | 3,572,480 | 5.1% |
[ 16.0% - 16.5% ] 16.25% | 3,267,658 | 5.6% |
[ 16.5% - 17.0% ] 16.75% | 3,387,362 | 5.2% |
[ 17.0% - 17.5% ] 17.22% | 3,494,758 | 6.0% |
[ 17.5% - 18.0% ] 17.77% | 3,674,346 | 5.4% |
[ 18.0% - 18.5% ] 18.26% | 3,596,973 | 5.8% |
[ 18.5% - 19.0% ] 18.73% | 3,663,203 | 5.2% |
[ 19.0% - 19.5% ] 19.23% | 3,035,972 | 5.4% |
[ 19.5% - 20.0% ] 19.75% | 2,539,339 | 5.3% |
[ 20.0% - 20.5% ] 20.23% | 2,754,808 | 5.6% |
[ 20.5% - 21.0% ] 20.77% | 2,349,262 | 6.2% |
[ 21.0% - 21.5% ] 21.29% | 2,721,687 | 5.4% |
[ 21.5% - 22.0% ] 21.77% | 3,745,258 | 5.9% |
[ 22.0% - 22.5% ] 22.31% | 4,857,939 | 5.9% |
[ 22.5% - 23.0% ] 22.72% | 3,017,868 | 5.7% |
[ 23.0% - 23.5% ] 23.15% | 11,608,862 | 6.8% |
[ 23.5% - 24.0% ] 23.75% | 3,961,181 | 5.5% |
[ 24.0% - 24.5% ] 24.22% | 2,193,063 | 5.7% |
[ 24.5% - 25.0% ] 24.74% | 1,981,812 | 5.4% |
[ 25.0% - 25.5% ] 25.28% | 1,588,407 | 5.7% |
[ 25.5% - 26.0% ] 25.71% | 1,472,350 | 5.6% |
[ 26.0% - 26.5% ] 26.22% | 1,903,530 | 5.7% |
[ 26.5% - 27.0% ] 26.77% | 2,135,695 | 5.2% |
[ 27.0% - 27.5% ] 27.23% | 1,789,012 | 5.8% |
[ 27.5% - 28.0% ] 27.75% | 1,491,613 | 6.1% |
[ 28.0% - 28.5% ] 28.22% | 1,987,800 | 5.3% |
[ 28.5% - 29.0% ] 28.80% | 4,740,278 | 6.8% |
[ 29.0% - 29.5% ] 29.24% | 3,232,103 | 5.3% |
[ 29.5% - 30.0% ] 29.77% | 1,872,845 | 6.4% |
[ 30.0% - 30.5% ] 30.35% | 2,240,177 | 5.1% |
[ 30.5% - 31.0% ] 30.81% | 1,193,441 | 6.3% |
[ 31.0% - 31.5% ] 31.29% | 962,223 | 6.1% |
[ 31.5% - 32.0% ] 31.79% | 1,018,835 | 6.9% |
[ 32.0% - 32.5% ] 32.27% | 1,271,112 | 6.4% |
[ 32.5% - 33.0% ] 32.74% | 735,707 | 5.8% |
[ 33.0% - 33.5% ] 33.25% | 1,251,631 | 6.7% |
[ 33.5% - 34.0% ] 33.75% | 917,357 | 6.3% |
[ 34.0% - 34.5% ] 34.28% | 834,515 | 6.3% |
[ 34.5% - 35.0% ] 34.79% | 918,529 | 6.9% |
[ 35.0% - 35.5% ] 35.24% | 1,767,307 | 5.0% |
[ 35.5% - 36.0% ] 35.74% | 1,281,406 | 6.9% |
[ 36.0% - 36.5% ] 36.23% | 1,183,348 | 5.9% |
[ 36.5% - 37.0% ] 36.75% | 562,558 | 7.0% |
[ 37.0% - 37.5% ] 37.25% | 920,838 | 6.2% |
[ 37.5% - 38.0% ] 37.80% | 834,042 | 6.9% |
[ 38.0% - 38.5% ] 38.19% | 954,230 | 6.9% |
[ 38.5% - 39.0% ] 38.70% | 1,445,082 | 6.6% |
[ 39.0% - 39.5% ] 39.31% | 529,308 | 6.9% |
[ 39.5% - 40.0% ] 39.68% | 912,883 | 6.8% |
[ 40.0% - 40.5% ] 40.16% | 2,715,484 | 7.7% |
[ 40.5% - 41.0% ] 40.73% | 1,176,714 | 7.0% |
[ 41.0% - 41.5% ] 41.26% | 1,036,290 | 5.6% |
[ 41.5% - 42.0% ] 41.76% | 962,215 | 7.0% |
[ 42.0% - 42.5% ] 42.25% | 882,115 | 7.0% |
[ 42.5% - 43.0% ] 42.73% | 1,018,428 | 7.4% |
[ 43.0% - 43.5% ] 43.19% | 1,011,896 | 6.6% |
[ 43.5% - 44.0% ] 43.82% | 999,910 | 5.6% |
[ 44.0% - 44.5% ] 44.29% | 1,175,085 | 6.7% |
[ 44.5% - 45.0% ] 44.74% | 679,697 | 6.4% |
[ 45.0% - 45.5% ] 45.34% | 696,722 | 7.7% |
[ 45.5% - 46.0% ] 45.74% | 599,395 | 7.2% |
[ 46.0% - 46.5% ] 46.24% | 746,374 | 6.7% |
[ 46.5% - 47.0% ] 46.72% | 1,071,322 | 8.7% |
[ 47.0% - 47.5% ] 47.16% | 740,718 | 8.2% |
[ 47.5% - 48.0% ] 47.65% | 1,073,021 | 5.8% |
[ 48.0% - 48.5% ] 48.26% | 305,491 | 5.9% |
[ 48.5% - 49.0% ] 48.84% | 488,503 | 6.3% |
[ 49.0% - 49.5% ] 49.23% | 484,172 | 8.0% |
[ 49.5% - 50.0% ] 49.74% | 549,570 | 6.8% |
[ 50.0% - 50.5% ] 50.24% | 934,646 | 5.9% |
[ 50.5% - 51.0% ] 50.77% | 199,794 | 7.9% |
[ 51.0% - 51.5% ] 51.29% | 573,697 | 7.2% |
[ 51.5% - 52.0% ] 51.63% | 659,813 | 6.7% |
[ 52.0% - 52.5% ] 52.28% | 533,633 | 7.2% |
[ 52.5% - 53.0% ] 52.63% | 673,608 | 8.1% |
[ 53.0% - 53.5% ] 53.22% | 699,445 | 7.7% |
[ 53.5% - 54.0% ] 53.72% | 388,355 | 8.3% |
[ 54.0% - 54.5% ] 54.32% | 687,543 | 7.2% |
[ 54.5% - 55.0% ] 54.71% | 354,276 | 8.8% |
[ 55.0% - 55.5% ] 55.28% | 448,305 | 7.4% |
[ 55.5% - 56.0% ] 55.69% | 467,050 | 8.0% |
[ 56.0% - 56.5% ] 56.31% | 561,828 | 9.2% |
[ 56.5% - 57.0% ] 56.67% | 515,118 | 7.5% |
[ 57.0% - 57.5% ] 57.10% | 687,456 | 8.0% |
[ 57.5% - 58.0% ] 57.77% | 316,543 | 7.7% |
[ 58.0% - 58.5% ] 58.25% | 368,551 | 7.2% |
[ 58.5% - 59.0% ] 58.76% | 284,727 | 6.8% |
[ 59.0% - 59.5% ] 59.21% | 337,488 | 8.8% |
[ 59.5% - 60.0% ] 59.79% | 361,709 | 9.1% |
[ 60.0% - 60.5% ] 60.22% | 272,079 | 9.0% |
[ 60.5% - 61.0% ] 60.74% | 453,710 | 9.0% |
[ 61.0% - 61.5% ] 61.26% | 881,394 | 6.7% |
[ 61.5% - 62.0% ] 61.73% | 424,662 | 7.7% |
[ 62.0% - 62.5% ] 62.27% | 435,532 | 9.2% |
[ 62.5% - 63.0% ] 62.78% | 517,078 | 7.1% |
[ 63.0% - 63.5% ] 63.24% | 300,738 | 7.3% |
[ 63.5% - 64.0% ] 63.75% | 418,331 | 7.6% |
[ 64.0% - 64.5% ] 64.30% | 1,054,873 | 8.0% |
[ 64.5% - 65.0% ] 64.71% | 326,768 | 6.6% |
[ 65.0% - 65.5% ] 65.21% | 550,411 | 8.3% |
[ 65.5% - 66.0% ] 65.77% | 282,642 | 8.3% |
[ 66.0% - 66.5% ] 66.29% | 269,706 | 7.5% |
[ 66.5% - 67.0% ] 66.83% | 340,782 | 7.4% |
[ 67.0% - 67.5% ] 67.20% | 242,769 | 10.8% |
[ 67.5% - 68.0% ] 67.68% | 191,613 | 9.2% |
[ 68.0% - 68.5% ] 68.16% | 156,553 | 9.9% |
[ 68.5% - 69.0% ] 68.63% | 498,971 | 7.5% |
[ 69.0% - 69.5% ] 69.27% | 206,529 | 9.4% |
[ 69.5% - 70.0% ] 69.77% | 132,844 | 8.6% |
[ 70.0% - 70.5% ] 70.26% | 276,224 | 8.6% |
[ 70.5% - 71.0% ] 70.70% | 389,063 | 7.9% |
[ 71.0% - 71.5% ] 71.27% | 302,737 | 8.6% |
[ 71.5% - 72.0% ] 71.71% | 223,828 | 8.4% |
[ 72.0% - 72.5% ] 72.20% | 235,057 | 11.2% |
[ 72.5% - 73.0% ] 72.65% | 181,376 | 9.8% |
[ 73.0% - 73.5% ] 73.16% | 265,102 | 10.8% |
[ 73.5% - 74.0% ] 73.78% | 355,939 | 9.0% |
[ 74.0% - 74.5% ] 74.25% | 248,772 | 11.7% |
[ 74.5% - 75.0% ] 74.67% | 275,497 | 8.5% |
[ 75.0% - 75.5% ] 75.24% | 180,370 | 7.9% |
[ 75.5% - 76.0% ] 75.77% | 254,465 | 9.6% |
[ 76.0% - 76.5% ] 76.30% | 238,773 | 10.0% |
[ 76.5% - 77.0% ] 76.66% | 111,799 | 8.3% |
[ 77.0% - 77.5% ] 77.38% | 232,771 | 8.3% |
[ 77.5% - 78.0% ] 77.78% | 840,919 | 13.1% |
[ 78.0% - 78.5% ] 78.22% | 230,805 | 8.7% |
[ 78.5% - 79.0% ] 78.83% | 262,433 | 10.8% |
[ 79.0% - 79.5% ] 79.27% | 270,238 | 10.2% |
[ 79.5% - 80.0% ] 79.70% | 130,227 | 12.2% |
[ 80.0% - 80.5% ] 80.21% | 286,640 | 9.3% |
[ 80.5% - 81.0% ] 80.65% | 233,321 | 9.5% |
[ 81.0% - 81.5% ] 81.29% | 240,301 | 8.4% |
[ 81.5% - 82.0% ] 81.69% | 300,055 | 7.0% |
[ 82.0% - 82.5% ] 82.19% | 443,991 | 10.5% |
[ 82.5% - 83.0% ] 82.75% | 165,952 | 7.7% |
[ 83.0% - 83.5% ] 83.34% | 87,961 | 11.5% |
[ 83.5% - 84.0% ] 83.88% | 63,929 | 11.4% |
[ 84.0% - 84.5% ] 84.33% | 187,697 | 8.3% |
[ 84.5% - 85.0% ] 84.73% | 166,359 | 9.1% |
[ 85.0% - 85.5% ] 85.25% | 143,736 | 11.2% |
[ 85.5% - 86.0% ] 85.78% | 143,857 | 10.4% |
[ 86.0% - 86.5% ] 86.33% | 144,912 | 9.7% |
[ 86.5% - 87.0% ] 86.65% | 270,320 | 10.2% |
[ 87.0% - 87.5% ] 87.27% | 174,992 | 7.6% |
[ 87.5% - 88.0% ] 87.74% | 209,877 | 9.1% |
[ 88.0% - 88.5% ] 88.28% | 149,335 | 10.8% |
[ 88.5% - 89.0% ] 88.77% | 207,147 | 12.5% |
[ 89.0% - 89.5% ] 89.17% | 153,165 | 10.9% |
[ 89.5% - 90.0% ] 89.70% | 226,078 | 10.2% |
[ 90.0% - 90.5% ] 90.19% | 87,355 | 12.7% |
[ 90.5% - 91.0% ] 90.87% | 107,664 | 10.2% |
[ 91.0% - 91.5% ] 91.23% | 371,056 | 11.5% |
[ 91.5% - 92.0% ] 91.80% | 140,721 | 14.0% |
[ 92.0% - 92.5% ] 92.26% | 98,105 | 11.6% |
[ 92.5% - 93.0% ] 92.70% | 161,890 | 13.5% |
[ 93.0% - 93.5% ] 93.22% | 188,401 | 13.4% |
[ 93.5% - 94.0% ] 93.70% | 269,057 | 13.3% |
[ 94.0% - 94.5% ] 94.37% | 117,078 | 15.0% |
[ 94.5% - 95.0% ] 94.72% | 106,484 | 10.5% |
[ 95.0% - 95.5% ] 95.24% | 86,320 | 16.0% |
[ 95.5% - 96.0% ] 95.80% | 80,499 | 15.6% |
[ 96.0% - 96.5% ] 96.26% | 46,388 | 15.7% |
[ 96.5% - 97.0% ] 96.82% | 13,999 | 17.9% |
[ 97.0% - 97.5% ] 97.19% | 4,949 | 12.2% |
[ 97.5% - 98.0% ] 97.77% | 2,650 | 13.1% |
[ 98.0% - 98.5% ] 98.31% | 9,610 | 9.4% |
[ 98.5% - 99.0% ] 98.63% | 16,097 | 11.3% |
[ 99.0% - 99.5% ] 99.21% | 15,160 | 14.0% |
[ 99.5% - 100.0% ] 99.95% | 13,117 | 14.8% |