Black/African American Single Father Poverty
COMPARE
Black/African American
Select to Compare
Single Father Poverty
Black/African American Single Father Poverty
20.4%
POVERTY | SINGLE FATHERS
0.0/ 100
METRIC RATING
325th/ 347
METRIC RANK
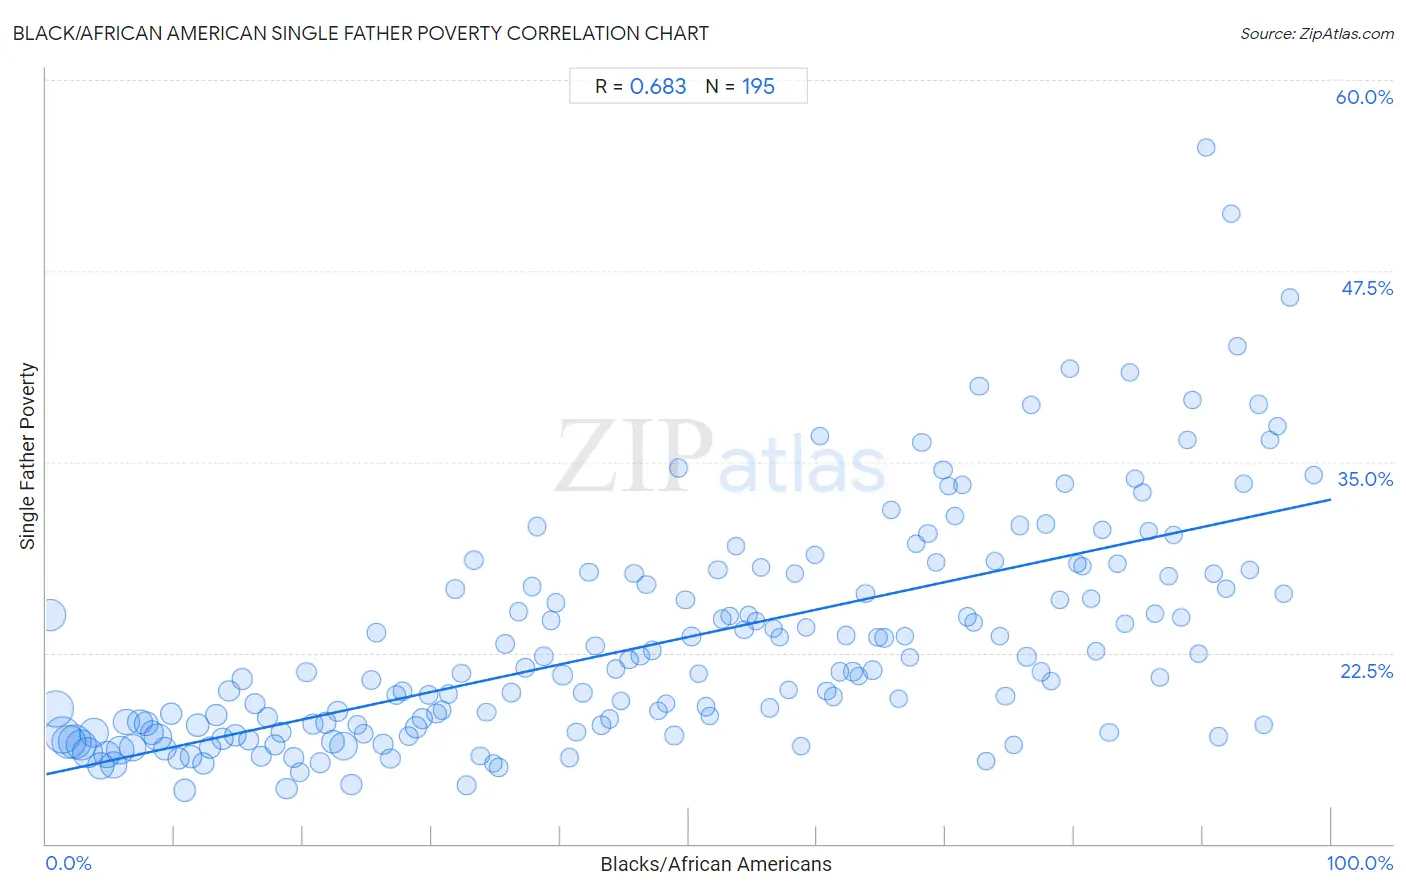
Black/African American Single Father Poverty Correlation Chart
The statistical analysis conducted on geographies consisting of 410,273,271 people shows a significant positive correlation between the proportion of Blacks/African Americans and poverty level among single fathers in the United States with a correlation coefficient (R) of 0.683 and weighted average of 20.4%. On average, for every 1% (one percent) increase in Blacks/African Americans within a typical geography, there is an increase of 0.18% in poverty level among single fathers.
It is essential to understand that the correlation between the percentage of Blacks/African Americans and poverty level among single fathers does not imply a direct cause-and-effect relationship. It remains uncertain whether the presence of Blacks/African Americans influences an upward or downward trend in the level of poverty level among single fathers within an area, or if Blacks/African Americans simply ended up residing in those areas with higher or lower levels of poverty level among single fathers due to other factors.
Demographics Similar to Blacks/African Americans by Single Father Poverty
In terms of single father poverty, the demographic groups most similar to Blacks/African Americans are Immigrants from Yemen (20.6%, a difference of 1.0%), American (20.1%, a difference of 1.6%), Choctaw (20.7%, a difference of 1.7%), Pennsylvania German (20.0%, a difference of 1.8%), and Creek (19.8%, a difference of 2.7%).
| Demographics | Rating | Rank | Single Father Poverty |
| Dutch West Indians | 0.0 /100 | #318 | Tragic 19.2% |
| Slovaks | 0.0 /100 | #319 | Tragic 19.3% |
| Inupiat | 0.0 /100 | #320 | Tragic 19.5% |
| Cherokee | 0.0 /100 | #321 | Tragic 19.6% |
| Creek | 0.0 /100 | #322 | Tragic 19.8% |
| Pennsylvania Germans | 0.0 /100 | #323 | Tragic 20.0% |
| Americans | 0.0 /100 | #324 | Tragic 20.1% |
| Blacks/African Americans | 0.0 /100 | #325 | Tragic 20.4% |
| Immigrants from Yemen | 0.0 /100 | #326 | Tragic 20.6% |
| Choctaw | 0.0 /100 | #327 | Tragic 20.7% |
| Pueblo | 0.0 /100 | #328 | Tragic 21.1% |
| Colville | 0.0 /100 | #329 | Tragic 21.4% |
| Paiute | 0.0 /100 | #330 | Tragic 21.6% |
| Central American Indians | 0.0 /100 | #331 | Tragic 21.7% |
| Tohono O'odham | 0.0 /100 | #332 | Tragic 22.0% |
Black/African American Single Father Poverty Correlation Summary
| Measurement | Black/African American Data | Single Father Poverty Data |
| Minimum | 0.27% | 13.5% |
| Maximum | 98.6% | 55.6% |
| Range | 98.4% | 42.1% |
| Mean | 48.8% | 23.3% |
| Median | 48.9% | 21.3% |
| Interquartile 25% (IQ1) | 24.2% | 17.6% |
| Interquartile 75% (IQ3) | 73.2% | 27.7% |
| Interquartile Range (IQR) | 48.9% | 10.1% |
| Standard Deviation (Sample) | 28.2% | 7.4% |
| Standard Deviation (Population) | 28.2% | 7.4% |
Correlation Details
| Black/African American Percentile | Sample Size | Single Father Poverty |
[ 0.0% - 0.5% ] 0.27% | 14,747,452 | 25.0% |
[ 0.5% - 1.0% ] 0.74% | 19,878,405 | 18.8% |
[ 1.0% - 1.5% ] 1.23% | 20,351,583 | 17.1% |
[ 1.5% - 2.0% ] 1.73% | 17,575,315 | 16.7% |
[ 2.0% - 2.5% ] 2.24% | 16,476,167 | 16.7% |
[ 2.5% - 3.0% ] 2.76% | 13,575,656 | 16.5% |
[ 3.0% - 3.5% ] 3.25% | 13,418,037 | 16.0% |
[ 3.5% - 4.0% ] 3.74% | 11,738,462 | 17.3% |
[ 4.0% - 4.5% ] 4.24% | 10,454,071 | 15.1% |
[ 4.5% - 5.0% ] 4.74% | 10,552,531 | 15.8% |
[ 5.0% - 5.5% ] 5.24% | 9,743,360 | 15.1% |
[ 5.5% - 6.0% ] 5.77% | 10,495,630 | 16.1% |
[ 6.0% - 6.5% ] 6.23% | 9,221,034 | 18.0% |
[ 6.5% - 7.0% ] 6.71% | 9,053,322 | 16.3% |
[ 7.0% - 7.5% ] 7.27% | 8,119,458 | 18.0% |
[ 7.5% - 8.0% ] 7.75% | 6,876,209 | 17.9% |
[ 8.0% - 8.5% ] 8.23% | 6,417,800 | 17.3% |
[ 8.5% - 9.0% ] 8.68% | 10,220,167 | 17.0% |
[ 9.0% - 9.5% ] 9.23% | 5,639,554 | 16.2% |
[ 9.5% - 10.0% ] 9.76% | 4,183,043 | 18.5% |
[ 10.0% - 10.5% ] 10.27% | 4,593,803 | 15.6% |
[ 10.5% - 11.0% ] 10.76% | 4,778,518 | 13.5% |
[ 11.0% - 11.5% ] 11.27% | 4,638,158 | 15.7% |
[ 11.5% - 12.0% ] 11.75% | 5,038,191 | 17.8% |
[ 12.0% - 12.5% ] 12.24% | 4,694,938 | 15.2% |
[ 12.5% - 13.0% ] 12.73% | 3,973,789 | 16.3% |
[ 13.0% - 13.5% ] 13.27% | 3,976,582 | 18.4% |
[ 13.5% - 14.0% ] 13.71% | 4,016,771 | 16.9% |
[ 14.0% - 14.5% ] 14.21% | 3,365,057 | 20.0% |
[ 14.5% - 15.0% ] 14.73% | 3,321,562 | 17.1% |
[ 15.0% - 15.5% ] 15.25% | 3,354,910 | 20.8% |
[ 15.5% - 16.0% ] 15.74% | 2,732,758 | 16.8% |
[ 16.0% - 16.5% ] 16.25% | 2,732,446 | 19.1% |
[ 16.5% - 17.0% ] 16.75% | 2,686,988 | 15.7% |
[ 17.0% - 17.5% ] 17.22% | 2,778,259 | 18.3% |
[ 17.5% - 18.0% ] 17.76% | 2,990,722 | 16.5% |
[ 18.0% - 18.5% ] 18.25% | 3,110,065 | 17.3% |
[ 18.5% - 19.0% ] 18.72% | 3,028,771 | 13.6% |
[ 19.0% - 19.5% ] 19.23% | 2,642,974 | 15.6% |
[ 19.5% - 20.0% ] 19.76% | 1,865,215 | 14.7% |
[ 20.0% - 20.5% ] 20.24% | 2,072,682 | 21.2% |
[ 20.5% - 21.0% ] 20.76% | 1,772,122 | 17.8% |
[ 21.0% - 21.5% ] 21.29% | 2,244,184 | 15.3% |
[ 21.5% - 22.0% ] 21.77% | 3,424,622 | 17.9% |
[ 22.0% - 22.5% ] 22.32% | 4,391,343 | 16.7% |
[ 22.5% - 23.0% ] 22.71% | 2,482,684 | 18.7% |
[ 23.0% - 23.5% ] 23.15% | 11,261,175 | 16.4% |
[ 23.5% - 24.0% ] 23.76% | 3,567,606 | 13.9% |
[ 24.0% - 24.5% ] 24.22% | 1,719,921 | 17.8% |
[ 24.5% - 25.0% ] 24.71% | 1,365,493 | 17.2% |
[ 25.0% - 25.5% ] 25.27% | 1,272,096 | 20.7% |
[ 25.5% - 26.0% ] 25.72% | 1,083,143 | 23.8% |
[ 26.0% - 26.5% ] 26.21% | 1,523,211 | 16.5% |
[ 26.5% - 27.0% ] 26.76% | 1,851,466 | 15.6% |
[ 27.0% - 27.5% ] 27.23% | 1,274,293 | 19.7% |
[ 27.5% - 28.0% ] 27.77% | 1,277,184 | 20.0% |
[ 28.0% - 28.5% ] 28.20% | 1,612,525 | 17.1% |
[ 28.5% - 29.0% ] 28.81% | 4,492,746 | 17.6% |
[ 29.0% - 29.5% ] 29.24% | 3,049,311 | 18.2% |
[ 29.5% - 30.0% ] 29.77% | 1,632,392 | 19.7% |
[ 30.0% - 30.5% ] 30.37% | 1,990,660 | 18.5% |
[ 30.5% - 31.0% ] 30.81% | 965,668 | 18.7% |
[ 31.0% - 31.5% ] 31.30% | 712,871 | 19.8% |
[ 31.5% - 32.0% ] 31.84% | 694,672 | 26.7% |
[ 32.0% - 32.5% ] 32.28% | 962,850 | 21.2% |
[ 32.5% - 33.0% ] 32.72% | 581,973 | 13.8% |
[ 33.0% - 33.5% ] 33.25% | 1,005,637 | 28.6% |
[ 33.5% - 34.0% ] 33.75% | 718,486 | 15.7% |
[ 34.0% - 34.5% ] 34.28% | 691,650 | 18.6% |
[ 34.5% - 35.0% ] 34.79% | 689,929 | 15.3% |
[ 35.0% - 35.5% ] 35.24% | 1,599,818 | 15.0% |
[ 35.5% - 36.0% ] 35.74% | 1,037,181 | 23.1% |
[ 36.0% - 36.5% ] 36.23% | 1,090,136 | 19.9% |
[ 36.5% - 37.0% ] 36.77% | 399,067 | 25.2% |
[ 37.0% - 37.5% ] 37.25% | 832,118 | 21.5% |
[ 37.5% - 38.0% ] 37.80% | 760,768 | 26.8% |
[ 38.0% - 38.5% ] 38.18% | 857,160 | 30.8% |
[ 38.5% - 39.0% ] 38.70% | 1,265,001 | 22.3% |
[ 39.0% - 39.5% ] 39.30% | 398,164 | 24.6% |
[ 39.5% - 40.0% ] 39.68% | 801,239 | 25.8% |
[ 40.0% - 40.5% ] 40.15% | 2,499,895 | 21.0% |
[ 40.5% - 41.0% ] 40.72% | 1,071,048 | 15.6% |
[ 41.0% - 41.5% ] 41.27% | 847,931 | 17.3% |
[ 41.5% - 42.0% ] 41.76% | 768,854 | 19.9% |
[ 42.0% - 42.5% ] 42.26% | 640,659 | 27.8% |
[ 42.5% - 43.0% ] 42.72% | 723,588 | 22.9% |
[ 43.0% - 43.5% ] 43.18% | 897,267 | 17.8% |
[ 43.5% - 44.0% ] 43.83% | 849,616 | 18.2% |
[ 44.0% - 44.5% ] 44.32% | 965,453 | 21.5% |
[ 44.5% - 45.0% ] 44.74% | 573,138 | 19.3% |
[ 45.0% - 45.5% ] 45.36% | 511,745 | 22.0% |
[ 45.5% - 46.0% ] 45.74% | 565,147 | 27.7% |
[ 46.0% - 46.5% ] 46.25% | 484,543 | 22.3% |
[ 46.5% - 47.0% ] 46.71% | 974,333 | 27.0% |
[ 47.0% - 47.5% ] 47.13% | 515,237 | 22.7% |
[ 47.5% - 48.0% ] 47.64% | 902,361 | 18.7% |
[ 48.0% - 48.5% ] 48.24% | 255,990 | 19.2% |
[ 48.5% - 49.0% ] 48.87% | 392,932 | 17.1% |
[ 49.0% - 49.5% ] 49.21% | 413,608 | 34.6% |
[ 49.5% - 50.0% ] 49.74% | 375,338 | 26.0% |
[ 50.0% - 50.5% ] 50.24% | 804,791 | 23.6% |
[ 50.5% - 51.0% ] 50.81% | 95,641 | 21.1% |
[ 51.0% - 51.5% ] 51.32% | 418,626 | 19.0% |
[ 51.5% - 52.0% ] 51.62% | 573,745 | 18.4% |
[ 52.0% - 52.5% ] 52.28% | 464,333 | 27.9% |
[ 52.5% - 53.0% ] 52.61% | 600,859 | 24.7% |
[ 53.0% - 53.5% ] 53.20% | 615,623 | 24.9% |
[ 53.5% - 54.0% ] 53.72% | 329,691 | 29.5% |
[ 54.0% - 54.5% ] 54.33% | 534,041 | 24.0% |
[ 54.5% - 55.0% ] 54.69% | 270,847 | 25.0% |
[ 55.0% - 55.5% ] 55.28% | 322,234 | 24.6% |
[ 55.5% - 56.0% ] 55.64% | 323,850 | 28.1% |
[ 56.0% - 56.5% ] 56.33% | 488,640 | 18.9% |
[ 56.5% - 57.0% ] 56.63% | 392,153 | 24.1% |
[ 57.0% - 57.5% ] 57.10% | 644,704 | 23.5% |
[ 57.5% - 58.0% ] 57.77% | 250,814 | 20.1% |
[ 58.0% - 58.5% ] 58.22% | 283,338 | 27.7% |
[ 58.5% - 59.0% ] 58.77% | 245,195 | 16.4% |
[ 59.0% - 59.5% ] 59.17% | 230,687 | 24.2% |
[ 59.5% - 60.0% ] 59.80% | 282,705 | 28.9% |
[ 60.0% - 60.5% ] 60.21% | 202,137 | 36.7% |
[ 60.5% - 61.0% ] 60.74% | 377,645 | 20.0% |
[ 61.0% - 61.5% ] 61.25% | 765,628 | 19.7% |
[ 61.5% - 62.0% ] 61.72% | 306,576 | 21.3% |
[ 62.0% - 62.5% ] 62.27% | 359,504 | 23.6% |
[ 62.5% - 63.0% ] 62.78% | 441,911 | 21.3% |
[ 63.0% - 63.5% ] 63.25% | 256,745 | 21.0% |
[ 63.5% - 64.0% ] 63.76% | 331,435 | 26.3% |
[ 64.0% - 64.5% ] 64.30% | 989,870 | 21.3% |
[ 64.5% - 65.0% ] 64.72% | 280,246 | 23.5% |
[ 65.0% - 65.5% ] 65.21% | 491,742 | 23.5% |
[ 65.5% - 66.0% ] 65.78% | 136,936 | 31.9% |
[ 66.0% - 66.5% ] 66.31% | 203,962 | 19.5% |
[ 66.5% - 67.0% ] 66.83% | 241,745 | 23.6% |
[ 67.0% - 67.5% ] 67.20% | 220,647 | 22.2% |
[ 67.5% - 68.0% ] 67.69% | 147,353 | 29.6% |
[ 68.0% - 68.5% ] 68.14% | 102,072 | 36.3% |
[ 68.5% - 69.0% ] 68.61% | 405,257 | 30.3% |
[ 69.0% - 69.5% ] 69.28% | 164,309 | 28.5% |
[ 69.5% - 70.0% ] 69.80% | 105,646 | 34.4% |
[ 70.0% - 70.5% ] 70.26% | 250,212 | 33.4% |
[ 70.5% - 71.0% ] 70.70% | 349,978 | 31.4% |
[ 71.0% - 71.5% ] 71.27% | 211,536 | 33.5% |
[ 71.5% - 72.0% ] 71.71% | 210,364 | 24.9% |
[ 72.0% - 72.5% ] 72.20% | 225,657 | 24.5% |
[ 72.5% - 73.0% ] 72.61% | 108,180 | 40.0% |
[ 73.0% - 73.5% ] 73.16% | 222,418 | 15.4% |
[ 73.5% - 74.0% ] 73.80% | 306,260 | 28.5% |
[ 74.0% - 74.5% ] 74.26% | 233,320 | 23.6% |
[ 74.5% - 75.0% ] 74.65% | 249,659 | 19.7% |
[ 75.0% - 75.5% ] 75.26% | 139,834 | 16.5% |
[ 75.5% - 76.0% ] 75.75% | 190,496 | 30.8% |
[ 76.0% - 76.5% ] 76.30% | 222,509 | 22.2% |
[ 76.5% - 77.0% ] 76.62% | 80,149 | 38.7% |
[ 77.0% - 77.5% ] 77.39% | 209,343 | 21.3% |
[ 77.5% - 78.0% ] 77.78% | 819,112 | 30.9% |
[ 78.0% - 78.5% ] 78.18% | 166,575 | 20.7% |
[ 78.5% - 79.0% ] 78.85% | 231,769 | 26.0% |
[ 79.0% - 79.5% ] 79.27% | 246,949 | 33.6% |
[ 79.5% - 80.0% ] 79.71% | 116,047 | 41.1% |
[ 80.0% - 80.5% ] 80.21% | 249,226 | 28.4% |
[ 80.5% - 81.0% ] 80.64% | 179,512 | 28.2% |
[ 81.0% - 81.5% ] 81.31% | 208,016 | 26.1% |
[ 81.5% - 82.0% ] 81.68% | 275,347 | 22.6% |
[ 82.0% - 82.5% ] 82.19% | 426,007 | 30.5% |
[ 82.5% - 83.0% ] 82.73% | 148,530 | 17.3% |
[ 83.0% - 83.5% ] 83.33% | 47,607 | 28.3% |
[ 83.5% - 84.0% ] 83.90% | 53,664 | 24.4% |
[ 84.0% - 84.5% ] 84.33% | 179,183 | 40.9% |
[ 84.5% - 85.0% ] 84.72% | 144,987 | 33.9% |
[ 85.0% - 85.5% ] 85.27% | 127,301 | 33.0% |
[ 85.5% - 86.0% ] 85.82% | 103,937 | 30.5% |
[ 86.0% - 86.5% ] 86.32% | 115,969 | 25.1% |
[ 86.5% - 87.0% ] 86.65% | 248,950 | 20.9% |
[ 87.0% - 87.5% ] 87.33% | 116,941 | 27.6% |
[ 87.5% - 88.0% ] 87.75% | 173,212 | 30.2% |
[ 88.0% - 88.5% ] 88.29% | 105,629 | 24.8% |
[ 88.5% - 89.0% ] 88.78% | 151,663 | 36.5% |
[ 89.0% - 89.5% ] 89.17% | 123,316 | 39.0% |
[ 89.5% - 90.0% ] 89.70% | 217,812 | 22.5% |
[ 90.0% - 90.5% ] 90.23% | 39,035 | 55.6% |
[ 90.5% - 91.0% ] 90.87% | 100,090 | 27.7% |
[ 91.0% - 91.5% ] 91.23% | 366,590 | 17.0% |
[ 91.5% - 92.0% ] 91.79% | 112,411 | 26.7% |
[ 92.0% - 92.5% ] 92.25% | 90,760 | 51.2% |
[ 92.5% - 93.0% ] 92.68% | 140,115 | 42.6% |
[ 93.0% - 93.5% ] 93.21% | 173,811 | 33.6% |
[ 93.5% - 94.0% ] 93.71% | 255,047 | 28.0% |
[ 94.0% - 94.5% ] 94.40% | 102,352 | 38.8% |
[ 94.5% - 95.0% ] 94.76% | 85,527 | 17.8% |
[ 95.0% - 95.5% ] 95.22% | 79,202 | 36.5% |
[ 95.5% - 96.0% ] 95.80% | 67,110 | 37.4% |
[ 96.0% - 96.5% ] 96.27% | 43,506 | 26.4% |
[ 96.5% - 97.0% ] 96.80% | 2,253 | 45.8% |
[ 98.5% - 99.0% ] 98.63% | 12,740 | 34.1% |