Black/African American vs Uruguayan Single Male Poverty
COMPARE
Black/African American
Uruguayan
Single Male Poverty
Single Male Poverty Comparison
Blacks/African Americans
Uruguayans
16.2%
SINGLE MALE POVERTY
0.0/ 100
METRIC RATING
317th/ 347
METRIC RANK
11.9%
SINGLE MALE POVERTY
99.4/ 100
METRIC RATING
75th/ 347
METRIC RANK
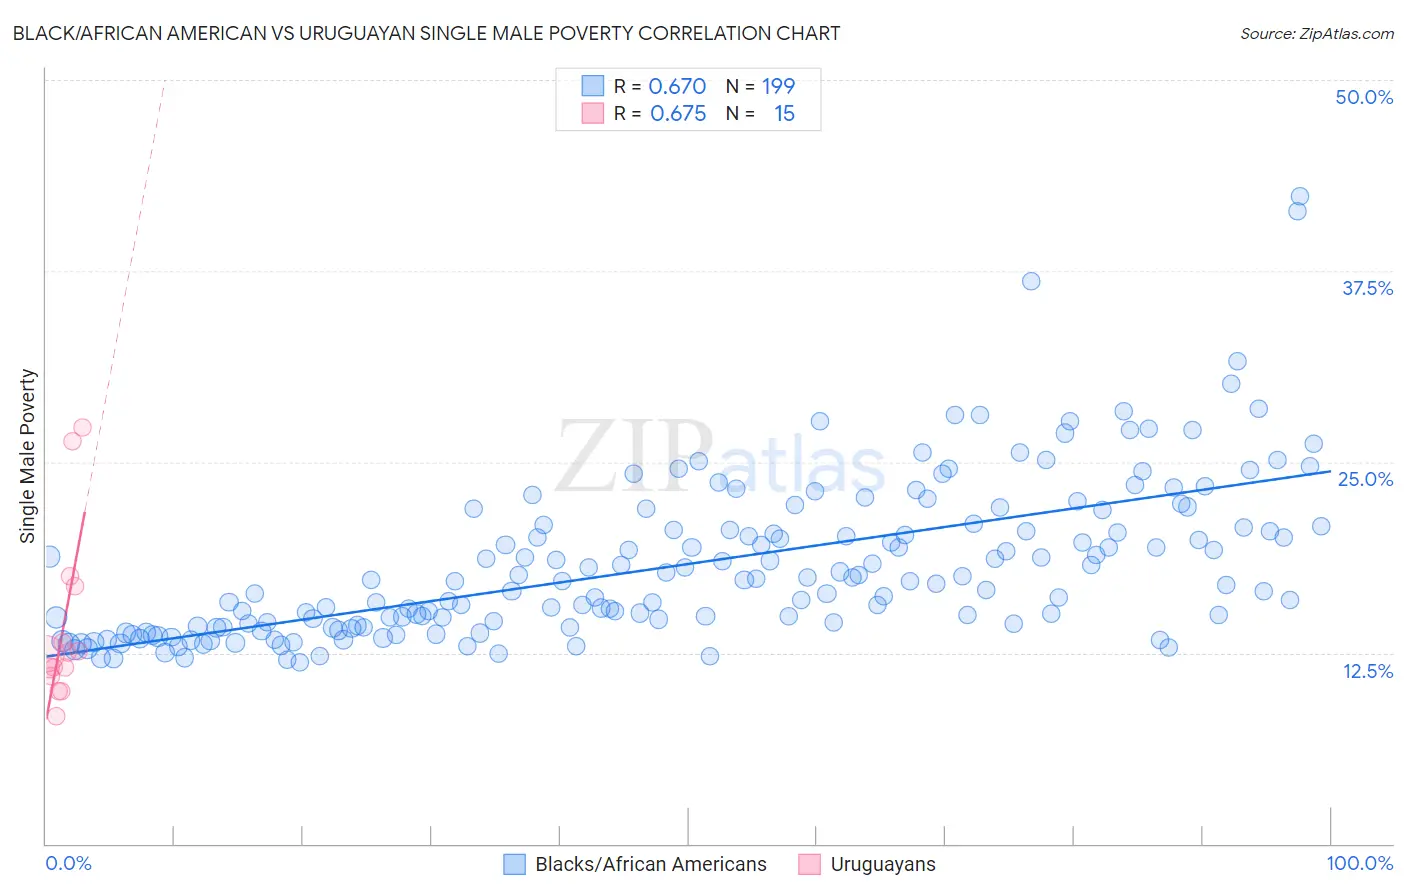
Black/African American vs Uruguayan Single Male Poverty Correlation Chart
The statistical analysis conducted on geographies consisting of 472,674,082 people shows a significant positive correlation between the proportion of Blacks/African Americans and poverty level among single males in the United States with a correlation coefficient (R) of 0.670 and weighted average of 16.2%. Similarly, the statistical analysis conducted on geographies consisting of 136,478,006 people shows a significant positive correlation between the proportion of Uruguayans and poverty level among single males in the United States with a correlation coefficient (R) of 0.675 and weighted average of 11.9%, a difference of 35.5%.
Single Male Poverty Correlation Summary
| Measurement | Black/African American | Uruguayan |
| Minimum | 11.9% | 8.4% |
| Maximum | 42.4% | 27.3% |
| Range | 30.6% | 18.9% |
| Mean | 18.3% | 14.2% |
| Median | 17.2% | 12.4% |
| Interquartile 25% (IQ1) | 14.2% | 11.0% |
| Interquartile 75% (IQ3) | 20.7% | 16.9% |
| Interquartile Range (IQR) | 6.5% | 5.9% |
| Standard Deviation (Sample) | 5.2% | 5.7% |
| Standard Deviation (Population) | 5.2% | 5.5% |
Similar Demographics by Single Male Poverty
Demographics Similar to Blacks/African Americans by Single Male Poverty
In terms of single male poverty, the demographic groups most similar to Blacks/African Americans are Dutch West Indian (16.1%, a difference of 0.34%), Cheyenne (16.1%, a difference of 0.48%), Alaskan Athabascan (16.1%, a difference of 0.53%), Chickasaw (16.3%, a difference of 0.80%), and Cherokee (16.1%, a difference of 0.82%).
| Demographics | Rating | Rank | Single Male Poverty |
| Yakama | 0.0 /100 | #310 | Tragic 15.9% |
| Seminole | 0.0 /100 | #311 | Tragic 16.0% |
| Comanche | 0.0 /100 | #312 | Tragic 16.0% |
| Cherokee | 0.0 /100 | #313 | Tragic 16.1% |
| Alaskan Athabascans | 0.0 /100 | #314 | Tragic 16.1% |
| Cheyenne | 0.0 /100 | #315 | Tragic 16.1% |
| Dutch West Indians | 0.0 /100 | #316 | Tragic 16.1% |
| Blacks/African Americans | 0.0 /100 | #317 | Tragic 16.2% |
| Chickasaw | 0.0 /100 | #318 | Tragic 16.3% |
| Chippewa | 0.0 /100 | #319 | Tragic 16.4% |
| Marshallese | 0.0 /100 | #320 | Tragic 16.4% |
| Osage | 0.0 /100 | #321 | Tragic 16.5% |
| Shoshone | 0.0 /100 | #322 | Tragic 16.7% |
| Creek | 0.0 /100 | #323 | Tragic 16.8% |
| Immigrants | Yemen | 0.0 /100 | #324 | Tragic 16.9% |
Demographics Similar to Uruguayans by Single Male Poverty
In terms of single male poverty, the demographic groups most similar to Uruguayans are Immigrants from Northern Africa (11.9%, a difference of 0.020%), Chilean (11.9%, a difference of 0.19%), Argentinean (11.9%, a difference of 0.25%), Immigrants from Malaysia (12.0%, a difference of 0.29%), and Immigrants from Argentina (11.9%, a difference of 0.37%).
| Demographics | Rating | Rank | Single Male Poverty |
| Immigrants | Croatia | 99.6 /100 | #68 | Exceptional 11.9% |
| Immigrants | Russia | 99.6 /100 | #69 | Exceptional 11.9% |
| Immigrants | Nepal | 99.6 /100 | #70 | Exceptional 11.9% |
| Immigrants | Greece | 99.6 /100 | #71 | Exceptional 11.9% |
| Immigrants | Argentina | 99.5 /100 | #72 | Exceptional 11.9% |
| Argentineans | 99.5 /100 | #73 | Exceptional 11.9% |
| Chileans | 99.5 /100 | #74 | Exceptional 11.9% |
| Uruguayans | 99.4 /100 | #75 | Exceptional 11.9% |
| Immigrants | Northern Africa | 99.4 /100 | #76 | Exceptional 11.9% |
| Immigrants | Malaysia | 99.2 /100 | #77 | Exceptional 12.0% |
| Immigrants | Venezuela | 99.1 /100 | #78 | Exceptional 12.0% |
| Immigrants | Belgium | 99.0 /100 | #79 | Exceptional 12.0% |
| Armenians | 98.7 /100 | #80 | Exceptional 12.1% |
| Immigrants | South America | 98.7 /100 | #81 | Exceptional 12.1% |
| Immigrants | Colombia | 98.6 /100 | #82 | Exceptional 12.1% |