Black/African American Single Father Households
COMPARE
Black/African American
Select to Compare
Single Father Households
Black/African American Single Father Households
2.4%
SINGLE FATHER HOUSEHOLDS
9.7/ 100
METRIC RATING
226th/ 347
METRIC RANK
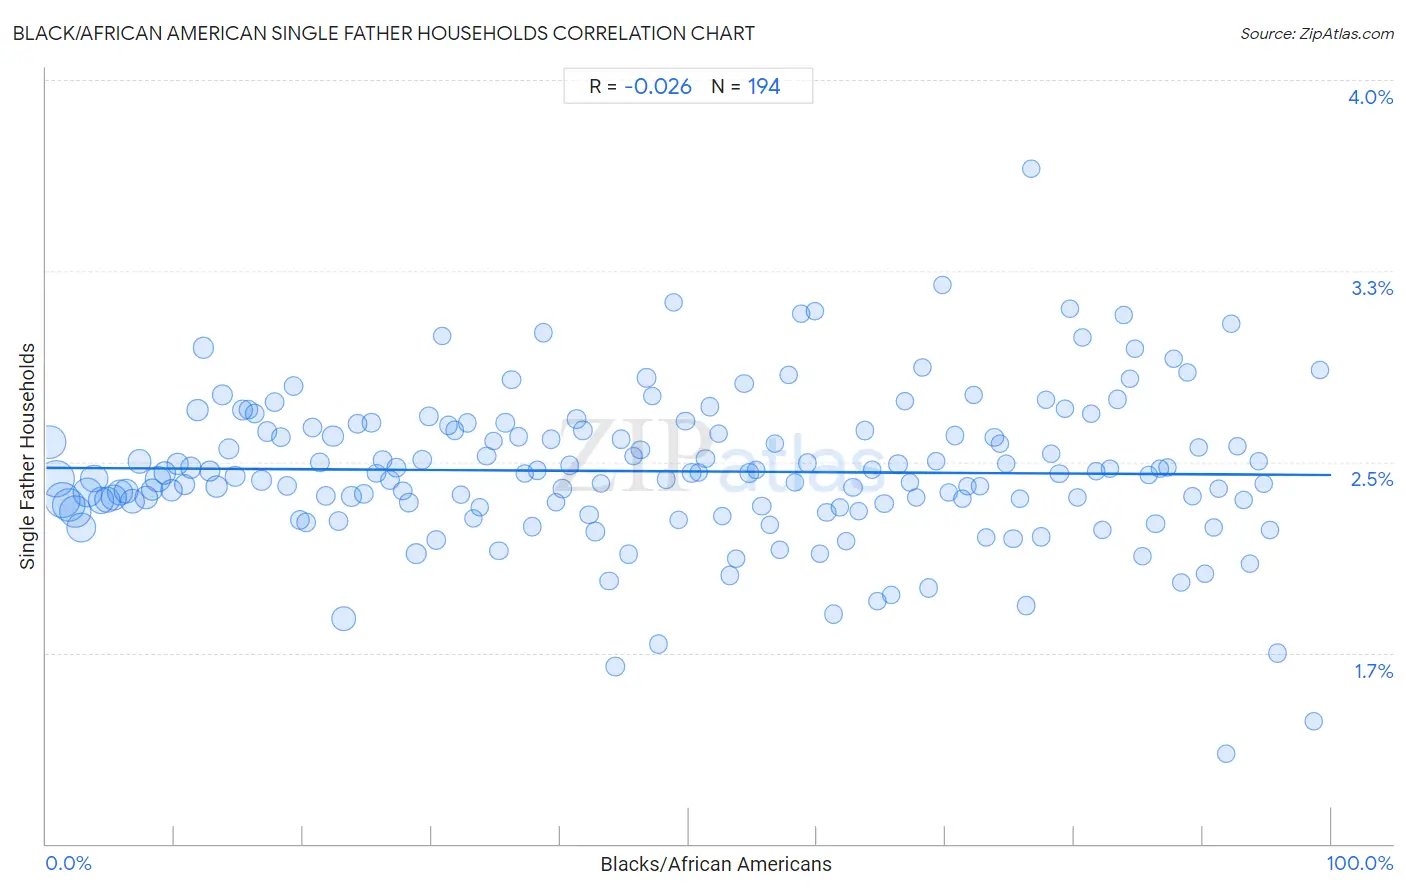
Black/African American Single Father Households Correlation Chart
The statistical analysis conducted on geographies consisting of 552,512,239 people shows no correlation between the proportion of Blacks/African Americans and percentage of single father households in the United States with a correlation coefficient (R) of -0.026 and weighted average of 2.4%. On average, for every 1% (one percent) increase in Blacks/African Americans within a typical geography, there is a decrease of 0.00028% in percentage of single father households.
It is essential to understand that the correlation between the percentage of Blacks/African Americans and percentage of single father households does not imply a direct cause-and-effect relationship. It remains uncertain whether the presence of Blacks/African Americans influences an upward or downward trend in the level of percentage of single father households within an area, or if Blacks/African Americans simply ended up residing in those areas with higher or lower levels of percentage of single father households due to other factors.
Demographics Similar to Blacks/African Americans by Single Father Households
In terms of single father households, the demographic groups most similar to Blacks/African Americans are Marshallese (2.4%, a difference of 0.010%), American (2.4%, a difference of 0.070%), Immigrants from Ghana (2.4%, a difference of 0.11%), Immigrants from Bahamas (2.4%, a difference of 0.19%), and Immigrants from Zaire (2.4%, a difference of 0.21%).
| Demographics | Rating | Rank | Single Father Households |
| Sudanese | 13.0 /100 | #219 | Poor 2.4% |
| Ghanaians | 12.9 /100 | #220 | Poor 2.4% |
| Immigrants from Burma/Myanmar | 12.1 /100 | #221 | Poor 2.4% |
| Immigrants from Eastern Africa | 11.9 /100 | #222 | Poor 2.4% |
| Immigrants from Uruguay | 11.0 /100 | #223 | Poor 2.4% |
| Immigrants from Bahamas | 10.6 /100 | #224 | Poor 2.4% |
| Marshallese | 9.7 /100 | #225 | Tragic 2.4% |
| Blacks/African Americans | 9.7 /100 | #226 | Tragic 2.4% |
| Americans | 9.3 /100 | #227 | Tragic 2.4% |
| Immigrants from Ghana | 9.1 /100 | #228 | Tragic 2.4% |
| Immigrants from Zaire | 8.6 /100 | #229 | Tragic 2.4% |
| Sub-Saharan Africans | 8.3 /100 | #230 | Tragic 2.4% |
| Nonimmigrants | 7.6 /100 | #231 | Tragic 2.4% |
| Pennsylvania Germans | 7.3 /100 | #232 | Tragic 2.4% |
| Immigrants from Western Africa | 7.0 /100 | #233 | Tragic 2.4% |
Black/African American Single Father Households Correlation Summary
| Measurement | Black/African American Data | Single Father Households Data |
| Minimum | 0.26% | 1.4% |
| Maximum | 99.2% | 3.7% |
| Range | 98.9% | 2.3% |
| Mean | 48.5% | 2.5% |
| Median | 48.6% | 2.5% |
| Interquartile 25% (IQ1) | 24.2% | 2.3% |
| Interquartile 75% (IQ3) | 72.6% | 2.6% |
| Interquartile Range (IQR) | 48.4% | 0.30% |
| Standard Deviation (Sample) | 28.1% | 0.30% |
| Standard Deviation (Population) | 28.0% | 0.30% |
Correlation Details
| Black/African American Percentile | Sample Size | Single Father Households |
[ 0.0% - 0.5% ] 0.26% | 28,569,174 | 2.6% |
[ 0.5% - 1.0% ] 0.74% | 34,010,353 | 2.4% |
[ 1.0% - 1.5% ] 1.23% | 31,496,878 | 2.4% |
[ 1.5% - 2.0% ] 1.74% | 27,234,287 | 2.3% |
[ 2.0% - 2.5% ] 2.24% | 23,821,977 | 2.3% |
[ 2.5% - 3.0% ] 2.75% | 20,303,991 | 2.2% |
[ 3.0% - 3.5% ] 3.25% | 20,354,494 | 2.4% |
[ 3.5% - 4.0% ] 3.74% | 16,549,577 | 2.4% |
[ 4.0% - 4.5% ] 4.25% | 14,356,718 | 2.3% |
[ 4.5% - 5.0% ] 4.74% | 14,574,212 | 2.4% |
[ 5.0% - 5.5% ] 5.24% | 13,370,560 | 2.4% |
[ 5.5% - 6.0% ] 5.76% | 13,552,086 | 2.4% |
[ 6.0% - 6.5% ] 6.23% | 11,620,993 | 2.4% |
[ 6.5% - 7.0% ] 6.72% | 11,541,745 | 2.3% |
[ 7.0% - 7.5% ] 7.26% | 10,865,703 | 2.5% |
[ 7.5% - 8.0% ] 7.75% | 8,976,389 | 2.4% |
[ 8.0% - 8.5% ] 8.24% | 8,137,937 | 2.4% |
[ 8.5% - 9.0% ] 8.69% | 12,271,118 | 2.4% |
[ 9.0% - 9.5% ] 9.24% | 7,523,742 | 2.5% |
[ 9.5% - 10.0% ] 9.75% | 5,821,132 | 2.4% |
[ 10.0% - 10.5% ] 10.26% | 6,316,397 | 2.5% |
[ 10.5% - 11.0% ] 10.76% | 5,941,641 | 2.4% |
[ 11.0% - 11.5% ] 11.27% | 5,930,204 | 2.5% |
[ 11.5% - 12.0% ] 11.75% | 6,548,099 | 2.7% |
[ 12.0% - 12.5% ] 12.24% | 5,775,424 | 2.9% |
[ 12.5% - 13.0% ] 12.73% | 5,154,060 | 2.5% |
[ 13.0% - 13.5% ] 13.26% | 5,553,615 | 2.4% |
[ 13.5% - 14.0% ] 13.72% | 4,926,618 | 2.8% |
[ 14.0% - 14.5% ] 14.23% | 4,285,554 | 2.6% |
[ 14.5% - 15.0% ] 14.73% | 4,121,527 | 2.4% |
[ 15.0% - 15.5% ] 15.25% | 4,340,112 | 2.7% |
[ 15.5% - 16.0% ] 15.75% | 3,559,529 | 2.7% |
[ 16.0% - 16.5% ] 16.25% | 3,203,017 | 2.7% |
[ 16.5% - 17.0% ] 16.75% | 3,348,033 | 2.4% |
[ 17.0% - 17.5% ] 17.22% | 3,441,337 | 2.6% |
[ 17.5% - 18.0% ] 17.77% | 3,601,698 | 2.7% |
[ 18.0% - 18.5% ] 18.26% | 3,553,573 | 2.6% |
[ 18.5% - 19.0% ] 18.73% | 3,646,419 | 2.4% |
[ 19.0% - 19.5% ] 19.23% | 2,992,384 | 2.8% |
[ 19.5% - 20.0% ] 19.75% | 2,510,214 | 2.3% |
[ 20.0% - 20.5% ] 20.23% | 2,701,837 | 2.3% |
[ 20.5% - 21.0% ] 20.77% | 2,326,921 | 2.6% |
[ 21.0% - 21.5% ] 21.29% | 2,672,266 | 2.5% |
[ 21.5% - 22.0% ] 21.77% | 3,713,741 | 2.4% |
[ 22.0% - 22.5% ] 22.31% | 4,832,398 | 2.6% |
[ 22.5% - 23.0% ] 22.72% | 3,000,445 | 2.3% |
[ 23.0% - 23.5% ] 23.15% | 11,578,893 | 1.9% |
[ 23.5% - 24.0% ] 23.75% | 3,942,908 | 2.4% |
[ 24.0% - 24.5% ] 24.22% | 2,167,871 | 2.7% |
[ 24.5% - 25.0% ] 24.74% | 1,946,481 | 2.4% |
[ 25.0% - 25.5% ] 25.28% | 1,559,660 | 2.7% |
[ 25.5% - 26.0% ] 25.72% | 1,414,578 | 2.5% |
[ 26.0% - 26.5% ] 26.22% | 1,876,088 | 2.5% |
[ 26.5% - 27.0% ] 26.77% | 2,117,853 | 2.4% |
[ 27.0% - 27.5% ] 27.23% | 1,753,387 | 2.5% |
[ 27.5% - 28.0% ] 27.75% | 1,478,092 | 2.4% |
[ 28.0% - 28.5% ] 28.21% | 1,924,103 | 2.3% |
[ 28.5% - 29.0% ] 28.80% | 4,701,326 | 2.1% |
[ 29.0% - 29.5% ] 29.24% | 3,216,608 | 2.5% |
[ 29.5% - 30.0% ] 29.77% | 1,853,599 | 2.7% |
[ 30.0% - 30.5% ] 30.35% | 2,230,968 | 2.2% |
[ 30.5% - 31.0% ] 30.81% | 1,158,095 | 3.0% |
[ 31.0% - 31.5% ] 31.29% | 947,697 | 2.6% |
[ 31.5% - 32.0% ] 31.80% | 994,779 | 2.6% |
[ 32.0% - 32.5% ] 32.27% | 1,249,873 | 2.4% |
[ 32.5% - 33.0% ] 32.74% | 720,503 | 2.7% |
[ 33.0% - 33.5% ] 33.25% | 1,228,582 | 2.3% |
[ 33.5% - 34.0% ] 33.75% | 903,374 | 2.3% |
[ 34.0% - 34.5% ] 34.28% | 811,951 | 2.5% |
[ 34.5% - 35.0% ] 34.79% | 898,566 | 2.6% |
[ 35.0% - 35.5% ] 35.24% | 1,742,170 | 2.2% |
[ 35.5% - 36.0% ] 35.74% | 1,265,338 | 2.7% |
[ 36.0% - 36.5% ] 36.23% | 1,172,858 | 2.8% |
[ 36.5% - 37.0% ] 36.75% | 551,807 | 2.6% |
[ 37.0% - 37.5% ] 37.25% | 913,942 | 2.5% |
[ 37.5% - 38.0% ] 37.80% | 825,547 | 2.2% |
[ 38.0% - 38.5% ] 38.19% | 941,775 | 2.5% |
[ 38.5% - 39.0% ] 38.70% | 1,416,989 | 3.0% |
[ 39.0% - 39.5% ] 39.31% | 517,013 | 2.6% |
[ 39.5% - 40.0% ] 39.68% | 889,471 | 2.3% |
[ 40.0% - 40.5% ] 40.16% | 2,695,146 | 2.4% |
[ 40.5% - 41.0% ] 40.73% | 1,167,913 | 2.5% |
[ 41.0% - 41.5% ] 41.26% | 1,008,190 | 2.7% |
[ 41.5% - 42.0% ] 41.76% | 955,509 | 2.6% |
[ 42.0% - 42.5% ] 42.25% | 870,444 | 2.3% |
[ 42.5% - 43.0% ] 42.73% | 988,803 | 2.2% |
[ 43.0% - 43.5% ] 43.19% | 1,002,854 | 2.4% |
[ 43.5% - 44.0% ] 43.82% | 983,331 | 2.0% |
[ 44.0% - 44.5% ] 44.29% | 1,172,152 | 1.7% |
[ 44.5% - 45.0% ] 44.74% | 657,575 | 2.6% |
[ 45.0% - 45.5% ] 45.34% | 683,632 | 2.1% |
[ 45.5% - 46.0% ] 45.74% | 593,201 | 2.5% |
[ 46.0% - 46.5% ] 46.24% | 732,127 | 2.5% |
[ 46.5% - 47.0% ] 46.72% | 1,058,898 | 2.8% |
[ 47.0% - 47.5% ] 47.16% | 733,928 | 2.8% |
[ 47.5% - 48.0% ] 47.64% | 1,053,324 | 1.8% |
[ 48.0% - 48.5% ] 48.26% | 298,725 | 2.4% |
[ 48.5% - 49.0% ] 48.85% | 463,475 | 3.1% |
[ 49.0% - 49.5% ] 49.22% | 468,853 | 2.3% |
[ 49.5% - 50.0% ] 49.74% | 541,055 | 2.7% |
[ 50.0% - 50.5% ] 50.24% | 926,476 | 2.5% |
[ 50.5% - 51.0% ] 50.77% | 179,657 | 2.5% |
[ 51.0% - 51.5% ] 51.29% | 556,683 | 2.5% |
[ 51.5% - 52.0% ] 51.63% | 650,751 | 2.7% |
[ 52.0% - 52.5% ] 52.29% | 517,078 | 2.6% |
[ 52.5% - 53.0% ] 52.63% | 658,897 | 2.3% |
[ 53.0% - 53.5% ] 53.22% | 693,246 | 2.1% |
[ 53.5% - 54.0% ] 53.72% | 361,418 | 2.1% |
[ 54.0% - 54.5% ] 54.32% | 668,311 | 2.8% |
[ 54.5% - 55.0% ] 54.71% | 343,980 | 2.5% |
[ 55.0% - 55.5% ] 55.28% | 436,974 | 2.5% |
[ 55.5% - 56.0% ] 55.68% | 460,869 | 2.3% |
[ 56.0% - 56.5% ] 56.31% | 551,969 | 2.3% |
[ 56.5% - 57.0% ] 56.67% | 504,797 | 2.6% |
[ 57.0% - 57.5% ] 57.10% | 673,863 | 2.2% |
[ 57.5% - 58.0% ] 57.77% | 308,626 | 2.8% |
[ 58.0% - 58.5% ] 58.25% | 363,370 | 2.4% |
[ 58.5% - 59.0% ] 58.77% | 272,412 | 3.1% |
[ 59.0% - 59.5% ] 59.21% | 325,730 | 2.5% |
[ 59.5% - 60.0% ] 59.79% | 349,625 | 3.1% |
[ 60.0% - 60.5% ] 60.22% | 262,701 | 2.1% |
[ 60.5% - 61.0% ] 60.74% | 449,429 | 2.3% |
[ 61.0% - 61.5% ] 61.26% | 853,273 | 1.9% |
[ 61.5% - 62.0% ] 61.73% | 408,726 | 2.3% |
[ 62.0% - 62.5% ] 62.27% | 423,120 | 2.2% |
[ 62.5% - 63.0% ] 62.78% | 507,242 | 2.4% |
[ 63.0% - 63.5% ] 63.24% | 298,423 | 2.3% |
[ 63.5% - 64.0% ] 63.75% | 404,218 | 2.6% |
[ 64.0% - 64.5% ] 64.30% | 1,047,999 | 2.5% |
[ 64.5% - 65.0% ] 64.72% | 311,891 | 2.0% |
[ 65.0% - 65.5% ] 65.21% | 547,553 | 2.3% |
[ 65.5% - 66.0% ] 65.77% | 273,506 | 2.0% |
[ 66.0% - 66.5% ] 66.29% | 260,884 | 2.5% |
[ 66.5% - 67.0% ] 66.83% | 325,021 | 2.7% |
[ 67.0% - 67.5% ] 67.20% | 237,869 | 2.4% |
[ 67.5% - 68.0% ] 67.68% | 179,657 | 2.4% |
[ 68.0% - 68.5% ] 68.16% | 153,400 | 2.9% |
[ 68.5% - 69.0% ] 68.63% | 485,392 | 2.0% |
[ 69.0% - 69.5% ] 69.27% | 189,324 | 2.5% |
[ 69.5% - 70.0% ] 69.78% | 117,643 | 3.2% |
[ 70.0% - 70.5% ] 70.26% | 270,600 | 2.4% |
[ 70.5% - 71.0% ] 70.70% | 378,941 | 2.6% |
[ 71.0% - 71.5% ] 71.27% | 286,356 | 2.4% |
[ 71.5% - 72.0% ] 71.72% | 207,176 | 2.4% |
[ 72.0% - 72.5% ] 72.20% | 228,365 | 2.8% |
[ 72.5% - 73.0% ] 72.65% | 178,789 | 2.4% |
[ 73.0% - 73.5% ] 73.16% | 250,982 | 2.2% |
[ 73.5% - 74.0% ] 73.78% | 325,191 | 2.6% |
[ 74.0% - 74.5% ] 74.25% | 238,156 | 2.6% |
[ 74.5% - 75.0% ] 74.66% | 267,149 | 2.5% |
[ 75.0% - 75.5% ] 75.24% | 169,741 | 2.2% |
[ 75.5% - 76.0% ] 75.77% | 235,499 | 2.4% |
[ 76.0% - 76.5% ] 76.30% | 235,917 | 1.9% |
[ 76.5% - 77.0% ] 76.66% | 113,345 | 3.7% |
[ 77.0% - 77.5% ] 77.39% | 223,493 | 2.2% |
[ 77.5% - 78.0% ] 77.78% | 834,866 | 2.7% |
[ 78.0% - 78.5% ] 78.22% | 227,170 | 2.5% |
[ 78.5% - 79.0% ] 78.84% | 260,858 | 2.5% |
[ 79.0% - 79.5% ] 79.27% | 256,613 | 2.7% |
[ 79.5% - 80.0% ] 79.70% | 125,288 | 3.1% |
[ 80.0% - 80.5% ] 80.21% | 263,483 | 2.4% |
[ 80.5% - 81.0% ] 80.64% | 223,946 | 3.0% |
[ 81.0% - 81.5% ] 81.29% | 240,469 | 2.7% |
[ 81.5% - 82.0% ] 81.68% | 289,714 | 2.5% |
[ 82.0% - 82.5% ] 82.19% | 433,884 | 2.2% |
[ 82.5% - 83.0% ] 82.75% | 163,081 | 2.5% |
[ 83.0% - 83.5% ] 83.34% | 85,103 | 2.7% |
[ 83.5% - 84.0% ] 83.88% | 61,599 | 3.1% |
[ 84.0% - 84.5% ] 84.33% | 182,118 | 2.8% |
[ 84.5% - 85.0% ] 84.73% | 160,727 | 2.9% |
[ 85.0% - 85.5% ] 85.26% | 137,904 | 2.1% |
[ 85.5% - 86.0% ] 85.78% | 141,475 | 2.5% |
[ 86.0% - 86.5% ] 86.33% | 144,540 | 2.3% |
[ 86.5% - 87.0% ] 86.65% | 264,653 | 2.5% |
[ 87.0% - 87.5% ] 87.27% | 172,059 | 2.5% |
[ 87.5% - 88.0% ] 87.74% | 206,846 | 2.9% |
[ 88.0% - 88.5% ] 88.28% | 145,027 | 2.0% |
[ 88.5% - 89.0% ] 88.77% | 203,715 | 2.9% |
[ 89.0% - 89.5% ] 89.16% | 151,972 | 2.4% |
[ 89.5% - 90.0% ] 89.70% | 218,941 | 2.6% |
[ 90.0% - 90.5% ] 90.19% | 78,458 | 2.1% |
[ 90.5% - 91.0% ] 90.87% | 97,624 | 2.2% |
[ 91.0% - 91.5% ] 91.23% | 371,315 | 2.4% |
[ 91.5% - 92.0% ] 91.80% | 137,980 | 1.4% |
[ 92.0% - 92.5% ] 92.25% | 94,257 | 3.0% |
[ 92.5% - 93.0% ] 92.69% | 152,096 | 2.6% |
[ 93.0% - 93.5% ] 93.22% | 184,300 | 2.3% |
[ 93.5% - 94.0% ] 93.70% | 266,128 | 2.1% |
[ 94.0% - 94.5% ] 94.39% | 110,835 | 2.5% |
[ 94.5% - 95.0% ] 94.72% | 104,566 | 2.4% |
[ 95.0% - 95.5% ] 95.23% | 80,832 | 2.2% |
[ 95.5% - 96.0% ] 95.81% | 70,583 | 1.7% |
[ 98.5% - 99.0% ] 98.63% | 12,545 | 1.5% |
[ 99.0% - 99.5% ] 99.17% | 10,957 | 2.9% |