Black/African American Births to Unmarried Women
COMPARE
Black/African American
Select to Compare
Births to Unmarried Women
Black/African American Births to Unmarried Women
44.3%
BIRTHS TO UNMARRIED WOMEN
0.0/ 100
METRIC RATING
333rd/ 347
METRIC RANK
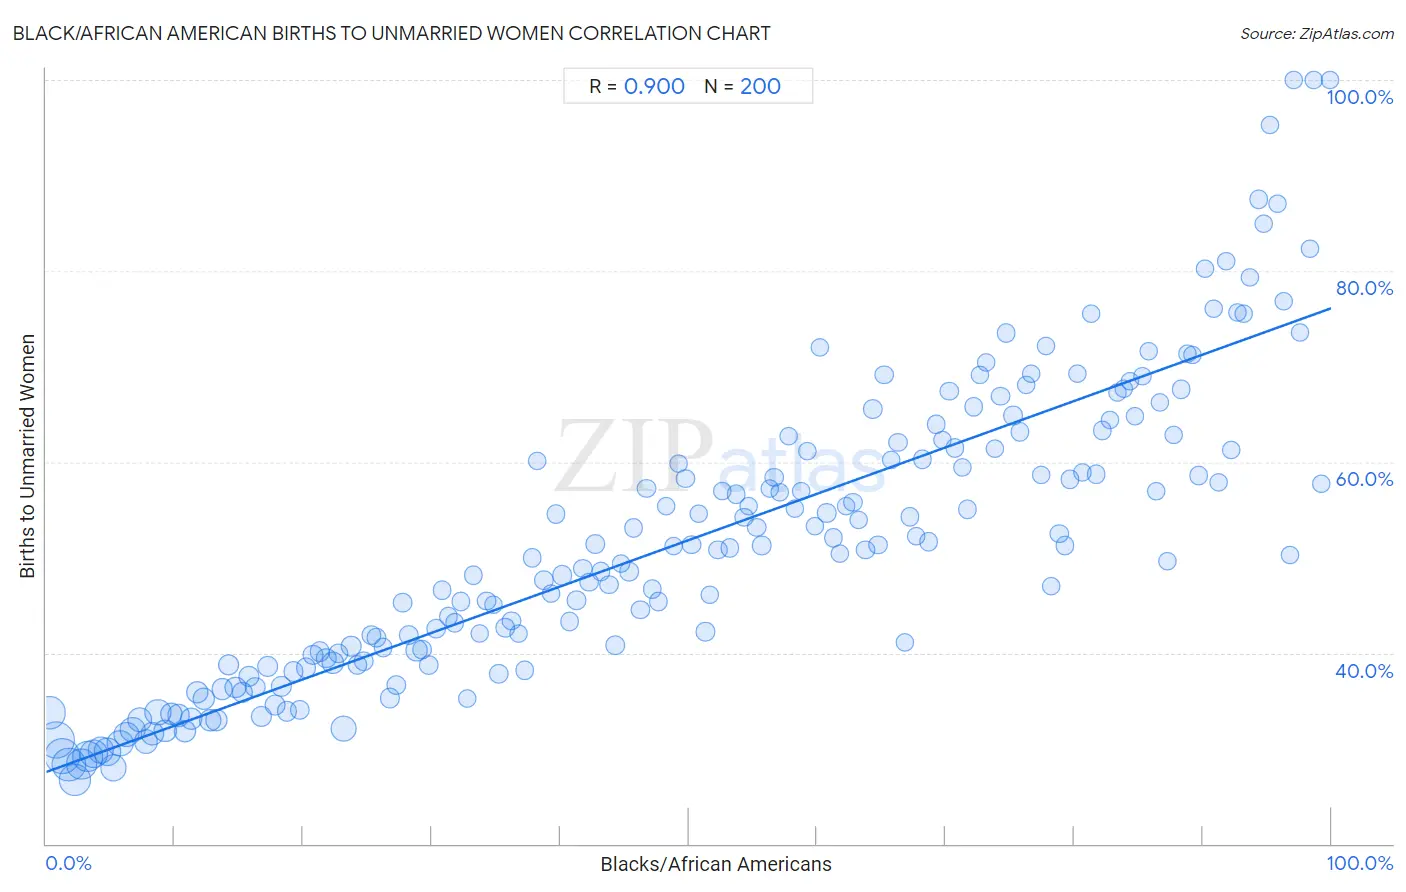
Black/African American Births to Unmarried Women Correlation Chart
The statistical analysis conducted on geographies consisting of 506,152,506 people shows a very strong positive correlation between the proportion of Blacks/African Americans and percentage of births to unmarried women in the United States with a correlation coefficient (R) of 0.900 and weighted average of 44.3%. On average, for every 1% (one percent) increase in Blacks/African Americans within a typical geography, there is an increase of 0.49% in percentage of births to unmarried women.
It is essential to understand that the correlation between the percentage of Blacks/African Americans and percentage of births to unmarried women does not imply a direct cause-and-effect relationship. It remains uncertain whether the presence of Blacks/African Americans influences an upward or downward trend in the level of percentage of births to unmarried women within an area, or if Blacks/African Americans simply ended up residing in those areas with higher or lower levels of percentage of births to unmarried women due to other factors.
Demographics Similar to Blacks/African Americans by Births to Unmarried Women
In terms of births to unmarried women, the demographic groups most similar to Blacks/African Americans are Yuman (44.4%, a difference of 0.17%), Colville (45.3%, a difference of 2.3%), Kiowa (43.1%, a difference of 2.7%), Native/Alaskan (43.0%, a difference of 3.0%), and Puerto Rican (45.7%, a difference of 3.1%).
| Demographics | Rating | Rank | Births to Unmarried Women |
| Immigrants from Cuba | 0.0 /100 | #326 | Tragic 41.5% |
| Tsimshian | 0.0 /100 | #327 | Tragic 42.2% |
| Immigrants from Cabo Verde | 0.0 /100 | #328 | Tragic 42.2% |
| Paiute | 0.0 /100 | #329 | Tragic 42.5% |
| Chippewa | 0.0 /100 | #330 | Tragic 42.6% |
| Natives/Alaskans | 0.0 /100 | #331 | Tragic 43.0% |
| Kiowa | 0.0 /100 | #332 | Tragic 43.1% |
| Blacks/African Americans | 0.0 /100 | #333 | Tragic 44.3% |
| Yuman | 0.0 /100 | #334 | Tragic 44.4% |
| Colville | 0.0 /100 | #335 | Tragic 45.3% |
| Puerto Ricans | 0.0 /100 | #336 | Tragic 45.7% |
| Houma | 0.0 /100 | #337 | Tragic 46.6% |
| Arapaho | 0.0 /100 | #338 | Tragic 47.1% |
| Lumbee | 0.0 /100 | #339 | Tragic 48.2% |
| Tohono O'odham | 0.0 /100 | #340 | Tragic 49.8% |
Black/African American Births to Unmarried Women Correlation Summary
| Measurement | Black/African American Data | Births to Unmarried Women Data |
| Minimum | 0.27% | 26.7% |
| Maximum | 99.9% | 100.0% |
| Range | 99.6% | 73.3% |
| Mean | 50.0% | 51.8% |
| Median | 50.0% | 50.9% |
| Interquartile 25% (IQ1) | 25.0% | 39.1% |
| Interquartile 75% (IQ3) | 75.0% | 61.4% |
| Interquartile Range (IQR) | 49.9% | 22.4% |
| Standard Deviation (Sample) | 28.9% | 15.6% |
| Standard Deviation (Population) | 28.9% | 15.6% |
Correlation Details
| Black/African American Percentile | Sample Size | Births to Unmarried Women |
[ 0.0% - 0.5% ] 0.27% | 21,694,523 | 33.7% |
[ 0.5% - 1.0% ] 0.74% | 27,990,390 | 30.8% |
[ 1.0% - 1.5% ] 1.23% | 26,714,394 | 29.2% |
[ 1.5% - 2.0% ] 1.73% | 23,780,700 | 28.3% |
[ 2.0% - 2.5% ] 2.24% | 20,855,531 | 26.7% |
[ 2.5% - 3.0% ] 2.76% | 17,784,874 | 28.3% |
[ 3.0% - 3.5% ] 3.25% | 18,221,739 | 29.1% |
[ 3.5% - 4.0% ] 3.74% | 14,842,290 | 29.4% |
[ 4.0% - 4.5% ] 4.24% | 12,698,678 | 29.8% |
[ 4.5% - 5.0% ] 4.74% | 13,300,270 | 29.6% |
[ 5.0% - 5.5% ] 5.24% | 12,206,452 | 27.9% |
[ 5.5% - 6.0% ] 5.76% | 12,641,797 | 30.5% |
[ 6.0% - 6.5% ] 6.23% | 10,723,769 | 31.4% |
[ 6.5% - 7.0% ] 6.72% | 10,746,977 | 31.9% |
[ 7.0% - 7.5% ] 7.26% | 10,156,993 | 33.0% |
[ 7.5% - 8.0% ] 7.75% | 8,269,290 | 30.7% |
[ 8.0% - 8.5% ] 8.24% | 7,652,527 | 31.5% |
[ 8.5% - 9.0% ] 8.69% | 11,847,274 | 33.8% |
[ 9.0% - 9.5% ] 9.24% | 6,879,439 | 31.8% |
[ 9.5% - 10.0% ] 9.75% | 5,461,462 | 33.6% |
[ 10.0% - 10.5% ] 10.26% | 5,994,998 | 33.4% |
[ 10.5% - 11.0% ] 10.76% | 5,707,286 | 31.8% |
[ 11.0% - 11.5% ] 11.27% | 5,639,286 | 33.0% |
[ 11.5% - 12.0% ] 11.75% | 6,276,589 | 35.9% |
[ 12.0% - 12.5% ] 12.24% | 5,556,280 | 35.2% |
[ 12.5% - 13.0% ] 12.73% | 4,916,312 | 33.0% |
[ 13.0% - 13.5% ] 13.26% | 5,201,771 | 33.0% |
[ 13.5% - 14.0% ] 13.71% | 4,586,103 | 36.2% |
[ 14.0% - 14.5% ] 14.22% | 4,188,664 | 38.8% |
[ 14.5% - 15.0% ] 14.73% | 3,956,522 | 36.4% |
[ 15.0% - 15.5% ] 15.25% | 4,236,292 | 35.9% |
[ 15.5% - 16.0% ] 15.74% | 3,363,771 | 37.5% |
[ 16.0% - 16.5% ] 16.25% | 3,020,278 | 36.4% |
[ 16.5% - 17.0% ] 16.74% | 3,196,549 | 33.4% |
[ 17.0% - 17.5% ] 17.22% | 3,259,421 | 38.6% |
[ 17.5% - 18.0% ] 17.77% | 3,536,610 | 34.5% |
[ 18.0% - 18.5% ] 18.26% | 3,480,008 | 36.5% |
[ 18.5% - 19.0% ] 18.73% | 3,500,020 | 33.9% |
[ 19.0% - 19.5% ] 19.23% | 2,881,413 | 38.1% |
[ 19.5% - 20.0% ] 19.75% | 2,379,125 | 34.1% |
[ 20.0% - 20.5% ] 20.23% | 2,615,149 | 38.4% |
[ 20.5% - 21.0% ] 20.76% | 2,236,768 | 39.8% |
[ 21.0% - 21.5% ] 21.29% | 2,611,837 | 40.1% |
[ 21.5% - 22.0% ] 21.77% | 3,636,907 | 39.4% |
[ 22.0% - 22.5% ] 22.32% | 4,751,213 | 39.0% |
[ 22.5% - 23.0% ] 22.72% | 2,957,127 | 39.9% |
[ 23.0% - 23.5% ] 23.15% | 11,549,292 | 32.1% |
[ 23.5% - 24.0% ] 23.75% | 3,878,812 | 40.7% |
[ 24.0% - 24.5% ] 24.22% | 2,123,906 | 38.7% |
[ 24.5% - 25.0% ] 24.74% | 1,868,226 | 39.1% |
[ 25.0% - 25.5% ] 25.28% | 1,450,401 | 41.9% |
[ 25.5% - 26.0% ] 25.71% | 1,365,763 | 41.6% |
[ 26.0% - 26.5% ] 26.22% | 1,823,313 | 40.5% |
[ 26.5% - 27.0% ] 26.77% | 2,094,245 | 35.3% |
[ 27.0% - 27.5% ] 27.23% | 1,657,371 | 36.6% |
[ 27.5% - 28.0% ] 27.75% | 1,451,199 | 45.2% |
[ 28.0% - 28.5% ] 28.21% | 1,851,117 | 41.9% |
[ 28.5% - 29.0% ] 28.80% | 4,686,233 | 40.3% |
[ 29.0% - 29.5% ] 29.24% | 3,167,307 | 40.3% |
[ 29.5% - 30.0% ] 29.77% | 1,796,098 | 38.8% |
[ 30.0% - 30.5% ] 30.36% | 2,150,791 | 42.5% |
[ 30.5% - 31.0% ] 30.82% | 1,150,290 | 46.5% |
[ 31.0% - 31.5% ] 31.29% | 905,935 | 43.8% |
[ 31.5% - 32.0% ] 31.80% | 985,592 | 43.1% |
[ 32.0% - 32.5% ] 32.27% | 1,227,454 | 45.4% |
[ 32.5% - 33.0% ] 32.74% | 683,942 | 35.2% |
[ 33.0% - 33.5% ] 33.25% | 1,185,763 | 48.1% |
[ 33.5% - 34.0% ] 33.75% | 864,921 | 42.0% |
[ 34.0% - 34.5% ] 34.28% | 794,291 | 45.4% |
[ 34.5% - 35.0% ] 34.79% | 892,050 | 45.0% |
[ 35.0% - 35.5% ] 35.24% | 1,740,514 | 37.9% |
[ 35.5% - 36.0% ] 35.74% | 1,240,801 | 42.6% |
[ 36.0% - 36.5% ] 36.23% | 1,147,145 | 43.4% |
[ 36.5% - 37.0% ] 36.75% | 504,244 | 42.0% |
[ 37.0% - 37.5% ] 37.25% | 891,200 | 38.2% |
[ 37.5% - 38.0% ] 37.80% | 794,998 | 49.9% |
[ 38.0% - 38.5% ] 38.19% | 934,815 | 60.1% |
[ 38.5% - 39.0% ] 38.70% | 1,412,674 | 47.6% |
[ 39.0% - 39.5% ] 39.31% | 506,649 | 46.2% |
[ 39.5% - 40.0% ] 39.68% | 856,951 | 54.5% |
[ 40.0% - 40.5% ] 40.16% | 2,704,214 | 48.1% |
[ 40.5% - 41.0% ] 40.73% | 1,158,341 | 43.3% |
[ 41.0% - 41.5% ] 41.26% | 977,667 | 45.5% |
[ 41.5% - 42.0% ] 41.76% | 921,991 | 48.8% |
[ 42.0% - 42.5% ] 42.25% | 828,237 | 47.4% |
[ 42.5% - 43.0% ] 42.73% | 1,004,818 | 51.4% |
[ 43.0% - 43.5% ] 43.19% | 1,001,157 | 48.5% |
[ 43.5% - 44.0% ] 43.82% | 971,180 | 47.1% |
[ 44.0% - 44.5% ] 44.29% | 1,181,412 | 40.8% |
[ 44.5% - 45.0% ] 44.74% | 639,376 | 49.3% |
[ 45.0% - 45.5% ] 45.35% | 669,769 | 48.5% |
[ 45.5% - 46.0% ] 45.74% | 594,033 | 53.1% |
[ 46.0% - 46.5% ] 46.24% | 718,721 | 44.5% |
[ 46.5% - 47.0% ] 46.72% | 1,048,504 | 57.2% |
[ 47.0% - 47.5% ] 47.16% | 718,721 | 46.7% |
[ 47.5% - 48.0% ] 47.64% | 1,036,952 | 45.4% |
[ 48.0% - 48.5% ] 48.25% | 287,205 | 55.4% |
[ 48.5% - 49.0% ] 48.84% | 477,114 | 51.1% |
[ 49.0% - 49.5% ] 49.22% | 466,624 | 59.8% |
[ 49.5% - 50.0% ] 49.74% | 509,598 | 58.2% |
[ 50.0% - 50.5% ] 50.24% | 911,049 | 51.3% |
[ 50.5% - 51.0% ] 50.77% | 190,360 | 54.6% |
[ 51.0% - 51.5% ] 51.30% | 560,596 | 42.2% |
[ 51.5% - 52.0% ] 51.63% | 660,304 | 46.1% |
[ 52.0% - 52.5% ] 52.28% | 514,237 | 50.8% |
[ 52.5% - 53.0% ] 52.63% | 672,982 | 57.0% |
[ 53.0% - 53.5% ] 53.21% | 669,505 | 51.0% |
[ 53.5% - 54.0% ] 53.72% | 373,015 | 56.6% |
[ 54.0% - 54.5% ] 54.32% | 684,974 | 54.2% |
[ 54.5% - 55.0% ] 54.69% | 322,683 | 55.3% |
[ 55.0% - 55.5% ] 55.28% | 412,061 | 53.2% |
[ 55.5% - 56.0% ] 55.68% | 447,042 | 51.3% |
[ 56.0% - 56.5% ] 56.31% | 555,100 | 57.2% |
[ 56.5% - 57.0% ] 56.66% | 491,231 | 58.3% |
[ 57.0% - 57.5% ] 57.10% | 675,117 | 56.8% |
[ 57.5% - 58.0% ] 57.77% | 310,312 | 62.7% |
[ 58.0% - 58.5% ] 58.25% | 352,255 | 55.1% |
[ 58.5% - 59.0% ] 58.76% | 279,746 | 57.0% |
[ 59.0% - 59.5% ] 59.21% | 318,576 | 61.1% |
[ 59.5% - 60.0% ] 59.79% | 349,640 | 53.2% |
[ 60.0% - 60.5% ] 60.22% | 250,342 | 72.0% |
[ 60.5% - 61.0% ] 60.74% | 422,934 | 54.7% |
[ 61.0% - 61.5% ] 61.26% | 877,721 | 52.0% |
[ 61.5% - 62.0% ] 61.72% | 419,185 | 50.4% |
[ 62.0% - 62.5% ] 62.27% | 407,743 | 55.3% |
[ 62.5% - 63.0% ] 62.78% | 506,022 | 55.8% |
[ 63.0% - 63.5% ] 63.24% | 295,905 | 53.9% |
[ 63.5% - 64.0% ] 63.75% | 404,185 | 50.8% |
[ 64.0% - 64.5% ] 64.30% | 1,006,203 | 65.5% |
[ 64.5% - 65.0% ] 64.72% | 287,259 | 51.3% |
[ 65.0% - 65.5% ] 65.21% | 530,505 | 69.2% |
[ 65.5% - 66.0% ] 65.77% | 263,325 | 60.2% |
[ 66.0% - 66.5% ] 66.29% | 264,627 | 62.0% |
[ 66.5% - 67.0% ] 66.83% | 328,074 | 41.1% |
[ 67.0% - 67.5% ] 67.20% | 237,139 | 54.3% |
[ 67.5% - 68.0% ] 67.67% | 184,188 | 52.2% |
[ 68.0% - 68.5% ] 68.16% | 152,538 | 60.3% |
[ 68.5% - 69.0% ] 68.63% | 484,785 | 51.6% |
[ 69.0% - 69.5% ] 69.27% | 198,124 | 63.9% |
[ 69.5% - 70.0% ] 69.77% | 131,677 | 62.3% |
[ 70.0% - 70.5% ] 70.27% | 252,540 | 67.5% |
[ 70.5% - 71.0% ] 70.70% | 381,447 | 61.5% |
[ 71.0% - 71.5% ] 71.27% | 288,810 | 59.5% |
[ 71.5% - 72.0% ] 71.71% | 213,711 | 55.0% |
[ 72.0% - 72.5% ] 72.20% | 231,168 | 65.8% |
[ 72.5% - 73.0% ] 72.65% | 180,505 | 69.1% |
[ 73.0% - 73.5% ] 73.15% | 255,527 | 70.4% |
[ 73.5% - 74.0% ] 73.79% | 330,402 | 61.4% |
[ 74.0% - 74.5% ] 74.27% | 226,818 | 66.8% |
[ 74.5% - 75.0% ] 74.67% | 268,583 | 73.5% |
[ 75.0% - 75.5% ] 75.24% | 175,706 | 64.9% |
[ 75.5% - 76.0% ] 75.77% | 244,554 | 63.2% |
[ 76.0% - 76.5% ] 76.30% | 227,881 | 68.1% |
[ 76.5% - 77.0% ] 76.66% | 110,325 | 69.3% |
[ 77.0% - 77.5% ] 77.39% | 222,692 | 58.6% |
[ 77.5% - 78.0% ] 77.78% | 835,588 | 72.2% |
[ 78.0% - 78.5% ] 78.22% | 224,419 | 47.0% |
[ 78.5% - 79.0% ] 78.84% | 258,294 | 52.5% |
[ 79.0% - 79.5% ] 79.27% | 256,576 | 51.2% |
[ 79.5% - 80.0% ] 79.70% | 120,705 | 58.2% |
[ 80.0% - 80.5% ] 80.22% | 284,573 | 69.3% |
[ 80.5% - 81.0% ] 80.64% | 227,859 | 58.9% |
[ 81.0% - 81.5% ] 81.30% | 215,563 | 75.5% |
[ 81.5% - 82.0% ] 81.68% | 292,968 | 58.7% |
[ 82.0% - 82.5% ] 82.19% | 439,234 | 63.3% |
[ 82.5% - 83.0% ] 82.75% | 145,344 | 64.4% |
[ 83.0% - 83.5% ] 83.34% | 84,582 | 67.3% |
[ 83.5% - 84.0% ] 83.89% | 61,324 | 67.6% |
[ 84.0% - 84.5% ] 84.33% | 177,578 | 68.5% |
[ 84.5% - 85.0% ] 84.74% | 164,184 | 64.7% |
[ 85.0% - 85.5% ] 85.27% | 132,850 | 69.0% |
[ 85.5% - 86.0% ] 85.78% | 138,996 | 71.5% |
[ 86.0% - 86.5% ] 86.34% | 138,271 | 56.9% |
[ 86.5% - 87.0% ] 86.65% | 262,135 | 66.2% |
[ 87.0% - 87.5% ] 87.27% | 167,684 | 49.6% |
[ 87.5% - 88.0% ] 87.74% | 207,433 | 62.8% |
[ 88.0% - 88.5% ] 88.28% | 146,334 | 67.6% |
[ 88.5% - 89.0% ] 88.77% | 200,067 | 71.4% |
[ 89.0% - 89.5% ] 89.16% | 151,873 | 71.2% |
[ 89.5% - 90.0% ] 89.70% | 220,309 | 58.6% |
[ 90.0% - 90.5% ] 90.19% | 77,316 | 80.2% |
[ 90.5% - 91.0% ] 90.87% | 97,212 | 76.0% |
[ 91.0% - 91.5% ] 91.23% | 371,315 | 57.9% |
[ 91.5% - 92.0% ] 91.80% | 140,113 | 81.0% |
[ 92.0% - 92.5% ] 92.26% | 96,282 | 61.3% |
[ 92.5% - 93.0% ] 92.70% | 160,227 | 75.6% |
[ 93.0% - 93.5% ] 93.22% | 185,459 | 75.5% |
[ 93.5% - 94.0% ] 93.71% | 264,811 | 79.4% |
[ 94.0% - 94.5% ] 94.38% | 115,579 | 87.5% |
[ 94.5% - 95.0% ] 94.72% | 105,757 | 85.0% |
[ 95.0% - 95.5% ] 95.24% | 83,887 | 95.3% |
[ 95.5% - 96.0% ] 95.80% | 79,128 | 87.1% |
[ 96.0% - 96.5% ] 96.27% | 43,506 | 76.9% |
[ 96.5% - 97.0% ] 96.83% | 13,293 | 50.2% |
[ 97.0% - 97.5% ] 97.09% | 1,891 | 100.0% |
[ 97.5% - 98.0% ] 97.57% | 1,070 | 73.6% |
[ 98.0% - 98.5% ] 98.32% | 9,408 | 82.4% |
[ 98.5% - 99.0% ] 98.62% | 15,603 | 100.0% |
[ 99.0% - 99.5% ] 99.21% | 10,755 | 57.7% |
[ 99.5% - 100.0% ] 99.88% | 5,611 | 100.0% |