Black/African American vs Immigrants from Thailand Single Male Poverty
COMPARE
Black/African American
Immigrants from Thailand
Single Male Poverty
Single Male Poverty Comparison
Blacks/African Americans
Immigrants from Thailand
16.2%
SINGLE MALE POVERTY
0.0/ 100
METRIC RATING
317th/ 347
METRIC RANK
13.0%
SINGLE MALE POVERTY
26.6/ 100
METRIC RATING
191st/ 347
METRIC RANK
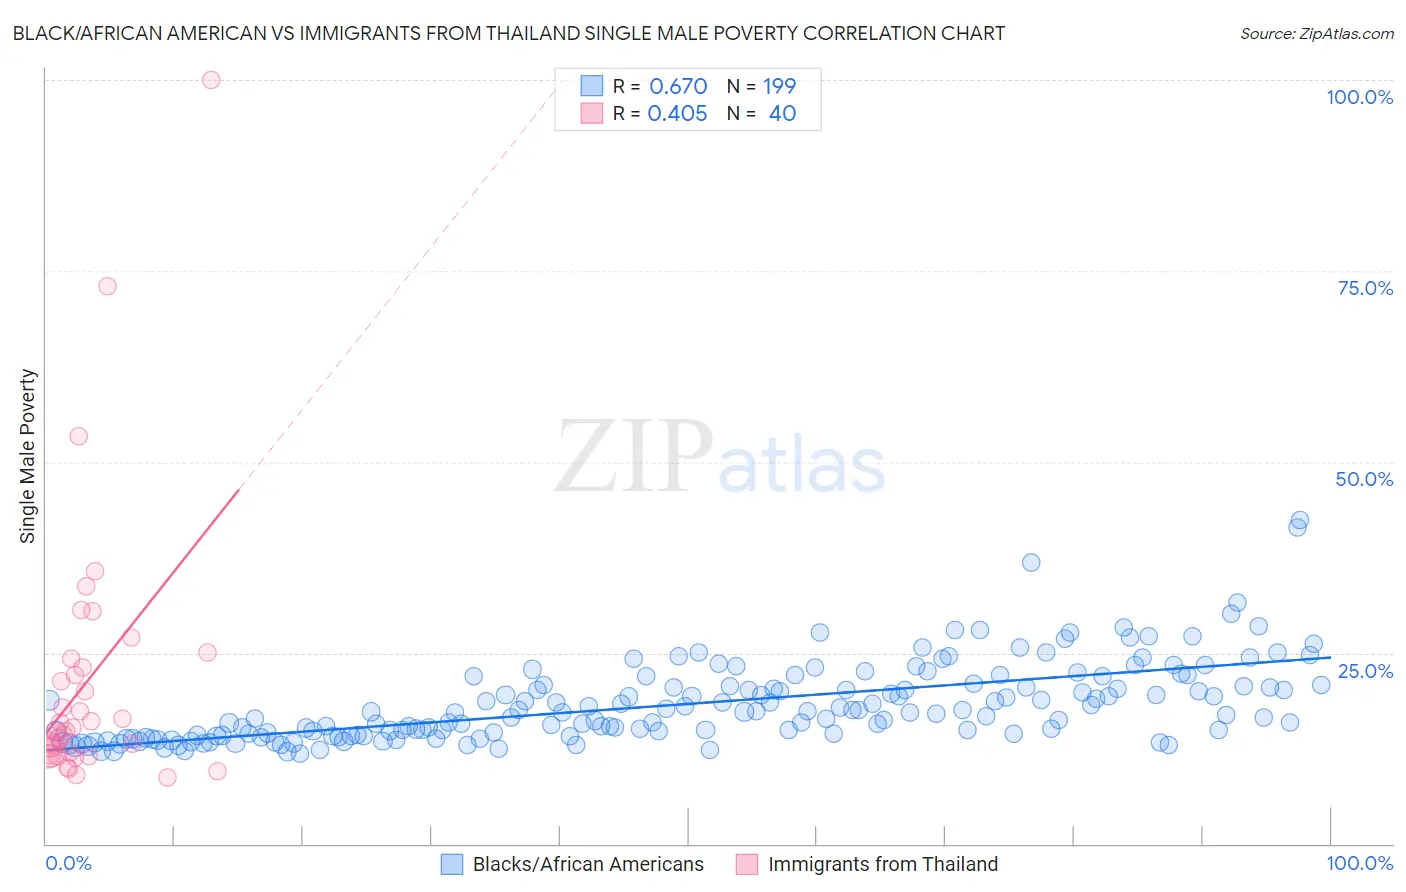
Black/African American vs Immigrants from Thailand Single Male Poverty Correlation Chart
The statistical analysis conducted on geographies consisting of 472,674,082 people shows a significant positive correlation between the proportion of Blacks/African Americans and poverty level among single males in the United States with a correlation coefficient (R) of 0.670 and weighted average of 16.2%. Similarly, the statistical analysis conducted on geographies consisting of 289,372,326 people shows a moderate positive correlation between the proportion of Immigrants from Thailand and poverty level among single males in the United States with a correlation coefficient (R) of 0.405 and weighted average of 13.0%, a difference of 24.8%.
Single Male Poverty Correlation Summary
| Measurement | Black/African American | Immigrants from Thailand |
| Minimum | 11.9% | 8.7% |
| Maximum | 42.4% | 100.0% |
| Range | 30.6% | 91.3% |
| Mean | 18.3% | 21.4% |
| Median | 17.2% | 15.0% |
| Interquartile 25% (IQ1) | 14.2% | 11.8% |
| Interquartile 75% (IQ3) | 20.7% | 23.6% |
| Interquartile Range (IQR) | 6.5% | 11.8% |
| Standard Deviation (Sample) | 5.2% | 17.9% |
| Standard Deviation (Population) | 5.2% | 17.7% |
Similar Demographics by Single Male Poverty
Demographics Similar to Blacks/African Americans by Single Male Poverty
In terms of single male poverty, the demographic groups most similar to Blacks/African Americans are Dutch West Indian (16.1%, a difference of 0.34%), Cheyenne (16.1%, a difference of 0.48%), Alaskan Athabascan (16.1%, a difference of 0.53%), Chickasaw (16.3%, a difference of 0.80%), and Cherokee (16.1%, a difference of 0.82%).
| Demographics | Rating | Rank | Single Male Poverty |
| Yakama | 0.0 /100 | #310 | Tragic 15.9% |
| Seminole | 0.0 /100 | #311 | Tragic 16.0% |
| Comanche | 0.0 /100 | #312 | Tragic 16.0% |
| Cherokee | 0.0 /100 | #313 | Tragic 16.1% |
| Alaskan Athabascans | 0.0 /100 | #314 | Tragic 16.1% |
| Cheyenne | 0.0 /100 | #315 | Tragic 16.1% |
| Dutch West Indians | 0.0 /100 | #316 | Tragic 16.1% |
| Blacks/African Americans | 0.0 /100 | #317 | Tragic 16.2% |
| Chickasaw | 0.0 /100 | #318 | Tragic 16.3% |
| Chippewa | 0.0 /100 | #319 | Tragic 16.4% |
| Marshallese | 0.0 /100 | #320 | Tragic 16.4% |
| Osage | 0.0 /100 | #321 | Tragic 16.5% |
| Shoshone | 0.0 /100 | #322 | Tragic 16.7% |
| Creek | 0.0 /100 | #323 | Tragic 16.8% |
| Immigrants | Yemen | 0.0 /100 | #324 | Tragic 16.9% |
Demographics Similar to Immigrants from Thailand by Single Male Poverty
In terms of single male poverty, the demographic groups most similar to Immigrants from Thailand are Immigrants from Jamaica (13.0%, a difference of 0.010%), Arab (13.0%, a difference of 0.030%), Immigrants from South Africa (13.0%, a difference of 0.030%), Liberian (13.0%, a difference of 0.090%), and Immigrants from England (13.0%, a difference of 0.22%).
| Demographics | Rating | Rank | Single Male Poverty |
| Immigrants | Trinidad and Tobago | 32.5 /100 | #184 | Fair 12.9% |
| Norwegians | 32.0 /100 | #185 | Fair 12.9% |
| Nigerians | 31.9 /100 | #186 | Fair 12.9% |
| Immigrants | Kuwait | 31.9 /100 | #187 | Fair 12.9% |
| Macedonians | 31.5 /100 | #188 | Fair 12.9% |
| Portuguese | 30.2 /100 | #189 | Fair 12.9% |
| Arabs | 27.0 /100 | #190 | Fair 13.0% |
| Immigrants | Thailand | 26.6 /100 | #191 | Fair 13.0% |
| Immigrants | Jamaica | 26.5 /100 | #192 | Fair 13.0% |
| Immigrants | South Africa | 26.1 /100 | #193 | Fair 13.0% |
| Liberians | 25.2 /100 | #194 | Fair 13.0% |
| Immigrants | England | 23.4 /100 | #195 | Fair 13.0% |
| Immigrants | Grenada | 23.1 /100 | #196 | Fair 13.0% |
| Immigrants | Laos | 23.1 /100 | #197 | Fair 13.0% |
| Lithuanians | 22.1 /100 | #198 | Fair 13.0% |