Black/African American Divorced or Separated
COMPARE
Black/African American
Select to Compare
Divorced or Separated
Black/African American Divorced or Separated
13.6%
DIVORCED OR SEPARATED
0.0/ 100
METRIC RATING
331st/ 347
METRIC RANK
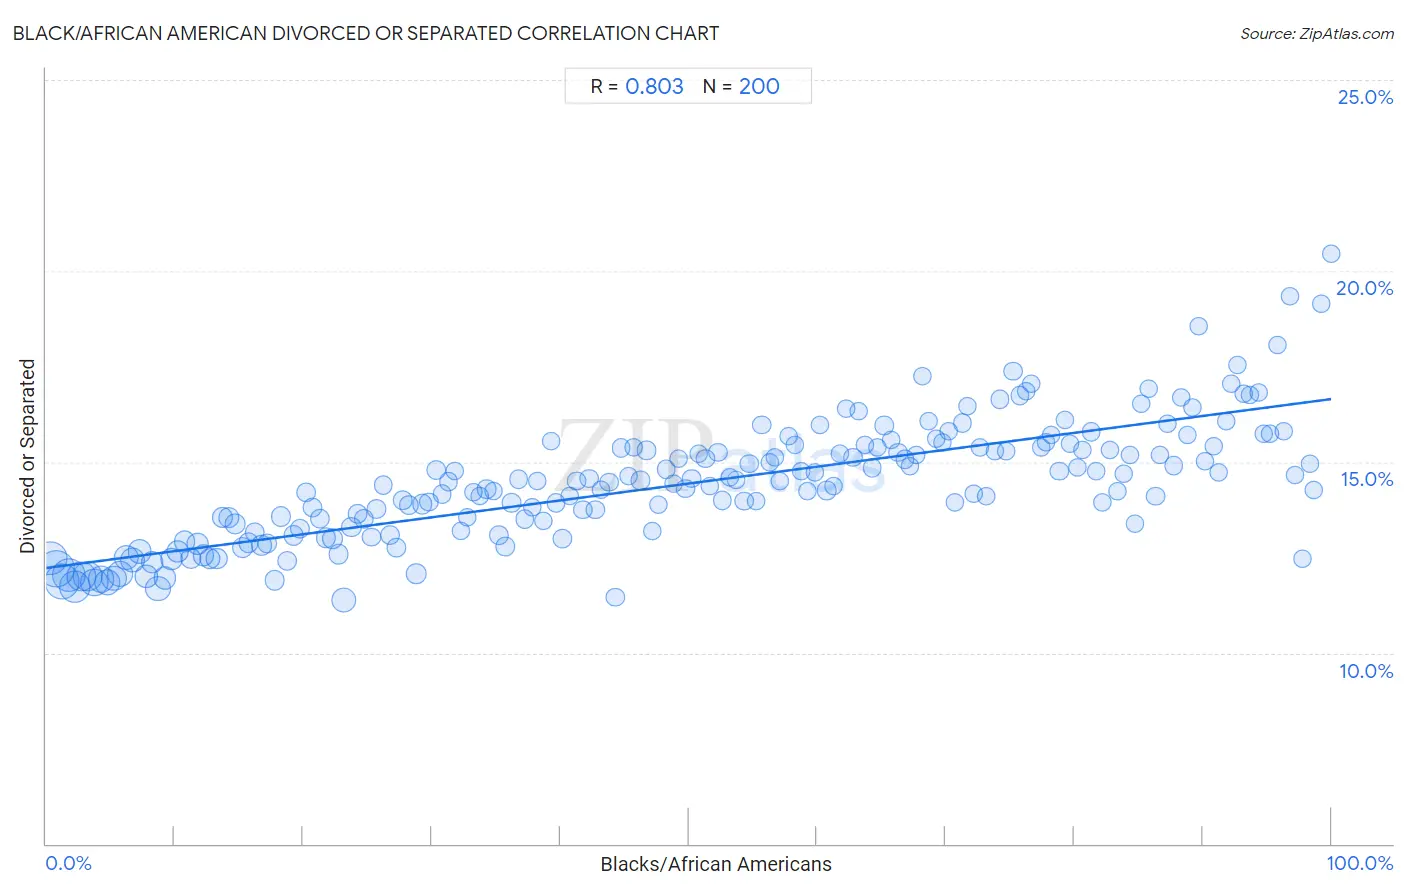
Black/African American Divorced or Separated Correlation Chart
The statistical analysis conducted on geographies consisting of 565,552,203 people shows a very strong positive correlation between the proportion of Blacks/African Americans and percentage of population currently divorced or separated in the United States with a correlation coefficient (R) of 0.803 and weighted average of 13.6%. On average, for every 1% (one percent) increase in Blacks/African Americans within a typical geography, there is an increase of 0.044% in percentage of population currently divorced or separated.
It is essential to understand that the correlation between the percentage of Blacks/African Americans and percentage of population currently divorced or separated does not imply a direct cause-and-effect relationship. It remains uncertain whether the presence of Blacks/African Americans influences an upward or downward trend in the level of percentage of population currently divorced or separated within an area, or if Blacks/African Americans simply ended up residing in those areas with higher or lower levels of percentage of population currently divorced or separated due to other factors.
Demographics Similar to Blacks/African Americans by Divorced or Separated
In terms of divorced or separated, the demographic groups most similar to Blacks/African Americans are Paiute (13.6%, a difference of 0.13%), Houma (13.6%, a difference of 0.24%), Immigrants from Caribbean (13.6%, a difference of 0.39%), Cherokee (13.7%, a difference of 0.76%), and Comanche (13.5%, a difference of 0.77%).
| Demographics | Rating | Rank | Divorced or Separated |
| Osage | 0.0 /100 | #324 | Tragic 13.4% |
| Potawatomi | 0.0 /100 | #325 | Tragic 13.5% |
| Immigrants from Congo | 0.0 /100 | #326 | Tragic 13.5% |
| Comanche | 0.0 /100 | #327 | Tragic 13.5% |
| Immigrants from Caribbean | 0.0 /100 | #328 | Tragic 13.6% |
| Houma | 0.0 /100 | #329 | Tragic 13.6% |
| Paiute | 0.0 /100 | #330 | Tragic 13.6% |
| Blacks/African Americans | 0.0 /100 | #331 | Tragic 13.6% |
| Cherokee | 0.0 /100 | #332 | Tragic 13.7% |
| Puerto Ricans | 0.0 /100 | #333 | Tragic 13.9% |
| Immigrants from Bahamas | 0.0 /100 | #334 | Tragic 13.9% |
| Dutch West Indians | 0.0 /100 | #335 | Tragic 14.0% |
| Shoshone | 0.0 /100 | #336 | Tragic 14.0% |
| Crow | 0.0 /100 | #337 | Tragic 14.1% |
| Choctaw | 0.0 /100 | #338 | Tragic 14.1% |
Black/African American Divorced or Separated Correlation Summary
| Measurement | Black/African American Data | Divorced or Separated Data |
| Minimum | 0.26% | 11.4% |
| Maximum | 100.0% | 20.4% |
| Range | 99.7% | 9.1% |
| Mean | 50.0% | 14.4% |
| Median | 50.0% | 14.4% |
| Interquartile 25% (IQ1) | 25.0% | 13.2% |
| Interquartile 75% (IQ3) | 75.0% | 15.4% |
| Interquartile Range (IQR) | 49.9% | 2.2% |
| Standard Deviation (Sample) | 28.9% | 1.6% |
| Standard Deviation (Population) | 28.9% | 1.6% |
Correlation Details
| Black/African American Percentile | Sample Size | Divorced or Separated |
[ 0.0% - 0.5% ] 0.26% | 30,320,520 | 12.5% |
[ 0.5% - 1.0% ] 0.74% | 35,441,824 | 12.2% |
[ 1.0% - 1.5% ] 1.23% | 32,424,107 | 11.9% |
[ 1.5% - 2.0% ] 1.74% | 28,013,143 | 12.0% |
[ 2.0% - 2.5% ] 2.24% | 24,408,839 | 11.7% |
[ 2.5% - 3.0% ] 2.75% | 20,782,391 | 12.0% |
[ 3.0% - 3.5% ] 3.25% | 20,746,596 | 12.0% |
[ 3.5% - 4.0% ] 3.74% | 16,822,794 | 11.9% |
[ 4.0% - 4.5% ] 4.24% | 14,641,546 | 11.9% |
[ 4.5% - 5.0% ] 4.74% | 14,919,084 | 11.8% |
[ 5.0% - 5.5% ] 5.24% | 13,595,675 | 12.0% |
[ 5.5% - 6.0% ] 5.76% | 13,821,485 | 12.1% |
[ 6.0% - 6.5% ] 6.23% | 11,814,662 | 12.5% |
[ 6.5% - 7.0% ] 6.72% | 11,750,424 | 12.4% |
[ 7.0% - 7.5% ] 7.26% | 11,005,006 | 12.7% |
[ 7.5% - 8.0% ] 7.75% | 9,110,976 | 12.0% |
[ 8.0% - 8.5% ] 8.24% | 8,312,318 | 12.4% |
[ 8.5% - 9.0% ] 8.69% | 12,419,816 | 11.7% |
[ 9.0% - 9.5% ] 9.24% | 7,613,186 | 12.0% |
[ 9.5% - 10.0% ] 9.75% | 5,932,046 | 12.5% |
[ 10.0% - 10.5% ] 10.26% | 6,428,769 | 12.7% |
[ 10.5% - 11.0% ] 10.76% | 6,066,708 | 12.9% |
[ 11.0% - 11.5% ] 11.27% | 6,007,379 | 12.5% |
[ 11.5% - 12.0% ] 11.75% | 6,653,218 | 12.8% |
[ 12.0% - 12.5% ] 12.24% | 5,847,732 | 12.5% |
[ 12.5% - 13.0% ] 12.73% | 5,241,049 | 12.5% |
[ 13.0% - 13.5% ] 13.26% | 5,609,131 | 12.5% |
[ 13.5% - 14.0% ] 13.72% | 4,990,094 | 13.6% |
[ 14.0% - 14.5% ] 14.23% | 4,367,767 | 13.5% |
[ 14.5% - 15.0% ] 14.73% | 4,208,166 | 13.4% |
[ 15.0% - 15.5% ] 15.25% | 4,404,296 | 12.8% |
[ 15.5% - 16.0% ] 15.75% | 3,608,669 | 12.9% |
[ 16.0% - 16.5% ] 16.25% | 3,267,114 | 13.2% |
[ 16.5% - 17.0% ] 16.75% | 3,421,633 | 12.8% |
[ 17.0% - 17.5% ] 17.22% | 3,513,069 | 12.9% |
[ 17.5% - 18.0% ] 17.77% | 3,690,517 | 11.9% |
[ 18.0% - 18.5% ] 18.26% | 3,598,675 | 13.6% |
[ 18.5% - 19.0% ] 18.73% | 3,674,065 | 12.4% |
[ 19.0% - 19.5% ] 19.23% | 3,049,300 | 13.1% |
[ 19.5% - 20.0% ] 19.75% | 2,546,308 | 13.2% |
[ 20.0% - 20.5% ] 20.23% | 2,767,193 | 14.2% |
[ 20.5% - 21.0% ] 20.77% | 2,362,727 | 13.8% |
[ 21.0% - 21.5% ] 21.29% | 2,733,760 | 13.5% |
[ 21.5% - 22.0% ] 21.77% | 3,751,843 | 13.0% |
[ 22.0% - 22.5% ] 22.31% | 4,863,556 | 13.0% |
[ 22.5% - 23.0% ] 22.72% | 3,026,760 | 12.6% |
[ 23.0% - 23.5% ] 23.15% | 11,616,273 | 11.4% |
[ 23.5% - 24.0% ] 23.75% | 3,975,297 | 13.3% |
[ 24.0% - 24.5% ] 24.22% | 2,193,505 | 13.6% |
[ 24.5% - 25.0% ] 24.74% | 1,995,678 | 13.5% |
[ 25.0% - 25.5% ] 25.28% | 1,592,208 | 13.0% |
[ 25.5% - 26.0% ] 25.71% | 1,472,595 | 13.8% |
[ 26.0% - 26.5% ] 26.22% | 1,910,552 | 14.4% |
[ 26.5% - 27.0% ] 26.77% | 2,141,126 | 13.1% |
[ 27.0% - 27.5% ] 27.23% | 1,789,093 | 12.8% |
[ 27.5% - 28.0% ] 27.75% | 1,494,692 | 14.0% |
[ 28.0% - 28.5% ] 28.22% | 1,987,986 | 13.9% |
[ 28.5% - 29.0% ] 28.80% | 4,745,305 | 12.1% |
[ 29.0% - 29.5% ] 29.24% | 3,243,966 | 13.9% |
[ 29.5% - 30.0% ] 29.77% | 1,877,690 | 13.9% |
[ 30.0% - 30.5% ] 30.35% | 2,248,855 | 14.8% |
[ 30.5% - 31.0% ] 30.81% | 1,194,268 | 14.2% |
[ 31.0% - 31.5% ] 31.29% | 965,770 | 14.5% |
[ 31.5% - 32.0% ] 31.79% | 1,021,341 | 14.8% |
[ 32.0% - 32.5% ] 32.27% | 1,277,642 | 13.2% |
[ 32.5% - 33.0% ] 32.74% | 742,987 | 13.6% |
[ 33.0% - 33.5% ] 33.25% | 1,257,318 | 14.2% |
[ 33.5% - 34.0% ] 33.75% | 914,676 | 14.1% |
[ 34.0% - 34.5% ] 34.28% | 835,395 | 14.3% |
[ 34.5% - 35.0% ] 34.79% | 925,584 | 14.2% |
[ 35.0% - 35.5% ] 35.24% | 1,767,730 | 13.1% |
[ 35.5% - 36.0% ] 35.74% | 1,290,250 | 12.8% |
[ 36.0% - 36.5% ] 36.23% | 1,185,532 | 13.9% |
[ 36.5% - 37.0% ] 36.75% | 566,088 | 14.5% |
[ 37.0% - 37.5% ] 37.25% | 923,832 | 13.5% |
[ 37.5% - 38.0% ] 37.80% | 835,939 | 13.8% |
[ 38.0% - 38.5% ] 38.19% | 957,278 | 14.5% |
[ 38.5% - 39.0% ] 38.70% | 1,454,820 | 13.5% |
[ 39.0% - 39.5% ] 39.31% | 538,891 | 15.5% |
[ 39.5% - 40.0% ] 39.68% | 922,379 | 13.9% |
[ 40.0% - 40.5% ] 40.16% | 2,716,686 | 13.0% |
[ 40.5% - 41.0% ] 40.73% | 1,183,405 | 14.1% |
[ 41.0% - 41.5% ] 41.26% | 1,038,804 | 14.5% |
[ 41.5% - 42.0% ] 41.76% | 965,377 | 13.7% |
[ 42.0% - 42.5% ] 42.25% | 887,803 | 14.6% |
[ 42.5% - 43.0% ] 42.73% | 1,022,461 | 13.8% |
[ 43.0% - 43.5% ] 43.19% | 1,018,088 | 14.3% |
[ 43.5% - 44.0% ] 43.82% | 1,003,576 | 14.5% |
[ 44.0% - 44.5% ] 44.29% | 1,188,174 | 11.5% |
[ 44.5% - 45.0% ] 44.74% | 678,406 | 15.4% |
[ 45.0% - 45.5% ] 45.34% | 700,186 | 14.6% |
[ 45.5% - 46.0% ] 45.74% | 601,939 | 15.4% |
[ 46.0% - 46.5% ] 46.24% | 747,547 | 14.5% |
[ 46.5% - 47.0% ] 46.72% | 1,079,111 | 15.3% |
[ 47.0% - 47.5% ] 47.16% | 749,579 | 13.2% |
[ 47.5% - 48.0% ] 47.65% | 1,076,399 | 13.9% |
[ 48.0% - 48.5% ] 48.26% | 306,449 | 14.8% |
[ 48.5% - 49.0% ] 48.84% | 491,308 | 14.4% |
[ 49.0% - 49.5% ] 49.23% | 487,373 | 15.1% |
[ 49.5% - 50.0% ] 49.74% | 554,909 | 14.3% |
[ 50.0% - 50.5% ] 50.24% | 941,781 | 14.6% |
[ 50.5% - 51.0% ] 50.77% | 202,827 | 15.2% |
[ 51.0% - 51.5% ] 51.29% | 577,266 | 15.1% |
[ 51.5% - 52.0% ] 51.63% | 661,417 | 14.4% |
[ 52.0% - 52.5% ] 52.28% | 539,390 | 15.3% |
[ 52.5% - 53.0% ] 52.63% | 675,996 | 14.0% |
[ 53.0% - 53.5% ] 53.22% | 700,323 | 14.6% |
[ 53.5% - 54.0% ] 53.72% | 388,718 | 14.5% |
[ 54.0% - 54.5% ] 54.32% | 691,307 | 14.0% |
[ 54.5% - 55.0% ] 54.71% | 357,838 | 15.0% |
[ 55.0% - 55.5% ] 55.28% | 449,182 | 14.0% |
[ 55.5% - 56.0% ] 55.69% | 469,101 | 16.0% |
[ 56.0% - 56.5% ] 56.31% | 567,207 | 15.0% |
[ 56.5% - 57.0% ] 56.67% | 515,797 | 15.1% |
[ 57.0% - 57.5% ] 57.10% | 687,985 | 14.5% |
[ 57.5% - 58.0% ] 57.77% | 319,118 | 15.7% |
[ 58.0% - 58.5% ] 58.25% | 369,284 | 15.4% |
[ 58.5% - 59.0% ] 58.76% | 288,853 | 14.8% |
[ 59.0% - 59.5% ] 59.21% | 339,006 | 14.2% |
[ 59.5% - 60.0% ] 59.79% | 367,714 | 14.7% |
[ 60.0% - 60.5% ] 60.22% | 273,349 | 16.0% |
[ 60.5% - 61.0% ] 60.74% | 455,585 | 14.3% |
[ 61.0% - 61.5% ] 61.26% | 881,467 | 14.4% |
[ 61.5% - 62.0% ] 61.73% | 425,819 | 15.2% |
[ 62.0% - 62.5% ] 62.27% | 440,284 | 16.4% |
[ 62.5% - 63.0% ] 62.78% | 517,702 | 15.1% |
[ 63.0% - 63.5% ] 63.24% | 302,198 | 16.3% |
[ 63.5% - 64.0% ] 63.75% | 418,331 | 15.4% |
[ 64.0% - 64.5% ] 64.29% | 1,056,217 | 14.8% |
[ 64.5% - 65.0% ] 64.71% | 329,795 | 15.4% |
[ 65.0% - 65.5% ] 65.21% | 556,403 | 16.0% |
[ 65.5% - 66.0% ] 65.77% | 280,603 | 15.6% |
[ 66.0% - 66.5% ] 66.29% | 270,593 | 15.2% |
[ 66.5% - 67.0% ] 66.83% | 343,856 | 15.1% |
[ 67.0% - 67.5% ] 67.20% | 242,769 | 14.9% |
[ 67.5% - 68.0% ] 67.68% | 192,403 | 15.2% |
[ 68.0% - 68.5% ] 68.16% | 157,947 | 17.3% |
[ 68.5% - 69.0% ] 68.63% | 498,971 | 16.1% |
[ 69.0% - 69.5% ] 69.27% | 207,322 | 15.6% |
[ 69.5% - 70.0% ] 69.77% | 133,819 | 15.5% |
[ 70.0% - 70.5% ] 70.26% | 277,002 | 15.8% |
[ 70.5% - 71.0% ] 70.70% | 389,467 | 13.9% |
[ 71.0% - 71.5% ] 71.27% | 304,215 | 16.0% |
[ 71.5% - 72.0% ] 71.71% | 226,186 | 16.5% |
[ 72.0% - 72.5% ] 72.20% | 237,075 | 14.2% |
[ 72.5% - 73.0% ] 72.65% | 183,072 | 15.4% |
[ 73.0% - 73.5% ] 73.16% | 264,784 | 14.1% |
[ 73.5% - 74.0% ] 73.78% | 357,829 | 15.3% |
[ 74.0% - 74.5% ] 74.25% | 250,538 | 16.6% |
[ 74.5% - 75.0% ] 74.67% | 279,597 | 15.3% |
[ 75.0% - 75.5% ] 75.24% | 180,798 | 17.4% |
[ 75.5% - 76.0% ] 75.77% | 256,101 | 16.7% |
[ 76.0% - 76.5% ] 76.30% | 238,911 | 16.9% |
[ 76.5% - 77.0% ] 76.66% | 115,520 | 17.1% |
[ 77.0% - 77.5% ] 77.38% | 232,771 | 15.4% |
[ 77.5% - 78.0% ] 77.78% | 840,919 | 15.5% |
[ 78.0% - 78.5% ] 78.22% | 231,028 | 15.7% |
[ 78.5% - 79.0% ] 78.83% | 262,715 | 14.7% |
[ 79.0% - 79.5% ] 79.27% | 273,552 | 16.1% |
[ 79.5% - 80.0% ] 79.70% | 131,846 | 15.5% |
[ 80.0% - 80.5% ] 80.21% | 288,612 | 14.8% |
[ 80.5% - 81.0% ] 80.65% | 233,292 | 15.3% |
[ 81.0% - 81.5% ] 81.29% | 241,694 | 15.8% |
[ 81.5% - 82.0% ] 81.68% | 300,828 | 14.7% |
[ 82.0% - 82.5% ] 82.19% | 444,388 | 13.9% |
[ 82.5% - 83.0% ] 82.75% | 167,206 | 15.3% |
[ 83.0% - 83.5% ] 83.34% | 88,337 | 14.2% |
[ 83.5% - 84.0% ] 83.87% | 65,425 | 14.7% |
[ 84.0% - 84.5% ] 84.33% | 187,741 | 15.2% |
[ 84.5% - 85.0% ] 84.73% | 167,286 | 13.4% |
[ 85.0% - 85.5% ] 85.25% | 144,640 | 16.5% |
[ 85.5% - 86.0% ] 85.78% | 144,161 | 16.9% |
[ 86.0% - 86.5% ] 86.33% | 145,273 | 14.1% |
[ 86.5% - 87.0% ] 86.65% | 271,251 | 15.2% |
[ 87.0% - 87.5% ] 87.27% | 176,487 | 16.0% |
[ 87.5% - 88.0% ] 87.74% | 210,065 | 14.9% |
[ 88.0% - 88.5% ] 88.28% | 150,038 | 16.7% |
[ 88.5% - 89.0% ] 88.77% | 204,828 | 15.7% |
[ 89.0% - 89.5% ] 89.16% | 154,227 | 16.4% |
[ 89.5% - 90.0% ] 89.70% | 226,451 | 18.6% |
[ 90.0% - 90.5% ] 90.19% | 89,807 | 15.0% |
[ 90.5% - 91.0% ] 90.87% | 107,897 | 15.4% |
[ 91.0% - 91.5% ] 91.23% | 372,370 | 14.7% |
[ 91.5% - 92.0% ] 91.80% | 140,944 | 16.1% |
[ 92.0% - 92.5% ] 92.26% | 98,594 | 17.1% |
[ 92.5% - 93.0% ] 92.70% | 161,779 | 17.5% |
[ 93.0% - 93.5% ] 93.22% | 188,522 | 16.8% |
[ 93.5% - 94.0% ] 93.70% | 269,491 | 16.7% |
[ 94.0% - 94.5% ] 94.37% | 118,711 | 16.8% |
[ 94.5% - 95.0% ] 94.72% | 106,767 | 15.7% |
[ 95.0% - 95.5% ] 95.23% | 87,287 | 15.7% |
[ 95.5% - 96.0% ] 95.80% | 80,782 | 18.0% |
[ 96.0% - 96.5% ] 96.26% | 46,388 | 15.8% |
[ 96.5% - 97.0% ] 96.82% | 15,879 | 19.3% |
[ 97.0% - 97.5% ] 97.19% | 4,949 | 14.7% |
[ 97.5% - 98.0% ] 97.80% | 4,824 | 12.5% |
[ 98.0% - 98.5% ] 98.32% | 10,547 | 14.9% |
[ 98.5% - 99.0% ] 98.63% | 16,256 | 14.2% |
[ 99.0% - 99.5% ] 99.22% | 15,089 | 19.2% |
[ 99.5% - 100.0% ] 99.96% | 17,564 | 20.4% |