Black/African American Median Earnings
COMPARE
Black/African American
Select to Compare
Median Earnings
Black/African American Median Earnings
$40,085
EARNINGS
0.0/ 100
METRIC RATING
319th/ 347
METRIC RANK
Black/African American Median Earnings Correlation Chart
The statistical analysis conducted on geographies consisting of 564,527,137 people shows a strong negative correlation between the proportion of Blacks/African Americans and median earnings in the United States with a correlation coefficient (R) of -0.782 and weighted average of $40,085. On average, for every 1% (one percent) increase in Blacks/African Americans within a typical geography, there is a decrease of $141 in median earnings.
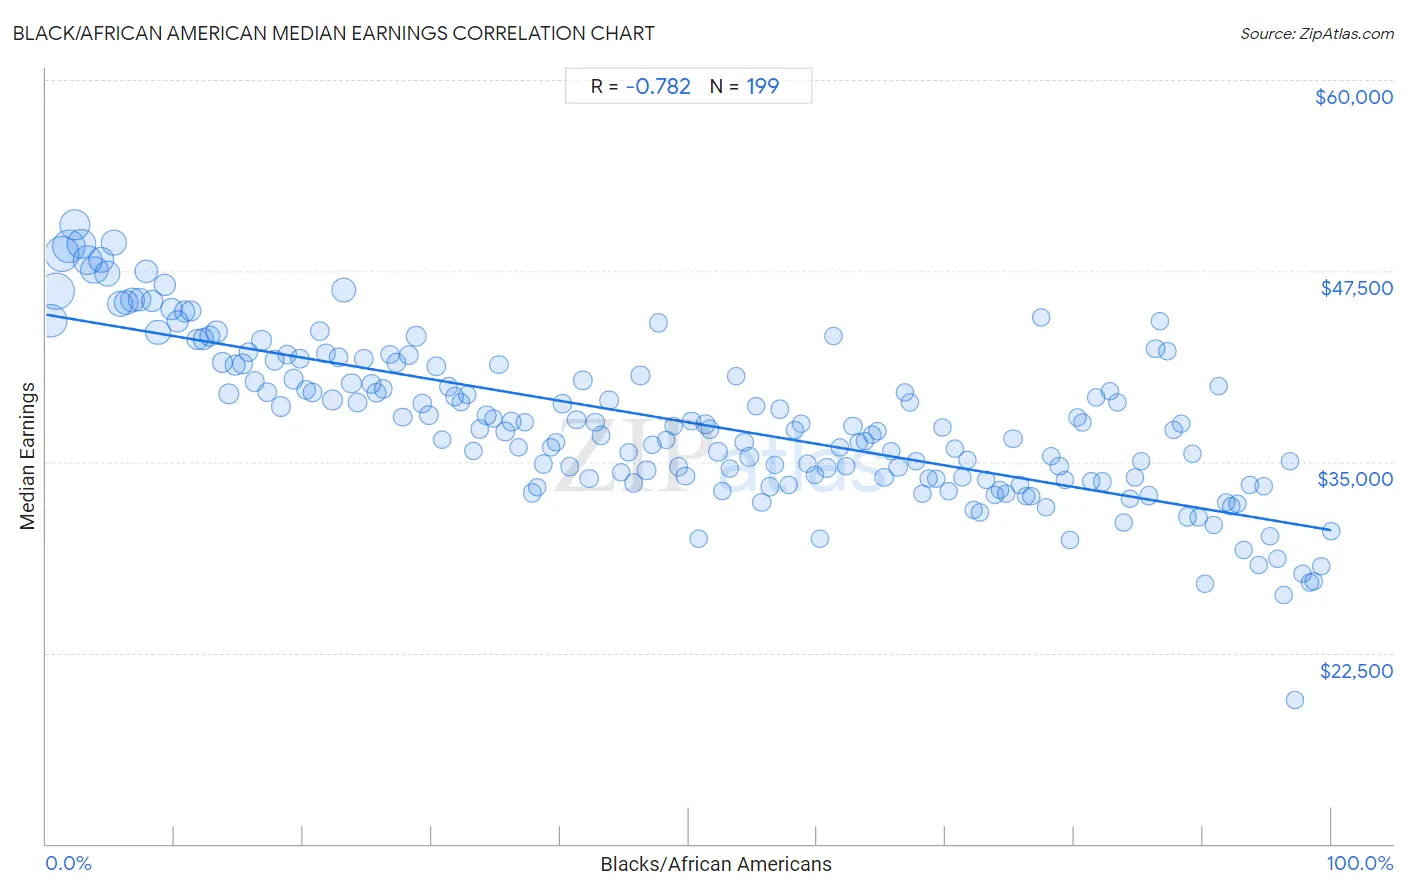
It is essential to understand that the correlation between the percentage of Blacks/African Americans and median earnings does not imply a direct cause-and-effect relationship. It remains uncertain whether the presence of Blacks/African Americans influences an upward or downward trend in the level of median earnings within an area, or if Blacks/African Americans simply ended up residing in those areas with higher or lower levels of median earnings due to other factors.
Demographics Similar to Blacks/African Americans by Median Earnings
In terms of median earnings, the demographic groups most similar to Blacks/African Americans are Dutch West Indian ($40,107, a difference of 0.060%), Immigrants from Honduras ($40,195, a difference of 0.27%), Fijian ($40,193, a difference of 0.27%), Cheyenne ($40,233, a difference of 0.37%), and Seminole ($40,233, a difference of 0.37%).
| Demographics | Rating | Rank | Median Earnings |
| Chippewa | 0.0 /100 | #312 | Tragic $40,287 |
| Choctaw | 0.0 /100 | #313 | Tragic $40,270 |
| Cheyenne | 0.0 /100 | #314 | Tragic $40,233 |
| Seminole | 0.0 /100 | #315 | Tragic $40,233 |
| Immigrants from Honduras | 0.0 /100 | #316 | Tragic $40,195 |
| Fijians | 0.0 /100 | #317 | Tragic $40,193 |
| Dutch West Indians | 0.0 /100 | #318 | Tragic $40,107 |
| Blacks/African Americans | 0.0 /100 | #319 | Tragic $40,085 |
| Immigrants from Bahamas | 0.0 /100 | #320 | Tragic $39,861 |
| Mexicans | 0.0 /100 | #321 | Tragic $39,834 |
| Immigrants from Central America | 0.0 /100 | #322 | Tragic $39,762 |
| Bahamians | 0.0 /100 | #323 | Tragic $39,735 |
| Ottawa | 0.0 /100 | #324 | Tragic $39,721 |
| Creek | 0.0 /100 | #325 | Tragic $39,648 |
| Immigrants from Yemen | 0.0 /100 | #326 | Tragic $39,540 |
Black/African American Median Earnings Correlation Summary
| Measurement | Black/African American Data | Median Earnings Data |
| Minimum | 0.26% | $19,448 |
| Maximum | 100.0% | $50,539 |
| Range | 99.7% | $31,091 |
| Mean | 50.0% | $37,581 |
| Median | 50.2% | $37,241 |
| Interquartile 25% (IQ1) | 24.7% | $33,915 |
| Interquartile 75% (IQ3) | 75.2% | $41,371 |
| Interquartile Range (IQR) | 50.5% | $7,457 |
| Standard Deviation (Sample) | 29.0% | $5,238 |
| Standard Deviation (Population) | 28.9% | $5,225 |
Correlation Details
| Black/African American Percentile | Sample Size | Median Earnings |
[ 0.0% - 0.5% ] 0.26% | 30,287,421 | $44,242 |
[ 0.5% - 1.0% ] 0.74% | 35,422,385 | $46,130 |
[ 1.0% - 1.5% ] 1.23% | 32,440,132 | $48,593 |
[ 1.5% - 2.0% ] 1.74% | 28,004,891 | $49,094 |
[ 2.0% - 2.5% ] 2.24% | 24,407,742 | $50,539 |
[ 2.5% - 3.0% ] 2.75% | 20,777,234 | $49,286 |
[ 3.0% - 3.5% ] 3.25% | 20,754,765 | $48,234 |
[ 3.5% - 4.0% ] 3.74% | 16,833,708 | $47,538 |
[ 4.0% - 4.5% ] 4.25% | 14,643,914 | $48,235 |
[ 4.5% - 5.0% ] 4.74% | 14,931,902 | $47,326 |
[ 5.0% - 5.5% ] 5.24% | 13,630,328 | $49,377 |
[ 5.5% - 6.0% ] 5.76% | 13,838,132 | $45,313 |
[ 6.0% - 6.5% ] 6.23% | 11,814,859 | $45,466 |
[ 6.5% - 7.0% ] 6.72% | 11,748,955 | $45,580 |
[ 7.0% - 7.5% ] 7.26% | 11,011,379 | $45,629 |
[ 7.5% - 8.0% ] 7.75% | 9,130,266 | $47,491 |
[ 8.0% - 8.5% ] 8.24% | 8,315,297 | $45,554 |
[ 8.5% - 9.0% ] 8.69% | 12,433,086 | $43,498 |
[ 9.0% - 9.5% ] 9.24% | 7,624,868 | $46,620 |
[ 9.5% - 10.0% ] 9.75% | 5,952,086 | $44,984 |
[ 10.0% - 10.5% ] 10.26% | 6,442,339 | $44,209 |
[ 10.5% - 11.0% ] 10.76% | 6,074,612 | $44,848 |
[ 11.0% - 11.5% ] 11.27% | 6,015,424 | $44,899 |
[ 11.5% - 12.0% ] 11.75% | 6,660,511 | $43,019 |
[ 12.0% - 12.5% ] 12.24% | 5,854,226 | $43,026 |
[ 12.5% - 13.0% ] 12.73% | 5,245,053 | $43,261 |
[ 13.0% - 13.5% ] 13.26% | 5,611,267 | $43,521 |
[ 13.5% - 14.0% ] 13.72% | 4,990,497 | $41,480 |
[ 14.0% - 14.5% ] 14.23% | 4,377,327 | $39,478 |
[ 14.5% - 15.0% ] 14.73% | 4,207,104 | $41,309 |
[ 15.0% - 15.5% ] 15.25% | 4,408,505 | $41,396 |
[ 15.5% - 16.0% ] 15.75% | 3,609,759 | $42,171 |
[ 16.0% - 16.5% ] 16.25% | 3,276,031 | $40,240 |
[ 16.5% - 17.0% ] 16.75% | 3,427,497 | $42,970 |
[ 17.0% - 17.5% ] 17.22% | 3,515,098 | $39,553 |
[ 17.5% - 18.0% ] 17.77% | 3,689,186 | $41,673 |
[ 18.0% - 18.5% ] 18.26% | 3,605,583 | $38,621 |
[ 18.5% - 19.0% ] 18.73% | 3,681,218 | $42,037 |
[ 19.0% - 19.5% ] 19.23% | 3,054,672 | $40,417 |
[ 19.5% - 20.0% ] 19.75% | 2,546,276 | $41,749 |
[ 20.0% - 20.5% ] 20.23% | 2,765,012 | $39,685 |
[ 20.5% - 21.0% ] 20.77% | 2,361,638 | $39,521 |
[ 21.0% - 21.5% ] 21.29% | 2,733,896 | $43,523 |
[ 21.5% - 22.0% ] 21.77% | 3,751,553 | $42,115 |
[ 22.0% - 22.5% ] 22.31% | 4,863,603 | $39,053 |
[ 22.5% - 23.0% ] 22.72% | 3,026,655 | $41,831 |
[ 23.0% - 23.5% ] 23.15% | 11,620,719 | $46,231 |
[ 23.5% - 24.0% ] 23.75% | 3,974,596 | $40,137 |
[ 24.0% - 24.5% ] 24.22% | 2,195,248 | $38,901 |
[ 24.5% - 25.0% ] 24.74% | 1,995,209 | $41,746 |
[ 25.0% - 25.5% ] 25.28% | 1,592,984 | $40,119 |
[ 25.5% - 26.0% ] 25.71% | 1,475,722 | $39,538 |
[ 26.0% - 26.5% ] 26.22% | 1,912,730 | $39,767 |
[ 26.5% - 27.0% ] 26.77% | 2,137,970 | $42,035 |
[ 27.0% - 27.5% ] 27.23% | 1,792,218 | $41,498 |
[ 27.5% - 28.0% ] 27.75% | 1,494,180 | $37,919 |
[ 28.0% - 28.5% ] 28.22% | 1,991,386 | $41,983 |
[ 28.5% - 29.0% ] 28.80% | 4,745,170 | $43,235 |
[ 29.0% - 29.5% ] 29.24% | 3,243,803 | $38,812 |
[ 29.5% - 30.0% ] 29.77% | 1,874,457 | $38,051 |
[ 30.0% - 30.5% ] 30.35% | 2,248,718 | $41,223 |
[ 30.5% - 31.0% ] 30.81% | 1,192,031 | $36,455 |
[ 31.0% - 31.5% ] 31.29% | 966,175 | $39,941 |
[ 31.5% - 32.0% ] 31.79% | 1,021,738 | $39,257 |
[ 32.0% - 32.5% ] 32.27% | 1,278,846 | $38,918 |
[ 32.5% - 33.0% ] 32.74% | 744,195 | $39,377 |
[ 33.0% - 33.5% ] 33.25% | 1,258,310 | $35,724 |
[ 33.5% - 34.0% ] 33.75% | 918,694 | $37,135 |
[ 34.0% - 34.5% ] 34.28% | 835,973 | $38,042 |
[ 34.5% - 35.0% ] 34.79% | 927,523 | $37,851 |
[ 35.0% - 35.5% ] 35.24% | 1,769,920 | $41,371 |
[ 35.5% - 36.0% ] 35.74% | 1,288,164 | $36,966 |
[ 36.0% - 36.5% ] 36.23% | 1,184,676 | $37,620 |
[ 36.5% - 37.0% ] 36.75% | 565,468 | $35,977 |
[ 37.0% - 37.5% ] 37.25% | 923,678 | $37,582 |
[ 37.5% - 38.0% ] 37.80% | 835,170 | $32,977 |
[ 38.0% - 38.5% ] 38.19% | 955,342 | $33,333 |
[ 38.5% - 39.0% ] 38.70% | 1,455,834 | $34,868 |
[ 39.0% - 39.5% ] 39.31% | 537,275 | $35,944 |
[ 39.5% - 40.0% ] 39.68% | 923,590 | $36,268 |
[ 40.0% - 40.5% ] 40.16% | 2,715,407 | $38,790 |
[ 40.5% - 41.0% ] 40.73% | 1,181,679 | $34,710 |
[ 41.0% - 41.5% ] 41.26% | 1,037,471 | $37,752 |
[ 41.5% - 42.0% ] 41.76% | 965,500 | $40,340 |
[ 42.0% - 42.5% ] 42.25% | 885,832 | $33,915 |
[ 42.5% - 43.0% ] 42.73% | 1,024,019 | $37,601 |
[ 43.0% - 43.5% ] 43.19% | 1,014,305 | $36,752 |
[ 43.5% - 44.0% ] 43.82% | 1,001,896 | $39,020 |
[ 44.5% - 45.0% ] 44.74% | 683,803 | $34,327 |
[ 45.0% - 45.5% ] 45.34% | 701,592 | $35,627 |
[ 45.5% - 46.0% ] 45.74% | 601,128 | $33,625 |
[ 46.0% - 46.5% ] 46.24% | 745,785 | $40,656 |
[ 46.5% - 47.0% ] 46.72% | 1,078,686 | $34,460 |
[ 47.0% - 47.5% ] 47.16% | 751,256 | $36,107 |
[ 47.5% - 48.0% ] 47.65% | 1,078,374 | $44,088 |
[ 48.0% - 48.5% ] 48.26% | 306,449 | $36,415 |
[ 48.5% - 49.0% ] 48.84% | 490,450 | $37,355 |
[ 49.0% - 49.5% ] 49.22% | 473,522 | $34,677 |
[ 49.5% - 50.0% ] 49.74% | 553,844 | $34,089 |
[ 50.0% - 50.5% ] 50.24% | 943,474 | $37,685 |
[ 50.5% - 51.0% ] 50.77% | 202,827 | $29,970 |
[ 51.0% - 51.5% ] 51.29% | 577,266 | $37,472 |
[ 51.5% - 52.0% ] 51.63% | 660,481 | $37,134 |
[ 52.0% - 52.5% ] 52.28% | 536,440 | $35,665 |
[ 52.5% - 53.0% ] 52.63% | 675,996 | $33,063 |
[ 53.0% - 53.5% ] 53.22% | 700,178 | $34,550 |
[ 53.5% - 54.0% ] 53.72% | 387,500 | $40,639 |
[ 54.0% - 54.5% ] 54.32% | 691,063 | $36,254 |
[ 54.5% - 55.0% ] 54.71% | 354,429 | $35,335 |
[ 55.0% - 55.5% ] 55.28% | 448,944 | $38,633 |
[ 55.5% - 56.0% ] 55.69% | 469,101 | $32,349 |
[ 56.0% - 56.5% ] 56.31% | 566,943 | $33,366 |
[ 56.5% - 57.0% ] 56.67% | 515,148 | $34,816 |
[ 57.0% - 57.5% ] 57.10% | 687,179 | $38,460 |
[ 57.5% - 58.0% ] 57.77% | 317,872 | $33,478 |
[ 58.0% - 58.5% ] 58.25% | 368,240 | $37,119 |
[ 58.5% - 59.0% ] 58.76% | 288,189 | $37,531 |
[ 59.0% - 59.5% ] 59.21% | 338,755 | $34,855 |
[ 59.5% - 60.0% ] 59.79% | 366,988 | $34,145 |
[ 60.0% - 60.5% ] 60.22% | 273,349 | $29,953 |
[ 60.5% - 61.0% ] 60.74% | 455,585 | $34,594 |
[ 61.0% - 61.5% ] 61.26% | 882,360 | $43,213 |
[ 61.5% - 62.0% ] 61.73% | 425,819 | $35,939 |
[ 62.0% - 62.5% ] 62.27% | 435,890 | $34,697 |
[ 62.5% - 63.0% ] 62.78% | 517,897 | $37,333 |
[ 63.0% - 63.5% ] 63.24% | 302,198 | $36,238 |
[ 63.5% - 64.0% ] 63.75% | 418,130 | $36,367 |
[ 64.0% - 64.5% ] 64.30% | 1,058,104 | $36,759 |
[ 64.5% - 65.0% ] 64.71% | 329,795 | $36,980 |
[ 65.0% - 65.5% ] 65.21% | 554,188 | $34,010 |
[ 65.5% - 66.0% ] 65.77% | 282,402 | $35,696 |
[ 66.0% - 66.5% ] 66.28% | 269,691 | $34,662 |
[ 66.5% - 67.0% ] 66.83% | 340,782 | $39,560 |
[ 67.0% - 67.5% ] 67.20% | 242,298 | $38,872 |
[ 67.5% - 68.0% ] 67.68% | 192,259 | $35,036 |
[ 68.0% - 68.5% ] 68.16% | 157,759 | $32,915 |
[ 68.5% - 69.0% ] 68.63% | 498,971 | $33,934 |
[ 69.0% - 69.5% ] 69.27% | 207,718 | $33,882 |
[ 69.5% - 70.0% ] 69.77% | 133,688 | $37,241 |
[ 70.0% - 70.5% ] 70.26% | 276,507 | $33,057 |
[ 70.5% - 71.0% ] 70.70% | 389,925 | $35,872 |
[ 71.0% - 71.5% ] 71.27% | 304,156 | $33,961 |
[ 71.5% - 72.0% ] 71.71% | 225,323 | $35,090 |
[ 72.0% - 72.5% ] 72.20% | 236,924 | $31,828 |
[ 72.5% - 73.0% ] 72.65% | 182,815 | $31,676 |
[ 73.0% - 73.5% ] 73.16% | 265,102 | $33,787 |
[ 73.5% - 74.0% ] 73.78% | 357,875 | $32,819 |
[ 74.0% - 74.5% ] 74.25% | 249,491 | $33,136 |
[ 74.5% - 75.0% ] 74.67% | 278,321 | $32,915 |
[ 75.0% - 75.5% ] 75.24% | 179,506 | $36,494 |
[ 75.5% - 76.0% ] 75.77% | 255,750 | $33,500 |
[ 76.0% - 76.5% ] 76.30% | 239,353 | $32,783 |
[ 76.5% - 77.0% ] 76.66% | 116,485 | $32,789 |
[ 77.0% - 77.5% ] 77.38% | 232,771 | $44,458 |
[ 77.5% - 78.0% ] 77.78% | 840,537 | $32,034 |
[ 78.0% - 78.5% ] 78.22% | 230,805 | $35,372 |
[ 78.5% - 79.0% ] 78.83% | 262,734 | $34,692 |
[ 79.0% - 79.5% ] 79.27% | 273,292 | $33,821 |
[ 79.5% - 80.0% ] 79.71% | 132,710 | $29,882 |
[ 80.0% - 80.5% ] 80.21% | 286,883 | $37,877 |
[ 80.5% - 81.0% ] 80.65% | 231,716 | $37,575 |
[ 81.0% - 81.5% ] 81.29% | 240,652 | $33,735 |
[ 81.5% - 82.0% ] 81.69% | 300,121 | $39,190 |
[ 82.0% - 82.5% ] 82.19% | 444,388 | $33,694 |
[ 82.5% - 83.0% ] 82.75% | 167,206 | $39,616 |
[ 83.0% - 83.5% ] 83.34% | 88,337 | $38,875 |
[ 83.5% - 84.0% ] 83.87% | 65,425 | $31,060 |
[ 84.0% - 84.5% ] 84.33% | 187,741 | $32,626 |
[ 84.5% - 85.0% ] 84.73% | 166,359 | $34,006 |
[ 85.0% - 85.5% ] 85.25% | 144,475 | $35,065 |
[ 85.5% - 86.0% ] 85.78% | 144,231 | $32,793 |
[ 86.0% - 86.5% ] 86.33% | 144,971 | $42,379 |
[ 86.5% - 87.0% ] 86.65% | 269,617 | $44,219 |
[ 87.0% - 87.5% ] 87.27% | 177,423 | $42,231 |
[ 87.5% - 88.0% ] 87.74% | 209,367 | $37,127 |
[ 88.0% - 88.5% ] 88.28% | 149,935 | $37,465 |
[ 88.5% - 89.0% ] 88.77% | 207,484 | $31,401 |
[ 89.0% - 89.5% ] 89.16% | 153,732 | $35,568 |
[ 89.5% - 90.0% ] 89.70% | 226,451 | $31,334 |
[ 90.0% - 90.5% ] 90.19% | 89,807 | $27,044 |
[ 90.5% - 91.0% ] 90.87% | 106,939 | $30,879 |
[ 91.0% - 91.5% ] 91.23% | 372,370 | $39,959 |
[ 91.5% - 92.0% ] 91.80% | 140,920 | $32,374 |
[ 92.0% - 92.5% ] 92.26% | 98,833 | $32,077 |
[ 92.5% - 93.0% ] 92.70% | 162,088 | $32,266 |
[ 93.0% - 93.5% ] 93.22% | 188,130 | $29,197 |
[ 93.5% - 94.0% ] 93.70% | 269,377 | $33,478 |
[ 94.0% - 94.5% ] 94.37% | 118,571 | $28,237 |
[ 94.5% - 95.0% ] 94.72% | 106,447 | $33,436 |
[ 95.0% - 95.5% ] 95.23% | 85,533 | $30,146 |
[ 95.5% - 96.0% ] 95.80% | 80,782 | $28,658 |
[ 96.0% - 96.5% ] 96.26% | 45,135 | $26,279 |
[ 96.5% - 97.0% ] 96.82% | 15,968 | $35,057 |
[ 97.0% - 97.5% ] 97.19% | 4,949 | $19,448 |
[ 97.5% - 98.0% ] 97.78% | 3,924 | $27,650 |
[ 98.0% - 98.5% ] 98.31% | 10,106 | $27,141 |
[ 98.5% - 99.0% ] 98.63% | 16,256 | $27,187 |
[ 99.0% - 99.5% ] 99.21% | 16,160 | $28,136 |
[ 99.5% - 100.0% ] 99.95% | 15,448 | $30,422 |