Black/African American vs Immigrants from Vietnam Single Male Poverty

COMPARE

Black/African American
Race
Ancestry
AfghanAfricanAlaska NativeAlaskan AthabascanAlbanianAleutAlsatianAmericanApacheArabArapahoArgentineanArmenianAssyrian/Chaldean/SyriacAustralianAustrianBahamianBangladeshiBarbadianBasqueBelgianBelizeanBermudanBhutaneseBlackfeetBolivianBrazilianBritishBritish West IndianBulgarianBurmeseCajunCambodianCanadianCape VerdeanCarpatho RusynCelticCentral AmericanCentral American IndianCherokeeCheyenneChickasawChileanChineseChippewaChoctawColombianColvilleComancheCosta RicanCreeCreekCroatianCrowCubanCypriotCzechCzechoslovakianDanishDelawareDominicanDutchDutch West IndianEastern EuropeanEcuadorianEgyptianEnglishEstonianEthiopianEuropeanFijianFilipinoFinnishFrenchFrench American IndianFrench CanadianGermanGerman RussianGhanaianGreekGuamanian/ChamorroGuatemalanGuyaneseHaitianHmongHonduranHopiHoumaHungarianIcelanderIndian (Asian)IndonesianInupiatIranianIraqiIrishIroquoisIsraeliItalianJamaicanJapaneseJordanianKenyanKiowaKoreanLaotianLatvianLebaneseLiberianLithuanianLumbeeLuxembourgerMacedonianMalaysianMalteseMarshalleseMenomineeMexicanMexican American IndianMongolianMoroccanNative HawaiianNavajoNepaleseNew ZealanderNicaraguanNigerianNorthern EuropeanNorwegianOkinawanOsageOttawaPaiutePakistaniPalestinianPanamanianParaguayanPennsylvania GermanPeruvianPimaPolishPortuguesePotawatomiPuebloPuerto RicanPuget Sound SalishRomanianRussianSalvadoranSamoanScandinavianScotch-IrishScottishSeminoleSenegaleseSerbianShoshoneSierra LeoneanSiouxSlavicSlovakSloveneSomaliSouth AfricanSouth AmericanSouth American IndianSoviet UnionSpaniardSpanishSpanish AmericanSpanish American IndianSri LankanSubsaharan AfricanSudaneseSwedishSwissSyrianTaiwaneseThaiTlingit-HaidaTohono O'OdhamTonganTrinidadian and TobagonianTsimshianTurkishU.S. Virgin IslanderUgandanUkrainianUruguayanUteVenezuelanVietnameseWelshWest IndianYakamaYaquiYugoslavianYumanYup'ikZimbabwean
Immigration
NonimmigrantsImmigrantsAfghanistanAfricaAlbaniaArgentinaArmeniaAsiaAustraliaAustriaBahamasBangladeshBarbadosBelarusBelgiumBelizeBoliviaBosnia and HerzegovinaBrazilBulgariaBurma/MyanmarCabo VerdeCambodiaCameroonCanadaCaribbeanCentral AmericaChileChinaColombiaCongoCosta RicaCroatiaCubaCzechoslovakiaDenmarkDominicaDominican RepublicEastern AfricaEastern AsiaEastern EuropeEcuadorEgyptEl SalvadorEnglandEritreaEthiopiaEuropeFijiFranceGermanyGhanaGreeceGrenadaGuatemalaGuyanaHaitiHondurasHong KongHungaryIndiaIndonesiaIranIraqIrelandIsraelItalyJamaicaJapanJordanKazakhstanKenyaKoreaKuwaitLaosLatin AmericaLatviaLebanonLiberiaLithuaniaMalaysiaMexicoMicronesiaMiddle AfricaMoldovaMoroccoNepalNetherlandsNicaraguaNigeriaNorth AmericaNorth MacedoniaNorthern AfricaNorthern EuropeNorwayOceaniaPakistanPanamaPeruPhilippinesPolandPortugalRomaniaRussiaSaudi ArabiaScotlandSenegalSerbiaSierra LeoneSingaporeSomaliaSouth AfricaSouth AmericaSouth Central AsiaSouth Eastern AsiaSouthern EuropeSpainSri LankaSt. Vincent and the GrenadinesSudanSwedenSwitzerlandSyriaTaiwanThailandTrinidad and TobagoTurkeyUgandaUkraineUruguayUzbekistanVenezuelaWest IndiesWestern AfricaWestern AsiaWestern EuropeYemenZaireZimbabweAzores
Immigrants from Vietnam
Race
Ancestry
AfghanAfricanAlaska NativeAlaskan AthabascanAlbanianAleutAlsatianAmericanApacheArabArapahoArgentineanArmenianAssyrian/Chaldean/SyriacAustralianAustrianBahamianBangladeshiBarbadianBasqueBelgianBelizeanBermudanBhutaneseBlackfeetBolivianBrazilianBritishBritish West IndianBulgarianBurmeseCajunCambodianCanadianCape VerdeanCarpatho RusynCelticCentral AmericanCentral American IndianCherokeeCheyenneChickasawChileanChineseChippewaChoctawColombianColvilleComancheCosta RicanCreeCreekCroatianCrowCubanCypriotCzechCzechoslovakianDanishDelawareDominicanDutchDutch West IndianEastern EuropeanEcuadorianEgyptianEnglishEstonianEthiopianEuropeanFijianFilipinoFinnishFrenchFrench American IndianFrench CanadianGermanGerman RussianGhanaianGreekGuamanian/ChamorroGuatemalanGuyaneseHaitianHmongHonduranHopiHoumaHungarianIcelanderIndian (Asian)IndonesianInupiatIranianIraqiIrishIroquoisIsraeliItalianJamaicanJapaneseJordanianKenyanKiowaKoreanLaotianLatvianLebaneseLiberianLithuanianLumbeeLuxembourgerMacedonianMalaysianMalteseMarshalleseMenomineeMexicanMexican American IndianMongolianMoroccanNative HawaiianNavajoNepaleseNew ZealanderNicaraguanNigerianNorthern EuropeanNorwegianOkinawanOsageOttawaPaiutePakistaniPalestinianPanamanianParaguayanPennsylvania GermanPeruvianPimaPolishPortuguesePotawatomiPuebloPuerto RicanPuget Sound SalishRomanianRussianSalvadoranSamoanScandinavianScotch-IrishScottishSeminoleSenegaleseSerbianShoshoneSierra LeoneanSiouxSlavicSlovakSloveneSomaliSouth AfricanSouth AmericanSouth American IndianSoviet UnionSpaniardSpanishSpanish AmericanSpanish American IndianSri LankanSubsaharan AfricanSudaneseSwedishSwissSyrianTaiwaneseThaiTlingit-HaidaTohono O'OdhamTonganTrinidadian and TobagonianTsimshianTurkishU.S. Virgin IslanderUgandanUkrainianUruguayanUteVenezuelanVietnameseWelshWest IndianYakamaYaquiYugoslavianYumanYup'ikZimbabwean
Immigration
NonimmigrantsImmigrantsAfghanistanAfricaAlbaniaArgentinaArmeniaAsiaAustraliaAustriaBahamasBangladeshBarbadosBelarusBelgiumBelizeBoliviaBosnia and HerzegovinaBrazilBulgariaBurma/MyanmarCabo VerdeCambodiaCameroonCanadaCaribbeanCentral AmericaChileChinaColombiaCongoCosta RicaCroatiaCubaCzechoslovakiaDenmarkDominicaDominican RepublicEastern AfricaEastern AsiaEastern EuropeEcuadorEgyptEl SalvadorEnglandEritreaEthiopiaEuropeFijiFranceGermanyGhanaGreeceGrenadaGuatemalaGuyanaHaitiHondurasHong KongHungaryIndiaIndonesiaIranIraqIrelandIsraelItalyJamaicaJapanJordanKazakhstanKenyaKoreaKuwaitLaosLatin AmericaLatviaLebanonLiberiaLithuaniaMalaysiaMexicoMicronesiaMiddle AfricaMoldovaMoroccoNepalNetherlandsNicaraguaNigeriaNorth AmericaNorth MacedoniaNorthern AfricaNorthern EuropeNorwayOceaniaPakistanPanamaPeruPhilippinesPolandPortugalRomaniaRussiaSaudi ArabiaScotlandSenegalSerbiaSierra LeoneSingaporeSomaliaSouth AfricaSouth AmericaSouth Central AsiaSouth Eastern AsiaSouthern EuropeSpainSri LankaSt. Vincent and the GrenadinesSudanSwedenSwitzerlandSyriaTaiwanThailandTrinidad and TobagoTurkeyUgandaUkraineUruguayUzbekistanVenezuelaVietnamWest IndiesWestern AfricaWestern AsiaWestern EuropeYemenZaireZimbabweAzores
Single Male Poverty
Income
Poverty
Unemployment
Labor Participation
Family Structure
Vehicle Availability
Education Level
Disability

Single Male Poverty Comparison

Blacks/African Americans

Immigrants from Vietnam

Tragic
Exceptional
16.2%
SINGLE MALE POVERTY
0.0/ 100
METRIC RATING
317th/ 347
METRIC RANK
11.4%
SINGLE MALE POVERTY
100.0/ 100
METRIC RATING
33rd/ 347
METRIC RANK

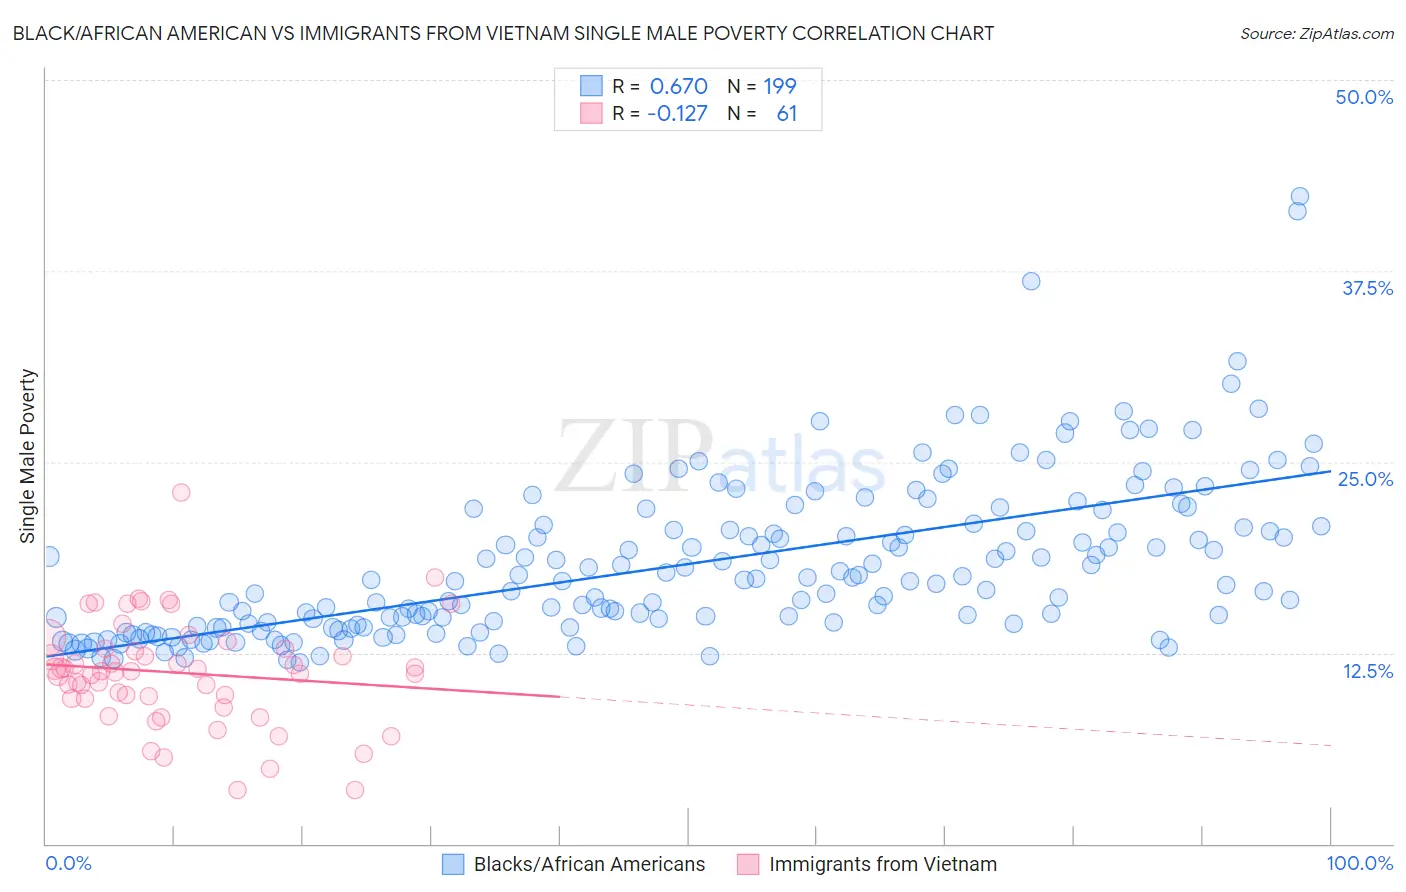
Black/African American vs Immigrants from Vietnam Single Male Poverty Correlation Chart

The statistical analysis conducted on geographies consisting of 472,674,082 people shows a significant positive correlation between the proportion of Blacks/African Americans and poverty level among single males in the United States with a correlation coefficient (R) of 0.670 and weighted average of 16.2%. Similarly, the statistical analysis conducted on geographies consisting of 361,378,073 people shows a poor negative correlation between the proportion of Immigrants from Vietnam and poverty level among single males in the United States with a correlation coefficient (R) of -0.127 and weighted average of 11.4%, a difference of 41.6%.
Black/African American vs Immigrants from Vietnam Single Male Poverty

Single Male Poverty Correlation Summary

MeasurementBlack/African AmericanImmigrants from Vietnam
Minimum11.9%3.5%
Maximum42.4%23.0%
Range30.6%19.5%
Mean18.3%11.2%
Median17.2%11.3%
Interquartile 25% (IQ1)14.2%9.5%
Interquartile 75% (IQ3)20.7%12.8%
Interquartile Range (IQR)6.5%3.3%
Standard Deviation (Sample)5.2%3.5%
Standard Deviation (Population)5.2%3.5%

Similar Demographics by Single Male Poverty

Demographics Similar to Blacks/African Americans by Single Male Poverty

In terms of single male poverty, the demographic groups most similar to Blacks/African Americans are Dutch West Indian (16.1%, a difference of 0.34%), Cheyenne (16.1%, a difference of 0.48%), Alaskan Athabascan (16.1%, a difference of 0.53%), Chickasaw (16.3%, a difference of 0.80%), and Cherokee (16.1%, a difference of 0.82%).
DemographicsRating | RankSingle Male Poverty
Yakama
0.0
/100
|
#310
Tragic
15.9%
Seminole
0.0
/100
|
#311
Tragic
16.0%
Comanche
0.0
/100
|
#312
Tragic
16.0%
Cherokee
0.0
/100
|
#313
Tragic
16.1%
Alaskan Athabascans
0.0
/100
|
#314
Tragic
16.1%
Cheyenne
0.0
/100
|
#315
Tragic
16.1%
Dutch West Indians
0.0
/100
|
#316
Tragic
16.1%
Blacks/African Americans
0.0
/100
|
#317
Tragic
16.2%
Chickasaw
0.0
/100
|
#318
Tragic
16.3%
Chippewa
0.0
/100
|
#319
Tragic
16.4%
Marshallese
0.0
/100
|
#320
Tragic
16.4%
Osage
0.0
/100
|
#321
Tragic
16.5%
Shoshone
0.0
/100
|
#322
Tragic
16.7%
Creek
0.0
/100
|
#323
Tragic
16.8%
Immigrants | Yemen
0.0
/100
|
#324
Tragic
16.9%

Demographics Similar to Immigrants from Vietnam by Single Male Poverty

In terms of single male poverty, the demographic groups most similar to Immigrants from Vietnam are Immigrants from Ethiopia (11.4%, a difference of 0.040%), Immigrants from Eastern Asia (11.4%, a difference of 0.070%), Immigrants from South Eastern Asia (11.4%, a difference of 0.080%), Immigrants from Serbia (11.4%, a difference of 0.11%), and Immigrants from Iran (11.4%, a difference of 0.16%).
DemographicsRating | RankSingle Male Poverty
Immigrants | Japan
100.0
/100
|
#26
Exceptional
11.3%
Immigrants | China
100.0
/100
|
#27
Exceptional
11.4%
Immigrants | Asia
100.0
/100
|
#28
Exceptional
11.4%
Immigrants | Egypt
100.0
/100
|
#29
Exceptional
11.4%
Iranians
100.0
/100
|
#30
Exceptional
11.4%
Immigrants | Iran
100.0
/100
|
#31
Exceptional
11.4%
Immigrants | Eastern Asia
100.0
/100
|
#32
Exceptional
11.4%
Immigrants | Vietnam
100.0
/100
|
#33
Exceptional
11.4%
Immigrants | Ethiopia
100.0
/100
|
#34
Exceptional
11.4%
Immigrants | South Eastern Asia
100.0
/100
|
#35
Exceptional
11.4%
Immigrants | Serbia
100.0
/100
|
#36
Exceptional
11.4%
Immigrants | Singapore
100.0
/100
|
#37
Exceptional
11.4%
Sri Lankans
100.0
/100
|
#38
Exceptional
11.5%
Soviet Union
100.0
/100
|
#39
Exceptional
11.5%
Immigrants | Korea
100.0
/100
|
#40
Exceptional
11.5%