Black/African American vs Turkish Single Male Poverty
COMPARE
Black/African American
Turkish
Single Male Poverty
Single Male Poverty Comparison
Blacks/African Americans
Turks
16.2%
SINGLE MALE POVERTY
0.0/ 100
METRIC RATING
317th/ 347
METRIC RANK
12.1%
SINGLE MALE POVERTY
98.5/ 100
METRIC RATING
85th/ 347
METRIC RANK
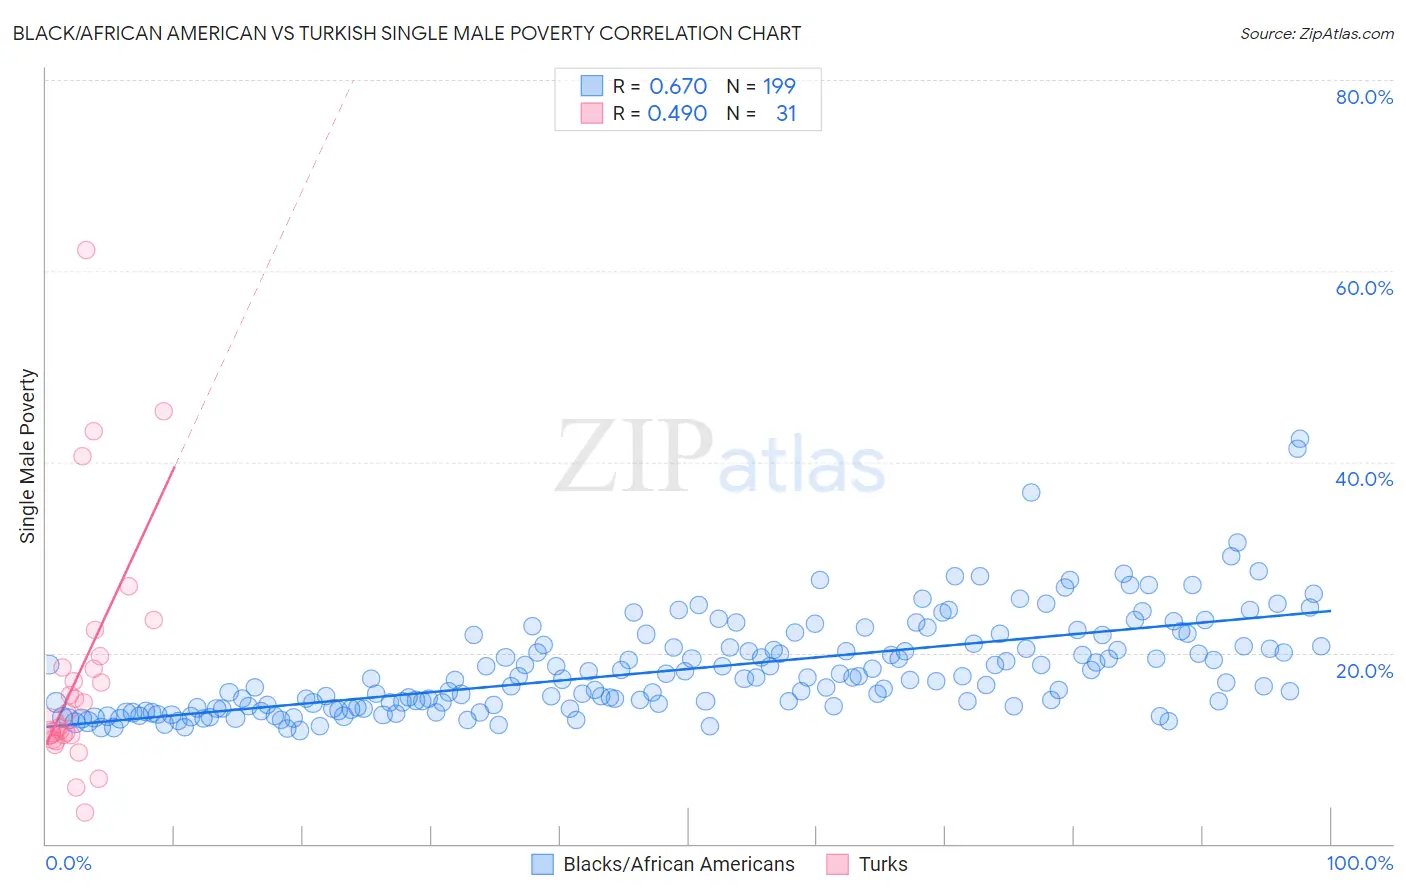
Black/African American vs Turkish Single Male Poverty Correlation Chart
The statistical analysis conducted on geographies consisting of 472,674,082 people shows a significant positive correlation between the proportion of Blacks/African Americans and poverty level among single males in the United States with a correlation coefficient (R) of 0.670 and weighted average of 16.2%. Similarly, the statistical analysis conducted on geographies consisting of 244,728,482 people shows a moderate positive correlation between the proportion of Turks and poverty level among single males in the United States with a correlation coefficient (R) of 0.490 and weighted average of 12.1%, a difference of 33.9%.
Single Male Poverty Correlation Summary
| Measurement | Black/African American | Turkish |
| Minimum | 11.9% | 3.3% |
| Maximum | 42.4% | 62.2% |
| Range | 30.6% | 58.9% |
| Mean | 18.3% | 18.2% |
| Median | 17.2% | 13.8% |
| Interquartile 25% (IQ1) | 14.2% | 11.4% |
| Interquartile 75% (IQ3) | 20.7% | 19.6% |
| Interquartile Range (IQR) | 6.5% | 8.2% |
| Standard Deviation (Sample) | 5.2% | 13.0% |
| Standard Deviation (Population) | 5.2% | 12.8% |
Similar Demographics by Single Male Poverty
Demographics Similar to Blacks/African Americans by Single Male Poverty
In terms of single male poverty, the demographic groups most similar to Blacks/African Americans are Dutch West Indian (16.1%, a difference of 0.34%), Cheyenne (16.1%, a difference of 0.48%), Alaskan Athabascan (16.1%, a difference of 0.53%), Chickasaw (16.3%, a difference of 0.80%), and Cherokee (16.1%, a difference of 0.82%).
| Demographics | Rating | Rank | Single Male Poverty |
| Yakama | 0.0 /100 | #310 | Tragic 15.9% |
| Seminole | 0.0 /100 | #311 | Tragic 16.0% |
| Comanche | 0.0 /100 | #312 | Tragic 16.0% |
| Cherokee | 0.0 /100 | #313 | Tragic 16.1% |
| Alaskan Athabascans | 0.0 /100 | #314 | Tragic 16.1% |
| Cheyenne | 0.0 /100 | #315 | Tragic 16.1% |
| Dutch West Indians | 0.0 /100 | #316 | Tragic 16.1% |
| Blacks/African Americans | 0.0 /100 | #317 | Tragic 16.2% |
| Chickasaw | 0.0 /100 | #318 | Tragic 16.3% |
| Chippewa | 0.0 /100 | #319 | Tragic 16.4% |
| Marshallese | 0.0 /100 | #320 | Tragic 16.4% |
| Osage | 0.0 /100 | #321 | Tragic 16.5% |
| Shoshone | 0.0 /100 | #322 | Tragic 16.7% |
| Creek | 0.0 /100 | #323 | Tragic 16.8% |
| Immigrants | Yemen | 0.0 /100 | #324 | Tragic 16.9% |
Demographics Similar to Turks by Single Male Poverty
In terms of single male poverty, the demographic groups most similar to Turks are Immigrants from Israel (12.1%, a difference of 0.020%), South American (12.1%, a difference of 0.030%), Immigrants from Eritrea (12.1%, a difference of 0.040%), Immigrants from Czechoslovakia (12.1%, a difference of 0.080%), and Immigrants from Colombia (12.1%, a difference of 0.10%).
| Demographics | Rating | Rank | Single Male Poverty |
| Immigrants | Venezuela | 99.1 /100 | #78 | Exceptional 12.0% |
| Immigrants | Belgium | 99.0 /100 | #79 | Exceptional 12.0% |
| Armenians | 98.7 /100 | #80 | Exceptional 12.1% |
| Immigrants | South America | 98.7 /100 | #81 | Exceptional 12.1% |
| Immigrants | Colombia | 98.6 /100 | #82 | Exceptional 12.1% |
| Immigrants | Chile | 98.6 /100 | #83 | Exceptional 12.1% |
| Immigrants | Czechoslovakia | 98.6 /100 | #84 | Exceptional 12.1% |
| Turks | 98.5 /100 | #85 | Exceptional 12.1% |
| Immigrants | Israel | 98.5 /100 | #86 | Exceptional 12.1% |
| South Americans | 98.5 /100 | #87 | Exceptional 12.1% |
| Immigrants | Eritrea | 98.5 /100 | #88 | Exceptional 12.1% |
| Immigrants | Ireland | 98.3 /100 | #89 | Exceptional 12.1% |
| South American Indians | 98.3 /100 | #90 | Exceptional 12.1% |
| Immigrants | Turkey | 98.2 /100 | #91 | Exceptional 12.1% |
| Spanish American Indians | 98.0 /100 | #92 | Exceptional 12.1% |