Assyrian/Chaldean/Syriac vs Immigrants from Ukraine Single Male Poverty
COMPARE
Assyrian/Chaldean/Syriac
Immigrants from Ukraine
Single Male Poverty
Single Male Poverty Comparison
Assyrians/Chaldeans/Syriacs
Immigrants from Ukraine
9.8%
SINGLE MALE POVERTY
100.0/ 100
METRIC RATING
1st/ 347
METRIC RANK
11.9%
SINGLE MALE POVERTY
99.6/ 100
METRIC RATING
67th/ 347
METRIC RANK
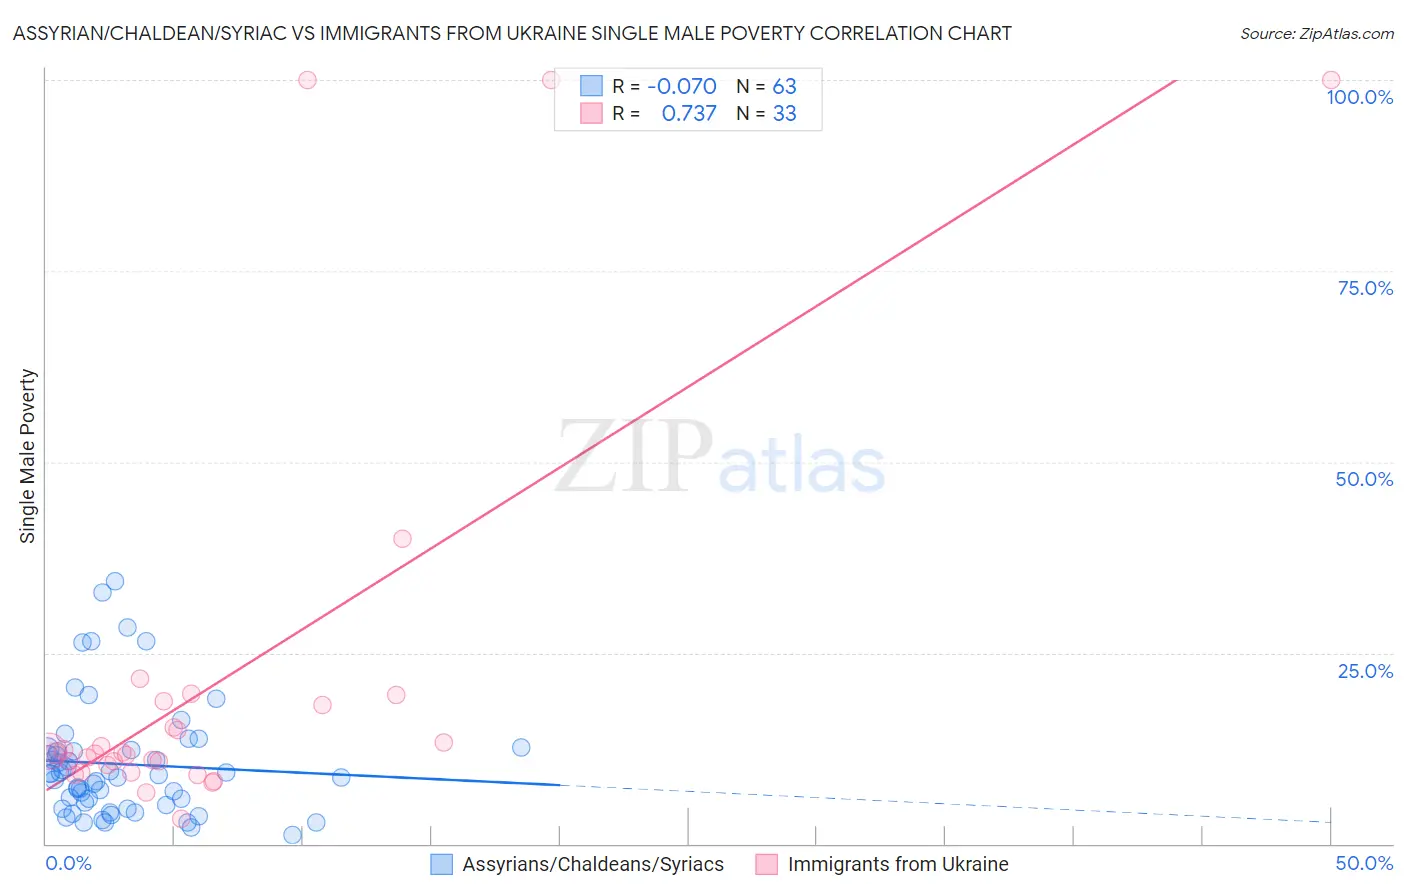
Assyrian/Chaldean/Syriac vs Immigrants from Ukraine Single Male Poverty Correlation Chart
The statistical analysis conducted on geographies consisting of 104,209,222 people shows a slight negative correlation between the proportion of Assyrians/Chaldeans/Syriacs and poverty level among single males in the United States with a correlation coefficient (R) of -0.070 and weighted average of 9.8%. Similarly, the statistical analysis conducted on geographies consisting of 259,108,555 people shows a strong positive correlation between the proportion of Immigrants from Ukraine and poverty level among single males in the United States with a correlation coefficient (R) of 0.737 and weighted average of 11.9%, a difference of 21.5%.
Single Male Poverty Correlation Summary
| Measurement | Assyrian/Chaldean/Syriac | Immigrants from Ukraine |
| Minimum | 1.2% | 3.2% |
| Maximum | 34.4% | 100.0% |
| Range | 33.2% | 96.8% |
| Mean | 10.4% | 21.0% |
| Median | 9.1% | 11.8% |
| Interquartile 25% (IQ1) | 5.0% | 9.9% |
| Interquartile 75% (IQ3) | 12.2% | 18.4% |
| Interquartile Range (IQR) | 7.2% | 8.6% |
| Standard Deviation (Sample) | 7.5% | 26.1% |
| Standard Deviation (Population) | 7.5% | 25.7% |
Similar Demographics by Single Male Poverty
Demographics Similar to Assyrians/Chaldeans/Syriacs by Single Male Poverty
In terms of single male poverty, the demographic groups most similar to Assyrians/Chaldeans/Syriacs are Immigrants from Taiwan (10.3%, a difference of 5.3%), Immigrants from India (10.3%, a difference of 6.0%), Immigrants from Hong Kong (10.4%, a difference of 7.0%), Tongan (10.5%, a difference of 7.1%), and Filipino (10.6%, a difference of 8.9%).
| Demographics | Rating | Rank | Single Male Poverty |
| Assyrians/Chaldeans/Syriacs | 100.0 /100 | #1 | Exceptional 9.8% |
| Immigrants | Taiwan | 100.0 /100 | #2 | Exceptional 10.3% |
| Immigrants | India | 100.0 /100 | #3 | Exceptional 10.3% |
| Immigrants | Hong Kong | 100.0 /100 | #4 | Exceptional 10.4% |
| Tongans | 100.0 /100 | #5 | Exceptional 10.5% |
| Filipinos | 100.0 /100 | #6 | Exceptional 10.6% |
| Afghans | 100.0 /100 | #7 | Exceptional 10.7% |
| Thais | 100.0 /100 | #8 | Exceptional 10.8% |
| Taiwanese | 100.0 /100 | #9 | Exceptional 10.9% |
| Immigrants | Fiji | 100.0 /100 | #10 | Exceptional 10.9% |
| Immigrants | Philippines | 100.0 /100 | #11 | Exceptional 10.9% |
| Immigrants | Afghanistan | 100.0 /100 | #12 | Exceptional 10.9% |
| Immigrants | South Central Asia | 100.0 /100 | #13 | Exceptional 10.9% |
| Chinese | 100.0 /100 | #14 | Exceptional 11.0% |
| Koreans | 100.0 /100 | #15 | Exceptional 11.0% |
Demographics Similar to Immigrants from Ukraine by Single Male Poverty
In terms of single male poverty, the demographic groups most similar to Immigrants from Ukraine are Immigrants from Croatia (11.9%, a difference of 0.010%), Laotian (11.9%, a difference of 0.020%), Immigrants from Uruguay (11.9%, a difference of 0.020%), Immigrants from Russia (11.9%, a difference of 0.040%), and Immigrants from Nepal (11.9%, a difference of 0.060%).
| Demographics | Rating | Rank | Single Male Poverty |
| Peruvians | 99.8 /100 | #60 | Exceptional 11.8% |
| Cambodians | 99.8 /100 | #61 | Exceptional 11.8% |
| Immigrants | Sri Lanka | 99.7 /100 | #62 | Exceptional 11.8% |
| Immigrants | Belarus | 99.7 /100 | #63 | Exceptional 11.8% |
| Immigrants | Eastern Europe | 99.6 /100 | #64 | Exceptional 11.8% |
| Laotians | 99.6 /100 | #65 | Exceptional 11.9% |
| Immigrants | Uruguay | 99.6 /100 | #66 | Exceptional 11.9% |
| Immigrants | Ukraine | 99.6 /100 | #67 | Exceptional 11.9% |
| Immigrants | Croatia | 99.6 /100 | #68 | Exceptional 11.9% |
| Immigrants | Russia | 99.6 /100 | #69 | Exceptional 11.9% |
| Immigrants | Nepal | 99.6 /100 | #70 | Exceptional 11.9% |
| Immigrants | Greece | 99.6 /100 | #71 | Exceptional 11.9% |
| Immigrants | Argentina | 99.5 /100 | #72 | Exceptional 11.9% |
| Argentineans | 99.5 /100 | #73 | Exceptional 11.9% |
| Chileans | 99.5 /100 | #74 | Exceptional 11.9% |