Zip Codes with the Highest Percentage of Population Employed in Office & Administration in Las Cruces, NM
RELATED REPORTS & OPTIONS
Office & Administration
Las Cruces
Compare Zip Codes
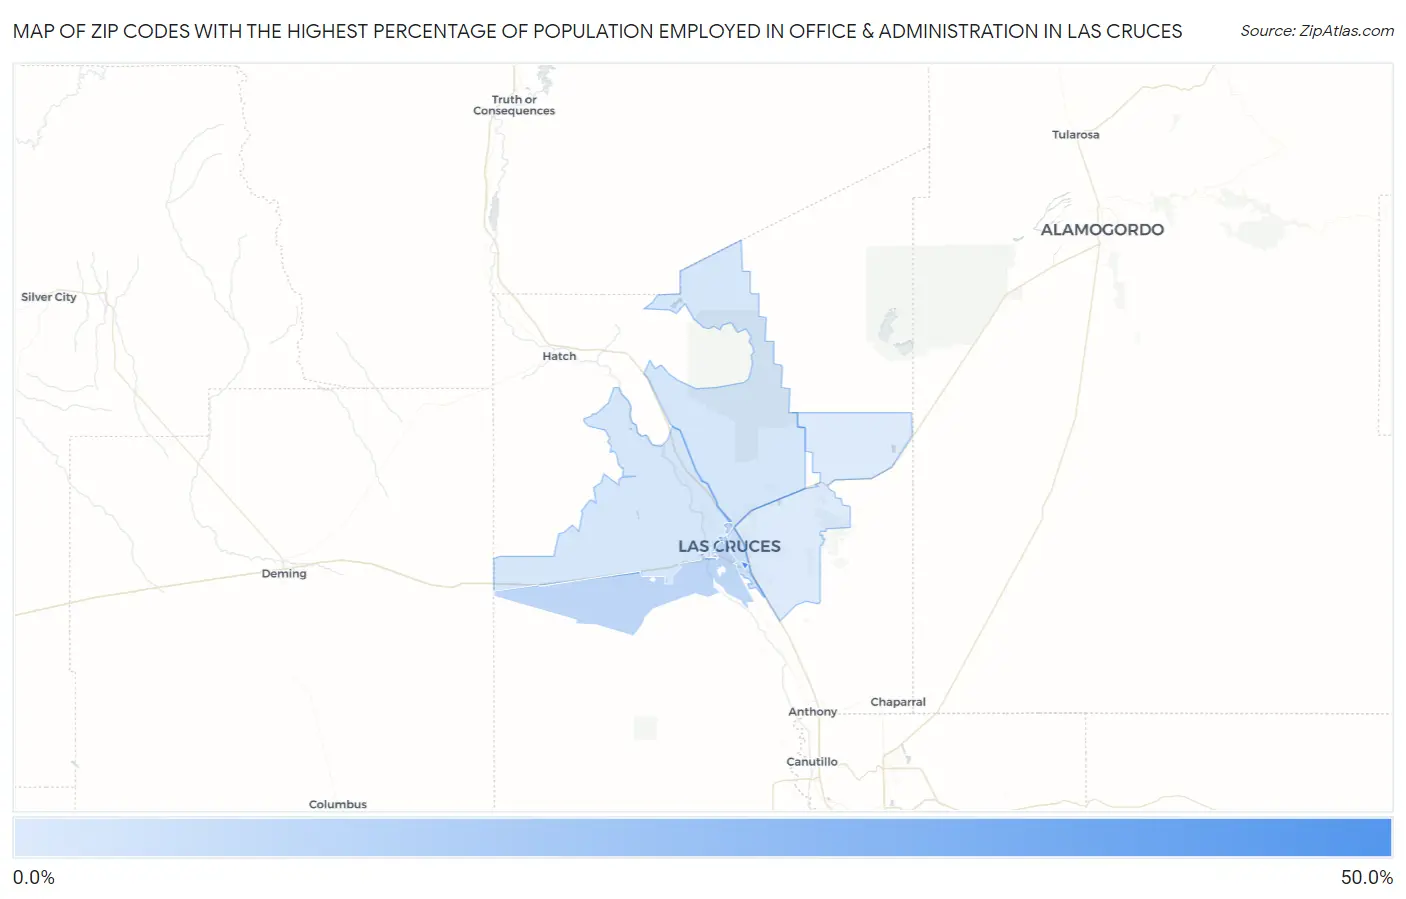
Map of Zip Codes with the Highest Percentage of Population Employed in Office & Administration in Las Cruces
9.1%
44.8%
Zip Codes with the Highest Percentage of Population Employed in Office & Administration in Las Cruces, NM
| Zip Code | % Employed | vs State | vs National | |
| 1. | 88003 | 44.8% | 11.2%(+33.6)#10 | 10.9%(+33.9)#192 |
| 2. | 88005 | 16.0% | 11.2%(+4.82)#57 | 10.9%(+5.13)#3,568 |
| 3. | 88001 | 11.9% | 11.2%(+0.743)#103 | 10.9%(+1.05)#11,039 |
| 4. | 88012 | 10.5% | 11.2%(-0.662)#123 | 10.9%(-0.354)#15,474 |
| 5. | 88007 | 10.3% | 11.2%(-0.856)#128 | 10.9%(-0.548)#16,131 |
| 6. | 88011 | 9.1% | 11.2%(-2.05)#150 | 10.9%(-1.75)#19,915 |
1
Common Questions
What are the Top 5 Zip Codes with the Highest Percentage of Population Employed in Office & Administration in Las Cruces, NM?
Top 5 Zip Codes with the Highest Percentage of Population Employed in Office & Administration in Las Cruces, NM are:
What zip code has the Highest Percentage of Population Employed in Office & Administration in Las Cruces, NM?
88003 has the Highest Percentage of Population Employed in Office & Administration in Las Cruces, NM with 44.8%.
What is the Percentage of Population Employed in Office & Administration in Las Cruces, NM?
Percentage of Population Employed in Office & Administration in Las Cruces is 11.4%.
What is the Percentage of Population Employed in Office & Administration in New Mexico?
Percentage of Population Employed in Office & Administration in New Mexico is 11.2%.
What is the Percentage of Population Employed in Office & Administration in the United States?
Percentage of Population Employed in Office & Administration in the United States is 10.9%.