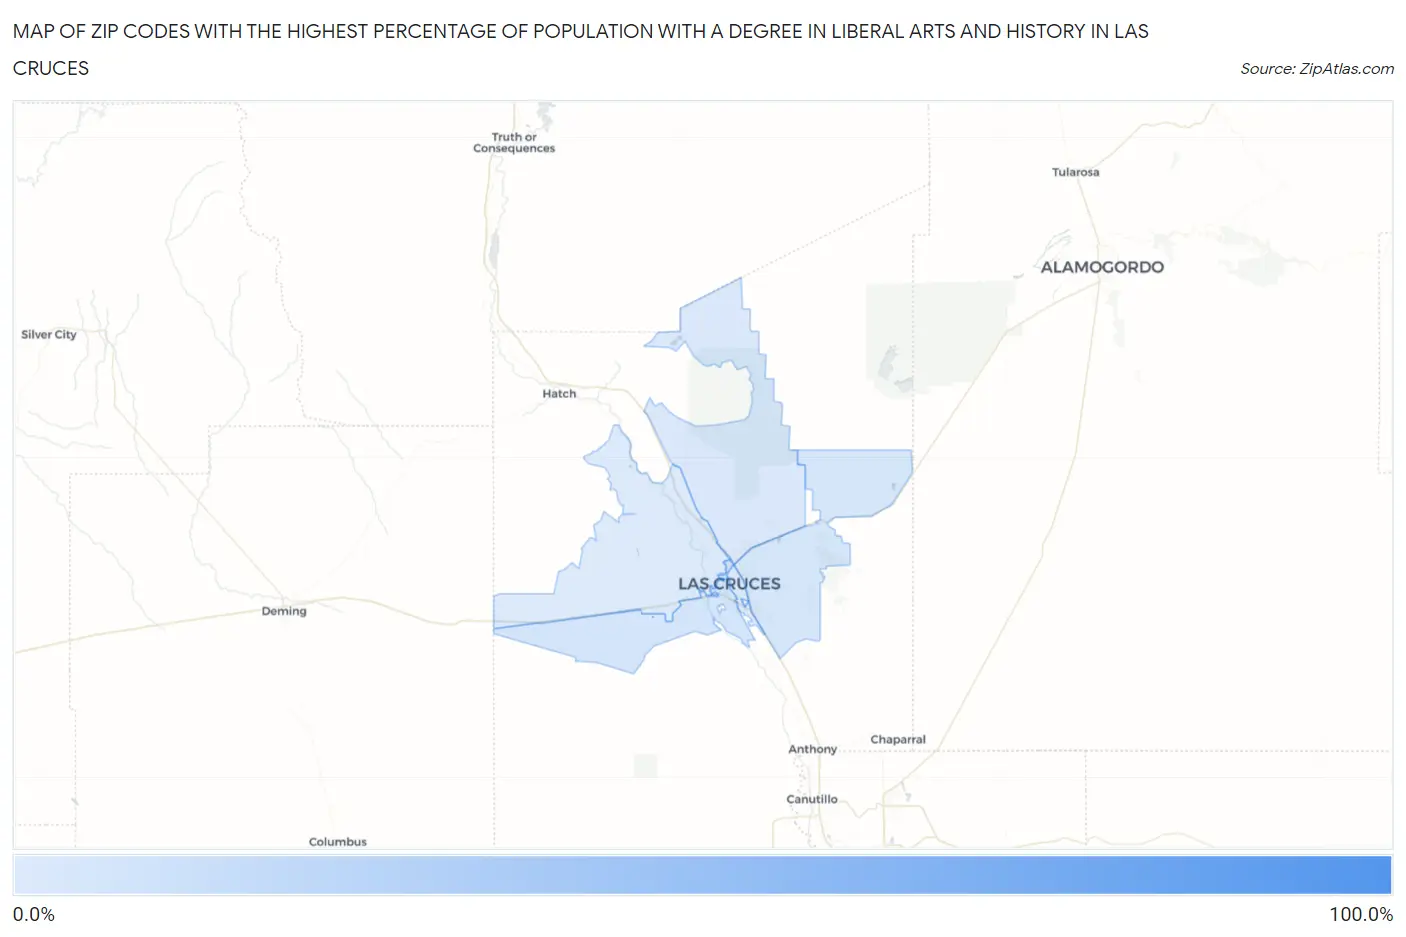
Zip Codes with the Highest Percentage of Population with a Degree in Liberal Arts and History in Las Cruces, NM
RELATED REPORTS & OPTIONS
Liberal Arts and History
Las Cruces
Compare Zip Codes
Map of Zip Codes with the Highest Percentage of Population with a Degree in Liberal Arts and History in Las Cruces
4.2%
100.0%
Zip Codes with the Highest Percentage of Population with a Degree in Liberal Arts and History in Las Cruces, NM
| Zip Code | % Graduates | vs State | vs National | |
| 1. | 88004 | 100.0% | 5.5%(+94.5)#1 | 4.9%(+95.1)#8 |
| 2. | 88005 | 8.8% | 5.5%(+3.35)#41 | 4.9%(+3.93)#4,027 |
| 3. | 88011 | 7.0% | 5.5%(+1.53)#57 | 4.9%(+2.11)#6,418 |
| 4. | 88012 | 5.2% | 5.5%(-0.282)#87 | 4.9%(+0.302)#10,799 |
| 5. | 88001 | 4.7% | 5.5%(-0.764)#103 | 4.9%(-0.180)#12,343 |
| 6. | 88007 | 4.2% | 5.5%(-1.22)#113 | 4.9%(-0.637)#13,871 |
1
Common Questions
What are the Top 5 Zip Codes with the Highest Percentage of Population with a Degree in Liberal Arts and History in Las Cruces, NM?
Top 5 Zip Codes with the Highest Percentage of Population with a Degree in Liberal Arts and History in Las Cruces, NM are:
What zip code has the Highest Percentage of Population with a Degree in Liberal Arts and History in Las Cruces, NM?
88004 has the Highest Percentage of Population with a Degree in Liberal Arts and History in Las Cruces, NM with 100.0%.
What is the Percentage of Population with a Degree in Liberal Arts and History in Las Cruces, NM?
Percentage of Population with a Degree in Liberal Arts and History in Las Cruces is 6.3%.
What is the Percentage of Population with a Degree in Liberal Arts and History in New Mexico?
Percentage of Population with a Degree in Liberal Arts and History in New Mexico is 5.5%.
What is the Percentage of Population with a Degree in Liberal Arts and History in the United States?
Percentage of Population with a Degree in Liberal Arts and History in the United States is 4.9%.