Zip Codes with the Highest Percentage of Population Employed in Administrative & Support Services in Papillion, NE
RELATED REPORTS & OPTIONS
Administrative & Support Services
Papillion
Compare Zip Codes
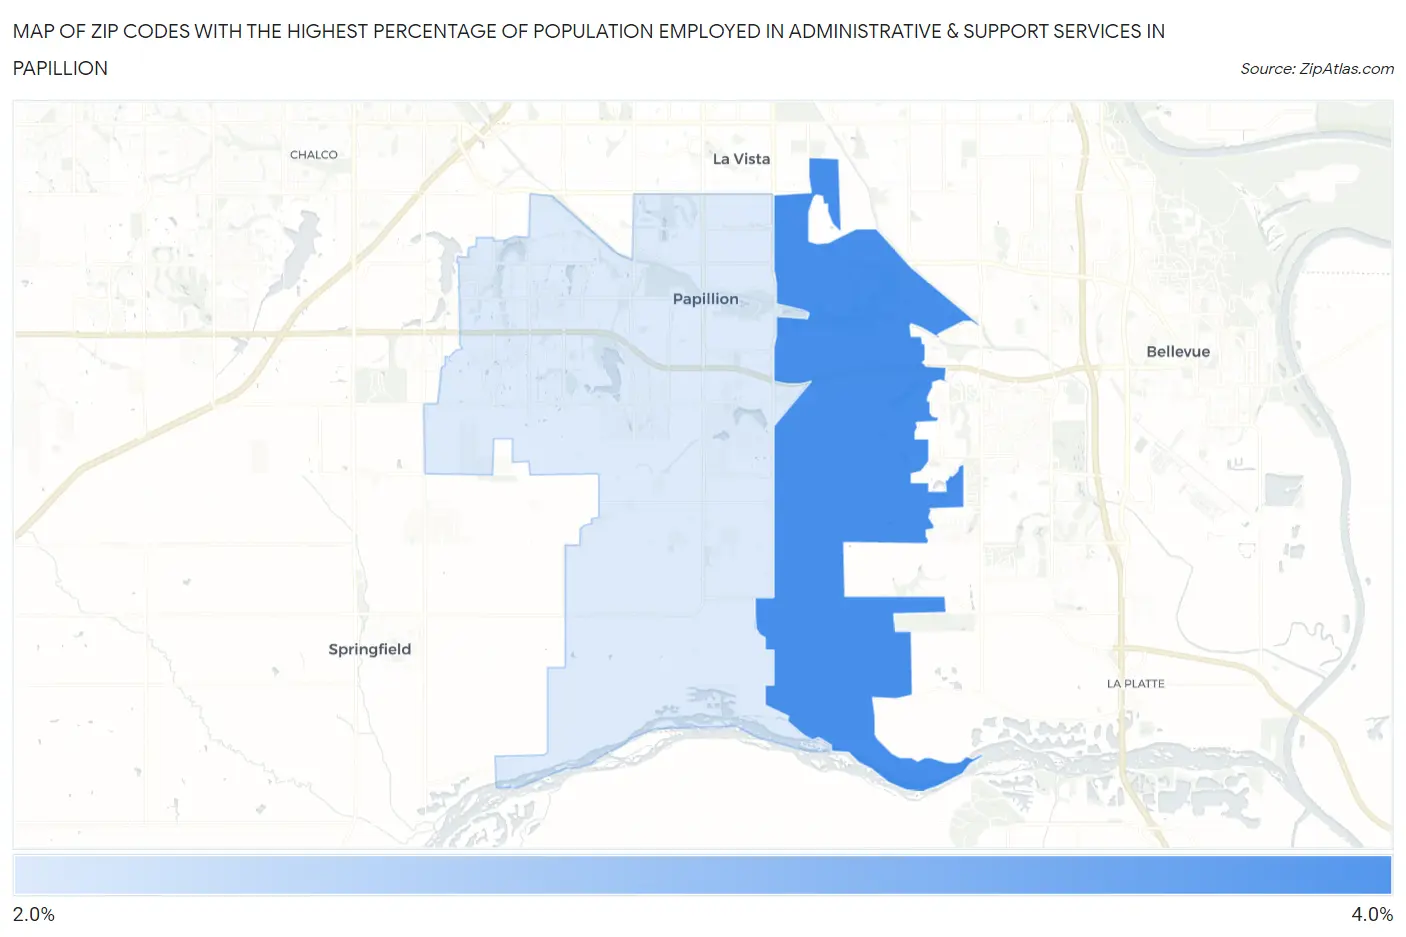
Map of Zip Codes with the Highest Percentage of Population Employed in Administrative & Support Services in Papillion
2.7%
3.0%
Zip Codes with the Highest Percentage of Population Employed in Administrative & Support Services in Papillion, NE
| Zip Code | % Employed | vs State | vs National | |
| 1. | 68133 | 3.0% | 3.4%(-0.354)#157 | 4.1%(-1.15)#15,479 |
| 2. | 68046 | 2.7% | 3.4%(-0.647)#176 | 4.1%(-1.44)#17,044 |
1
Common Questions
What are the Top Zip Codes with the Highest Percentage of Population Employed in Administrative & Support Services in Papillion, NE?
Top Zip Codes with the Highest Percentage of Population Employed in Administrative & Support Services in Papillion, NE are:
What zip code has the Highest Percentage of Population Employed in Administrative & Support Services in Papillion, NE?
68133 has the Highest Percentage of Population Employed in Administrative & Support Services in Papillion, NE with 3.0%.
What is the Percentage of Population Employed in Administrative & Support Services in Papillion, NE?
Percentage of Population Employed in Administrative & Support Services in Papillion is 3.2%.
What is the Percentage of Population Employed in Administrative & Support Services in Nebraska?
Percentage of Population Employed in Administrative & Support Services in Nebraska is 3.4%.
What is the Percentage of Population Employed in Administrative & Support Services in the United States?
Percentage of Population Employed in Administrative & Support Services in the United States is 4.1%.