Zip Codes with the Highest Percentage of Not-for-profit Organizations in Papillion, NE
RELATED REPORTS & OPTIONS
Not-for-profit Organizations
Papillion
Compare Zip Codes
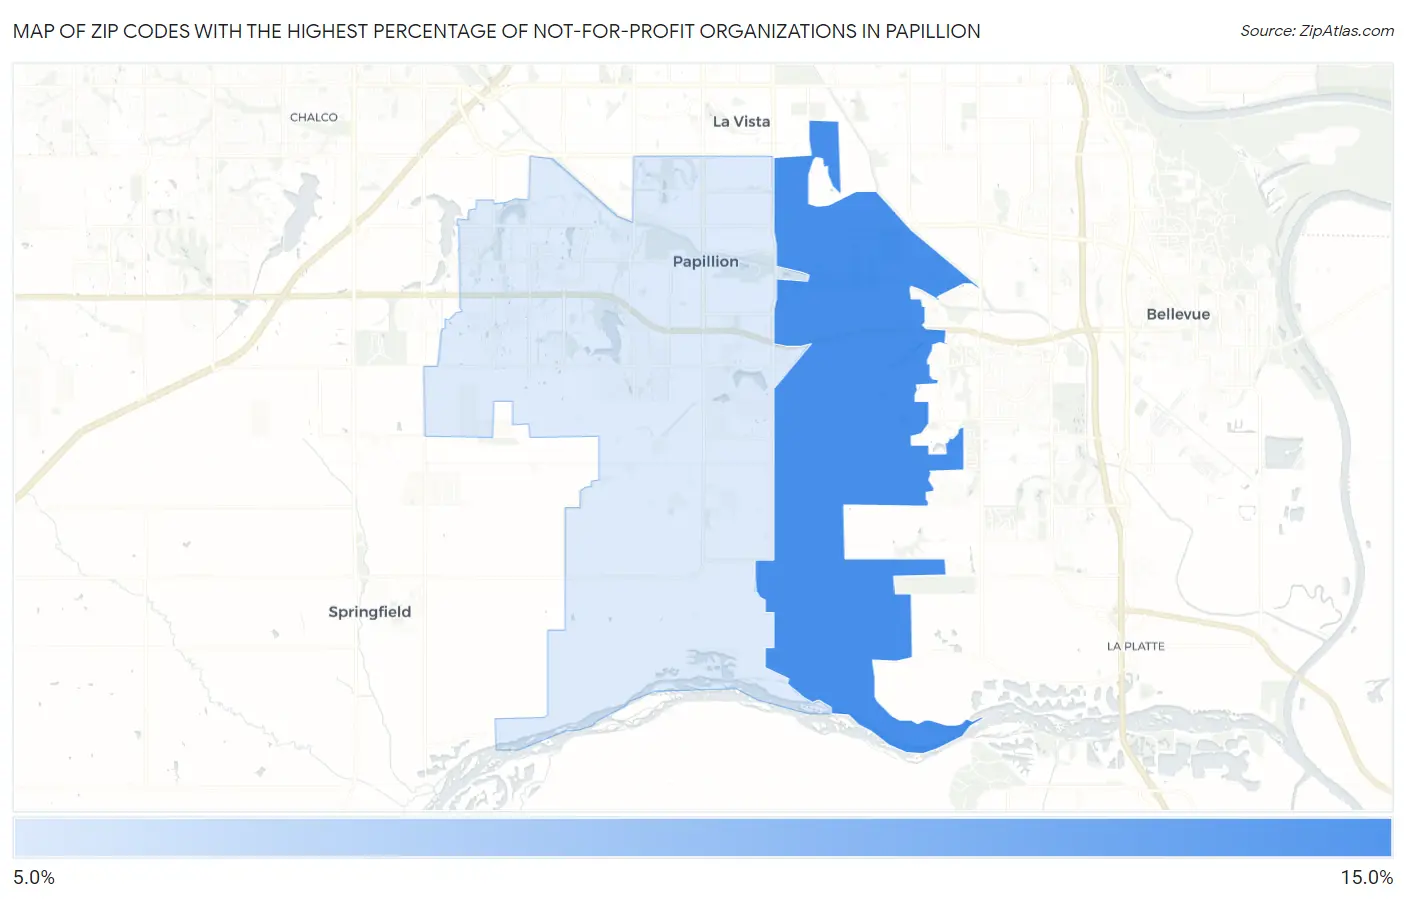
Map of Zip Codes with the Highest Percentage of Not-for-profit Organizations in Papillion
9.3%
13.8%
Zip Codes with the Highest Percentage of Not-for-profit Organizations in Papillion, NE
| Zip Code | % Employed in Not-for-profit | vs State | vs National | |
| 1. | 68133 | 13.8% | 9.5%(+4.26)#60 | 8.4%(+5.34)#3,770 |
| 2. | 68046 | 9.3% | 9.5%(-0.260)#202 | 8.4%(+0.821)#10,433 |
1
Common Questions
What are the Top Zip Codes with the Highest Percentage of Not-for-profit Organizations in Papillion, NE?
Top Zip Codes with the Highest Percentage of Not-for-profit Organizations in Papillion, NE are:
What zip code has the Highest Percentage of Not-for-profit Organizations in Papillion, NE?
68133 has the Highest Percentage of Not-for-profit Organizations in Papillion, NE with 13.8%.
What is the Percentage of Not-for-profit Organizations in Papillion, NE?
Percentage of Not-for-profit Organizations in Papillion is 12.1%.
What is the Percentage of Not-for-profit Organizations in Nebraska?
Percentage of Not-for-profit Organizations in Nebraska is 9.5%.
What is the Percentage of Not-for-profit Organizations in the United States?
Percentage of Not-for-profit Organizations in the United States is 8.4%.