Zip Codes with the Highest Percentage of Population with a Degree in Liberal Arts and History in Papillion, NE
RELATED REPORTS & OPTIONS
Liberal Arts and History
Papillion
Compare Zip Codes
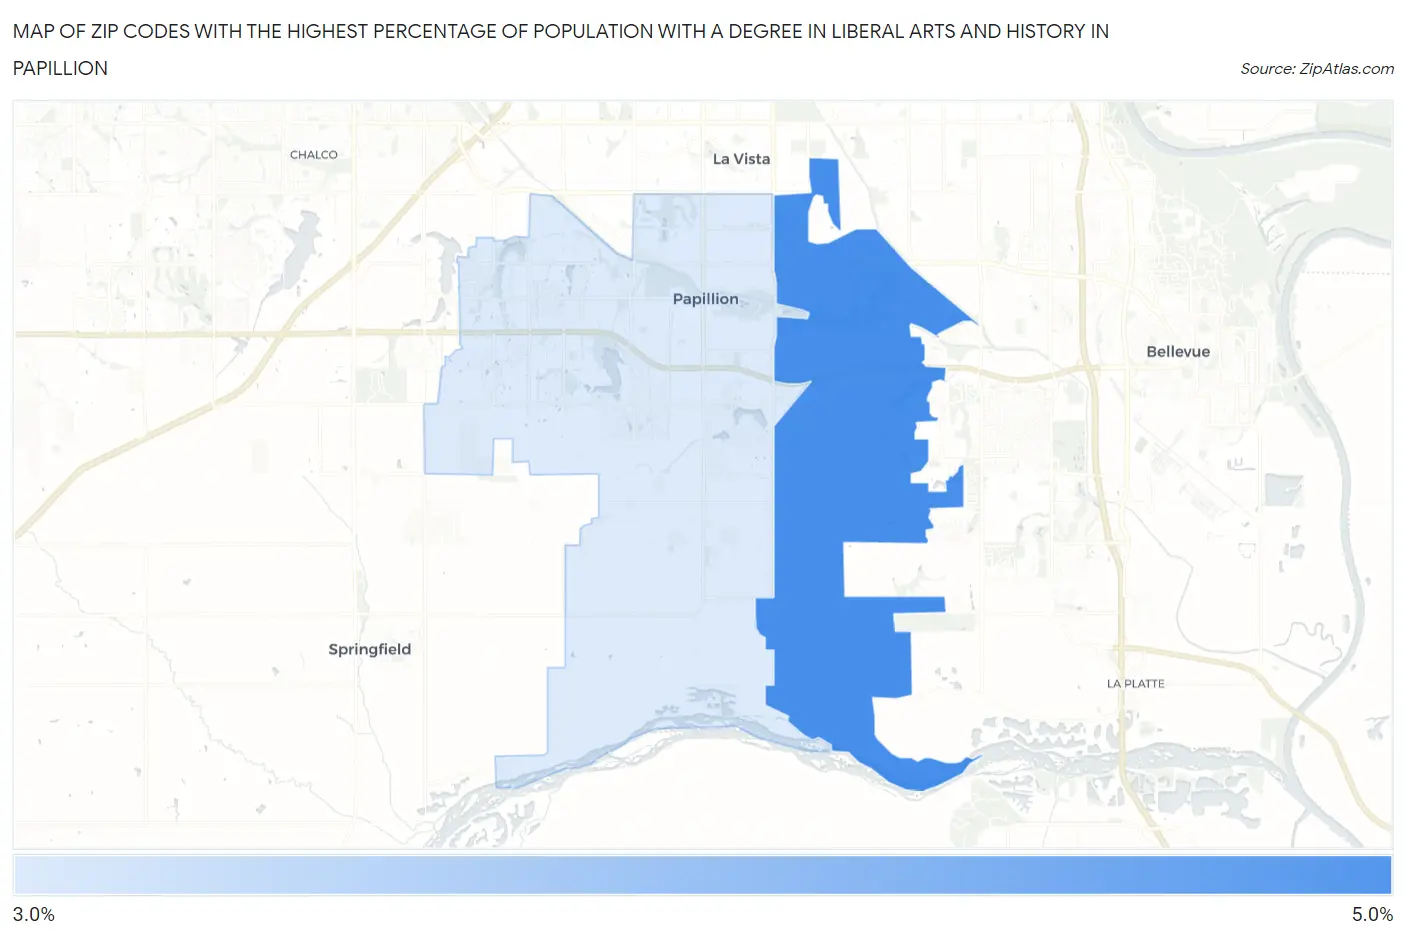
Map of Zip Codes with the Highest Percentage of Population with a Degree in Liberal Arts and History in Papillion
3.6%
4.2%
Zip Codes with the Highest Percentage of Population with a Degree in Liberal Arts and History in Papillion, NE
| Zip Code | % Graduates | vs State | vs National | |
| 1. | 68133 | 4.2% | 4.0%(+0.213)#157 | 4.9%(-0.686)#14,068 |
| 2. | 68046 | 3.6% | 4.0%(-0.416)#196 | 4.9%(-1.32)#16,387 |
1
Common Questions
What are the Top Zip Codes with the Highest Percentage of Population with a Degree in Liberal Arts and History in Papillion, NE?
Top Zip Codes with the Highest Percentage of Population with a Degree in Liberal Arts and History in Papillion, NE are:
What zip code has the Highest Percentage of Population with a Degree in Liberal Arts and History in Papillion, NE?
68133 has the Highest Percentage of Population with a Degree in Liberal Arts and History in Papillion, NE with 4.2%.
What is the Percentage of Population with a Degree in Liberal Arts and History in Papillion, NE?
Percentage of Population with a Degree in Liberal Arts and History in Papillion is 4.0%.
What is the Percentage of Population with a Degree in Liberal Arts and History in Nebraska?
Percentage of Population with a Degree in Liberal Arts and History in Nebraska is 4.0%.
What is the Percentage of Population with a Degree in Liberal Arts and History in the United States?
Percentage of Population with a Degree in Liberal Arts and History in the United States is 4.9%.