Zip Codes with the Highest Percentage of Population Employed in Office & Administration in Papillion, NE
RELATED REPORTS & OPTIONS
Office & Administration
Papillion
Compare Zip Codes
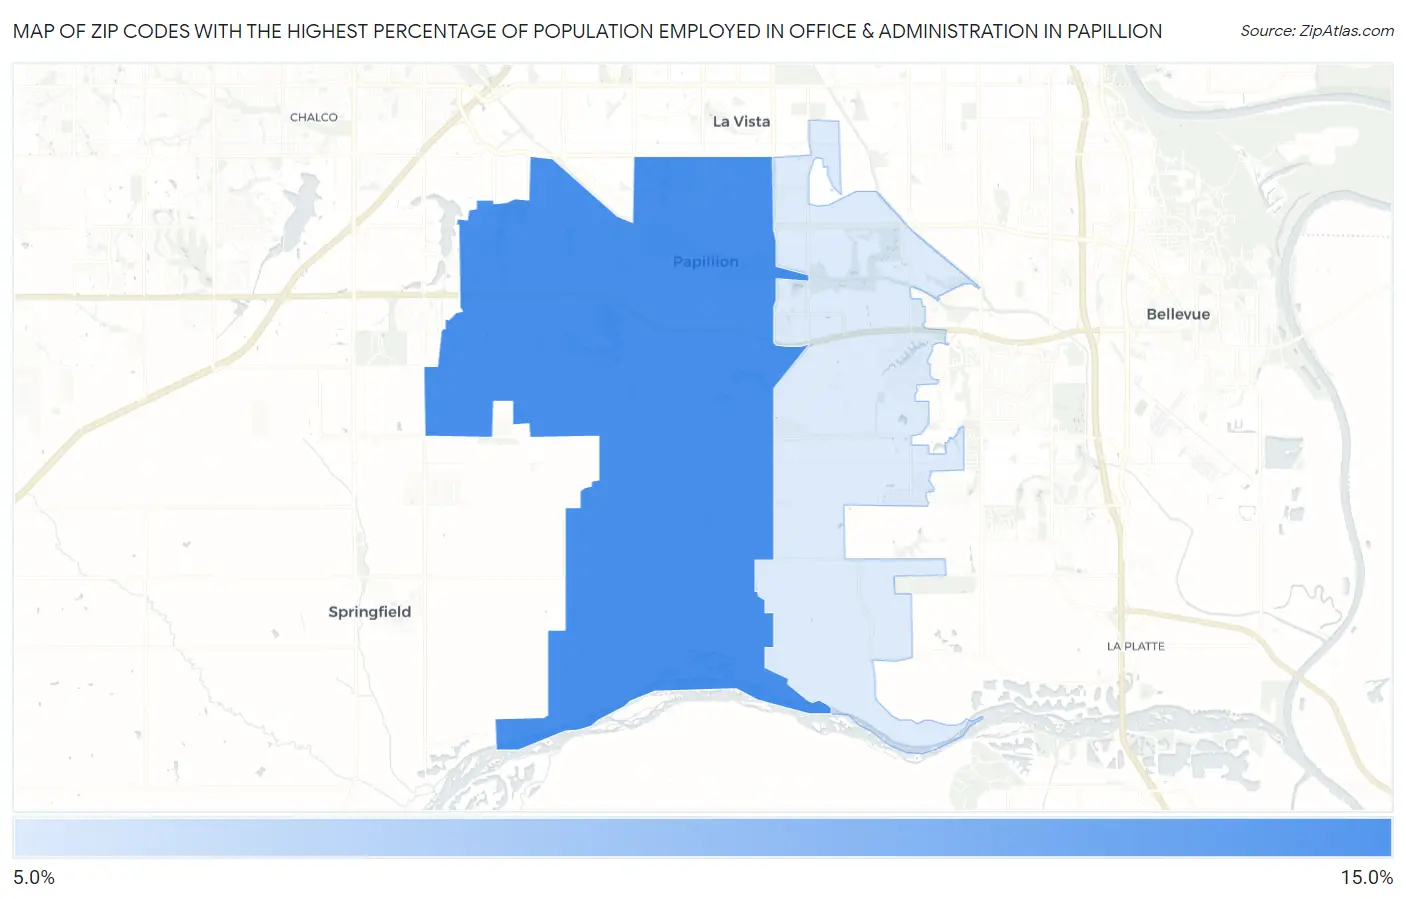
Map of Zip Codes with the Highest Percentage of Population Employed in Office & Administration in Papillion
8.9%
12.0%
Zip Codes with the Highest Percentage of Population Employed in Office & Administration in Papillion, NE
| Zip Code | % Employed | vs State | vs National | |
| 1. | 68046 | 12.0% | 11.3%(+0.716)#196 | 10.9%(+1.16)#10,677 |
| 2. | 68133 | 8.9% | 11.3%(-2.36)#362 | 10.9%(-1.91)#20,418 |
1
Common Questions
What are the Top Zip Codes with the Highest Percentage of Population Employed in Office & Administration in Papillion, NE?
Top Zip Codes with the Highest Percentage of Population Employed in Office & Administration in Papillion, NE are:
What zip code has the Highest Percentage of Population Employed in Office & Administration in Papillion, NE?
68046 has the Highest Percentage of Population Employed in Office & Administration in Papillion, NE with 12.0%.
What is the Percentage of Population Employed in Office & Administration in Papillion, NE?
Percentage of Population Employed in Office & Administration in Papillion is 11.3%.
What is the Percentage of Population Employed in Office & Administration in Nebraska?
Percentage of Population Employed in Office & Administration in Nebraska is 11.3%.
What is the Percentage of Population Employed in Office & Administration in the United States?
Percentage of Population Employed in Office & Administration in the United States is 10.9%.