Zip Codes with the Highest Percentage of Households Heated by Bottled Gas / Liquid Propane in Papillion, NE
RELATED REPORTS & OPTIONS
Bottled Gas / LP Heating
Papillion
Compare Zip Codes
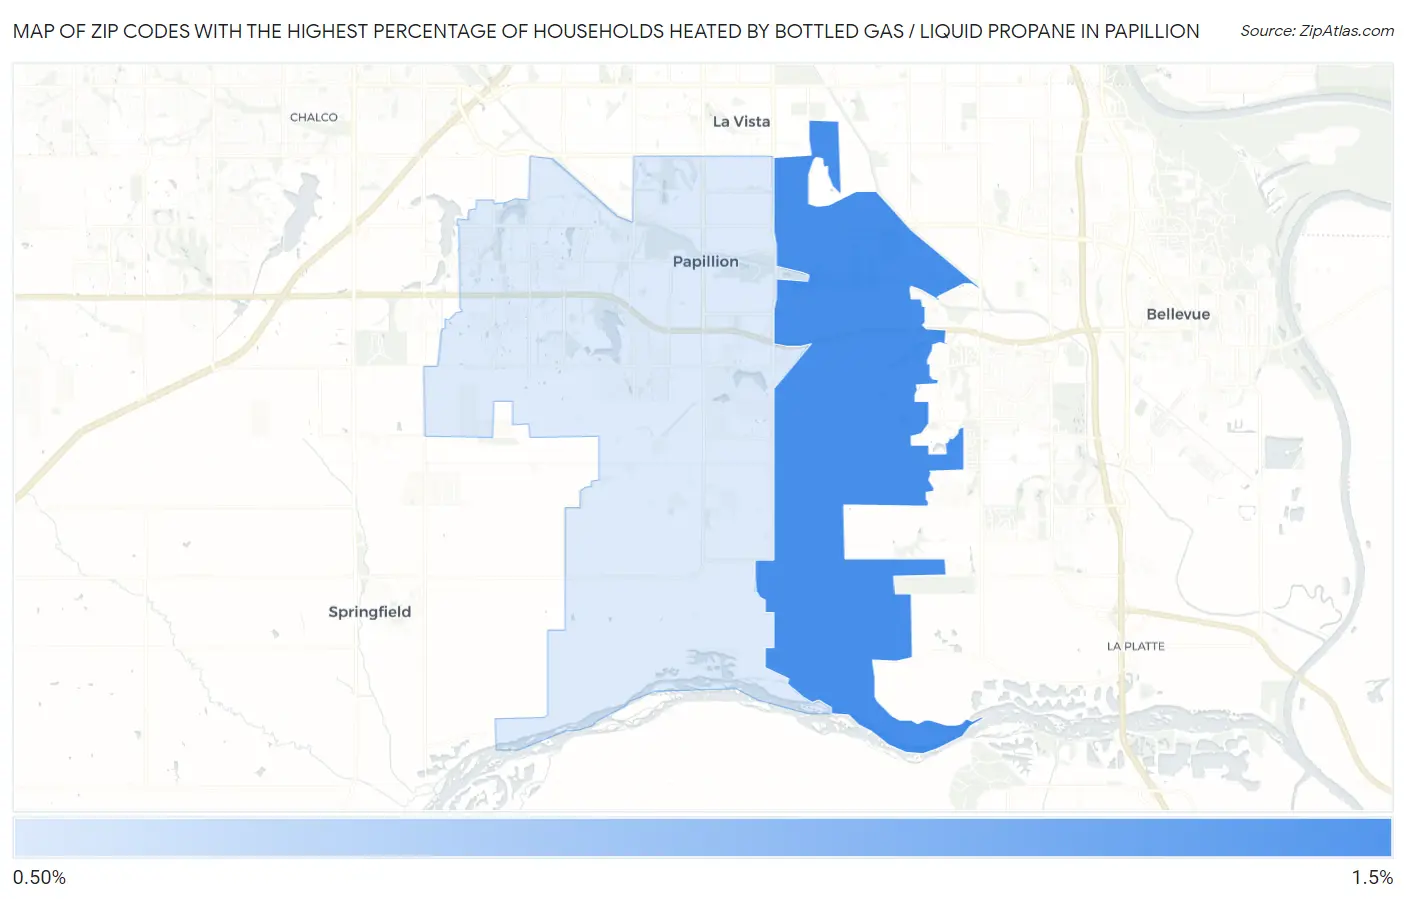
Map of Zip Codes with the Highest Percentage of Households Heated by Bottled Gas / Liquid Propane in Papillion
1.3%
1.5%
Zip Codes with the Highest Percentage of Households Heated by Bottled Gas / Liquid Propane in Papillion, NE
| Zip Code | Bottled Gas / LP Heating | vs State | vs National | |
| 1. | 68133 | 1.5% | 7.1%(-5.60)#539 | 4.9%(-3.40)#24,843 |
| 2. | 68046 | 1.3% | 7.1%(-5.80)#543 | 4.9%(-3.60)#25,439 |
1
Common Questions
What are the Top Zip Codes with the Highest Percentage of Households Heated by Bottled Gas / Liquid Propane in Papillion, NE?
Top Zip Codes with the Highest Percentage of Households Heated by Bottled Gas / Liquid Propane in Papillion, NE are:
What zip code has the Highest Percentage of Households Heated by Bottled Gas / Liquid Propane in Papillion, NE?
68133 has the Highest Percentage of Households Heated by Bottled Gas / Liquid Propane in Papillion, NE with 1.5%.
What is the Percentage of Households Heated by Bottled Gas / Liquid Propane in Papillion, NE?
Percentage of Households Heated by Bottled Gas / Liquid Propane in Papillion is 0.80%.
What is the Percentage of Households Heated by Bottled Gas / Liquid Propane in Nebraska?
Percentage of Households Heated by Bottled Gas / Liquid Propane in Nebraska is 7.1%.
What is the Percentage of Households Heated by Bottled Gas / Liquid Propane in the United States?
Percentage of Households Heated by Bottled Gas / Liquid Propane in the United States is 4.9%.