Zip Codes with the Highest Percentage of Population Employed in Legal Services & Support in Missoula, MT
RELATED REPORTS & OPTIONS
Legal Services & Support
Missoula
Compare Zip Codes
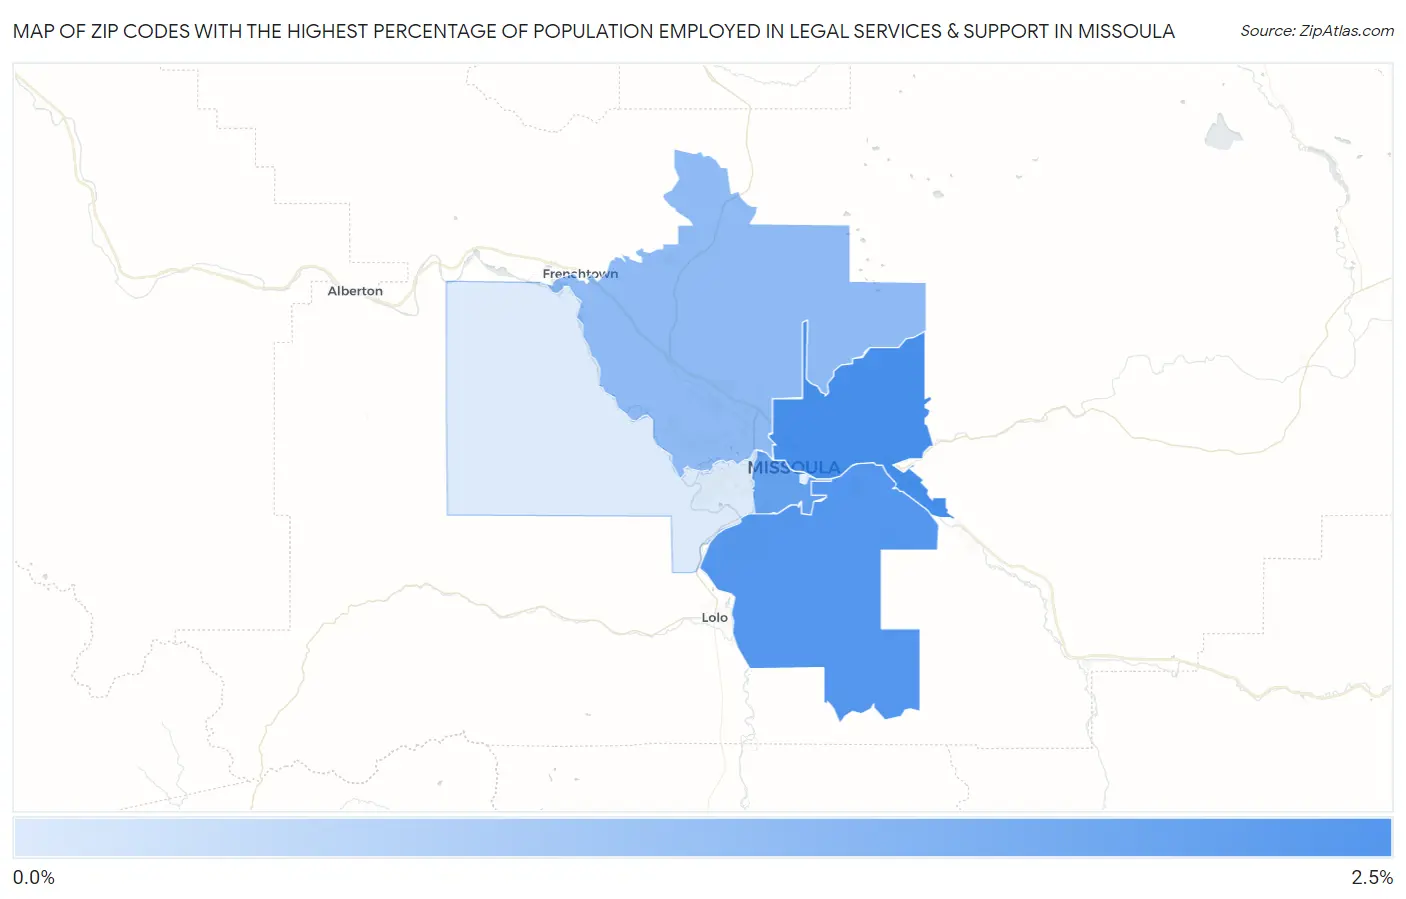
Map of Zip Codes with the Highest Percentage of Population Employed in Legal Services & Support in Missoula
0.36%
2.5%
Zip Codes with the Highest Percentage of Population Employed in Legal Services & Support in Missoula, MT
| Zip Code | % Employed | vs State | vs National | |
| 1. | 59802 | 2.5% | 0.99%(+1.46)#15 | 1.2%(+1.27)#2,589 |
| 2. | 59803 | 2.3% | 0.99%(+1.27)#19 | 1.2%(+1.08)#2,915 |
| 3. | 59801 | 2.0% | 0.99%(+1.05)#21 | 1.2%(+0.864)#3,341 |
| 4. | 59808 | 1.4% | 0.99%(+0.444)#37 | 1.2%(+0.255)#5,298 |
| 5. | 59804 | 0.36% | 0.99%(-0.629)#103 | 1.2%(-0.819)#14,266 |
1
Common Questions
What are the Top 5 Zip Codes with the Highest Percentage of Population Employed in Legal Services & Support in Missoula, MT?
Top 5 Zip Codes with the Highest Percentage of Population Employed in Legal Services & Support in Missoula, MT are:
What zip code has the Highest Percentage of Population Employed in Legal Services & Support in Missoula, MT?
59802 has the Highest Percentage of Population Employed in Legal Services & Support in Missoula, MT with 2.5%.
What is the Percentage of Population Employed in Legal Services & Support in Missoula, MT?
Percentage of Population Employed in Legal Services & Support in Missoula is 2.2%.
What is the Percentage of Population Employed in Legal Services & Support in Montana?
Percentage of Population Employed in Legal Services & Support in Montana is 0.99%.
What is the Percentage of Population Employed in Legal Services & Support in the United States?
Percentage of Population Employed in Legal Services & Support in the United States is 1.2%.