Zip Codes with the Highest Percentage of Population Employed in Arts, Entertainment & Recreation in Missoula, MT
RELATED REPORTS & OPTIONS
Arts, Entertainment & Recreation
Missoula
Compare Zip Codes
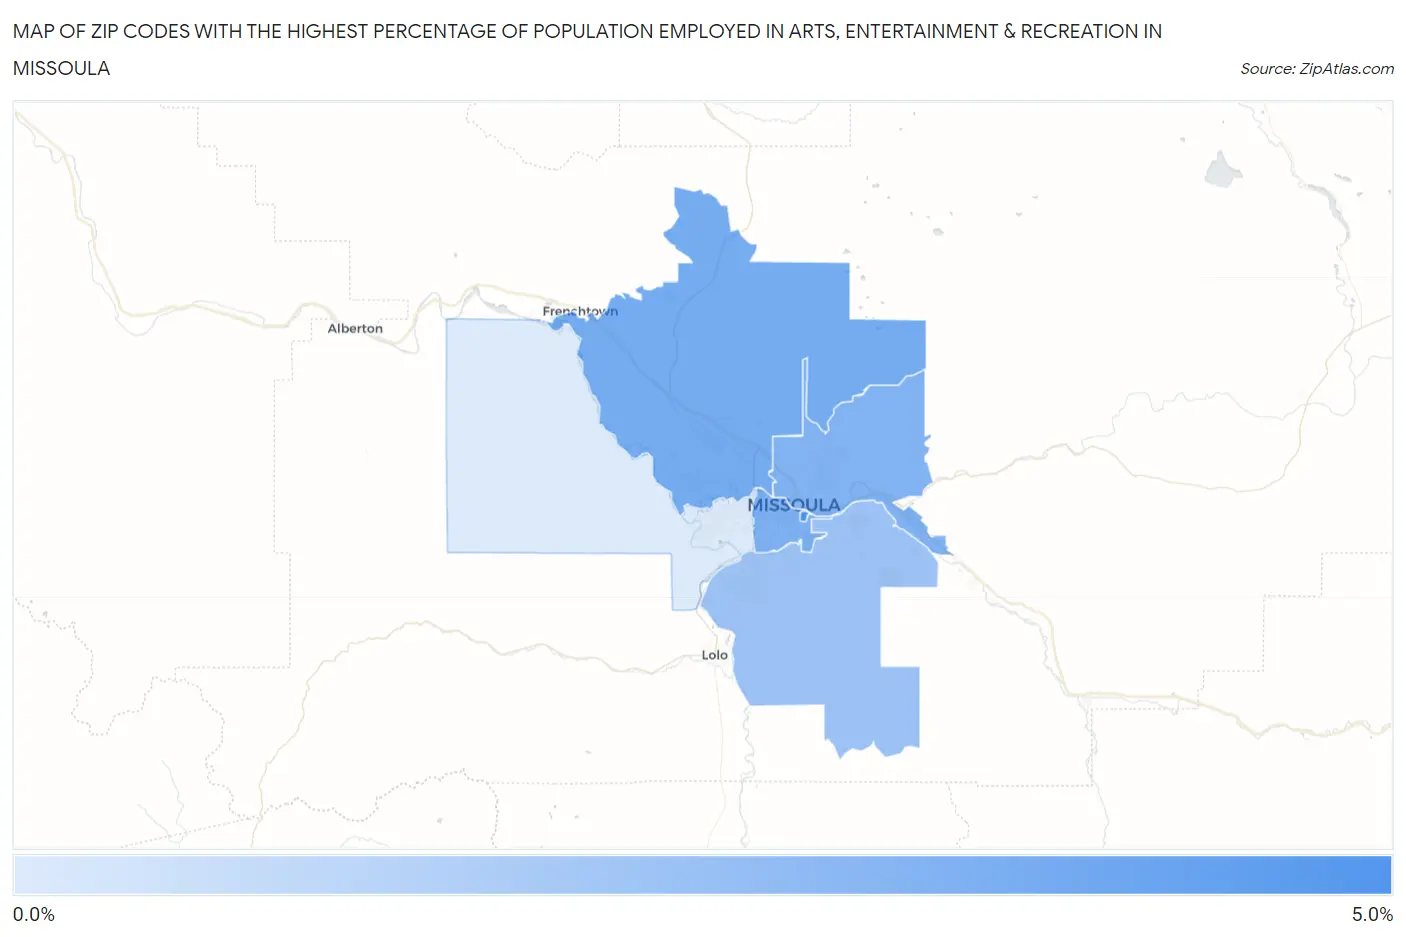
Map of Zip Codes with the Highest Percentage of Population Employed in Arts, Entertainment & Recreation in Missoula
0.68%
4.8%
Zip Codes with the Highest Percentage of Population Employed in Arts, Entertainment & Recreation in Missoula, MT
| Zip Code | % Employed | vs State | vs National | |
| 1. | 59812 | 4.8% | 2.5%(+2.26)#36 | 2.1%(+2.68)#2,469 |
| 2. | 59808 | 3.5% | 2.5%(+0.964)#58 | 2.1%(+1.38)#4,212 |
| 3. | 59801 | 3.2% | 2.5%(+0.727)#65 | 2.1%(+1.14)#4,726 |
| 4. | 59802 | 3.1% | 2.5%(+0.645)#67 | 2.1%(+1.06)#4,939 |
| 5. | 59803 | 2.4% | 2.5%(-0.064)#89 | 2.1%(+0.353)#7,486 |
| 6. | 59804 | 0.68% | 2.5%(-1.82)#167 | 2.1%(-1.41)#19,305 |
1
Common Questions
What are the Top 5 Zip Codes with the Highest Percentage of Population Employed in Arts, Entertainment & Recreation in Missoula, MT?
Top 5 Zip Codes with the Highest Percentage of Population Employed in Arts, Entertainment & Recreation in Missoula, MT are:
What zip code has the Highest Percentage of Population Employed in Arts, Entertainment & Recreation in Missoula, MT?
59812 has the Highest Percentage of Population Employed in Arts, Entertainment & Recreation in Missoula, MT with 4.8%.
What is the Percentage of Population Employed in Arts, Entertainment & Recreation in Missoula, MT?
Percentage of Population Employed in Arts, Entertainment & Recreation in Missoula is 3.1%.
What is the Percentage of Population Employed in Arts, Entertainment & Recreation in Montana?
Percentage of Population Employed in Arts, Entertainment & Recreation in Montana is 2.5%.
What is the Percentage of Population Employed in Arts, Entertainment & Recreation in the United States?
Percentage of Population Employed in Arts, Entertainment & Recreation in the United States is 2.1%.