Zip Codes with the Highest Percentage of Local Government Employees in Missoula, MT
RELATED REPORTS & OPTIONS
Local Government Employees
Missoula
Compare Zip Codes
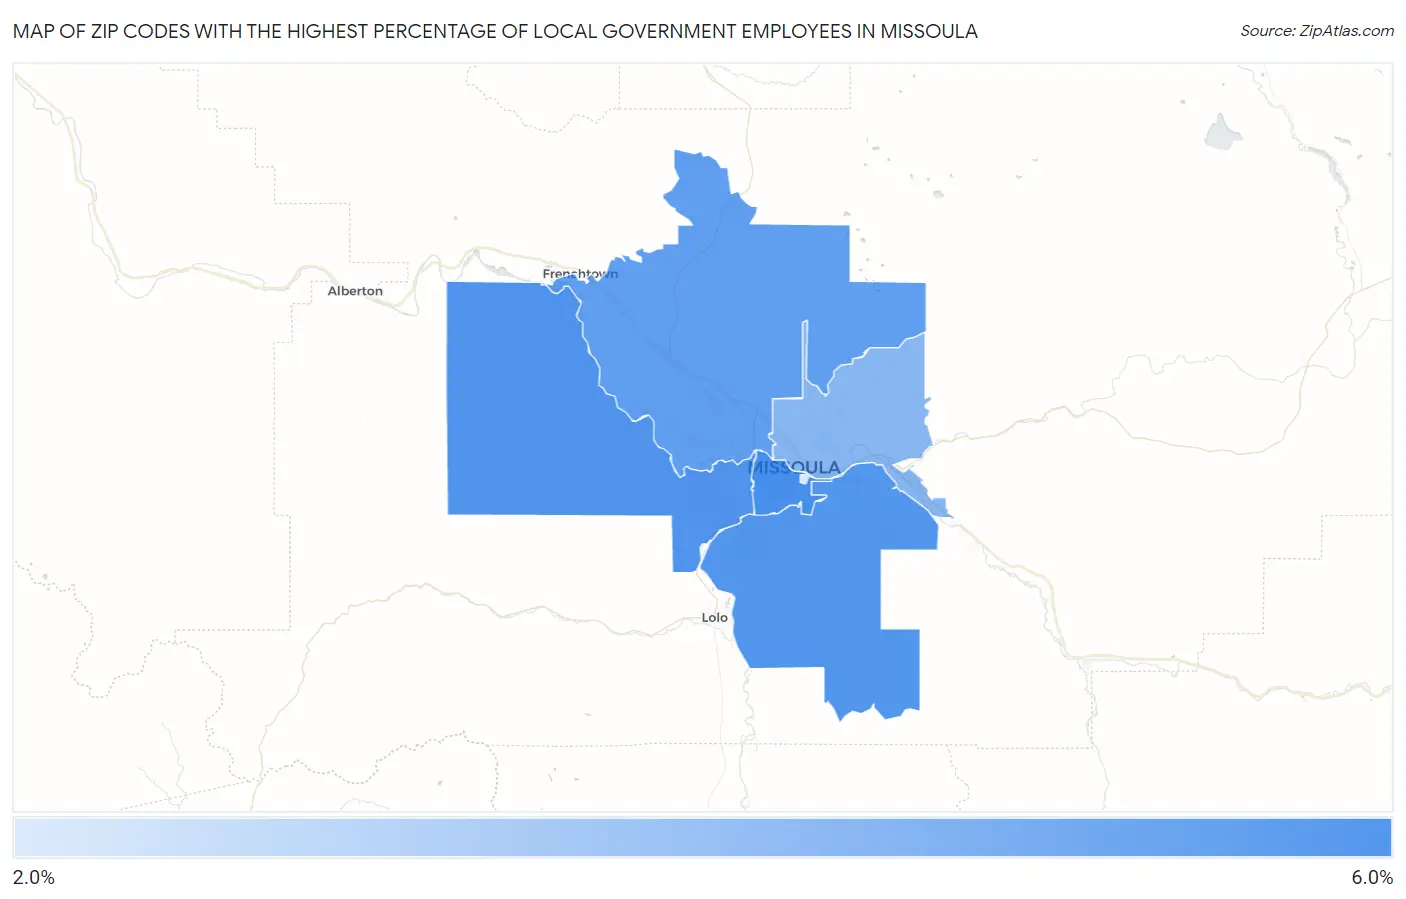
Map of Zip Codes with the Highest Percentage of Local Government Employees in Missoula
2.4%
5.9%
Zip Codes with the Highest Percentage of Local Government Employees in Missoula, MT
| Zip Code | % Local Government Employees | vs State | vs National | |
| 1. | 59801 | 5.9% | 7.3%(-1.44)#215 | 7.2%(-1.36)#20,238 |
| 2. | 59804 | 5.7% | 7.3%(-1.65)#222 | 7.2%(-1.57)#20,938 |
| 3. | 59803 | 5.6% | 7.3%(-1.69)#225 | 7.2%(-1.61)#21,087 |
| 4. | 59808 | 5.3% | 7.3%(-2.01)#229 | 7.2%(-1.93)#22,144 |
| 5. | 59802 | 4.4% | 7.3%(-2.94)#249 | 7.2%(-2.87)#24,803 |
| 6. | 59812 | 2.4% | 7.3%(-4.91)#282 | 7.2%(-4.83)#28,317 |
1
Common Questions
What are the Top 5 Zip Codes with the Highest Percentage of Local Government Employees in Missoula, MT?
Top 5 Zip Codes with the Highest Percentage of Local Government Employees in Missoula, MT are:
What zip code has the Highest Percentage of Local Government Employees in Missoula, MT?
59801 has the Highest Percentage of Local Government Employees in Missoula, MT with 5.9%.
What is the Percentage of Local Government Employees in Missoula, MT?
Percentage of Local Government Employees in Missoula is 5.4%.
What is the Percentage of Local Government Employees in Montana?
Percentage of Local Government Employees in Montana is 7.3%.
What is the Percentage of Local Government Employees in the United States?
Percentage of Local Government Employees in the United States is 7.2%.